Zip Codes with the Highest Percentage of Population Employed in Architecture & Engineering in Newport Beach, CA
RELATED REPORTS & OPTIONS
Architecture & Engineering
Newport Beach
Compare Zip Codes
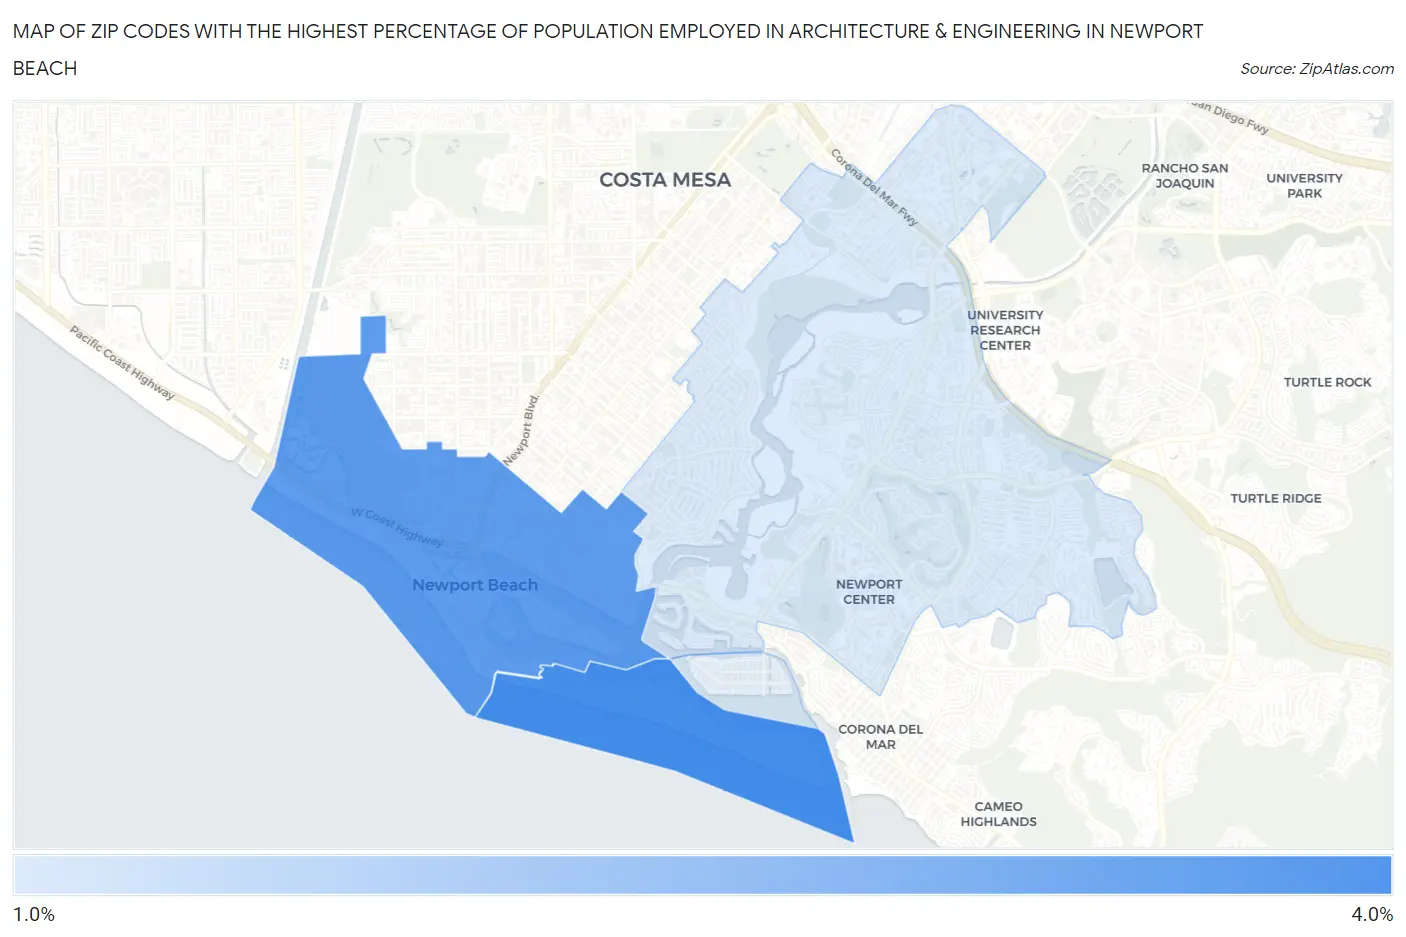
Map of Zip Codes with the Highest Percentage of Population Employed in Architecture & Engineering in Newport Beach
1.9%
3.2%
Zip Codes with the Highest Percentage of Population Employed in Architecture & Engineering in Newport Beach, CA
| Zip Code | % Employed | vs State | vs National | |
| 1. | 92661 | 3.2% | 2.6%(+0.679)#353 | 2.1%(+1.08)#4,375 |
| 2. | 92663 | 3.0% | 2.6%(+0.468)#388 | 2.1%(+0.873)#4,980 |
| 3. | 92660 | 1.9% | 2.6%(-0.658)#721 | 2.1%(-0.254)#10,278 |
1
Common Questions
What are the Top 3 Zip Codes with the Highest Percentage of Population Employed in Architecture & Engineering in Newport Beach, CA?
Top 3 Zip Codes with the Highest Percentage of Population Employed in Architecture & Engineering in Newport Beach, CA are:
What zip code has the Highest Percentage of Population Employed in Architecture & Engineering in Newport Beach, CA?
92661 has the Highest Percentage of Population Employed in Architecture & Engineering in Newport Beach, CA with 3.2%.
What is the Percentage of Population Employed in Architecture & Engineering in Newport Beach, CA?
Percentage of Population Employed in Architecture & Engineering in Newport Beach is 2.3%.
What is the Percentage of Population Employed in Architecture & Engineering in California?
Percentage of Population Employed in Architecture & Engineering in California is 2.6%.
What is the Percentage of Population Employed in Architecture & Engineering in the United States?
Percentage of Population Employed in Architecture & Engineering in the United States is 2.1%.