Stallion Springs, CA Map & Demographics
Stallion Springs Map
Stallion Springs Overview
$37,702
PER CAPITA INCOME
$75,380
AVG FAMILY INCOME
$71,765
AVG HOUSEHOLD INCOME
65.0%
WAGE / INCOME GAP [ % ]
35.0¢/ $1
WAGE / INCOME GAP [ $ ]
0.37
INEQUALITY / GINI INDEX
2,396
TOTAL POPULATION
1,240
MALE POPULATION
1,156
FEMALE POPULATION
107.27
MALES / 100 FEMALES
93.23
FEMALES / 100 MALES
58.5
MEDIAN AGE
2.7
AVG FAMILY SIZE
2.3
AVG HOUSEHOLD SIZE
772
LABOR FORCE [ PEOPLE ]
40.0%
PERCENT IN LABOR FORCE
3.7%
UNEMPLOYMENT RATE
Stallion Springs Area Codes
Income in Stallion Springs
Income Overview in Stallion Springs
Per Capita Income in Stallion Springs is $37,702, while median incomes of families and households are $75,380 and $71,765 respectively.
| Characteristic | Number | Measure |
| Per Capita Income | 2,396 | $37,702 |
| Median Family Income | 688 | $75,380 |
| Mean Family Income | 688 | $91,798 |
| Median Household Income | 1,052 | $71,765 |
| Mean Household Income | 1,052 | $84,462 |
| Income Deficit | 688 | $0 |
| Wage / Income Gap (%) | 2,396 | 65.01% |
| Wage / Income Gap ($) | 2,396 | 34.99¢ per $1 |
| Gini / Inequality Index | 2,396 | 0.37 |
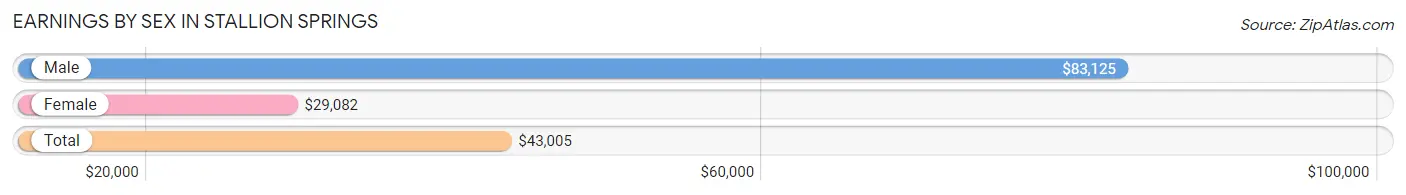
Earnings by Sex in Stallion Springs
Average Earnings in Stallion Springs are $43,005, $83,125 for men and $29,082 for women, a difference of 65.0%.
| Sex | Number | Average Earnings |
| Male | 419 (52.8%) | $83,125 |
| Female | 374 (47.2%) | $29,082 |
| Total | 793 (100.0%) | $43,005 |
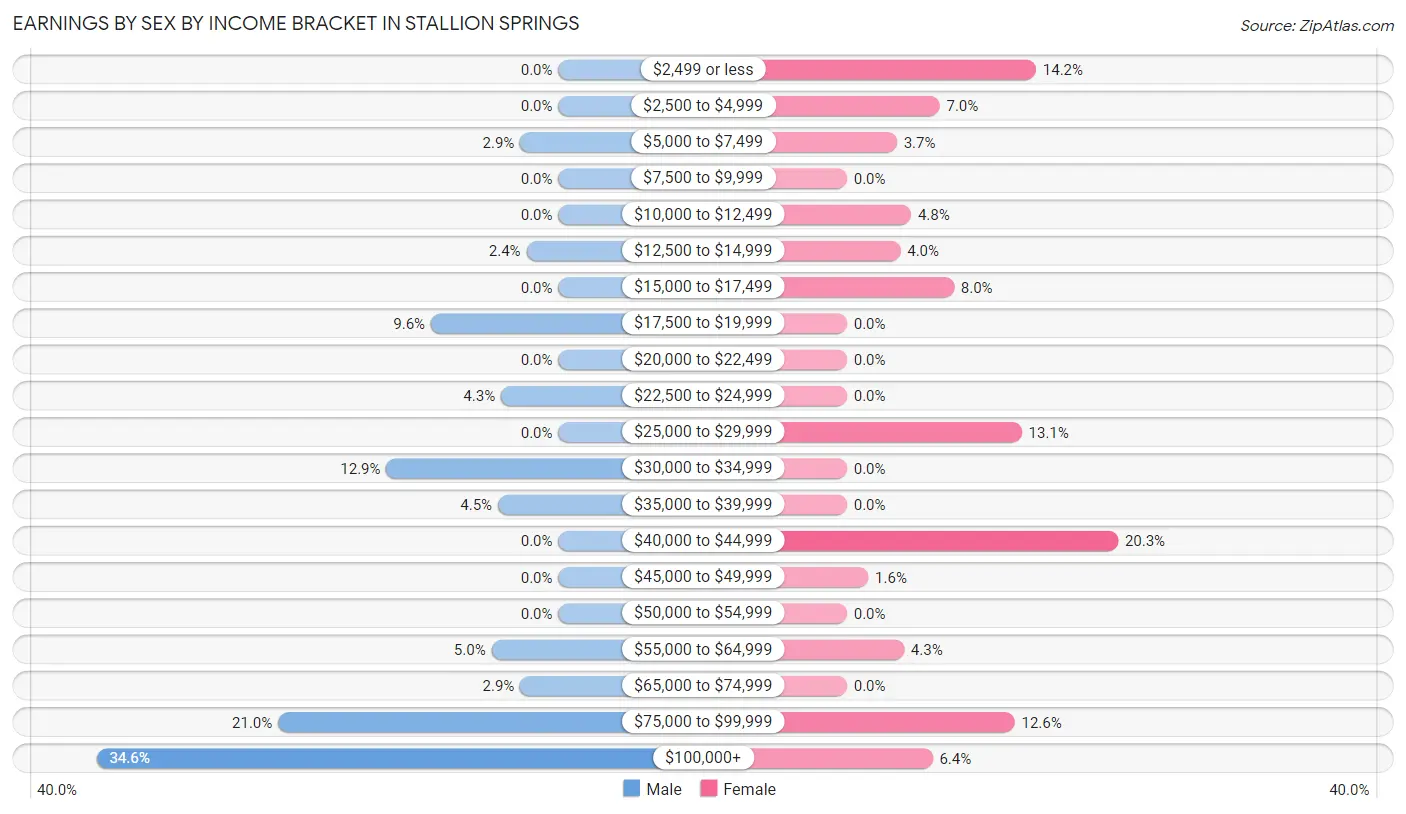
Earnings by Sex by Income Bracket in Stallion Springs
The most common earnings brackets in Stallion Springs are $100,000+ for men (145 | 34.6%) and $40,000 to $44,999 for women (76 | 20.3%).
| Income | Male | Female |
| $2,499 or less | 0 (0.0%) | 53 (14.2%) |
| $2,500 to $4,999 | 0 (0.0%) | 26 (7.0%) |
| $5,000 to $7,499 | 12 (2.9%) | 14 (3.7%) |
| $7,500 to $9,999 | 0 (0.0%) | 0 (0.0%) |
| $10,000 to $12,499 | 0 (0.0%) | 18 (4.8%) |
| $12,500 to $14,999 | 10 (2.4%) | 15 (4.0%) |
| $15,000 to $17,499 | 0 (0.0%) | 30 (8.0%) |
| $17,500 to $19,999 | 40 (9.6%) | 0 (0.0%) |
| $20,000 to $22,499 | 0 (0.0%) | 0 (0.0%) |
| $22,500 to $24,999 | 18 (4.3%) | 0 (0.0%) |
| $25,000 to $29,999 | 0 (0.0%) | 49 (13.1%) |
| $30,000 to $34,999 | 54 (12.9%) | 0 (0.0%) |
| $35,000 to $39,999 | 19 (4.5%) | 0 (0.0%) |
| $40,000 to $44,999 | 0 (0.0%) | 76 (20.3%) |
| $45,000 to $49,999 | 0 (0.0%) | 6 (1.6%) |
| $50,000 to $54,999 | 0 (0.0%) | 0 (0.0%) |
| $55,000 to $64,999 | 21 (5.0%) | 16 (4.3%) |
| $65,000 to $74,999 | 12 (2.9%) | 0 (0.0%) |
| $75,000 to $99,999 | 88 (21.0%) | 47 (12.6%) |
| $100,000+ | 145 (34.6%) | 24 (6.4%) |
| Total | 419 (100.0%) | 374 (100.0%) |
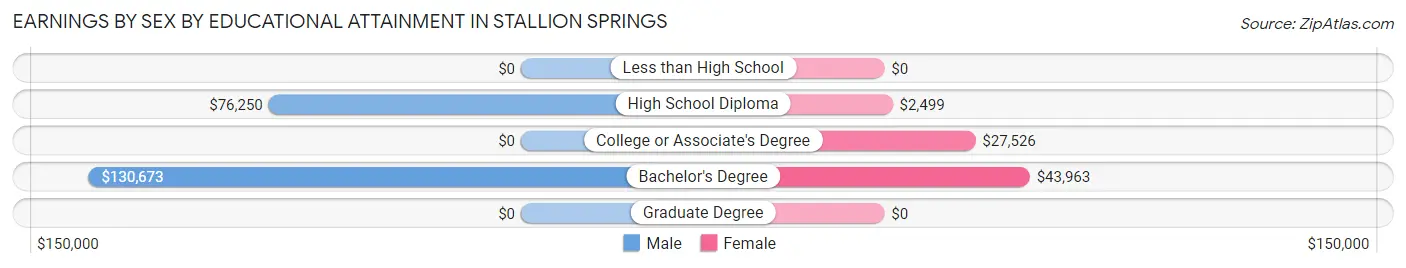
Earnings by Sex by Educational Attainment in Stallion Springs
Average earnings in Stallion Springs are $84,625 for men and $29,082 for women, a difference of 65.6%. Men with an educational attainment of bachelor's degree enjoy the highest average annual earnings of $130,673, while those with high school diploma education earn the least with $76,250. Women with an educational attainment of bachelor's degree earn the most with the average annual earnings of $43,963, while those with high school diploma education have the smallest earnings of $2,499.
| Educational Attainment | Male Income | Female Income |
| Less than High School | - | - |
| High School Diploma | $76,250 | $2,499 |
| College or Associate's Degree | - | - |
| Bachelor's Degree | $130,673 | $43,963 |
| Graduate Degree | - | - |
| Total | $84,625 | $29,082 |
Family Income in Stallion Springs
Family Income Brackets in Stallion Springs
According to the Stallion Springs family income data, there are 155 families falling into the $50,000 to $74,999 income range, which is the most common income bracket and makes up 22.5% of all families.
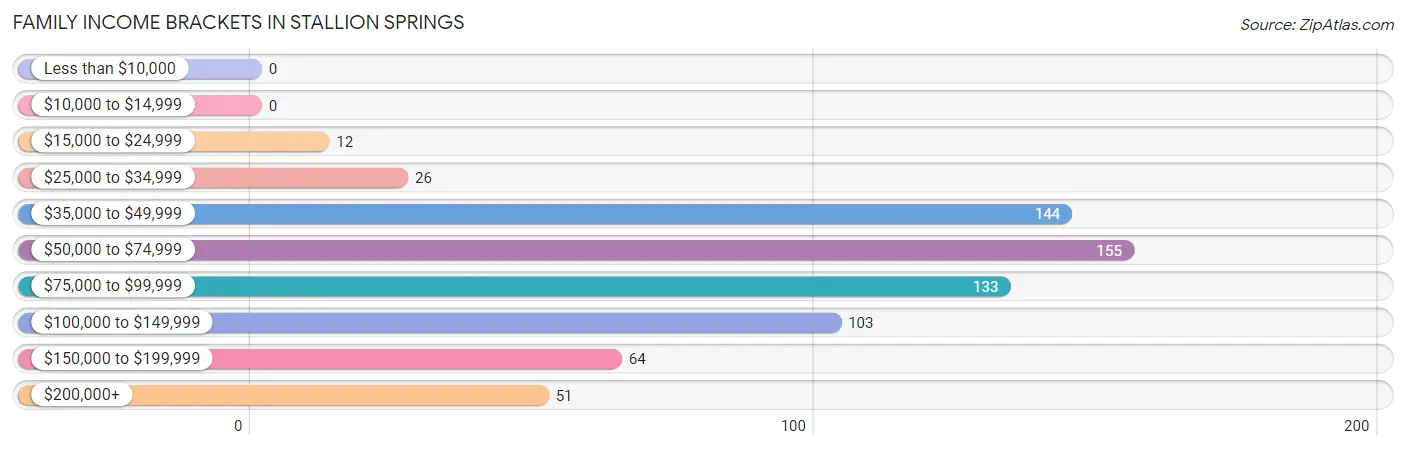
| Income Bracket | # Families | % Families |
| Less than $10,000 | 0 | 0.0% |
| $10,000 to $14,999 | 0 | 0.0% |
| $15,000 to $24,999 | 12 | 1.7% |
| $25,000 to $34,999 | 26 | 3.8% |
| $35,000 to $49,999 | 144 | 20.9% |
| $50,000 to $74,999 | 155 | 22.5% |
| $75,000 to $99,999 | 133 | 19.3% |
| $100,000 to $149,999 | 103 | 15.0% |
| $150,000 to $199,999 | 64 | 9.3% |
| $200,000+ | 51 | 7.4% |
Family Income by Famaliy Size in Stallion Springs
3-person families (27 | 3.9%) account for the highest median family income in Stallion Springs with $189,821 per family, while 3-person families (27 | 3.9%) have the highest median income of $63,274 per family member.
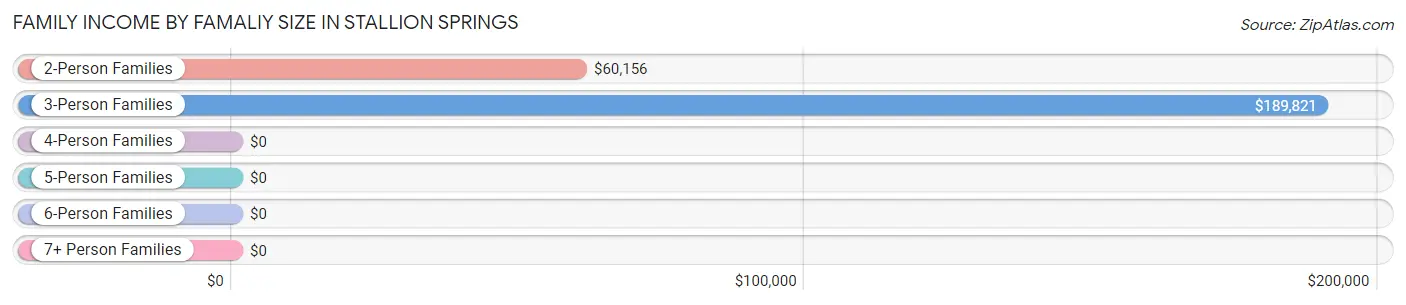
| Income Bracket | # Families | Median Income |
| 2-Person Families | 517 (75.1%) | $60,156 |
| 3-Person Families | 27 (3.9%) | $189,821 |
| 4-Person Families | 34 (4.9%) | $0 |
| 5-Person Families | 110 (16.0%) | $0 |
| 6-Person Families | 0 (0.0%) | $0 |
| 7+ Person Families | 0 (0.0%) | $0 |
| Total | 688 (100.0%) | $75,380 |
Family Income by Number of Earners in Stallion Springs
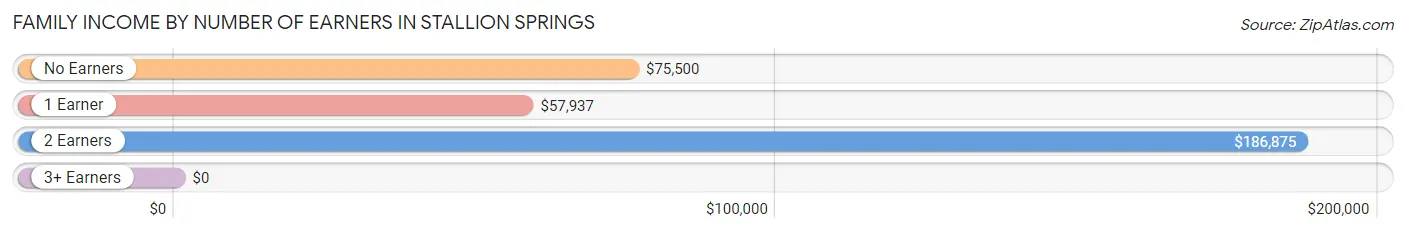
| Number of Earners | # Families | Median Income |
| No Earners | 256 (37.2%) | $75,500 |
| 1 Earner | 324 (47.1%) | $57,937 |
| 2 Earners | 88 (12.8%) | $186,875 |
| 3+ Earners | 20 (2.9%) | $0 |
| Total | 688 (100.0%) | $75,380 |
Household Income in Stallion Springs
Household Income Brackets in Stallion Springs
With 227 households falling in the category, the $35,000 to $49,999 income range is the most frequent in Stallion Springs, accounting for 21.6% of all households.
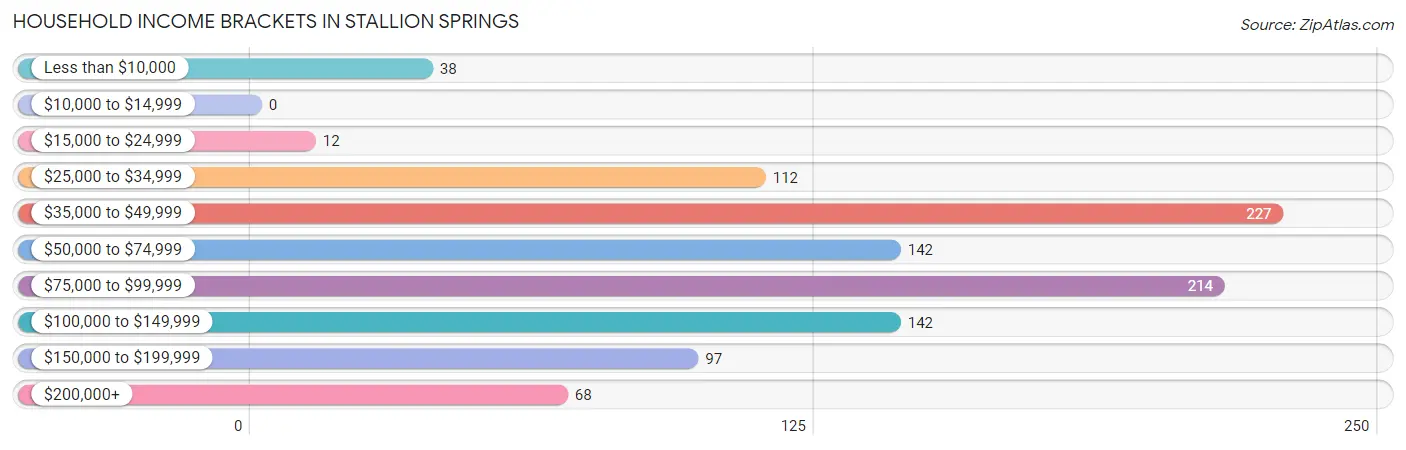
| Income Bracket | # Households | % Households |
| Less than $10,000 | 38 | 3.6% |
| $10,000 to $14,999 | 0 | 0.0% |
| $15,000 to $24,999 | 12 | 1.1% |
| $25,000 to $34,999 | 112 | 10.6% |
| $35,000 to $49,999 | 227 | 21.6% |
| $50,000 to $74,999 | 142 | 13.5% |
| $75,000 to $99,999 | 214 | 20.3% |
| $100,000 to $149,999 | 142 | 13.5% |
| $150,000 to $199,999 | 97 | 9.2% |
| $200,000+ | 68 | 6.5% |
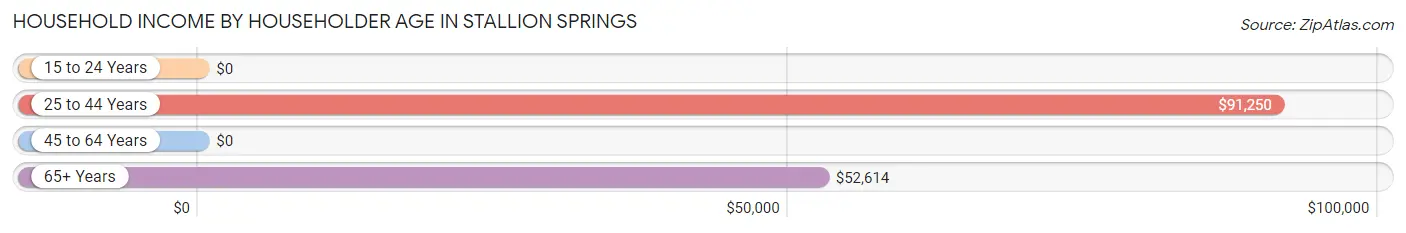
Household Income by Householder Age in Stallion Springs
The median household income in Stallion Springs is $71,765, with the highest median household income of $91,250 found in the 25 to 44 years age bracket for the primary householder. A total of 208 households (19.8%) fall into this category.
| Income Bracket | # Households | Median Income |
| 15 to 24 Years | 0 (0.0%) | $0 |
| 25 to 44 Years | 208 (19.8%) | $91,250 |
| 45 to 64 Years | 419 (39.8%) | $0 |
| 65+ Years | 425 (40.4%) | $52,614 |
| Total | 1,052 (100.0%) | $71,765 |
Poverty in Stallion Springs
Income Below Poverty by Sex and Age in Stallion Springs
With 1.5% poverty level for males and 9.6% for females among the residents of Stallion Springs, 45 to 54 year old males and 16 and 17 year old females are the most vulnerable to poverty, with 19 males (23.7%) and 19 females (100.0%) in their respective age groups living below the poverty level.
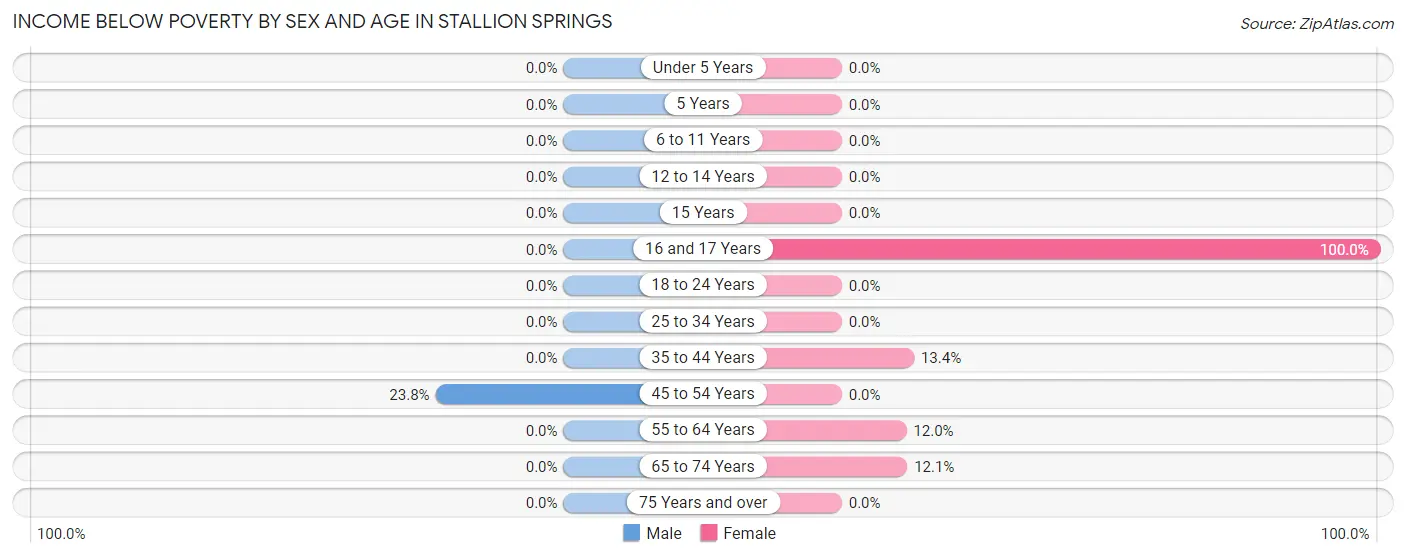
| Age Bracket | Male | Female |
| Under 5 Years | 0 (0.0%) | 0 (0.0%) |
| 5 Years | 0 (0.0%) | 0 (0.0%) |
| 6 to 11 Years | 0 (0.0%) | 0 (0.0%) |
| 12 to 14 Years | 0 (0.0%) | 0 (0.0%) |
| 15 Years | 0 (0.0%) | 0 (0.0%) |
| 16 and 17 Years | 0 (0.0%) | 19 (100.0%) |
| 18 to 24 Years | 0 (0.0%) | 0 (0.0%) |
| 25 to 34 Years | 0 (0.0%) | 0 (0.0%) |
| 35 to 44 Years | 0 (0.0%) | 28 (13.4%) |
| 45 to 54 Years | 19 (23.7%) | 0 (0.0%) |
| 55 to 64 Years | 0 (0.0%) | 30 (12.0%) |
| 65 to 74 Years | 0 (0.0%) | 34 (12.1%) |
| 75 Years and over | 0 (0.0%) | 0 (0.0%) |
| Total | 19 (1.5%) | 111 (9.6%) |
Income Above Poverty by Sex and Age in Stallion Springs
According to the poverty statistics in Stallion Springs, males aged under 5 years and females aged under 5 years are the age groups that are most secure financially, with 100.0% of males and 100.0% of females in these age groups living above the poverty line.
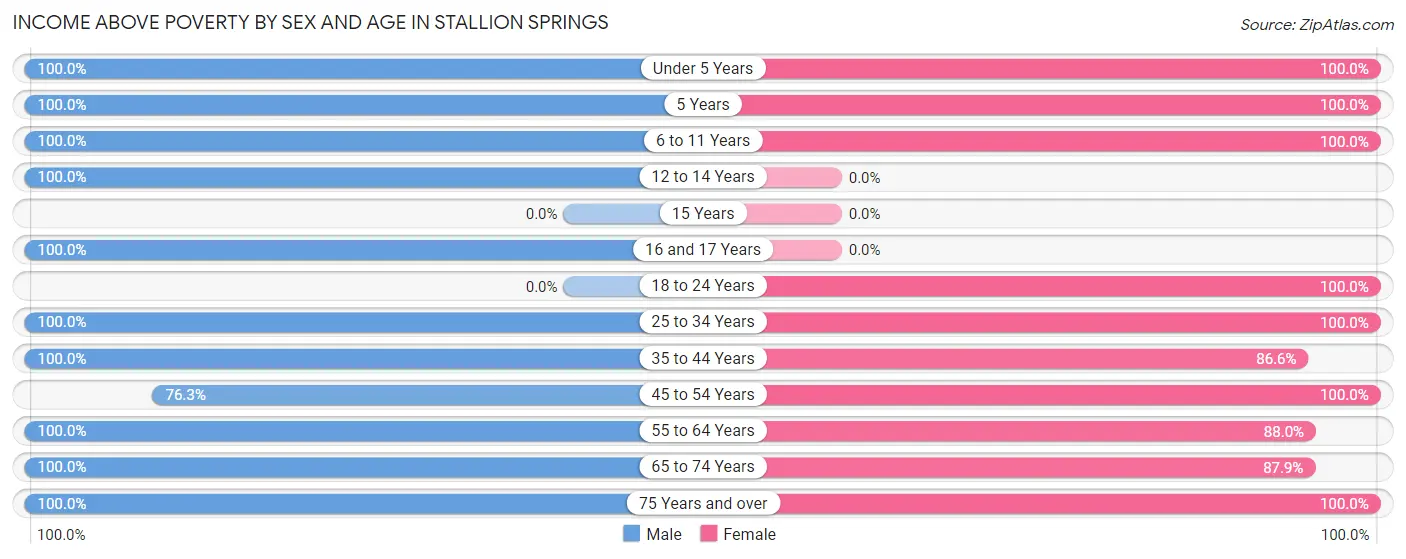
| Age Bracket | Male | Female |
| Under 5 Years | 59 (100.0%) | 9 (100.0%) |
| 5 Years | 10 (100.0%) | 17 (100.0%) |
| 6 to 11 Years | 226 (100.0%) | 129 (100.0%) |
| 12 to 14 Years | 17 (100.0%) | 0 (0.0%) |
| 15 Years | 0 (0.0%) | 0 (0.0%) |
| 16 and 17 Years | 12 (100.0%) | 0 (0.0%) |
| 18 to 24 Years | 0 (0.0%) | 19 (100.0%) |
| 25 to 34 Years | 54 (100.0%) | 92 (100.0%) |
| 35 to 44 Years | 149 (100.0%) | 181 (86.6%) |
| 45 to 54 Years | 61 (76.2%) | 15 (100.0%) |
| 55 to 64 Years | 271 (100.0%) | 220 (88.0%) |
| 65 to 74 Years | 237 (100.0%) | 246 (87.9%) |
| 75 Years and over | 125 (100.0%) | 117 (100.0%) |
| Total | 1,221 (98.5%) | 1,045 (90.4%) |
Income Below Poverty Among Married-Couple Families in Stallion Springs
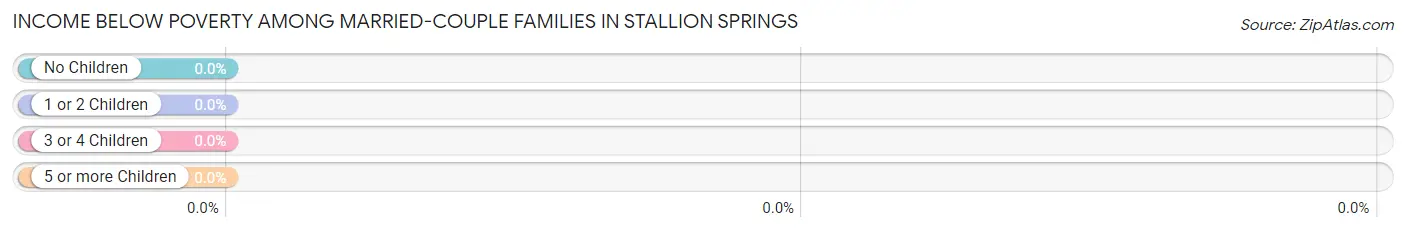
| Children | Above Poverty | Below Poverty |
| No Children | 411 (100.0%) | 0 (0.0%) |
| 1 or 2 Children | 108 (100.0%) | 0 (0.0%) |
| 3 or 4 Children | 56 (100.0%) | 0 (0.0%) |
| 5 or more Children | 0 (0.0%) | 0 (0.0%) |
| Total | 575 (100.0%) | 0 (0.0%) |
Income Below Poverty Among Single-Parent Households in Stallion Springs
| Children | Single Father | Single Mother |
| No Children | 0 (0.0%) | 0 (0.0%) |
| 1 or 2 Children | 0 (0.0%) | 0 (0.0%) |
| 3 or 4 Children | 0 (0.0%) | 0 (0.0%) |
| 5 or more Children | 0 (0.0%) | 0 (0.0%) |
| Total | 0 (0.0%) | 0 (0.0%) |
Income Below Poverty Among Married-Couple vs Single-Parent Households in Stallion Springs
| Children | Married-Couple Families | Single-Parent Households |
| No Children | 0 (0.0%) | 0 (0.0%) |
| 1 or 2 Children | 0 (0.0%) | 0 (0.0%) |
| 3 or 4 Children | 0 (0.0%) | 0 (0.0%) |
| 5 or more Children | 0 (0.0%) | 0 (0.0%) |
| Total | 0 (0.0%) | 0 (0.0%) |
Race in Stallion Springs
The most populous races in Stallion Springs are White / Caucasian (2,096 | 87.5%), Two or more Races (259 | 10.8%), and Hispanic or Latino (193 | 8.1%).
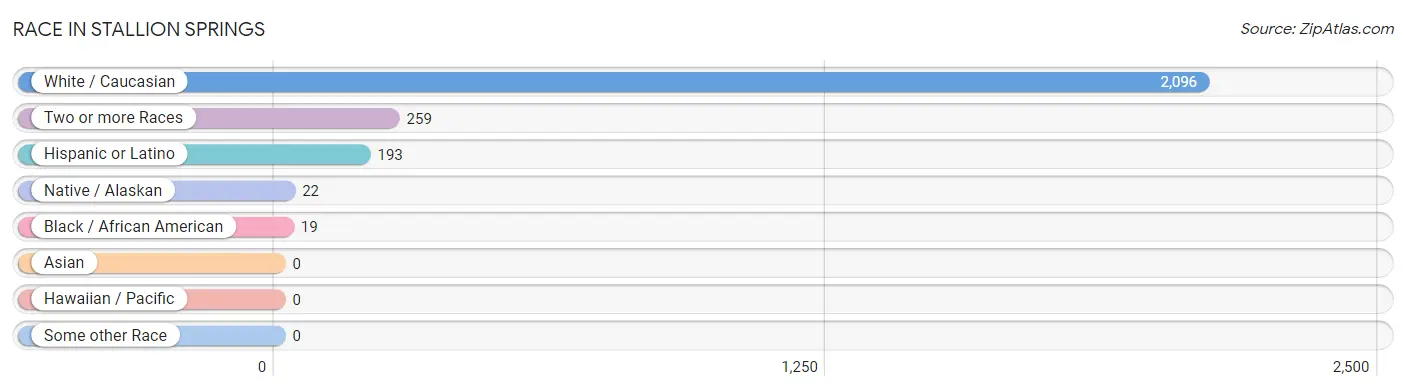
| Race | # Population | % Population |
| Asian | 0 | 0.0% |
| Black / African American | 19 | 0.8% |
| Hawaiian / Pacific | 0 | 0.0% |
| Hispanic or Latino | 193 | 8.1% |
| Native / Alaskan | 22 | 0.9% |
| White / Caucasian | 2,096 | 87.5% |
| Two or more Races | 259 | 10.8% |
| Some other Race | 0 | 0.0% |
| Total | 2,396 | 100.0% |
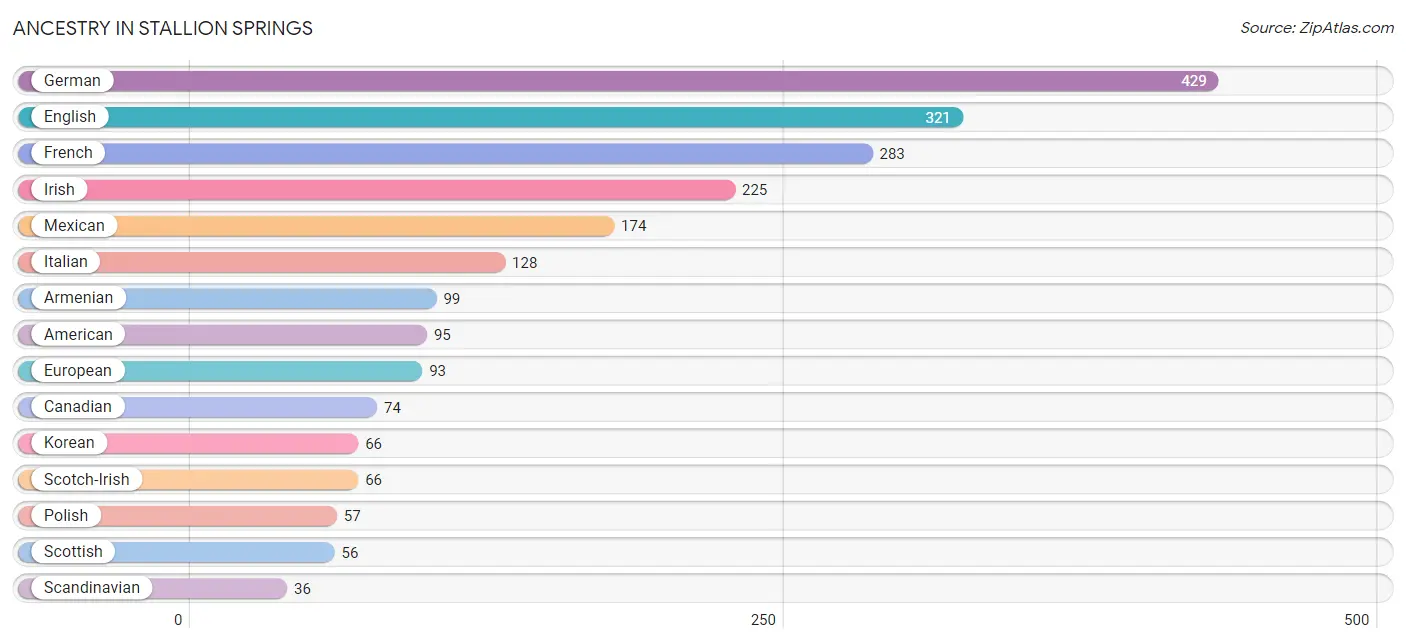
Ancestry in Stallion Springs
The most populous ancestries reported in Stallion Springs are German (429 | 17.9%), English (321 | 13.4%), French (283 | 11.8%), Irish (225 | 9.4%), and Mexican (174 | 7.3%), together accounting for 59.8% of all Stallion Springs residents.
| Ancestry | # Population | % Population |
| Albanian | 25 | 1.0% |
| American | 95 | 4.0% |
| Armenian | 99 | 4.1% |
| Austrian | 18 | 0.7% |
| British | 14 | 0.6% |
| Canadian | 74 | 3.1% |
| Central American | 19 | 0.8% |
| Cherokee | 30 | 1.3% |
| Choctaw | 9 | 0.4% |
| Costa Rican | 19 | 0.8% |
| Croatian | 32 | 1.3% |
| Danish | 10 | 0.4% |
| Dutch | 29 | 1.2% |
| English | 321 | 13.4% |
| European | 93 | 3.9% |
| French | 283 | 11.8% |
| German | 429 | 17.9% |
| Greek | 11 | 0.5% |
| Irish | 225 | 9.4% |
| Italian | 128 | 5.3% |
| Korean | 66 | 2.8% |
| Mexican | 174 | 7.3% |
| Norwegian | 15 | 0.6% |
| Polish | 57 | 2.4% |
| Russian | 19 | 0.8% |
| Scandinavian | 36 | 1.5% |
| Scotch-Irish | 66 | 2.8% |
| Scottish | 56 | 2.3% |
| Slovene | 18 | 0.7% |
| Thai | 14 | 0.6% | View All 30 Rows |
Immigrants in Stallion Springs
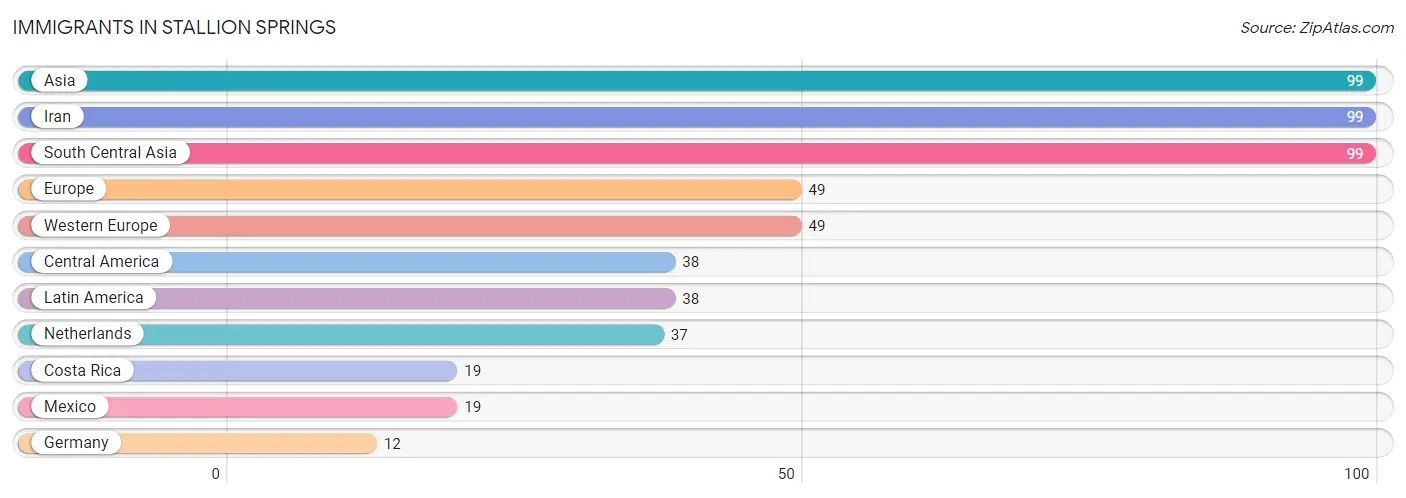
The most numerous immigrant groups reported in Stallion Springs came from Asia (99 | 4.1%), Iran (99 | 4.1%), South Central Asia (99 | 4.1%), Europe (49 | 2.1%), and Western Europe (49 | 2.1%), together accounting for 16.5% of all Stallion Springs residents.
| Immigration Origin | # Population | % Population |
| Asia | 99 | 4.1% |
| Central America | 38 | 1.6% |
| Costa Rica | 19 | 0.8% |
| Europe | 49 | 2.1% |
| Germany | 12 | 0.5% |
| Iran | 99 | 4.1% |
| Latin America | 38 | 1.6% |
| Mexico | 19 | 0.8% |
| Netherlands | 37 | 1.5% |
| South Central Asia | 99 | 4.1% |
| Western Europe | 49 | 2.1% | View All 11 Rows |
Sex and Age in Stallion Springs
Sex and Age in Stallion Springs
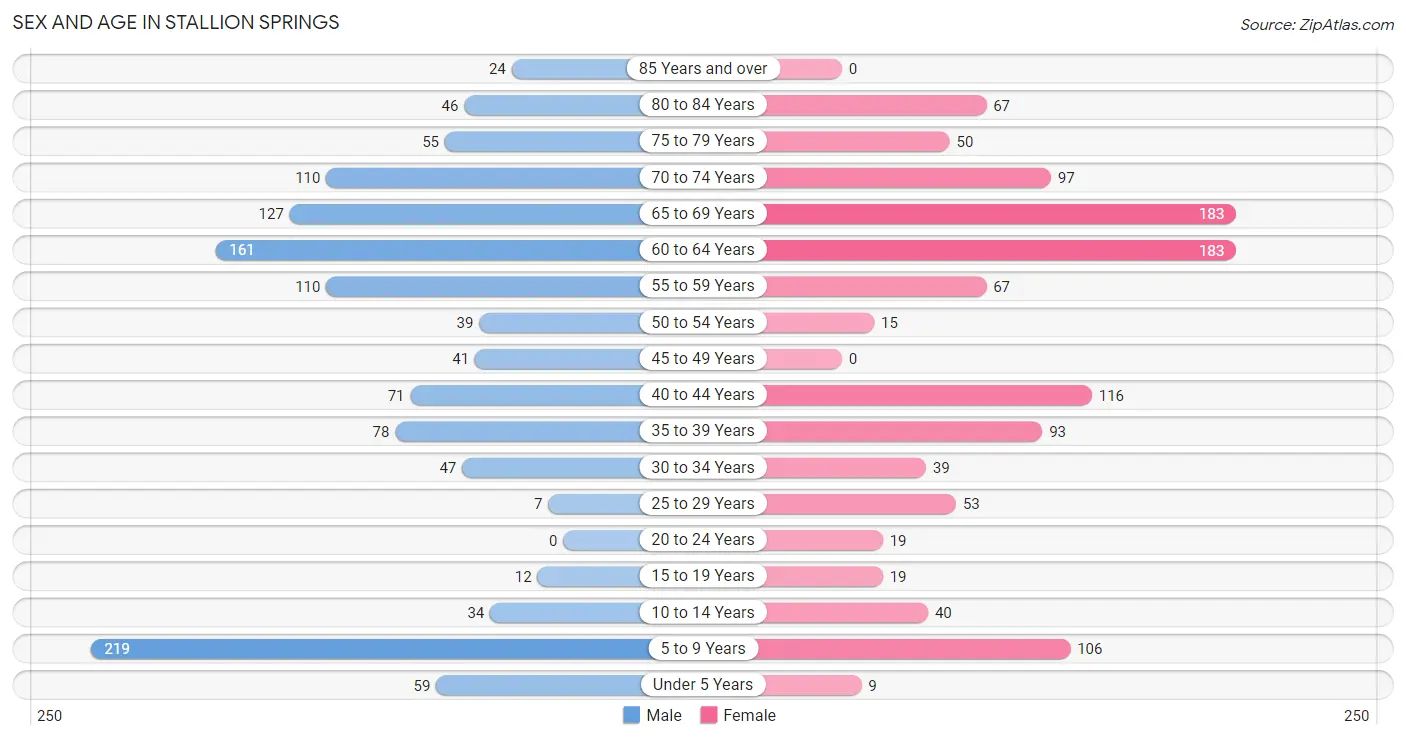
The most populous age groups in Stallion Springs are 5 to 9 Years (219 | 17.7%) for men and 60 to 64 Years (183 | 15.8%) for women.
| Age Bracket | Male | Female |
| Under 5 Years | 59 (4.8%) | 9 (0.8%) |
| 5 to 9 Years | 219 (17.7%) | 106 (9.2%) |
| 10 to 14 Years | 34 (2.7%) | 40 (3.5%) |
| 15 to 19 Years | 12 (1.0%) | 19 (1.6%) |
| 20 to 24 Years | 0 (0.0%) | 19 (1.6%) |
| 25 to 29 Years | 7 (0.6%) | 53 (4.6%) |
| 30 to 34 Years | 47 (3.8%) | 39 (3.4%) |
| 35 to 39 Years | 78 (6.3%) | 93 (8.0%) |
| 40 to 44 Years | 71 (5.7%) | 116 (10.0%) |
| 45 to 49 Years | 41 (3.3%) | 0 (0.0%) |
| 50 to 54 Years | 39 (3.2%) | 15 (1.3%) |
| 55 to 59 Years | 110 (8.9%) | 67 (5.8%) |
| 60 to 64 Years | 161 (13.0%) | 183 (15.8%) |
| 65 to 69 Years | 127 (10.2%) | 183 (15.8%) |
| 70 to 74 Years | 110 (8.9%) | 97 (8.4%) |
| 75 to 79 Years | 55 (4.4%) | 50 (4.3%) |
| 80 to 84 Years | 46 (3.7%) | 67 (5.8%) |
| 85 Years and over | 24 (1.9%) | 0 (0.0%) |
| Total | 1,240 (100.0%) | 1,156 (100.0%) |
Families and Households in Stallion Springs
Median Family Size in Stallion Springs
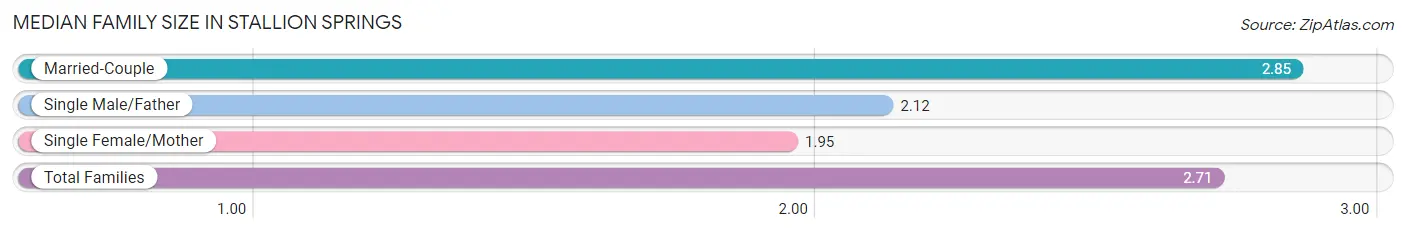
The median family size in Stallion Springs is 2.71 persons per family, with married-couple families (575 | 83.6%) accounting for the largest median family size of 2.85 persons per family. On the other hand, single female/mother families (63 | 9.2%) represent the smallest median family size with 1.95 persons per family.
| Family Type | # Families | Family Size |
| Married-Couple | 575 (83.6%) | 2.85 |
| Single Male/Father | 50 (7.3%) | 2.12 |
| Single Female/Mother | 63 (9.2%) | 1.95 |
| Total Families | 688 (100.0%) | 2.71 |
Median Household Size in Stallion Springs
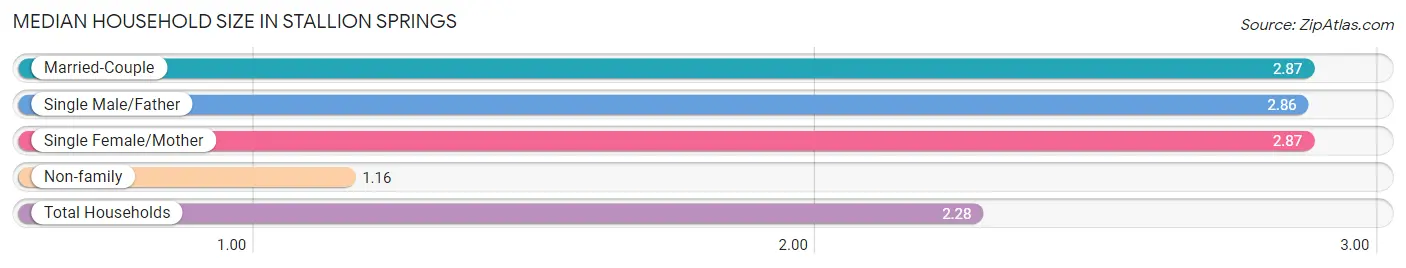
The median household size in Stallion Springs is 2.28 persons per household, with married-couple households (575 | 54.7%) accounting for the largest median household size of 2.87 persons per household. non-family households (364 | 34.6%) represent the smallest median household size with 1.16 persons per household.
| Household Type | # Households | Household Size |
| Married-Couple | 575 (54.7%) | 2.87 |
| Single Male/Father | 50 (4.8%) | 2.86 |
| Single Female/Mother | 63 (6.0%) | 2.87 |
| Non-family | 364 (34.6%) | 1.16 |
| Total Households | 1,052 (100.0%) | 2.28 |
Household Size by Marriage Status in Stallion Springs
Out of a total of 1,052 households in Stallion Springs, 688 (65.4%) are family households, while 364 (34.6%) are nonfamily households. The most numerous type of family households are 2-person households, comprising 421, and the most common type of nonfamily households are 1-person households, comprising 305.
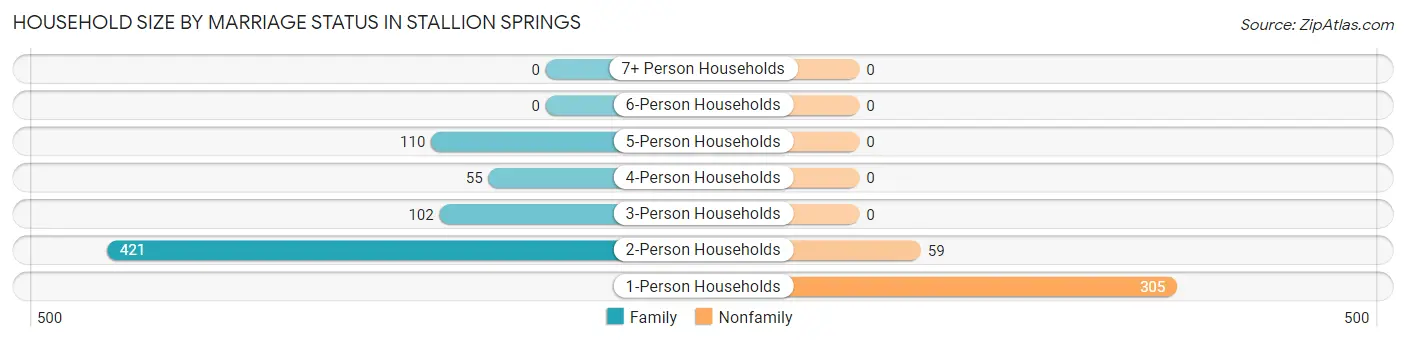
| Household Size | Family Households | Nonfamily Households |
| 1-Person Households | - | 305 (29.0%) |
| 2-Person Households | 421 (40.0%) | 59 (5.6%) |
| 3-Person Households | 102 (9.7%) | 0 (0.0%) |
| 4-Person Households | 55 (5.2%) | 0 (0.0%) |
| 5-Person Households | 110 (10.5%) | 0 (0.0%) |
| 6-Person Households | 0 (0.0%) | 0 (0.0%) |
| 7+ Person Households | 0 (0.0%) | 0 (0.0%) |
| Total | 688 (65.4%) | 364 (34.6%) |
Female Fertility in Stallion Springs
Fertility by Age in Stallion Springs
| Age Bracket | Women with Births | Births / 1,000 Women |
| 15 to 19 years | 0 (0.0%) | 0.0 |
| 20 to 34 years | 0 (0.0%) | 0.0 |
| 35 to 50 years | 0 (0.0%) | 0.0 |
| Total | 0 (0.0%) | 0.0 |
Fertility by Age by Marriage Status in Stallion Springs
| Age Bracket | Married | Unmarried |
| 15 to 19 years | 0 (0.0%) | 0 (0.0%) |
| 20 to 34 years | 0 (0.0%) | 0 (0.0%) |
| 35 to 50 years | 0 (0.0%) | 0 (0.0%) |
| Total | 0 (0.0%) | 0 (0.0%) |
Fertility by Education in Stallion Springs
| Educational Attainment | Women with Births | Births / 1,000 Women |
| Less than High School | 0 (0.0%) | 0.0 |
| High School Diploma | 0 (0.0%) | 0.0 |
| College or Associate's Degree | 0 (0.0%) | 0.0 |
| Bachelor's Degree | 0 (0.0%) | 0.0 |
| Graduate Degree | 0 (0.0%) | 0.0 |
| Total | 0 (0.0%) | 0.0 |
Fertility by Education by Marriage Status in Stallion Springs
| Educational Attainment | Married | Unmarried |
| Less than High School | 0 (0.0%) | 0 (0.0%) |
| High School Diploma | 0 (0.0%) | 0 (0.0%) |
| College or Associate's Degree | 0 (0.0%) | 0 (0.0%) |
| Bachelor's Degree | 0 (0.0%) | 0 (0.0%) |
| Graduate Degree | 0 (0.0%) | 0 (0.0%) |
| Total | 0 (0.0%) | 0 (0.0%) |
Employment Characteristics in Stallion Springs
Employment by Class of Employer in Stallion Springs
Among the 744 employed individuals in Stallion Springs, private company employees (350 | 47.0%), not-for-profit organizations (104 | 14.0%), and state government employees (101 | 13.6%) make up the most common classes of employment.
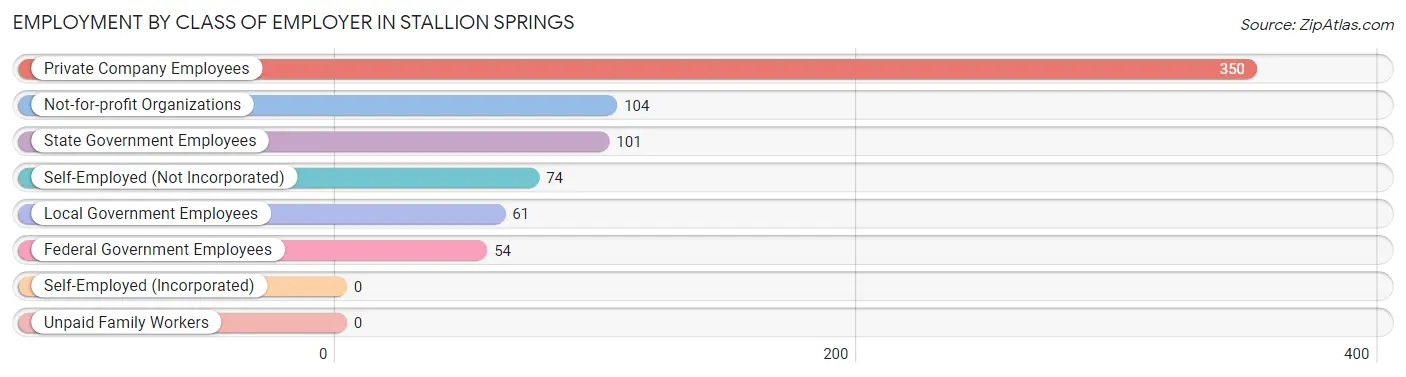
| Employer Class | # Employees | % Employees |
| Private Company Employees | 350 | 47.0% |
| Self-Employed (Incorporated) | 0 | 0.0% |
| Self-Employed (Not Incorporated) | 74 | 10.0% |
| Not-for-profit Organizations | 104 | 14.0% |
| Local Government Employees | 61 | 8.2% |
| State Government Employees | 101 | 13.6% |
| Federal Government Employees | 54 | 7.3% |
| Unpaid Family Workers | 0 | 0.0% |
| Total | 744 | 100.0% |
Employment Status by Age in Stallion Springs
According to the labor force statistics for Stallion Springs, out of the total population over 16 years of age (1,929), 40.0% or 772 individuals are in the labor force, with 3.7% or 29 of them unemployed. The age group with the highest labor force participation rate is 25 to 29 years, with 100.0% or 60 individuals in the labor force. Within the labor force, the 65 to 74 years age range has the highest percentage of unemployed individuals, with 14.1% or 18 of them being unemployed.
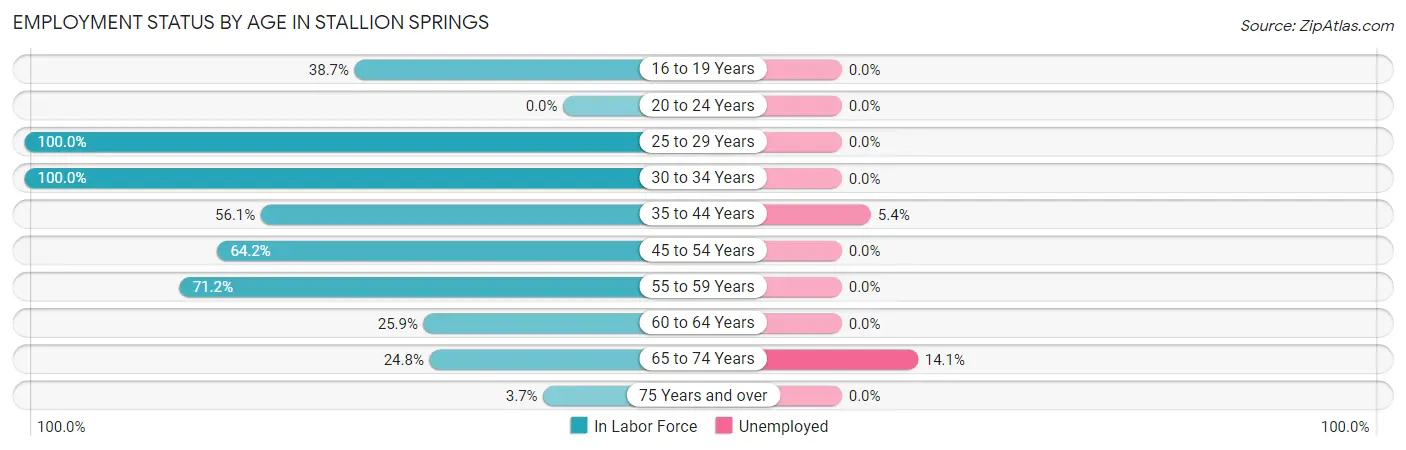
| Age Bracket | In Labor Force | Unemployed |
| 16 to 19 Years | 12 (38.7%) | 0 (0.0%) |
| 20 to 24 Years | 0 (0.0%) | 0 (0.0%) |
| 25 to 29 Years | 60 (100.0%) | 0 (0.0%) |
| 30 to 34 Years | 86 (100.0%) | 0 (0.0%) |
| 35 to 44 Years | 201 (56.1%) | 11 (5.4%) |
| 45 to 54 Years | 61 (64.2%) | 0 (0.0%) |
| 55 to 59 Years | 126 (71.2%) | 0 (0.0%) |
| 60 to 64 Years | 89 (25.9%) | 0 (0.0%) |
| 65 to 74 Years | 128 (24.8%) | 18 (14.1%) |
| 75 Years and over | 9 (3.7%) | 0 (0.0%) |
| Total | 772 (40.0%) | 29 (3.7%) |
Employment Status by Educational Attainment in Stallion Springs
According to labor force statistics for Stallion Springs, 55.6% of individuals (623) out of the total population between 25 and 64 years of age (1,120) are in the labor force, with 1.6% or 10 of them being unemployed. The group with the highest labor force participation rate are those with the educational attainment of bachelor's degree or higher, with 88.6% or 234 individuals in the labor force. Within the labor force, individuals with high school diploma education have the highest percentage of unemployment, with 17.2% or 10 of them being unemployed.
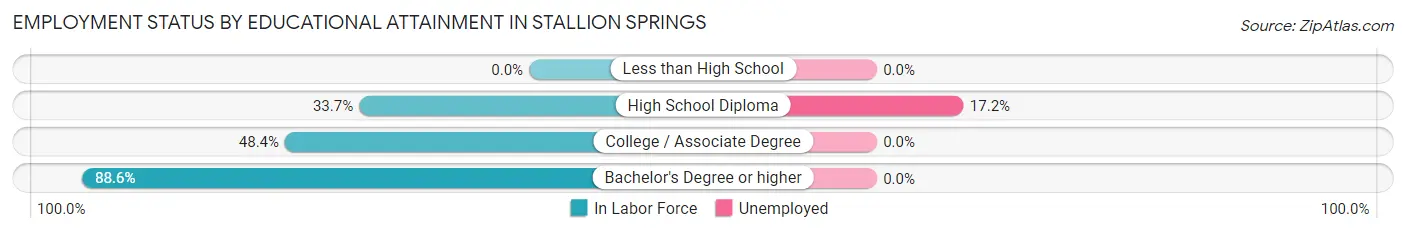
| Educational Attainment | In Labor Force | Unemployed |
| Less than High School | 0 (0.0%) | 0 (0.0%) |
| High School Diploma | 58 (33.7%) | 30 (17.2%) |
| College / Associate Degree | 331 (48.4%) | 0 (0.0%) |
| Bachelor's Degree or higher | 234 (88.6%) | 0 (0.0%) |
| Total | 623 (55.6%) | 18 (1.6%) |
Employment Occupations by Sex in Stallion Springs
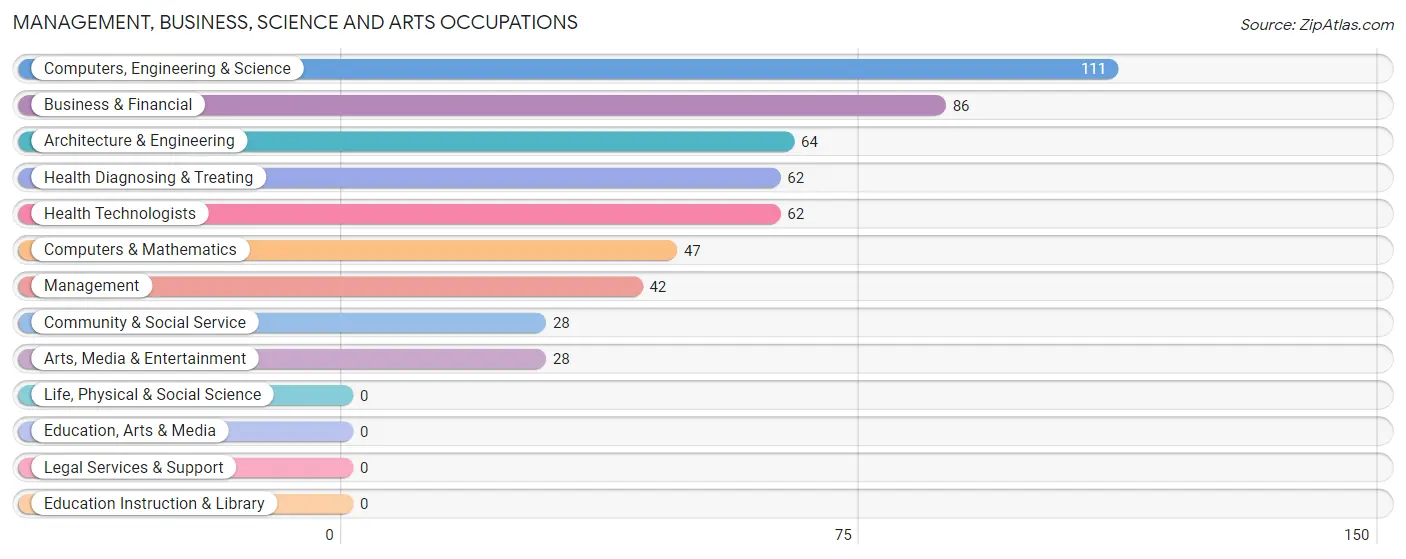
Management, Business, Science and Arts Occupations
The most common Management, Business, Science and Arts occupations in Stallion Springs are Computers, Engineering & Science (111 | 15.2%), Business & Financial (86 | 11.8%), Architecture & Engineering (64 | 8.8%), Health Diagnosing & Treating (62 | 8.5%), and Health Technologists (62 | 8.5%).
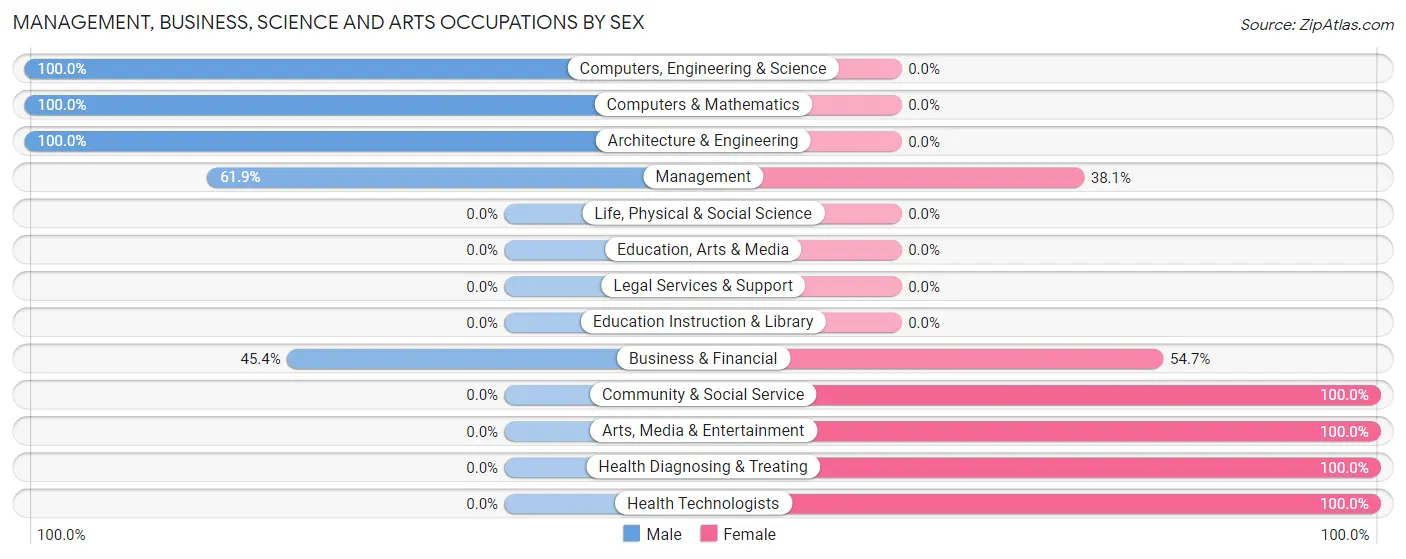
Management, Business, Science and Arts Occupations by Sex
Within the Management, Business, Science and Arts occupations in Stallion Springs, the most male-oriented occupations are Computers, Engineering & Science (100.0%), Computers & Mathematics (100.0%), and Architecture & Engineering (100.0%), while the most female-oriented occupations are Community & Social Service (100.0%), Arts, Media & Entertainment (100.0%), and Health Diagnosing & Treating (100.0%).
| Occupation | Male | Female |
| Management | 26 (61.9%) | 16 (38.1%) |
| Business & Financial | 39 (45.4%) | 47 (54.6%) |
| Computers, Engineering & Science | 111 (100.0%) | 0 (0.0%) |
| Computers & Mathematics | 47 (100.0%) | 0 (0.0%) |
| Architecture & Engineering | 64 (100.0%) | 0 (0.0%) |
| Life, Physical & Social Science | 0 (0.0%) | 0 (0.0%) |
| Community & Social Service | 0 (0.0%) | 28 (100.0%) |
| Education, Arts & Media | 0 (0.0%) | 0 (0.0%) |
| Legal Services & Support | 0 (0.0%) | 0 (0.0%) |
| Education Instruction & Library | 0 (0.0%) | 0 (0.0%) |
| Arts, Media & Entertainment | 0 (0.0%) | 28 (100.0%) |
| Health Diagnosing & Treating | 0 (0.0%) | 62 (100.0%) |
| Health Technologists | 0 (0.0%) | 62 (100.0%) |
| Total (Category) | 176 (53.5%) | 153 (46.5%) |
| Total (Overall) | 419 (57.5%) | 310 (42.5%) |
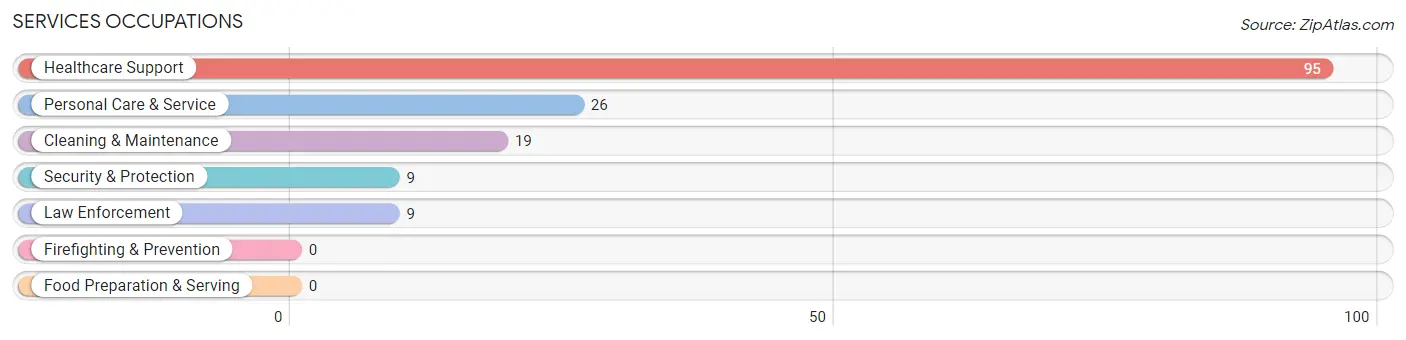
Services Occupations
The most common Services occupations in Stallion Springs are Healthcare Support (95 | 13.0%), Personal Care & Service (26 | 3.6%), Cleaning & Maintenance (19 | 2.6%), Security & Protection (9 | 1.2%), and Law Enforcement (9 | 1.2%).
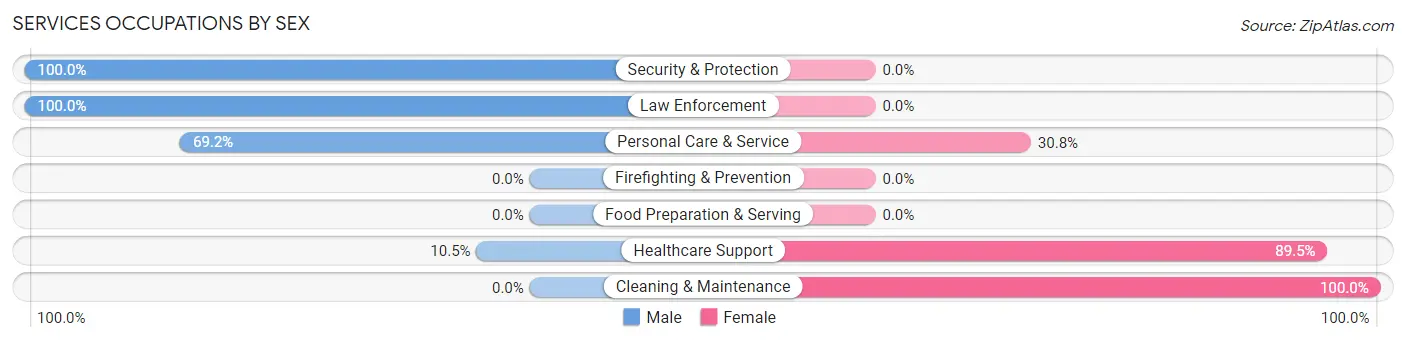
Services Occupations by Sex
Within the Services occupations in Stallion Springs, the most male-oriented occupations are Security & Protection (100.0%), Law Enforcement (100.0%), and Personal Care & Service (69.2%), while the most female-oriented occupations are Cleaning & Maintenance (100.0%), Healthcare Support (89.5%), and Personal Care & Service (30.8%).
| Occupation | Male | Female |
| Healthcare Support | 10 (10.5%) | 85 (89.5%) |
| Security & Protection | 9 (100.0%) | 0 (0.0%) |
| Firefighting & Prevention | 0 (0.0%) | 0 (0.0%) |
| Law Enforcement | 9 (100.0%) | 0 (0.0%) |
| Food Preparation & Serving | 0 (0.0%) | 0 (0.0%) |
| Cleaning & Maintenance | 0 (0.0%) | 19 (100.0%) |
| Personal Care & Service | 18 (69.2%) | 8 (30.8%) |
| Total (Category) | 37 (24.8%) | 112 (75.2%) |
| Total (Overall) | 419 (57.5%) | 310 (42.5%) |
Sales and Office Occupations
The most common Sales and Office occupations in Stallion Springs are Office & Administration (85 | 11.7%), and Sales & Related (66 | 9.0%).
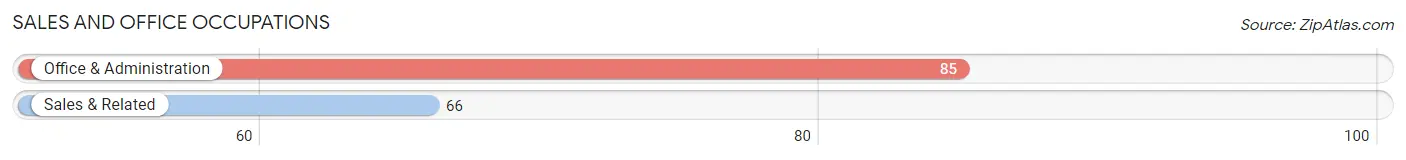
Sales and Office Occupations by Sex
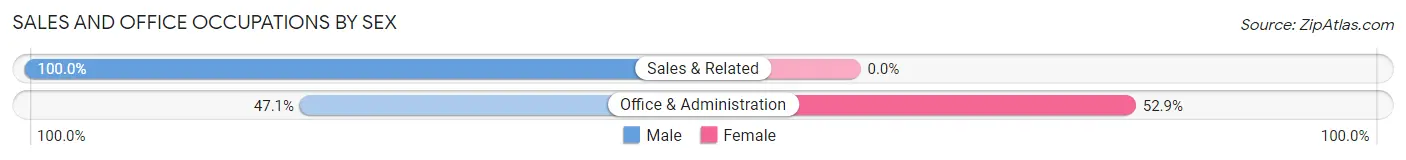
| Occupation | Male | Female |
| Sales & Related | 66 (100.0%) | 0 (0.0%) |
| Office & Administration | 40 (47.1%) | 45 (52.9%) |
| Total (Category) | 106 (70.2%) | 45 (29.8%) |
| Total (Overall) | 419 (57.5%) | 310 (42.5%) |
Natural Resources, Construction and Maintenance Occupations
The most common Natural Resources, Construction and Maintenance occupations in Stallion Springs are , and Installation, Maintenance & Repair (48 | 6.6%).
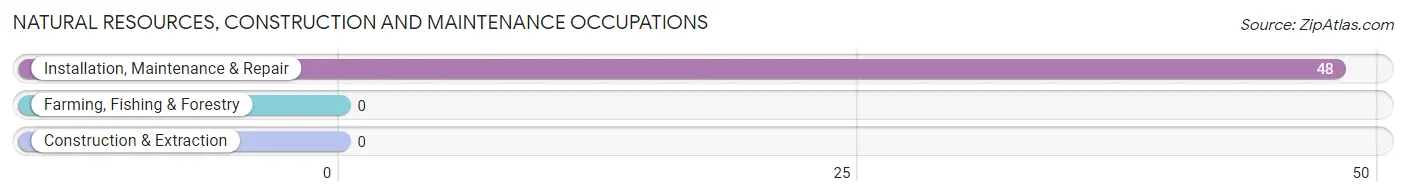
Natural Resources, Construction and Maintenance Occupations by Sex
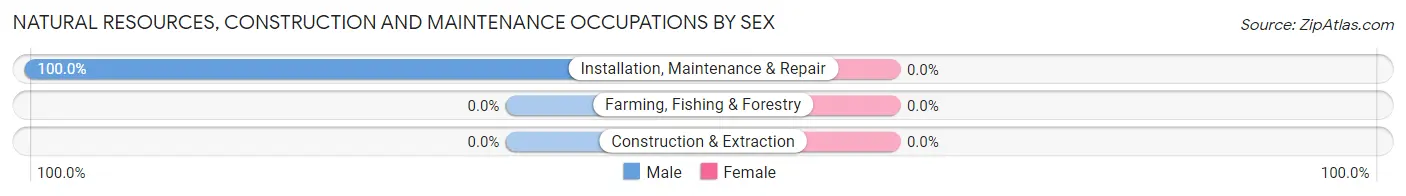
| Occupation | Male | Female |
| Farming, Fishing & Forestry | 0 (0.0%) | 0 (0.0%) |
| Construction & Extraction | 0 (0.0%) | 0 (0.0%) |
| Installation, Maintenance & Repair | 48 (100.0%) | 0 (0.0%) |
| Total (Category) | 48 (100.0%) | 0 (0.0%) |
| Total (Overall) | 419 (57.5%) | 310 (42.5%) |
Production, Transportation and Moving Occupations
The most common Production, Transportation and Moving occupations in Stallion Springs are , and Transportation (52 | 7.1%).
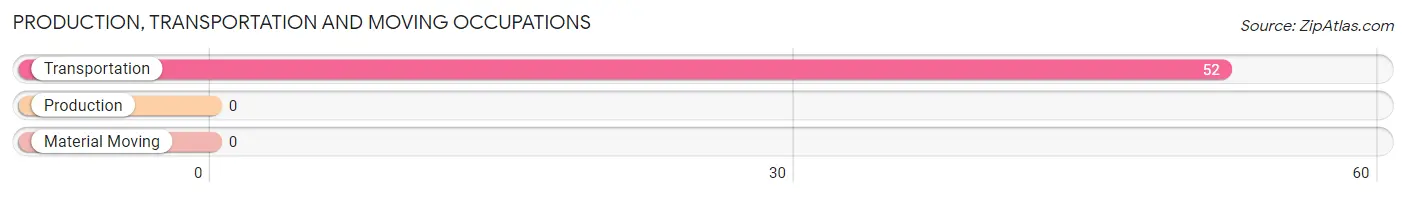
Production, Transportation and Moving Occupations by Sex
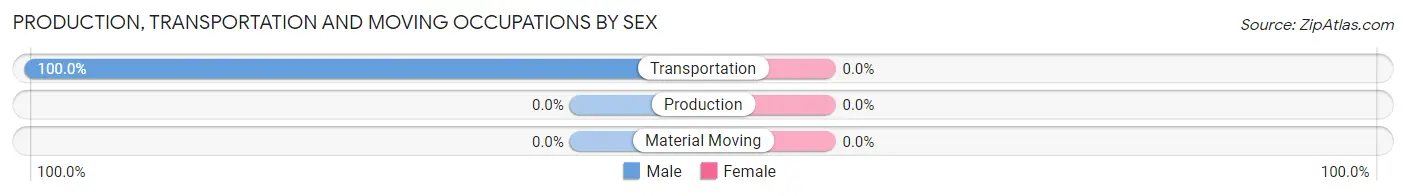
| Occupation | Male | Female |
| Production | 0 (0.0%) | 0 (0.0%) |
| Transportation | 52 (100.0%) | 0 (0.0%) |
| Material Moving | 0 (0.0%) | 0 (0.0%) |
| Total (Category) | 52 (100.0%) | 0 (0.0%) |
| Total (Overall) | 419 (57.5%) | 310 (42.5%) |
Employment Industries by Sex in Stallion Springs
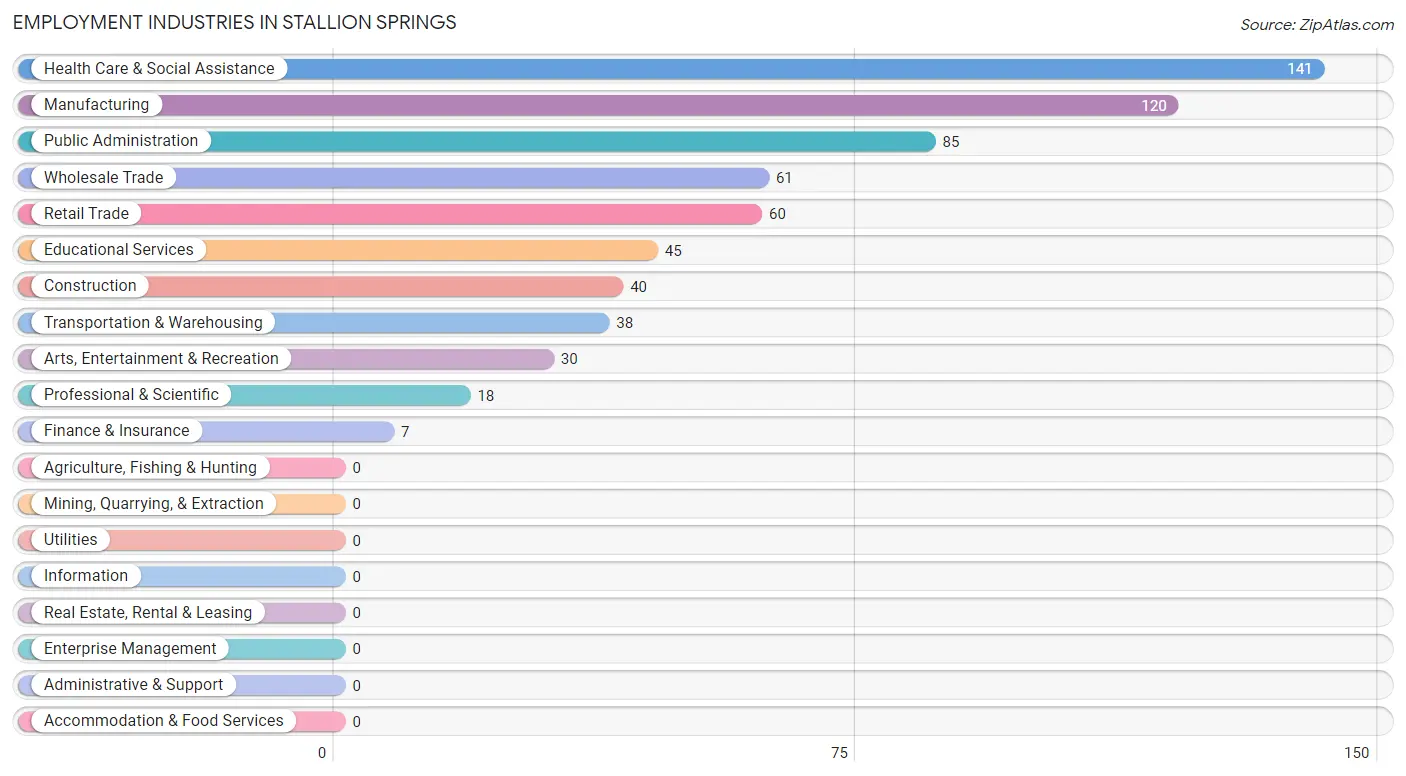
Employment Industries in Stallion Springs
The major employment industries in Stallion Springs include Health Care & Social Assistance (141 | 19.3%), Manufacturing (120 | 16.5%), Public Administration (85 | 11.7%), Wholesale Trade (61 | 8.4%), and Retail Trade (60 | 8.2%).
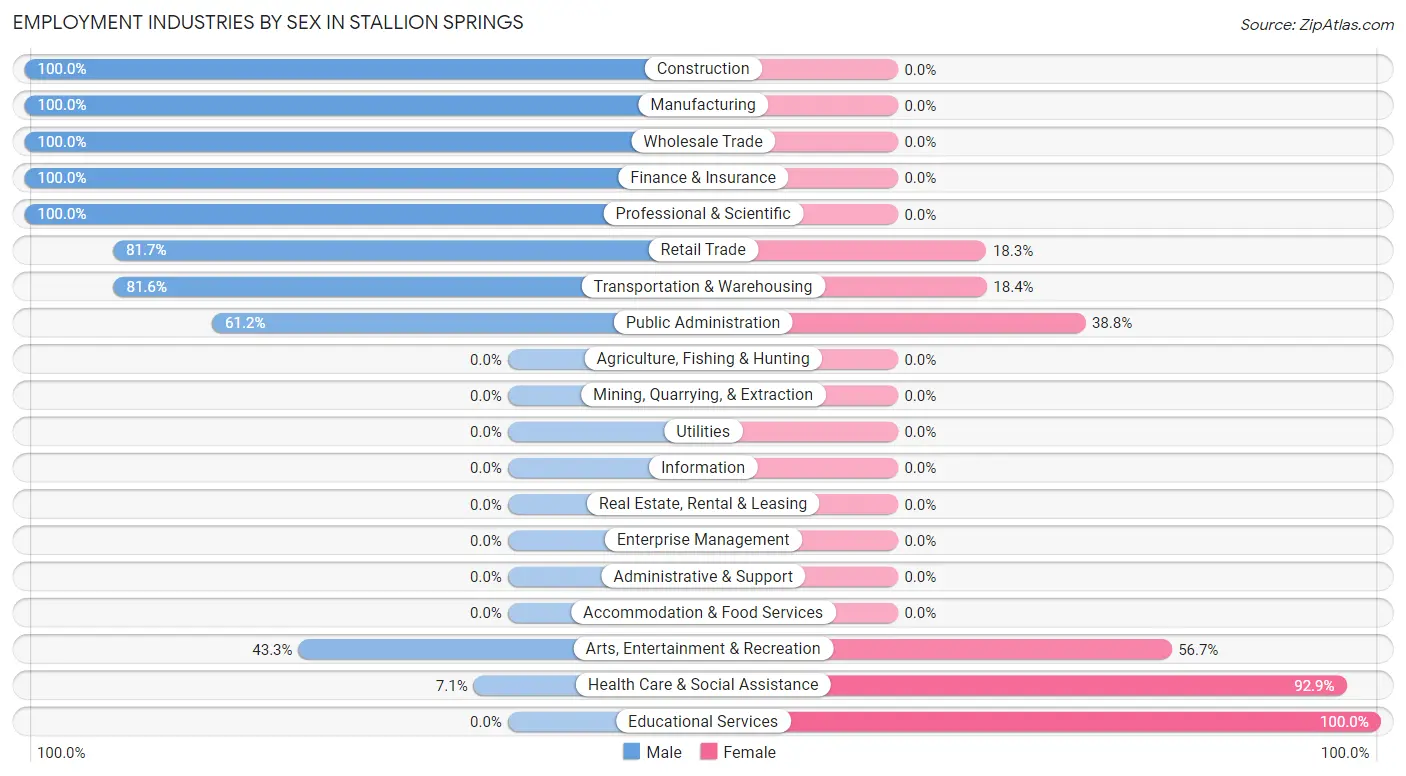
Employment Industries by Sex in Stallion Springs
The Stallion Springs industries that see more men than women are Construction (100.0%), Manufacturing (100.0%), and Wholesale Trade (100.0%), whereas the industries that tend to have a higher number of women are Educational Services (100.0%), Health Care & Social Assistance (92.9%), and Arts, Entertainment & Recreation (56.7%).
| Industry | Male | Female |
| Agriculture, Fishing & Hunting | 0 (0.0%) | 0 (0.0%) |
| Mining, Quarrying, & Extraction | 0 (0.0%) | 0 (0.0%) |
| Construction | 40 (100.0%) | 0 (0.0%) |
| Manufacturing | 120 (100.0%) | 0 (0.0%) |
| Wholesale Trade | 61 (100.0%) | 0 (0.0%) |
| Retail Trade | 49 (81.7%) | 11 (18.3%) |
| Transportation & Warehousing | 31 (81.6%) | 7 (18.4%) |
| Utilities | 0 (0.0%) | 0 (0.0%) |
| Information | 0 (0.0%) | 0 (0.0%) |
| Finance & Insurance | 7 (100.0%) | 0 (0.0%) |
| Real Estate, Rental & Leasing | 0 (0.0%) | 0 (0.0%) |
| Professional & Scientific | 18 (100.0%) | 0 (0.0%) |
| Enterprise Management | 0 (0.0%) | 0 (0.0%) |
| Administrative & Support | 0 (0.0%) | 0 (0.0%) |
| Educational Services | 0 (0.0%) | 45 (100.0%) |
| Health Care & Social Assistance | 10 (7.1%) | 131 (92.9%) |
| Arts, Entertainment & Recreation | 13 (43.3%) | 17 (56.7%) |
| Accommodation & Food Services | 0 (0.0%) | 0 (0.0%) |
| Public Administration | 52 (61.2%) | 33 (38.8%) |
| Total | 419 (57.5%) | 310 (42.5%) |
Education in Stallion Springs
School Enrollment in Stallion Springs
The most common levels of schooling among the 496 students in Stallion Springs are elementary school (278 | 56.0%), kindergarten (87 | 17.5%), and college / undergraduate (66 | 13.3%).
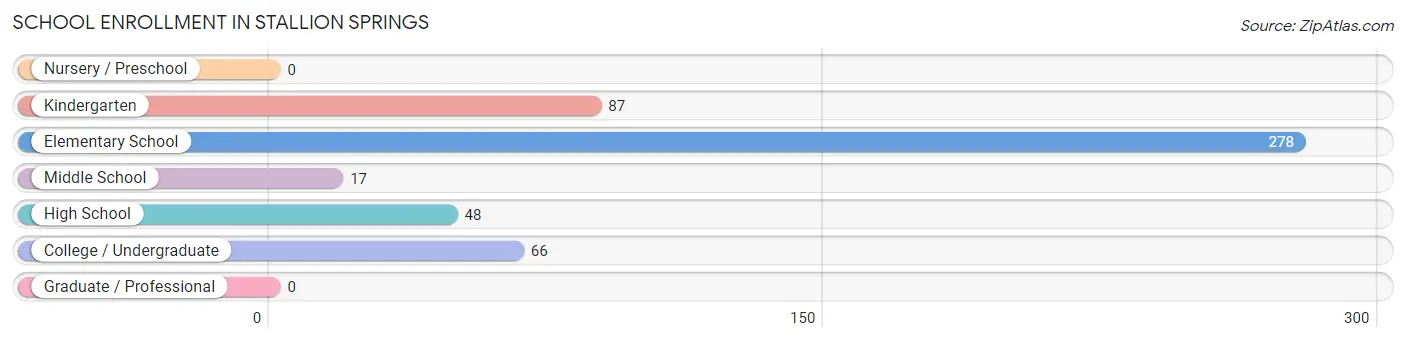
| School Level | # Students | % Students |
| Nursery / Preschool | 0 | 0.0% |
| Kindergarten | 87 | 17.5% |
| Elementary School | 278 | 56.0% |
| Middle School | 17 | 3.4% |
| High School | 48 | 9.7% |
| College / Undergraduate | 66 | 13.3% |
| Graduate / Professional | 0 | 0.0% |
| Total | 496 | 100.0% |
School Enrollment by Age by Funding Source in Stallion Springs
Out of a total of 496 students who are enrolled in schools in Stallion Springs, 7 (1.4%) attend a private institution, while the remaining 489 (98.6%) are enrolled in public schools. The age group of 25 to 34 year olds has the highest likelihood of being enrolled in private schools, with 7 (100.0% in the age bracket) enrolled. Conversely, the age group of 5 to 9 year old has the lowest likelihood of being enrolled in a private school, with 325 (100.0% in the age bracket) attending a public institution.
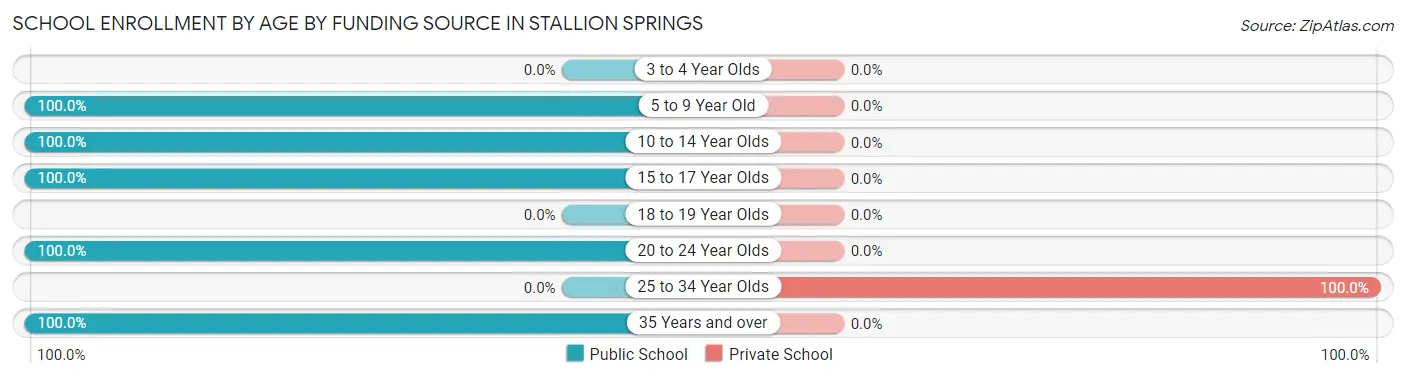
| Age Bracket | Public School | Private School |
| 3 to 4 Year Olds | 0 (0.0%) | 0 (0.0%) |
| 5 to 9 Year Old | 325 (100.0%) | 0 (0.0%) |
| 10 to 14 Year Olds | 74 (100.0%) | 0 (0.0%) |
| 15 to 17 Year Olds | 31 (100.0%) | 0 (0.0%) |
| 18 to 19 Year Olds | 0 (0.0%) | 0 (0.0%) |
| 20 to 24 Year Olds | 19 (100.0%) | 0 (0.0%) |
| 25 to 34 Year Olds | 0 (0.0%) | 7 (100.0%) |
| 35 Years and over | 40 (100.0%) | 0 (0.0%) |
| Total | 489 (98.6%) | 7 (1.4%) |
Educational Attainment by Field of Study in Stallion Springs
Visual & performing arts (109 | 24.1%), science & technology (93 | 20.6%), business (69 | 15.3%), bio, nature & agricultural (47 | 10.4%), and computers & mathematics (36 | 8.0%) are the most common fields of study among 452 individuals in Stallion Springs who have obtained a bachelor's degree or higher.
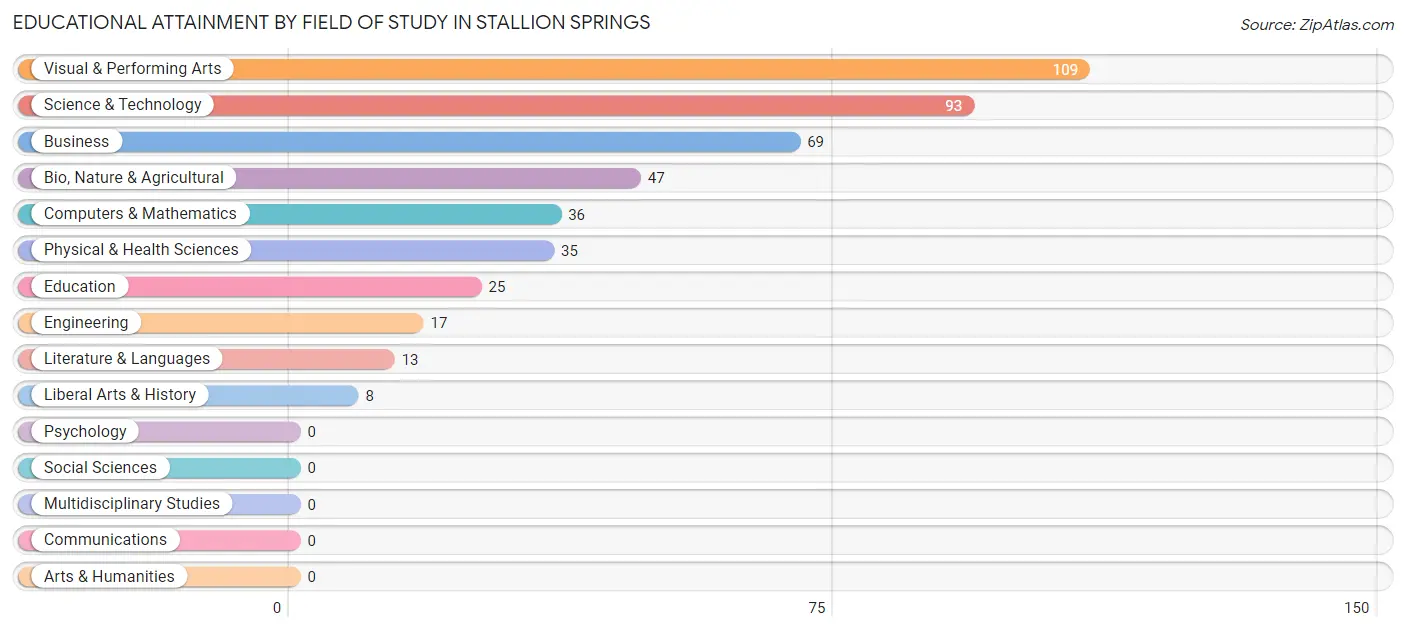
| Field of Study | # Graduates | % Graduates |
| Computers & Mathematics | 36 | 8.0% |
| Bio, Nature & Agricultural | 47 | 10.4% |
| Physical & Health Sciences | 35 | 7.7% |
| Psychology | 0 | 0.0% |
| Social Sciences | 0 | 0.0% |
| Engineering | 17 | 3.8% |
| Multidisciplinary Studies | 0 | 0.0% |
| Science & Technology | 93 | 20.6% |
| Business | 69 | 15.3% |
| Education | 25 | 5.5% |
| Literature & Languages | 13 | 2.9% |
| Liberal Arts & History | 8 | 1.8% |
| Visual & Performing Arts | 109 | 24.1% |
| Communications | 0 | 0.0% |
| Arts & Humanities | 0 | 0.0% |
| Total | 452 | 100.0% |
Transportation & Commute in Stallion Springs
Vehicle Availability by Sex in Stallion Springs
The most prevalent vehicle ownership categories in Stallion Springs are males with 2 vehicles (236, accounting for 56.3%) and females with 2 vehicles (216, making up 72.6%).
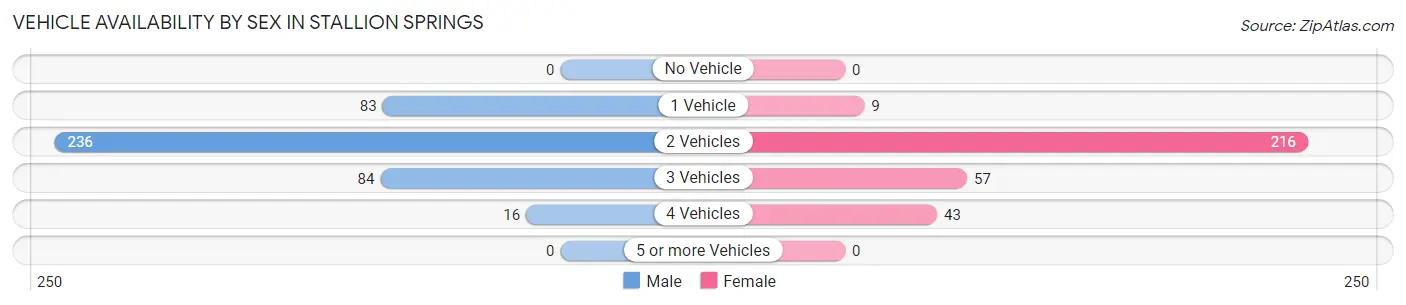
| Vehicles Available | Male | Female |
| No Vehicle | 0 (0.0%) | 0 (0.0%) |
| 1 Vehicle | 83 (19.8%) | 9 (2.8%) |
| 2 Vehicles | 236 (56.3%) | 216 (66.5%) |
| 3 Vehicles | 84 (20.1%) | 57 (17.5%) |
| 4 Vehicles | 16 (3.8%) | 43 (13.2%) |
| 5 or more Vehicles | 0 (0.0%) | 0 (0.0%) |
| Total | 419 (100.0%) | 325 (100.0%) |
Commute Time in Stallion Springs
The most frequently occuring commute durations in Stallion Springs are 60 to 89 minutes (265 commuters, 45.7%), 20 to 24 minutes (100 commuters, 17.2%), and 90 or more minutes (61 commuters, 10.5%).
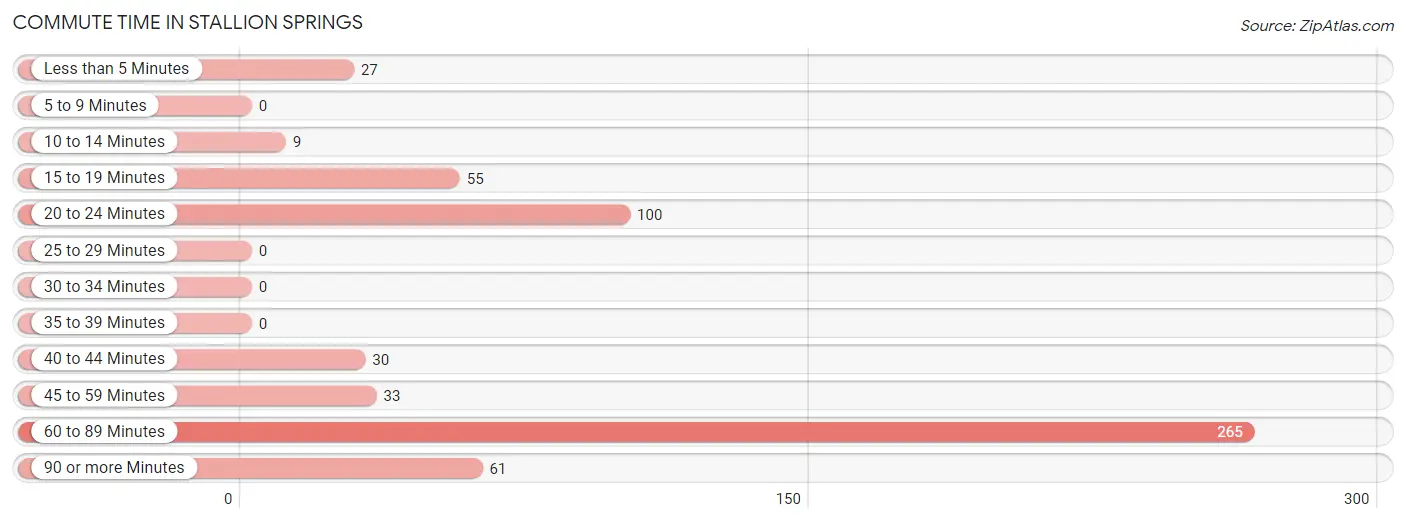
| Commute Time | # Commuters | % Commuters |
| Less than 5 Minutes | 27 | 4.7% |
| 5 to 9 Minutes | 0 | 0.0% |
| 10 to 14 Minutes | 9 | 1.5% |
| 15 to 19 Minutes | 55 | 9.5% |
| 20 to 24 Minutes | 100 | 17.2% |
| 25 to 29 Minutes | 0 | 0.0% |
| 30 to 34 Minutes | 0 | 0.0% |
| 35 to 39 Minutes | 0 | 0.0% |
| 40 to 44 Minutes | 30 | 5.2% |
| 45 to 59 Minutes | 33 | 5.7% |
| 60 to 89 Minutes | 265 | 45.7% |
| 90 or more Minutes | 61 | 10.5% |
Commute Time by Sex in Stallion Springs
The most common commute times in Stallion Springs are 60 to 89 minutes (145 commuters, 41.8%) for males and 60 to 89 minutes (120 commuters, 51.5%) for females.
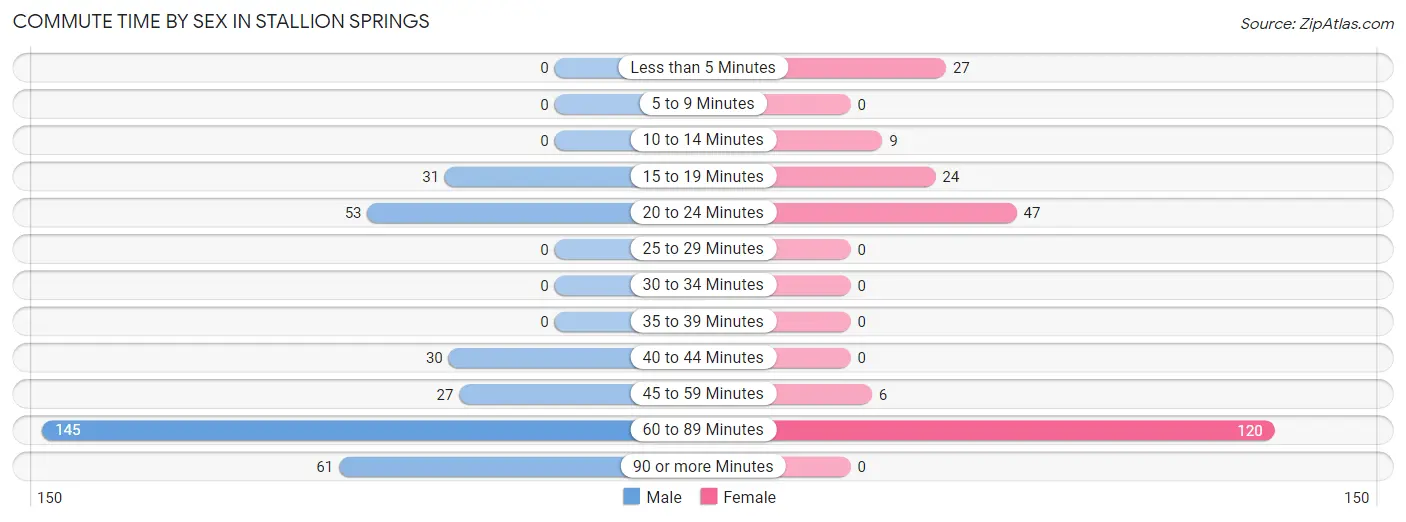
| Commute Time | Male | Female |
| Less than 5 Minutes | 0 (0.0%) | 27 (11.6%) |
| 5 to 9 Minutes | 0 (0.0%) | 0 (0.0%) |
| 10 to 14 Minutes | 0 (0.0%) | 9 (3.9%) |
| 15 to 19 Minutes | 31 (8.9%) | 24 (10.3%) |
| 20 to 24 Minutes | 53 (15.3%) | 47 (20.2%) |
| 25 to 29 Minutes | 0 (0.0%) | 0 (0.0%) |
| 30 to 34 Minutes | 0 (0.0%) | 0 (0.0%) |
| 35 to 39 Minutes | 0 (0.0%) | 0 (0.0%) |
| 40 to 44 Minutes | 30 (8.6%) | 0 (0.0%) |
| 45 to 59 Minutes | 27 (7.8%) | 6 (2.6%) |
| 60 to 89 Minutes | 145 (41.8%) | 120 (51.5%) |
| 90 or more Minutes | 61 (17.6%) | 0 (0.0%) |
Time of Departure to Work by Sex in Stallion Springs
The most frequent times of departure to work in Stallion Springs are 6:30 AM to 6:59 AM (109, 31.4%) for males and 7:00 AM to 7:29 AM (90, 38.6%) for females.
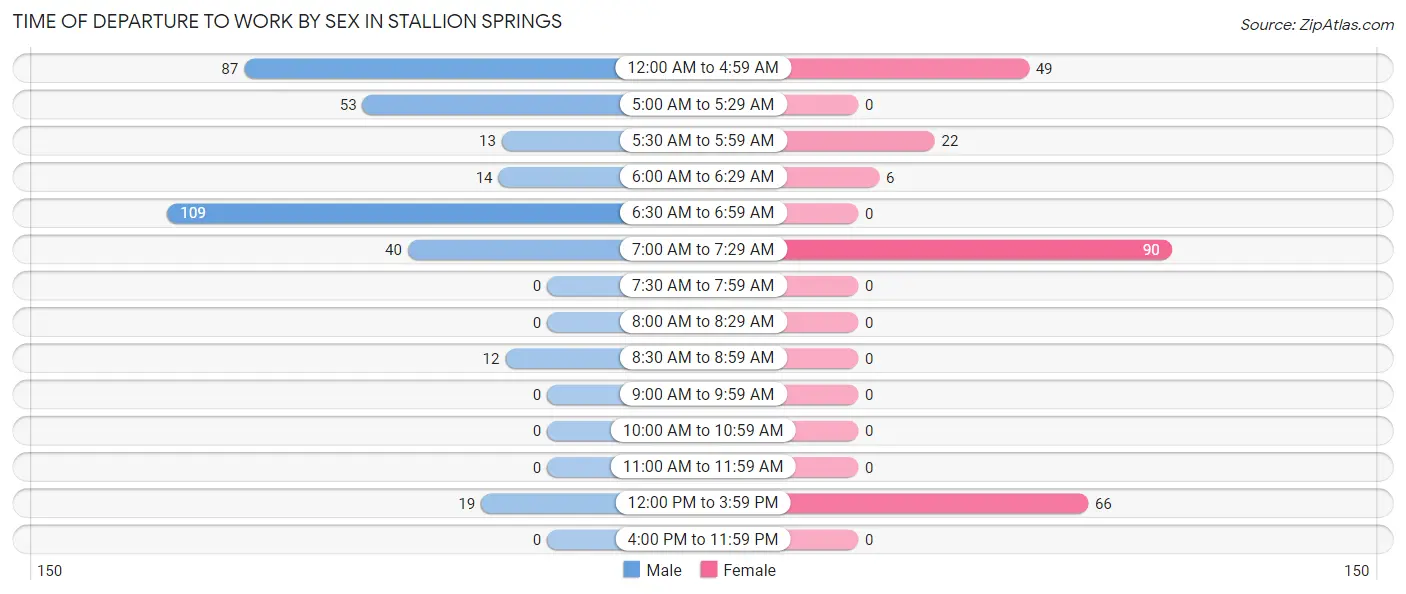
| Time of Departure | Male | Female |
| 12:00 AM to 4:59 AM | 87 (25.1%) | 49 (21.0%) |
| 5:00 AM to 5:29 AM | 53 (15.3%) | 0 (0.0%) |
| 5:30 AM to 5:59 AM | 13 (3.7%) | 22 (9.4%) |
| 6:00 AM to 6:29 AM | 14 (4.0%) | 6 (2.6%) |
| 6:30 AM to 6:59 AM | 109 (31.4%) | 0 (0.0%) |
| 7:00 AM to 7:29 AM | 40 (11.5%) | 90 (38.6%) |
| 7:30 AM to 7:59 AM | 0 (0.0%) | 0 (0.0%) |
| 8:00 AM to 8:29 AM | 0 (0.0%) | 0 (0.0%) |
| 8:30 AM to 8:59 AM | 12 (3.5%) | 0 (0.0%) |
| 9:00 AM to 9:59 AM | 0 (0.0%) | 0 (0.0%) |
| 10:00 AM to 10:59 AM | 0 (0.0%) | 0 (0.0%) |
| 11:00 AM to 11:59 AM | 0 (0.0%) | 0 (0.0%) |
| 12:00 PM to 3:59 PM | 19 (5.5%) | 66 (28.3%) |
| 4:00 PM to 11:59 PM | 0 (0.0%) | 0 (0.0%) |
| Total | 347 (100.0%) | 233 (100.0%) |
Housing Occupancy in Stallion Springs
Occupancy by Ownership in Stallion Springs
Of the total 1,052 dwellings in Stallion Springs, owner-occupied units account for 962 (91.4%), while renter-occupied units make up 90 (8.6%).
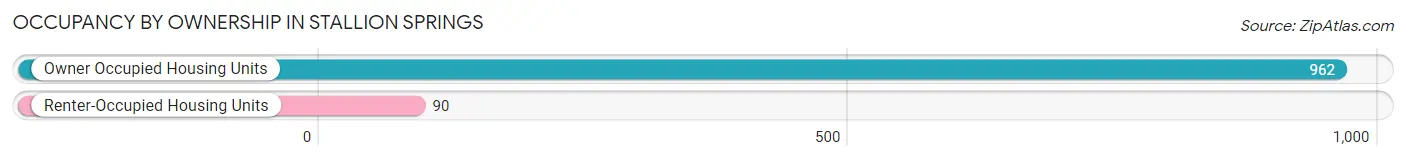
| Occupancy | # Housing Units | % Housing Units |
| Owner Occupied Housing Units | 962 | 91.4% |
| Renter-Occupied Housing Units | 90 | 8.6% |
| Total Occupied Housing Units | 1,052 | 100.0% |
Occupancy by Household Size in Stallion Springs
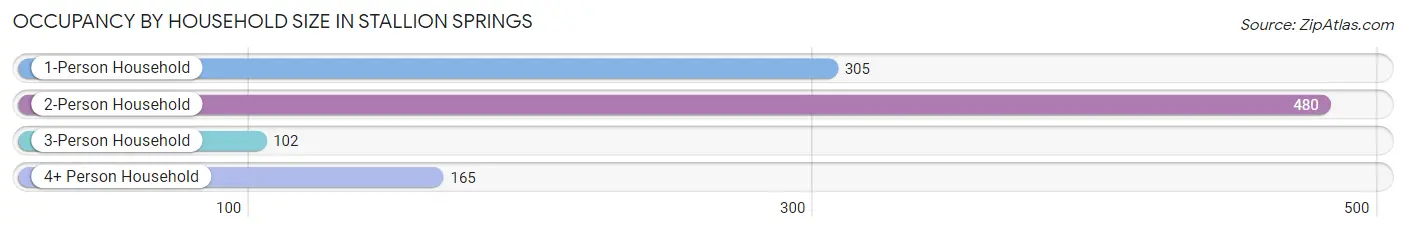
| Household Size | # Housing Units | % Housing Units |
| 1-Person Household | 305 | 29.0% |
| 2-Person Household | 480 | 45.6% |
| 3-Person Household | 102 | 9.7% |
| 4+ Person Household | 165 | 15.7% |
| Total Housing Units | 1,052 | 100.0% |
Occupancy by Ownership by Household Size in Stallion Springs
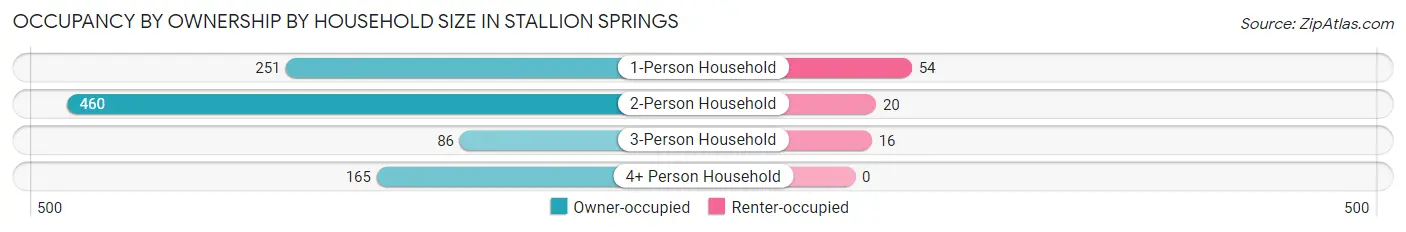
| Household Size | Owner-occupied | Renter-occupied |
| 1-Person Household | 251 (82.3%) | 54 (17.7%) |
| 2-Person Household | 460 (95.8%) | 20 (4.2%) |
| 3-Person Household | 86 (84.3%) | 16 (15.7%) |
| 4+ Person Household | 165 (100.0%) | 0 (0.0%) |
| Total Housing Units | 962 (91.4%) | 90 (8.6%) |
Occupancy by Educational Attainment in Stallion Springs
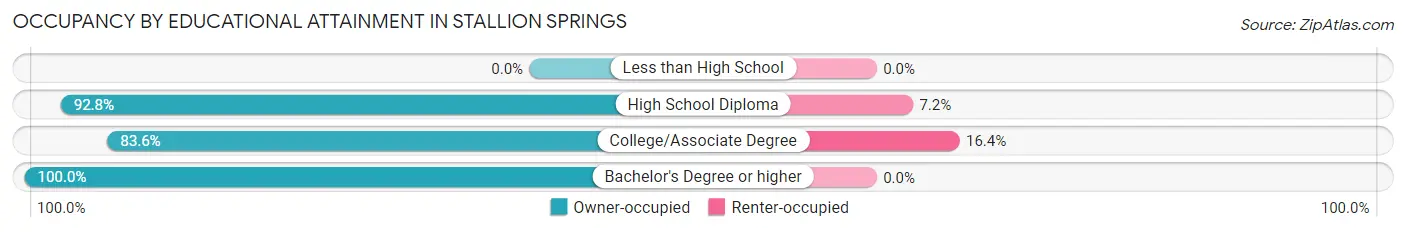
| Household Size | Owner-occupied | Renter-occupied |
| Less than High School | 0 (0.0%) | 0 (0.0%) |
| High School Diploma | 258 (92.8%) | 20 (7.2%) |
| College/Associate Degree | 356 (83.6%) | 70 (16.4%) |
| Bachelor's Degree or higher | 348 (100.0%) | 0 (0.0%) |
Occupancy by Age of Householder in Stallion Springs
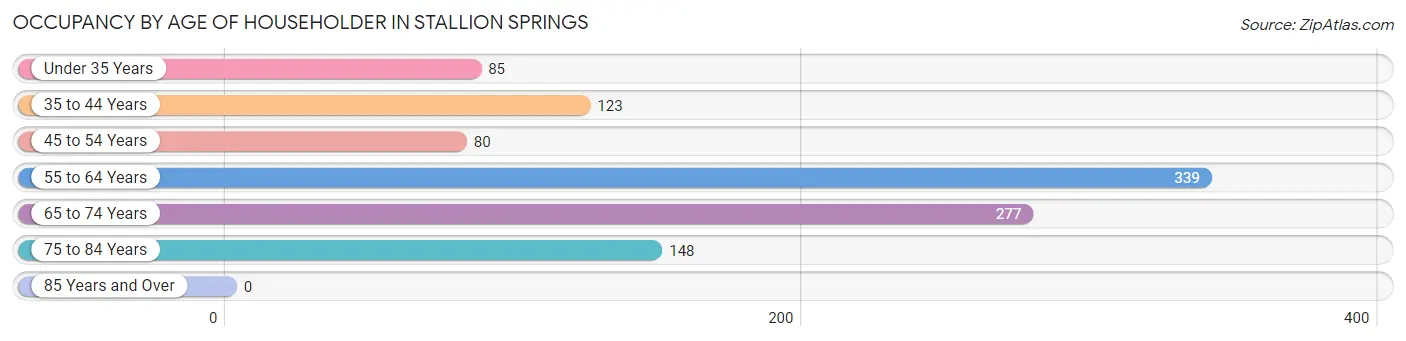
| Age Bracket | # Households | % Households |
| Under 35 Years | 85 | 8.1% |
| 35 to 44 Years | 123 | 11.7% |
| 45 to 54 Years | 80 | 7.6% |
| 55 to 64 Years | 339 | 32.2% |
| 65 to 74 Years | 277 | 26.3% |
| 75 to 84 Years | 148 | 14.1% |
| 85 Years and Over | 0 | 0.0% |
| Total | 1,052 | 100.0% |
Housing Finances in Stallion Springs
Median Income by Occupancy in Stallion Springs
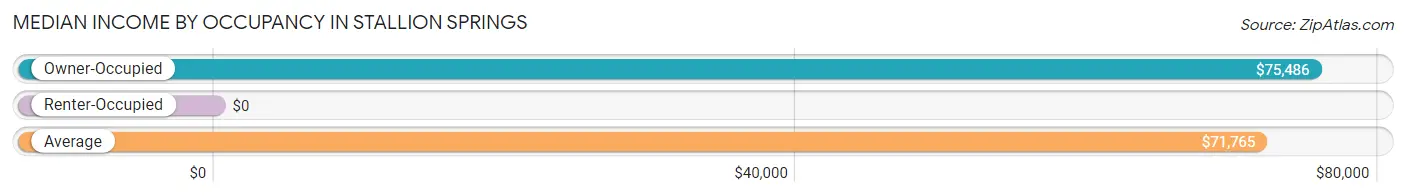
| Occupancy Type | # Households | Median Income |
| Owner-Occupied | 962 (91.4%) | $75,486 |
| Renter-Occupied | 90 (8.6%) | $0 |
| Average | 1,052 (100.0%) | $71,765 |
Occupancy by Householder Income Bracket in Stallion Springs
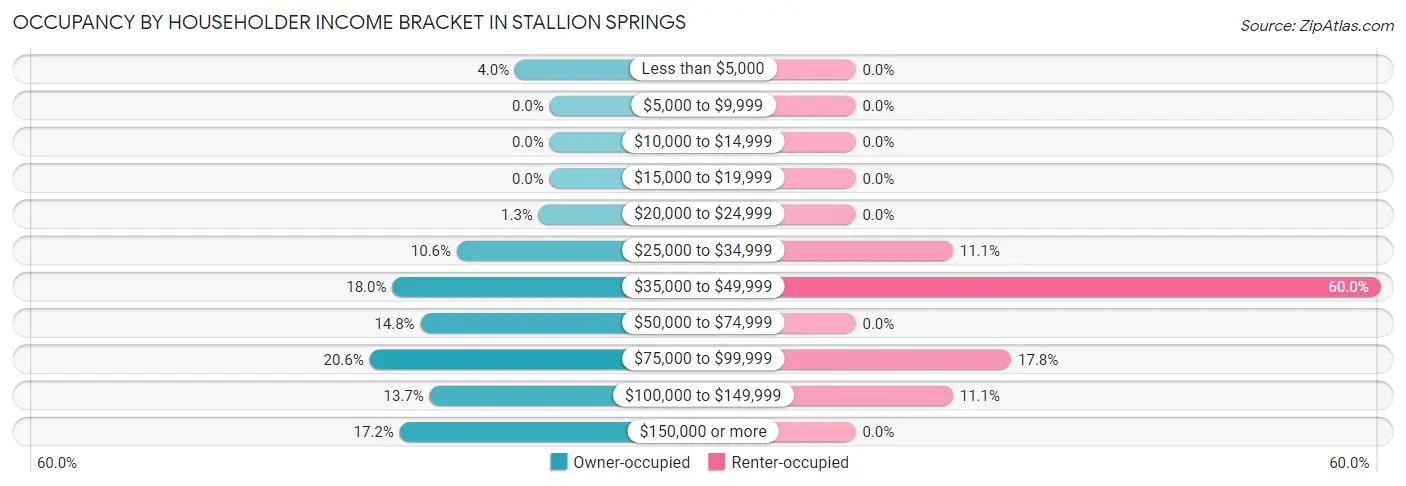
| Income Bracket | Owner-occupied | Renter-occupied |
| Less than $5,000 | 38 (4.0%) | 0 (0.0%) |
| $5,000 to $9,999 | 0 (0.0%) | 0 (0.0%) |
| $10,000 to $14,999 | 0 (0.0%) | 0 (0.0%) |
| $15,000 to $19,999 | 0 (0.0%) | 0 (0.0%) |
| $20,000 to $24,999 | 12 (1.3%) | 0 (0.0%) |
| $25,000 to $34,999 | 102 (10.6%) | 10 (11.1%) |
| $35,000 to $49,999 | 173 (18.0%) | 54 (60.0%) |
| $50,000 to $74,999 | 142 (14.8%) | 0 (0.0%) |
| $75,000 to $99,999 | 198 (20.6%) | 16 (17.8%) |
| $100,000 to $149,999 | 132 (13.7%) | 10 (11.1%) |
| $150,000 or more | 165 (17.2%) | 0 (0.0%) |
| Total | 962 (100.0%) | 90 (100.0%) |
Monthly Housing Cost Tiers in Stallion Springs
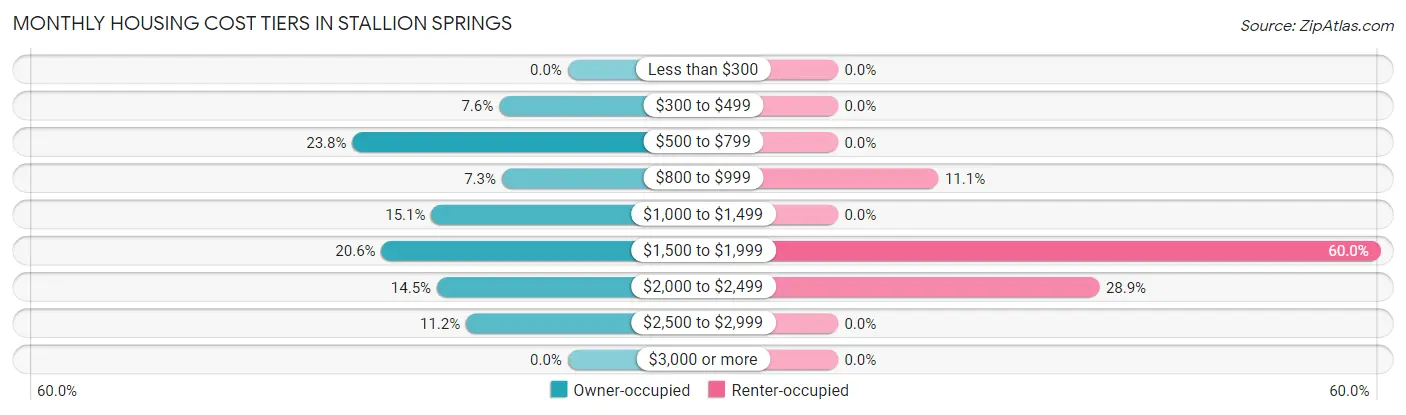
| Monthly Cost | Owner-occupied | Renter-occupied |
| Less than $300 | 0 (0.0%) | 0 (0.0%) |
| $300 to $499 | 73 (7.6%) | 0 (0.0%) |
| $500 to $799 | 229 (23.8%) | 0 (0.0%) |
| $800 to $999 | 70 (7.3%) | 10 (11.1%) |
| $1,000 to $1,499 | 145 (15.1%) | 0 (0.0%) |
| $1,500 to $1,999 | 198 (20.6%) | 54 (60.0%) |
| $2,000 to $2,499 | 139 (14.4%) | 26 (28.9%) |
| $2,500 to $2,999 | 108 (11.2%) | 0 (0.0%) |
| $3,000 or more | 0 (0.0%) | 0 (0.0%) |
| Total | 962 (100.0%) | 90 (100.0%) |
Physical Housing Characteristics in Stallion Springs
Housing Structures in Stallion Springs
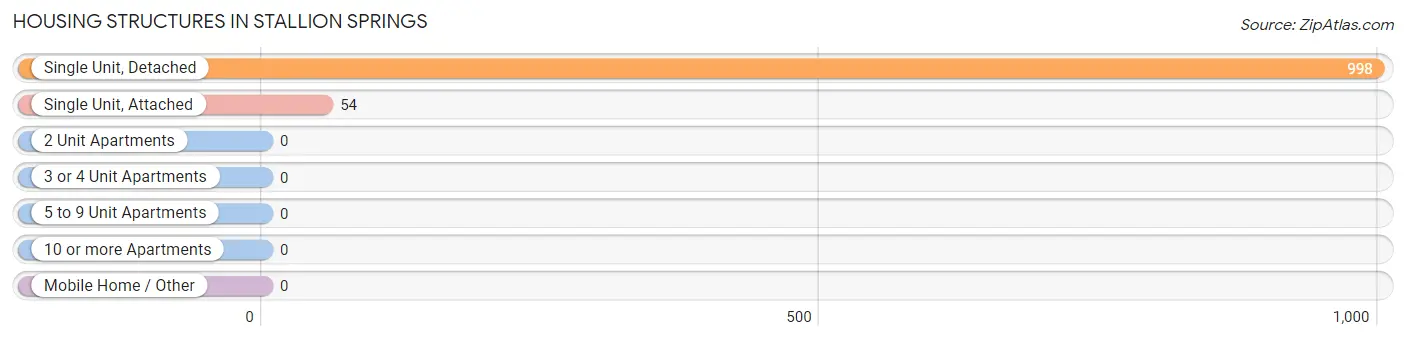
| Structure Type | # Housing Units | % Housing Units |
| Single Unit, Detached | 998 | 94.9% |
| Single Unit, Attached | 54 | 5.1% |
| 2 Unit Apartments | 0 | 0.0% |
| 3 or 4 Unit Apartments | 0 | 0.0% |
| 5 to 9 Unit Apartments | 0 | 0.0% |
| 10 or more Apartments | 0 | 0.0% |
| Mobile Home / Other | 0 | 0.0% |
| Total | 1,052 | 100.0% |
Housing Structures by Occupancy in Stallion Springs
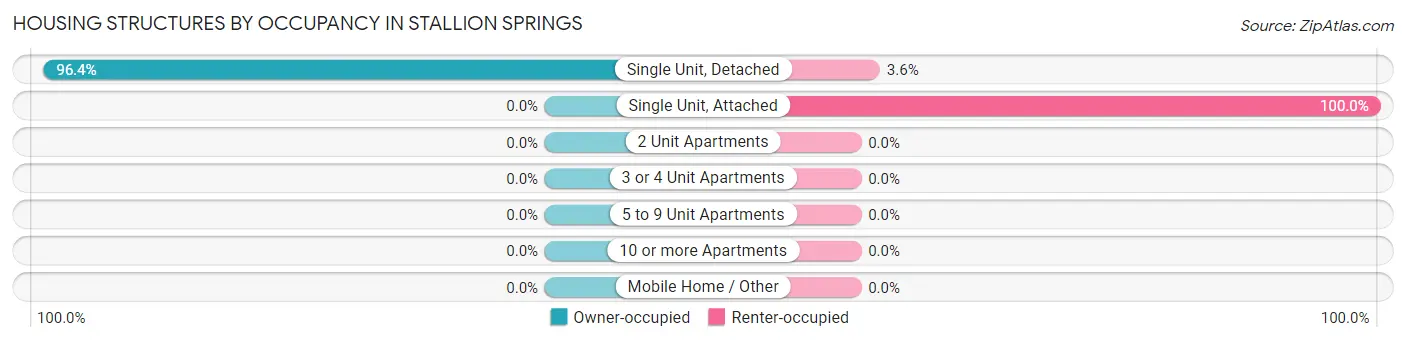
| Structure Type | Owner-occupied | Renter-occupied |
| Single Unit, Detached | 962 (96.4%) | 36 (3.6%) |
| Single Unit, Attached | 0 (0.0%) | 54 (100.0%) |
| 2 Unit Apartments | 0 (0.0%) | 0 (0.0%) |
| 3 or 4 Unit Apartments | 0 (0.0%) | 0 (0.0%) |
| 5 to 9 Unit Apartments | 0 (0.0%) | 0 (0.0%) |
| 10 or more Apartments | 0 (0.0%) | 0 (0.0%) |
| Mobile Home / Other | 0 (0.0%) | 0 (0.0%) |
| Total | 962 (91.4%) | 90 (8.6%) |
Housing Structures by Number of Rooms in Stallion Springs
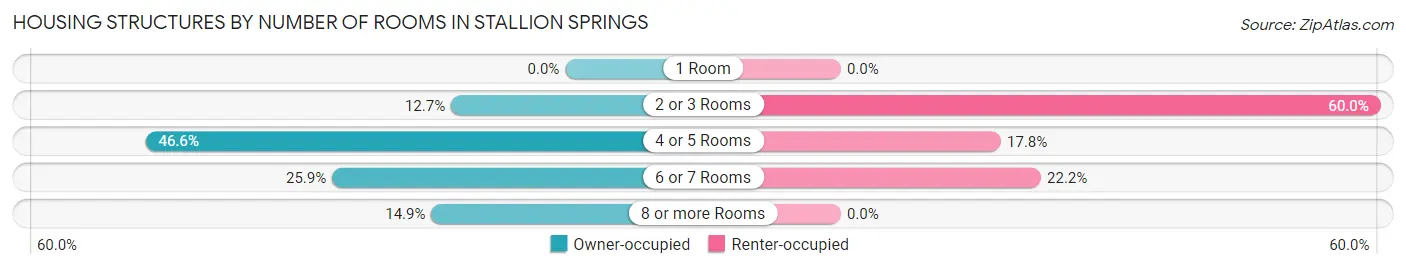
| Number of Rooms | Owner-occupied | Renter-occupied |
| 1 Room | 0 (0.0%) | 0 (0.0%) |
| 2 or 3 Rooms | 122 (12.7%) | 54 (60.0%) |
| 4 or 5 Rooms | 448 (46.6%) | 16 (17.8%) |
| 6 or 7 Rooms | 249 (25.9%) | 20 (22.2%) |
| 8 or more Rooms | 143 (14.9%) | 0 (0.0%) |
| Total | 962 (100.0%) | 90 (100.0%) |
Housing Structure by Heating Type in Stallion Springs
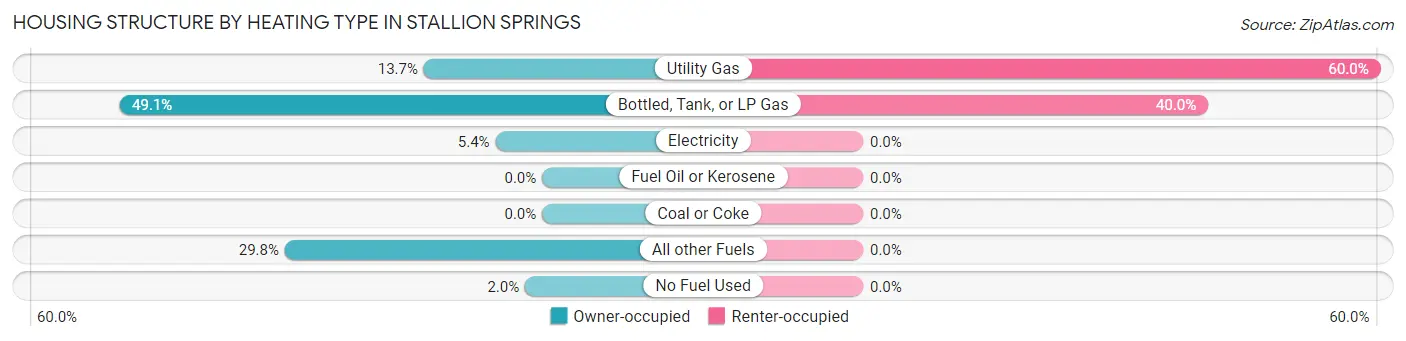
| Heating Type | Owner-occupied | Renter-occupied |
| Utility Gas | 132 (13.7%) | 54 (60.0%) |
| Bottled, Tank, or LP Gas | 472 (49.1%) | 36 (40.0%) |
| Electricity | 52 (5.4%) | 0 (0.0%) |
| Fuel Oil or Kerosene | 0 (0.0%) | 0 (0.0%) |
| Coal or Coke | 0 (0.0%) | 0 (0.0%) |
| All other Fuels | 287 (29.8%) | 0 (0.0%) |
| No Fuel Used | 19 (2.0%) | 0 (0.0%) |
| Total | 962 (100.0%) | 90 (100.0%) |
Household Vehicle Usage in Stallion Springs
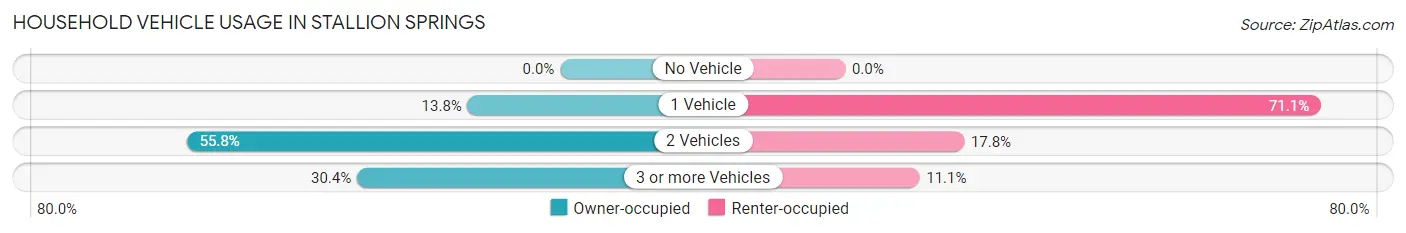
| Vehicles per Household | Owner-occupied | Renter-occupied |
| No Vehicle | 0 (0.0%) | 0 (0.0%) |
| 1 Vehicle | 133 (13.8%) | 64 (71.1%) |
| 2 Vehicles | 537 (55.8%) | 16 (17.8%) |
| 3 or more Vehicles | 292 (30.3%) | 10 (11.1%) |
| Total | 962 (100.0%) | 90 (100.0%) |
Real Estate & Mortgages in Stallion Springs
Real Estate and Mortgage Overview in Stallion Springs
| Characteristic | Without Mortgage | With Mortgage |
| Housing Units | 469 | 493 |
| Median Property Value | $363,200 | $335,500 |
| Median Household Income | $52,841 | $115 |
| Monthly Housing Costs | $689 | $0 |
| Real Estate Taxes | $3,623 | $0 |
Property Value by Mortgage Status in Stallion Springs
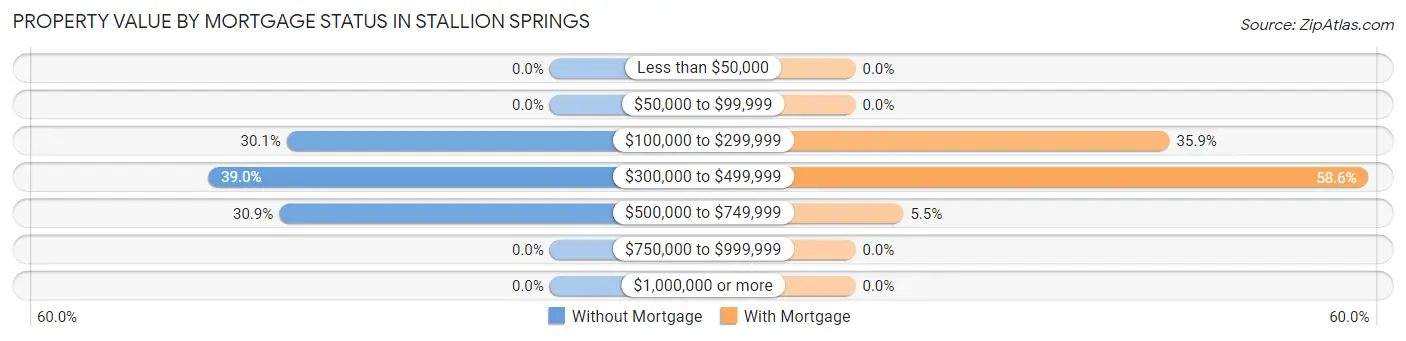
| Property Value | Without Mortgage | With Mortgage |
| Less than $50,000 | 0 (0.0%) | 0 (0.0%) |
| $50,000 to $99,999 | 0 (0.0%) | 0 (0.0%) |
| $100,000 to $299,999 | 141 (30.1%) | 177 (35.9%) |
| $300,000 to $499,999 | 183 (39.0%) | 289 (58.6%) |
| $500,000 to $749,999 | 145 (30.9%) | 27 (5.5%) |
| $750,000 to $999,999 | 0 (0.0%) | 0 (0.0%) |
| $1,000,000 or more | 0 (0.0%) | 0 (0.0%) |
| Total | 469 (100.0%) | 493 (100.0%) |
Household Income by Mortgage Status in Stallion Springs
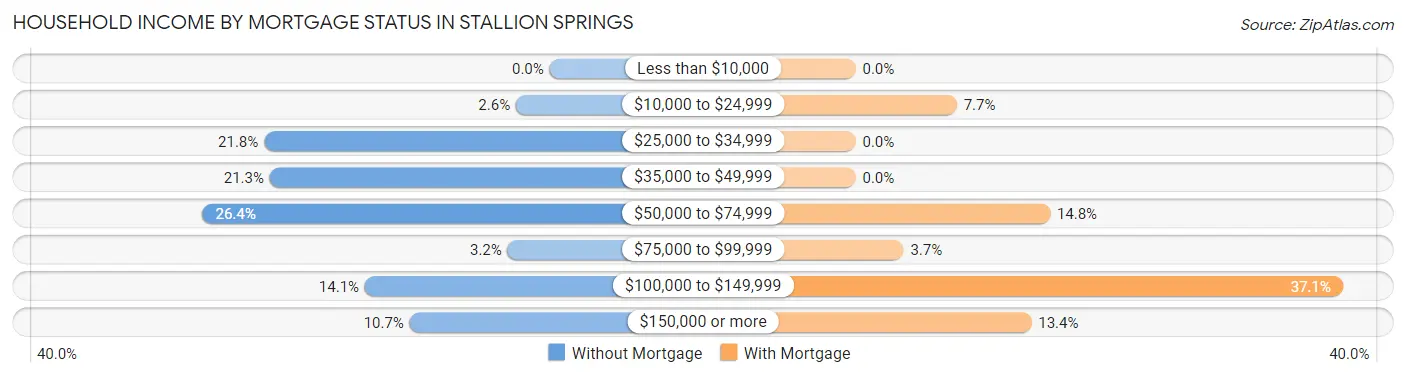
| Household Income | Without Mortgage | With Mortgage |
| Less than $10,000 | 0 (0.0%) | 0 (0.0%) |
| $10,000 to $24,999 | 12 (2.6%) | 38 (7.7%) |
| $25,000 to $34,999 | 102 (21.7%) | 0 (0.0%) |
| $35,000 to $49,999 | 100 (21.3%) | 0 (0.0%) |
| $50,000 to $74,999 | 124 (26.4%) | 73 (14.8%) |
| $75,000 to $99,999 | 15 (3.2%) | 18 (3.6%) |
| $100,000 to $149,999 | 66 (14.1%) | 183 (37.1%) |
| $150,000 or more | 50 (10.7%) | 66 (13.4%) |
| Total | 469 (100.0%) | 493 (100.0%) |
Property Value to Household Income Ratio in Stallion Springs
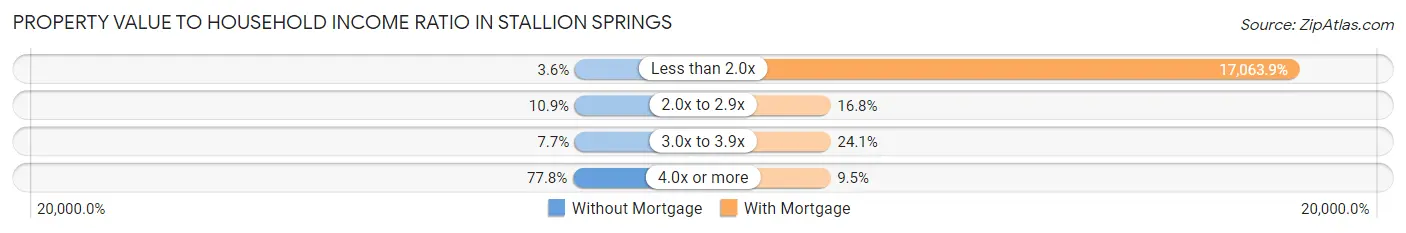
| Value-to-Income Ratio | Without Mortgage | With Mortgage |
| Less than 2.0x | 17 (3.6%) | 84,125 (17,063.9%) |
| 2.0x to 2.9x | 51 (10.9%) | 83 (16.8%) |
| 3.0x to 3.9x | 36 (7.7%) | 119 (24.1%) |
| 4.0x or more | 365 (77.8%) | 47 (9.5%) |
| Total | 469 (100.0%) | 493 (100.0%) |
Real Estate Taxes by Mortgage Status in Stallion Springs
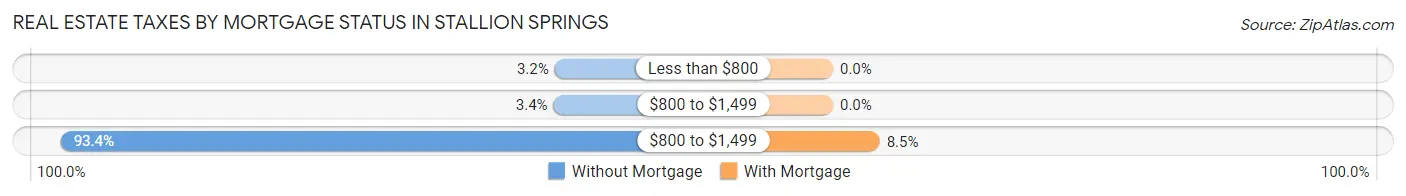
| Property Taxes | Without Mortgage | With Mortgage |
| Less than $800 | 15 (3.2%) | 0 (0.0%) |
| $800 to $1,499 | 16 (3.4%) | 0 (0.0%) |
| $800 to $1,499 | 438 (93.4%) | 42 (8.5%) |
| Total | 469 (100.0%) | 493 (100.0%) |
Health & Disability in Stallion Springs
Health Insurance Coverage by Age in Stallion Springs
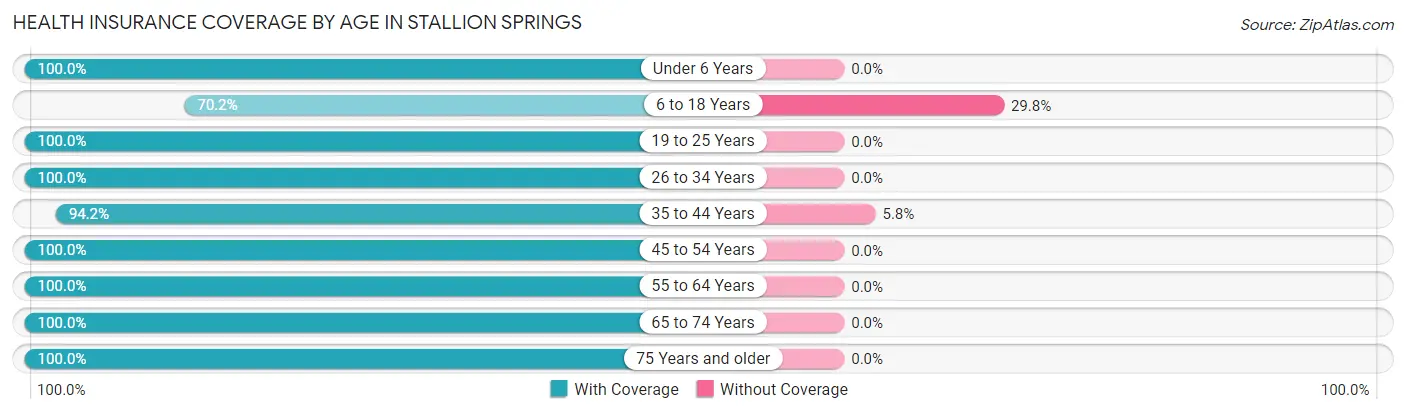
| Age Bracket | With Coverage | Without Coverage |
| Under 6 Years | 95 (100.0%) | 0 (0.0%) |
| 6 to 18 Years | 283 (70.2%) | 120 (29.8%) |
| 19 to 25 Years | 19 (100.0%) | 0 (0.0%) |
| 26 to 34 Years | 146 (100.0%) | 0 (0.0%) |
| 35 to 44 Years | 323 (94.2%) | 20 (5.8%) |
| 45 to 54 Years | 95 (100.0%) | 0 (0.0%) |
| 55 to 64 Years | 521 (100.0%) | 0 (0.0%) |
| 65 to 74 Years | 517 (100.0%) | 0 (0.0%) |
| 75 Years and older | 242 (100.0%) | 0 (0.0%) |
| Total | 2,241 (94.1%) | 140 (5.9%) |
Health Insurance Coverage by Citizenship Status in Stallion Springs
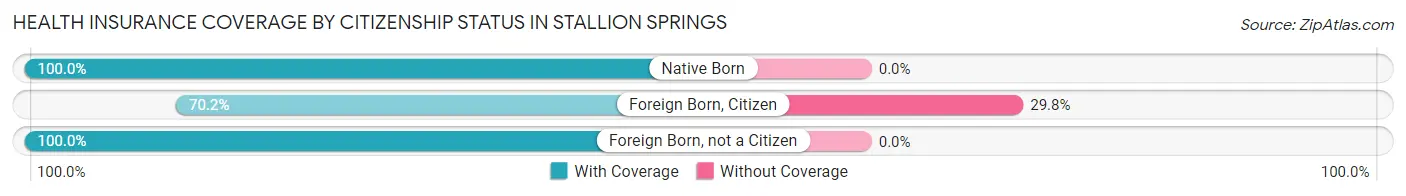
| Citizenship Status | With Coverage | Without Coverage |
| Native Born | 95 (100.0%) | 0 (0.0%) |
| Foreign Born, Citizen | 283 (70.2%) | 120 (29.8%) |
| Foreign Born, not a Citizen | 19 (100.0%) | 0 (0.0%) |
Health Insurance Coverage by Household Income in Stallion Springs
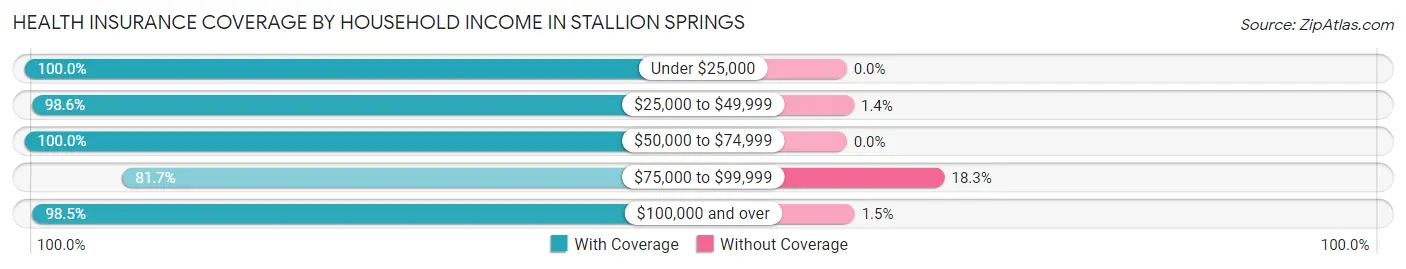
| Household Income | With Coverage | Without Coverage |
| Under $25,000 | 62 (100.0%) | 0 (0.0%) |
| $25,000 to $49,999 | 728 (98.6%) | 10 (1.4%) |
| $50,000 to $74,999 | 251 (100.0%) | 0 (0.0%) |
| $75,000 to $99,999 | 535 (81.7%) | 120 (18.3%) |
| $100,000 and over | 665 (98.5%) | 10 (1.5%) |
Public vs Private Health Insurance Coverage by Age in Stallion Springs
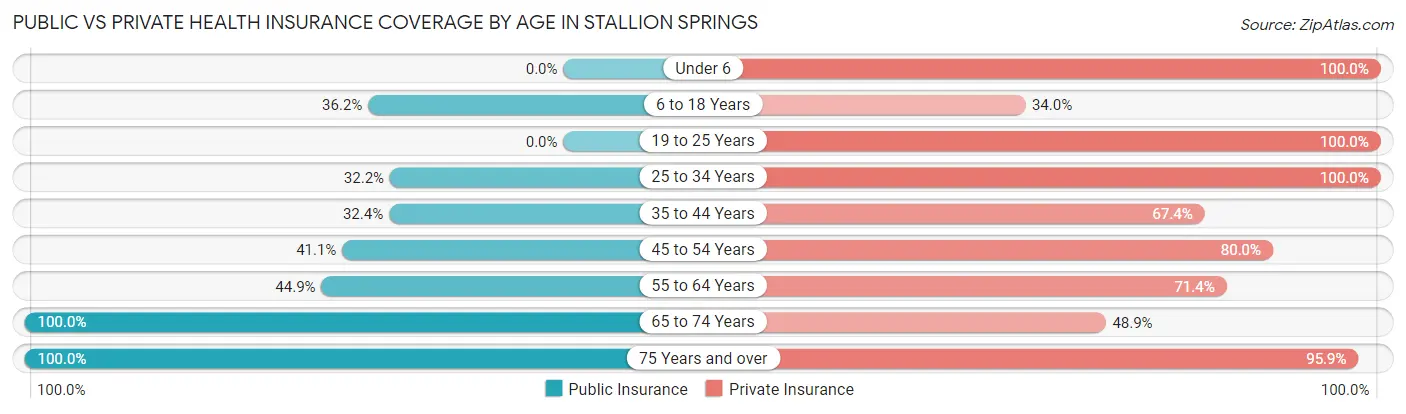
| Age Bracket | Public Insurance | Private Insurance |
| Under 6 | 0 (0.0%) | 95 (100.0%) |
| 6 to 18 Years | 146 (36.2%) | 137 (34.0%) |
| 19 to 25 Years | 0 (0.0%) | 19 (100.0%) |
| 25 to 34 Years | 47 (32.2%) | 146 (100.0%) |
| 35 to 44 Years | 111 (32.4%) | 231 (67.3%) |
| 45 to 54 Years | 39 (41.0%) | 76 (80.0%) |
| 55 to 64 Years | 234 (44.9%) | 372 (71.4%) |
| 65 to 74 Years | 517 (100.0%) | 253 (48.9%) |
| 75 Years and over | 242 (100.0%) | 232 (95.9%) |
| Total | 1,336 (56.1%) | 1,561 (65.6%) |
Disability Status by Sex by Age in Stallion Springs
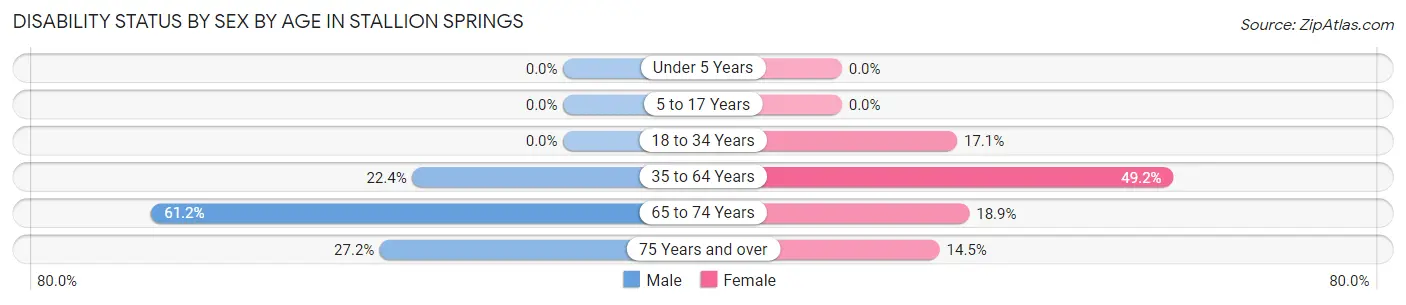
| Age Bracket | Male | Female |
| Under 5 Years | 0 (0.0%) | 0 (0.0%) |
| 5 to 17 Years | 0 (0.0%) | 0 (0.0%) |
| 18 to 34 Years | 0 (0.0%) | 19 (17.1%) |
| 35 to 64 Years | 112 (22.4%) | 226 (49.2%) |
| 65 to 74 Years | 145 (61.2%) | 53 (18.9%) |
| 75 Years and over | 34 (27.2%) | 17 (14.5%) |
Disability Class by Sex by Age in Stallion Springs
Disability Class: Hearing Difficulty
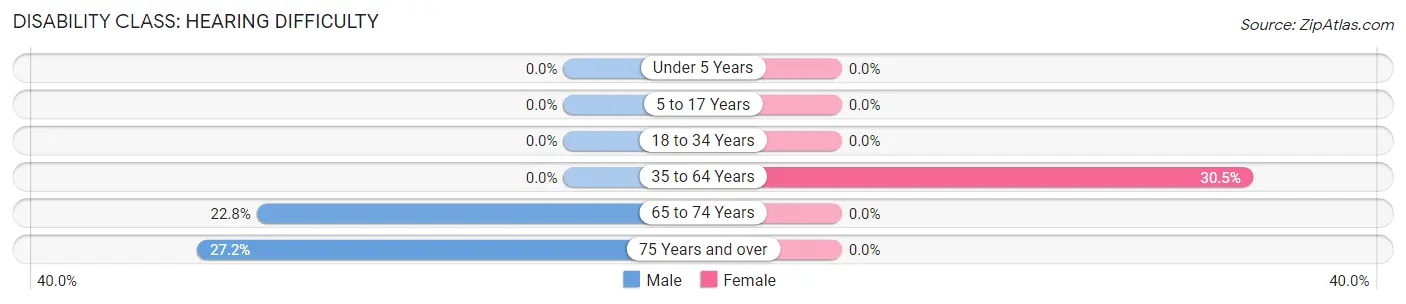
| Age Bracket | Male | Female |
| Under 5 Years | 0 (0.0%) | 0 (0.0%) |
| 5 to 17 Years | 0 (0.0%) | 0 (0.0%) |
| 18 to 34 Years | 0 (0.0%) | 0 (0.0%) |
| 35 to 64 Years | 0 (0.0%) | 140 (30.5%) |
| 65 to 74 Years | 54 (22.8%) | 0 (0.0%) |
| 75 Years and over | 34 (27.2%) | 0 (0.0%) |
Disability Class: Vision Difficulty
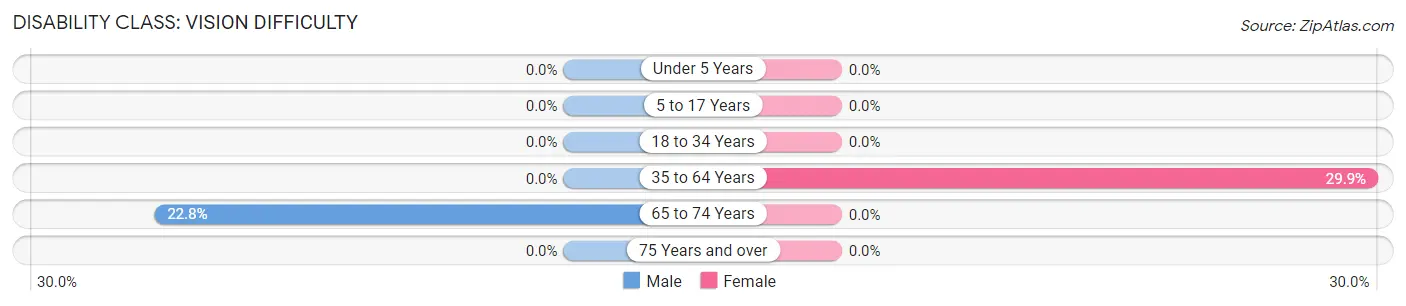
| Age Bracket | Male | Female |
| Under 5 Years | 0 (0.0%) | 0 (0.0%) |
| 5 to 17 Years | 0 (0.0%) | 0 (0.0%) |
| 18 to 34 Years | 0 (0.0%) | 0 (0.0%) |
| 35 to 64 Years | 0 (0.0%) | 137 (29.8%) |
| 65 to 74 Years | 54 (22.8%) | 0 (0.0%) |
| 75 Years and over | 0 (0.0%) | 0 (0.0%) |
Disability Class: Cognitive Difficulty
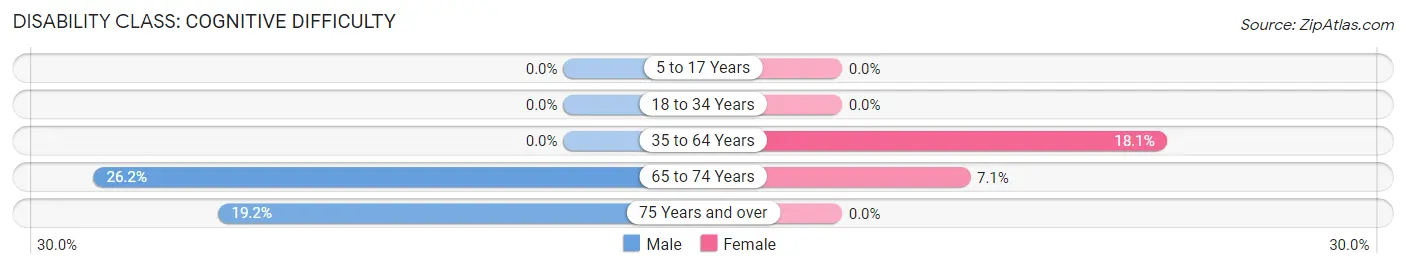
| Age Bracket | Male | Female |
| 5 to 17 Years | 0 (0.0%) | 0 (0.0%) |
| 18 to 34 Years | 0 (0.0%) | 0 (0.0%) |
| 35 to 64 Years | 0 (0.0%) | 83 (18.1%) |
| 65 to 74 Years | 62 (26.2%) | 20 (7.1%) |
| 75 Years and over | 24 (19.2%) | 0 (0.0%) |
Disability Class: Ambulatory Difficulty
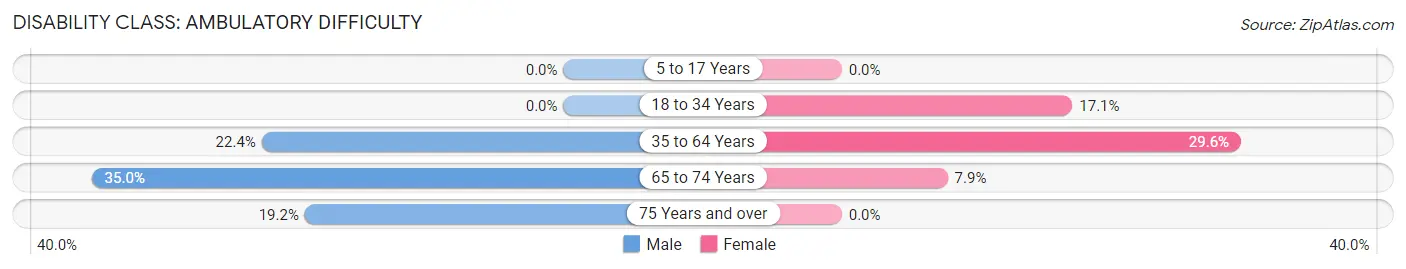
| Age Bracket | Male | Female |
| 5 to 17 Years | 0 (0.0%) | 0 (0.0%) |
| 18 to 34 Years | 0 (0.0%) | 19 (17.1%) |
| 35 to 64 Years | 112 (22.4%) | 136 (29.6%) |
| 65 to 74 Years | 83 (35.0%) | 22 (7.9%) |
| 75 Years and over | 24 (19.2%) | 0 (0.0%) |
Disability Class: Self-Care Difficulty
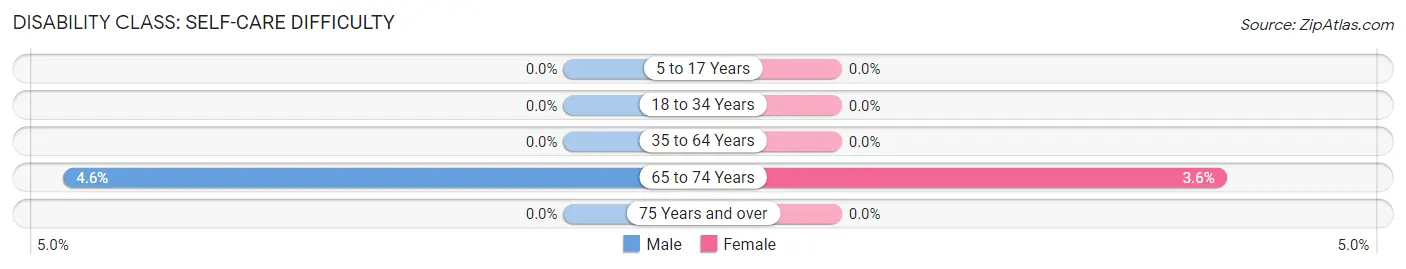
| Age Bracket | Male | Female |
| 5 to 17 Years | 0 (0.0%) | 0 (0.0%) |
| 18 to 34 Years | 0 (0.0%) | 0 (0.0%) |
| 35 to 64 Years | 0 (0.0%) | 0 (0.0%) |
| 65 to 74 Years | 11 (4.6%) | 10 (3.6%) |
| 75 Years and over | 0 (0.0%) | 0 (0.0%) |
Technology Access in Stallion Springs
Computing Device Access in Stallion Springs
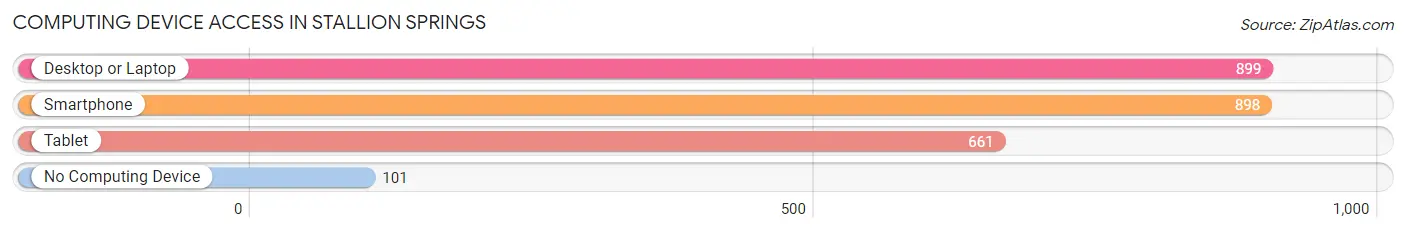
| Device Type | # Households | % Households |
| Desktop or Laptop | 899 | 85.5% |
| Smartphone | 898 | 85.4% |
| Tablet | 661 | 62.8% |
| No Computing Device | 101 | 9.6% |
| Total | 1,052 | 100.0% |
Internet Access in Stallion Springs
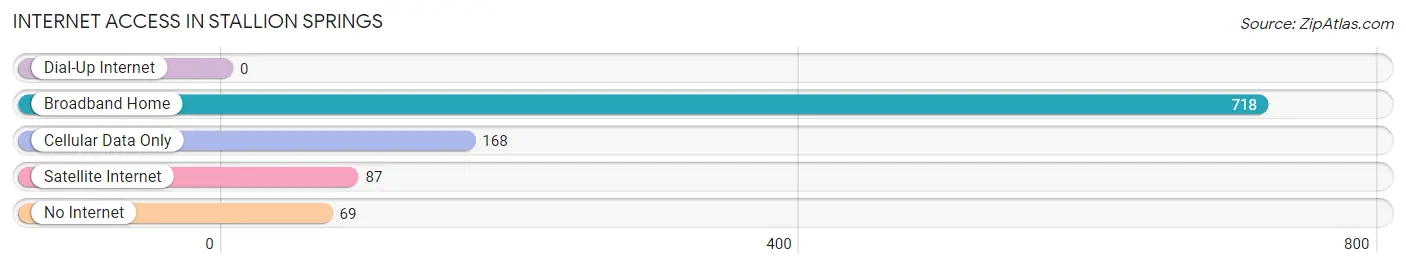
| Internet Type | # Households | % Households |
| Dial-Up Internet | 0 | 0.0% |
| Broadband Home | 718 | 68.2% |
| Cellular Data Only | 168 | 16.0% |
| Satellite Internet | 87 | 8.3% |
| No Internet | 69 | 6.6% |
| Total | 1,052 | 100.0% |
Stallion Springs Summary
Stallion Springs is a small, unincorporated community located in the Tehachapi Mountains of Kern County, California. It is situated at an elevation of 3,845 feet (1,172 m) and is located approximately 25 miles (40 km) east of Bakersfield. The community is home to approximately 1,000 people and is known for its rural atmosphere and scenic views.
History
Stallion Springs was founded in the late 1800s by a group of settlers who were looking for a place to settle and raise their families. The area was originally known as “Stallion Springs Ranch” and was home to a number of ranches and farms. The community was officially incorporated in 1965 and has since grown to include a variety of businesses, including a golf course, a restaurant, and a post office.
Geography
Stallion Springs is located in the Tehachapi Mountains of Kern County, California. The community is situated at an elevation of 3,845 feet (1,172 m) and is located approximately 25 miles (40 km) east of Bakersfield. The area is characterized by rolling hills, open meadows, and oak woodlands. The climate is semi-arid, with hot summers and mild winters.
Economy
Stallion Springs is primarily a residential community, but it does have a few businesses, including a golf course, a restaurant, and a post office. The community is also home to a number of small farms and ranches, which provide employment for many of the residents.
Demographics
As of the 2010 census, the population of Stallion Springs was 1,000. The racial makeup of the community was 94.2% White, 0.7% African American, 0.7% Native American, 0.7% Asian, 0.7% Pacific Islander, and 2.7% from other races. The median household income was $50,000, and the median age was 44.
Conclusion
Stallion Springs is a small, unincorporated community located in the Tehachapi Mountains of Kern County, California. It is situated at an elevation of 3,845 feet (1,172 m) and is located approximately 25 miles (40 km) east of Bakersfield. The community is home to approximately 1,000 people and is known for its rural atmosphere and scenic views. The economy of Stallion Springs is primarily residential, but it does have a few businesses, including a golf course, a restaurant, and a post office. The population of Stallion Springs is primarily White, with a median household income of $50,000 and a median age of 44.
Common Questions
What is Per Capita Income in Stallion Springs?
Per Capita income in Stallion Springs is $37,702.
What is the Median Family Income in Stallion Springs?
Median Family Income in Stallion Springs is $75,380.
What is the Median Household income in Stallion Springs?
Median Household Income in Stallion Springs is $71,765.
What is Income or Wage Gap in Stallion Springs?
Income or Wage Gap in Stallion Springs is 65.0%.
Women in Stallion Springs earn 35.0 cents for every dollar earned by a man.
What is Inequality or Gini Index in Stallion Springs?
Inequality or Gini Index in Stallion Springs is 0.37.
What is the Total Population of Stallion Springs?
Total Population of Stallion Springs is 2,396.
What is the Total Male Population of Stallion Springs?
Total Male Population of Stallion Springs is 1,240.
What is the Total Female Population of Stallion Springs?
Total Female Population of Stallion Springs is 1,156.
What is the Ratio of Males per 100 Females in Stallion Springs?
There are 107.27 Males per 100 Females in Stallion Springs.
What is the Ratio of Females per 100 Males in Stallion Springs?
There are 93.23 Females per 100 Males in Stallion Springs.
What is the Median Population Age in Stallion Springs?
Median Population Age in Stallion Springs is 58.5 Years.
What is the Average Family Size in Stallion Springs
Average Family Size in Stallion Springs is 2.7 People.
What is the Average Household Size in Stallion Springs
Average Household Size in Stallion Springs is 2.3 People.
How Large is the Labor Force in Stallion Springs?
There are 772 People in the Labor Forcein in Stallion Springs.
What is the Percentage of People in the Labor Force in Stallion Springs?
40.0% of People are in the Labor Force in Stallion Springs.
What is the Unemployment Rate in Stallion Springs?
Unemployment Rate in Stallion Springs is 3.7%.