Cities with the Highest Percentage of Population Employed in Architecture & Engineering in Washington
RELATED REPORTS & OPTIONS
Architecture & Engineering
Washington
Compare Cities
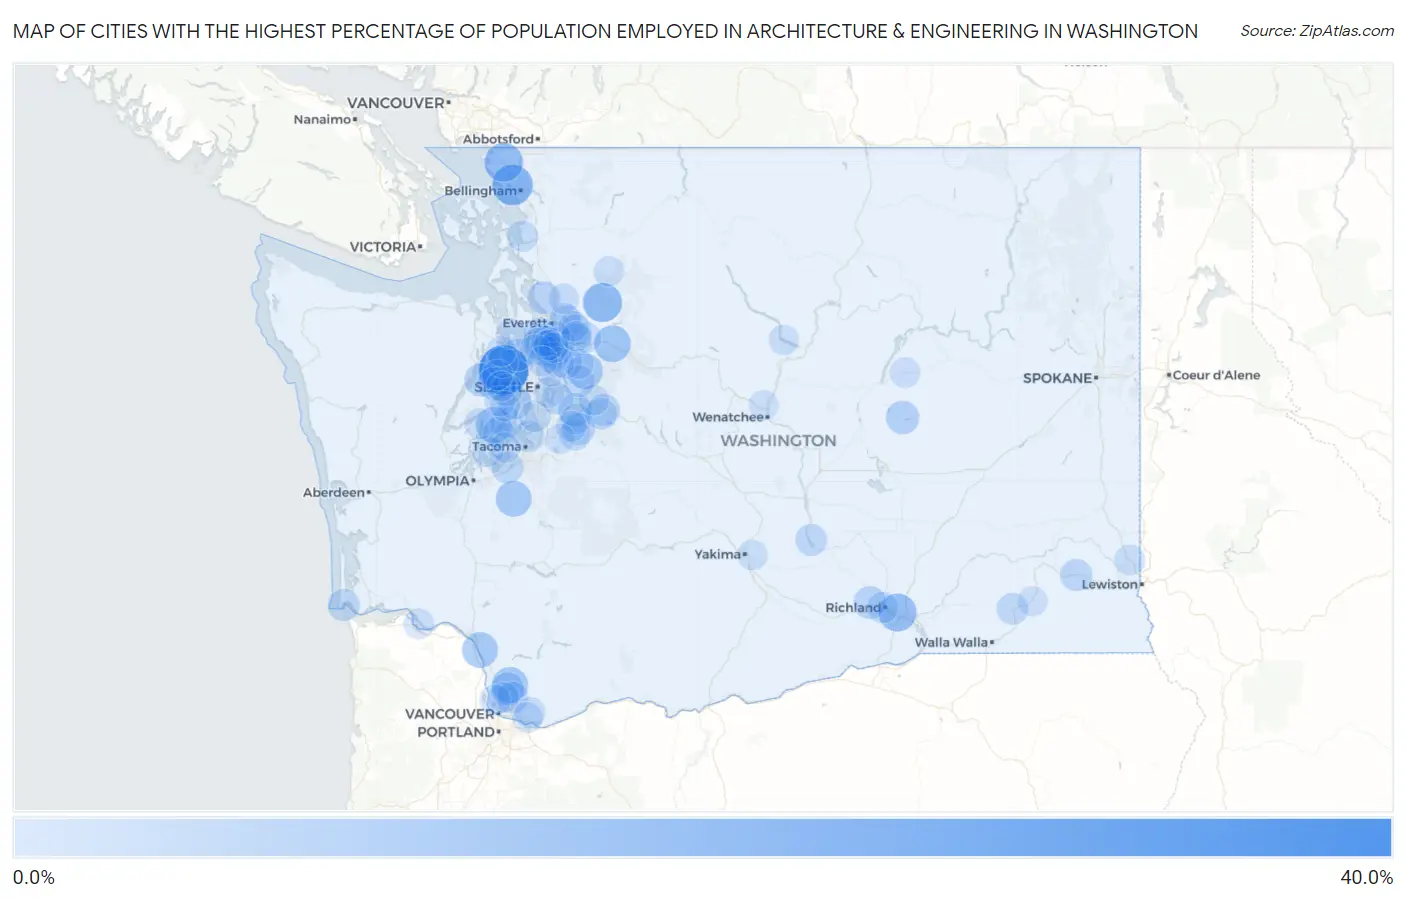
Map of Cities with the Highest Percentage of Population Employed in Architecture & Engineering in Washington
0.0%
40.0%
Cities with the Highest Percentage of Population Employed in Architecture & Engineering in Washington
| City | % Employed | vs State | vs National | |
| 1. | Keyport | 34.3% | 2.8%(+31.5)#1 | 2.1%(+32.2)#48 |
| 2. | Marietta Alderwood | 20.0% | 2.8%(+17.2)#2 | 2.1%(+17.8)#137 |
| 3. | Verlot | 17.7% | 2.8%(+14.9)#3 | 2.1%(+15.6)#162 |
| 4. | Custer | 16.9% | 2.8%(+14.1)#4 | 2.1%(+14.8)#178 |
| 5. | West Pasco | 16.0% | 2.8%(+13.2)#5 | 2.1%(+13.8)#204 |
| 6. | May Creek | 14.1% | 2.8%(+11.3)#6 | 2.1%(+12.0)#262 |
| 7. | Cherry Grove | 12.9% | 2.8%(+10.1)#7 | 2.1%(+10.8)#308 |
| 8. | Stansberry Lake | 12.8% | 2.8%(+9.99)#8 | 2.1%(+10.6)#317 |
| 9. | Mckenna | 12.7% | 2.8%(+9.90)#9 | 2.1%(+10.5)#323 |
| 10. | Kalama | 12.4% | 2.8%(+9.60)#10 | 2.1%(+10.2)#338 |
| 11. | Lake Marcel Stillwater | 12.2% | 2.8%(+9.44)#11 | 2.1%(+10.1)#342 |
| 12. | Pataha | 10.0% | 2.8%(+7.21)#12 | 2.1%(+7.85)#499 |
| 13. | Seabeck | 9.0% | 2.8%(+6.23)#13 | 2.1%(+6.87)#574 |
| 14. | Mirrormont | 9.0% | 2.8%(+6.16)#14 | 2.1%(+6.80)#586 |
| 15. | Wilson Creek | 8.9% | 2.8%(+6.14)#15 | 2.1%(+6.78)#588 |
| 16. | Southworth | 8.8% | 2.8%(+6.05)#16 | 2.1%(+6.69)#601 |
| 17. | West Richland | 8.2% | 2.8%(+5.43)#17 | 2.1%(+6.07)#680 |
| 18. | Dollars Corner | 8.1% | 2.8%(+5.33)#18 | 2.1%(+5.97)#701 |
| 19. | Lake Goodwin | 7.9% | 2.8%(+5.14)#19 | 2.1%(+5.78)#735 |
| 20. | Chico | 7.9% | 2.8%(+5.10)#20 | 2.1%(+5.74)#744 |
| 21. | Erlands Point | 7.7% | 2.8%(+4.93)#21 | 2.1%(+5.57)#765 |
| 22. | Mukilteo | 7.7% | 2.8%(+4.87)#22 | 2.1%(+5.51)#778 |
| 23. | Ravensdale | 7.5% | 2.8%(+4.72)#23 | 2.1%(+5.36)#808 |
| 24. | Kingston | 7.4% | 2.8%(+4.58)#24 | 2.1%(+5.23)#831 |
| 25. | Bothell East | 7.3% | 2.8%(+4.51)#25 | 2.1%(+5.15)#850 |
| 26. | Ilwaco | 7.2% | 2.8%(+4.41)#26 | 2.1%(+5.05)#878 |
| 27. | Enetai | 7.2% | 2.8%(+4.41)#27 | 2.1%(+5.05)#879 |
| 28. | Riverbend | 7.1% | 2.8%(+4.30)#28 | 2.1%(+4.95)#907 |
| 29. | Pomeroy | 7.1% | 2.8%(+4.29)#29 | 2.1%(+4.93)#912 |
| 30. | Picnic Point | 7.0% | 2.8%(+4.25)#30 | 2.1%(+4.89)#918 |
| 31. | North Fort Lewis | 7.0% | 2.8%(+4.19)#31 | 2.1%(+4.84)#933 |
| 32. | Meadowdale | 6.9% | 2.8%(+4.12)#32 | 2.1%(+4.77)#955 |
| 33. | Desert Aire | 6.8% | 2.8%(+4.02)#33 | 2.1%(+4.66)#982 |
| 34. | Cottage Lake | 6.7% | 2.8%(+3.87)#34 | 2.1%(+4.51)#1,004 |
| 35. | Brush Prairie | 6.6% | 2.8%(+3.78)#35 | 2.1%(+4.43)#1,030 |
| 36. | Waitsburg | 6.5% | 2.8%(+3.74)#36 | 2.1%(+4.38)#1,040 |
| 37. | Ames Lake | 6.5% | 2.8%(+3.72)#37 | 2.1%(+4.36)#1,044 |
| 38. | Newcastle | 6.5% | 2.8%(+3.68)#38 | 2.1%(+4.32)#1,056 |
| 39. | Purdy | 6.4% | 2.8%(+3.65)#39 | 2.1%(+4.30)#1,066 |
| 40. | Cavalero | 6.4% | 2.8%(+3.65)#40 | 2.1%(+4.29)#1,070 |
| 41. | Dash Point | 6.4% | 2.8%(+3.59)#41 | 2.1%(+4.23)#1,090 |
| 42. | Monroe North | 6.4% | 2.8%(+3.59)#42 | 2.1%(+4.23)#1,094 |
| 43. | Wilderness Rim | 6.3% | 2.8%(+3.54)#43 | 2.1%(+4.19)#1,107 |
| 44. | Mill Creek | 6.3% | 2.8%(+3.51)#44 | 2.1%(+4.15)#1,116 |
| 45. | Normandy Park | 6.2% | 2.8%(+3.36)#45 | 2.1%(+4.01)#1,178 |
| 46. | Richland | 6.1% | 2.8%(+3.33)#46 | 2.1%(+3.97)#1,190 |
| 47. | Raft Island | 5.9% | 2.8%(+3.14)#47 | 2.1%(+3.78)#1,272 |
| 48. | Silver Firs | 5.9% | 2.8%(+3.11)#48 | 2.1%(+3.75)#1,290 |
| 49. | Clearview | 5.9% | 2.8%(+3.06)#49 | 2.1%(+3.70)#1,314 |
| 50. | Black Diamond | 5.8% | 2.8%(+3.01)#50 | 2.1%(+3.65)#1,340 |
| 51. | Poulsbo | 5.7% | 2.8%(+2.91)#51 | 2.1%(+3.56)#1,393 |
| 52. | Larch Way | 5.7% | 2.8%(+2.90)#52 | 2.1%(+3.54)#1,399 |
| 53. | Longbranch | 5.6% | 2.8%(+2.84)#53 | 2.1%(+3.49)#1,423 |
| 54. | Bay View | 5.6% | 2.8%(+2.83)#54 | 2.1%(+3.48)#1,430 |
| 55. | Lexington | 5.6% | 2.8%(+2.76)#55 | 2.1%(+3.41)#1,467 |
| 56. | Fern Prairie | 5.3% | 2.8%(+2.49)#56 | 2.1%(+3.13)#1,637 |
| 57. | Allyn | 5.3% | 2.8%(+2.47)#57 | 2.1%(+3.11)#1,645 |
| 58. | Hobart | 5.2% | 2.8%(+2.42)#58 | 2.1%(+3.06)#1,687 |
| 59. | Lake Stevens | 5.2% | 2.8%(+2.40)#59 | 2.1%(+3.05)#1,693 |
| 60. | Alderwood Manor | 5.2% | 2.8%(+2.38)#60 | 2.1%(+3.02)#1,718 |
| 61. | Bothell | 5.1% | 2.8%(+2.32)#61 | 2.1%(+2.96)#1,759 |
| 62. | Felida | 5.1% | 2.8%(+2.31)#62 | 2.1%(+2.95)#1,766 |
| 63. | Eastmont | 5.1% | 2.8%(+2.29)#63 | 2.1%(+2.94)#1,772 |
| 64. | Snoqualmie | 5.1% | 2.8%(+2.27)#64 | 2.1%(+2.91)#1,790 |
| 65. | Maple Valley | 5.1% | 2.8%(+2.26)#65 | 2.1%(+2.90)#1,799 |
| 66. | Colton | 5.0% | 2.8%(+2.24)#66 | 2.1%(+2.88)#1,813 |
| 67. | Woodinville | 5.0% | 2.8%(+2.24)#67 | 2.1%(+2.88)#1,814 |
| 68. | Three Lakes | 5.0% | 2.8%(+2.19)#68 | 2.1%(+2.84)#1,846 |
| 69. | Camas | 5.0% | 2.8%(+2.16)#69 | 2.1%(+2.80)#1,866 |
| 70. | Fairwood Cdp King County | 4.9% | 2.8%(+2.15)#70 | 2.1%(+2.80)#1,872 |
| 71. | Mercer Island | 4.9% | 2.8%(+2.11)#71 | 2.1%(+2.75)#1,898 |
| 72. | Crescent Bar | 4.9% | 2.8%(+2.09)#72 | 2.1%(+2.73)#1,913 |
| 73. | Port Orchard | 4.8% | 2.8%(+2.05)#73 | 2.1%(+2.69)#1,949 |
| 74. | Edmonds | 4.8% | 2.8%(+2.04)#74 | 2.1%(+2.68)#1,961 |
| 75. | Hartline | 4.8% | 2.8%(+1.97)#75 | 2.1%(+2.61)#2,009 |
| 76. | Sisco Heights | 4.8% | 2.8%(+1.97)#76 | 2.1%(+2.61)#2,013 |
| 77. | Silverdale | 4.7% | 2.8%(+1.94)#77 | 2.1%(+2.58)#2,027 |
| 78. | Hansville | 4.7% | 2.8%(+1.91)#78 | 2.1%(+2.56)#2,049 |
| 79. | Puget Island | 4.7% | 2.8%(+1.89)#79 | 2.1%(+2.53)#2,074 |
| 80. | Lake Stickney | 4.7% | 2.8%(+1.86)#80 | 2.1%(+2.50)#2,092 |
| 81. | Woods Creek | 4.7% | 2.8%(+1.86)#81 | 2.1%(+2.50)#2,093 |
| 82. | Mount Vista | 4.6% | 2.8%(+1.83)#82 | 2.1%(+2.48)#2,123 |
| 83. | Manson | 4.6% | 2.8%(+1.79)#83 | 2.1%(+2.43)#2,155 |
| 84. | Kirkland | 4.6% | 2.8%(+1.77)#84 | 2.1%(+2.42)#2,168 |
| 85. | Swede Heaven | 4.5% | 2.8%(+1.71)#85 | 2.1%(+2.35)#2,237 |
| 86. | Snohomish | 4.5% | 2.8%(+1.66)#86 | 2.1%(+2.30)#2,263 |
| 87. | Mill Creek East | 4.4% | 2.8%(+1.65)#87 | 2.1%(+2.30)#2,267 |
| 88. | Martha Lake | 4.4% | 2.8%(+1.60)#88 | 2.1%(+2.24)#2,327 |
| 89. | Terrace Heights | 4.4% | 2.8%(+1.59)#89 | 2.1%(+2.23)#2,335 |
| 90. | Bethel | 4.4% | 2.8%(+1.59)#90 | 2.1%(+2.23)#2,337 |
| 91. | Lofall | 4.3% | 2.8%(+1.54)#91 | 2.1%(+2.18)#2,383 |
| 92. | Tracyton | 4.3% | 2.8%(+1.53)#92 | 2.1%(+2.17)#2,390 |
| 93. | Lake Forest Park | 4.3% | 2.8%(+1.47)#93 | 2.1%(+2.11)#2,440 |
| 94. | Fox Island | 4.3% | 2.8%(+1.47)#94 | 2.1%(+2.11)#2,450 |
| 95. | Duvall | 4.2% | 2.8%(+1.42)#95 | 2.1%(+2.06)#2,510 |
| 96. | Chain Lake | 4.1% | 2.8%(+1.36)#96 | 2.1%(+2.00)#2,591 |
| 97. | Sunnyslope | 4.1% | 2.8%(+1.32)#97 | 2.1%(+1.96)#2,638 |
| 98. | Lake Holm | 4.1% | 2.8%(+1.29)#98 | 2.1%(+1.93)#2,670 |
| 99. | Dayton | 4.1% | 2.8%(+1.28)#99 | 2.1%(+1.92)#2,681 |
| 100. | Tehaleh | 4.1% | 2.8%(+1.28)#100 | 2.1%(+1.92)#2,690 |
Common Questions
What are the Top 10 Cities with the Highest Percentage of Population Employed in Architecture & Engineering in Washington?
Top 10 Cities with the Highest Percentage of Population Employed in Architecture & Engineering in Washington are:
#1
34.3%
#2
20.0%
#3
17.7%
#4
16.9%
#5
16.0%
#6
14.1%
#7
12.9%
#8
12.8%
#9
12.7%
#10
12.4%
What city has the Highest Percentage of Population Employed in Architecture & Engineering in Washington?
Keyport has the Highest Percentage of Population Employed in Architecture & Engineering in Washington with 34.3%.
What is the Percentage of Population Employed in Architecture & Engineering in the State of Washington?
Percentage of Population Employed in Architecture & Engineering in Washington is 2.8%.
What is the Percentage of Population Employed in Architecture & Engineering in the United States?
Percentage of Population Employed in Architecture & Engineering in the United States is 2.1%.