Cities with the Highest Percentage of Population Employed in Architecture & Engineering in Idaho
RELATED REPORTS & OPTIONS
Architecture & Engineering
Idaho
Compare Cities
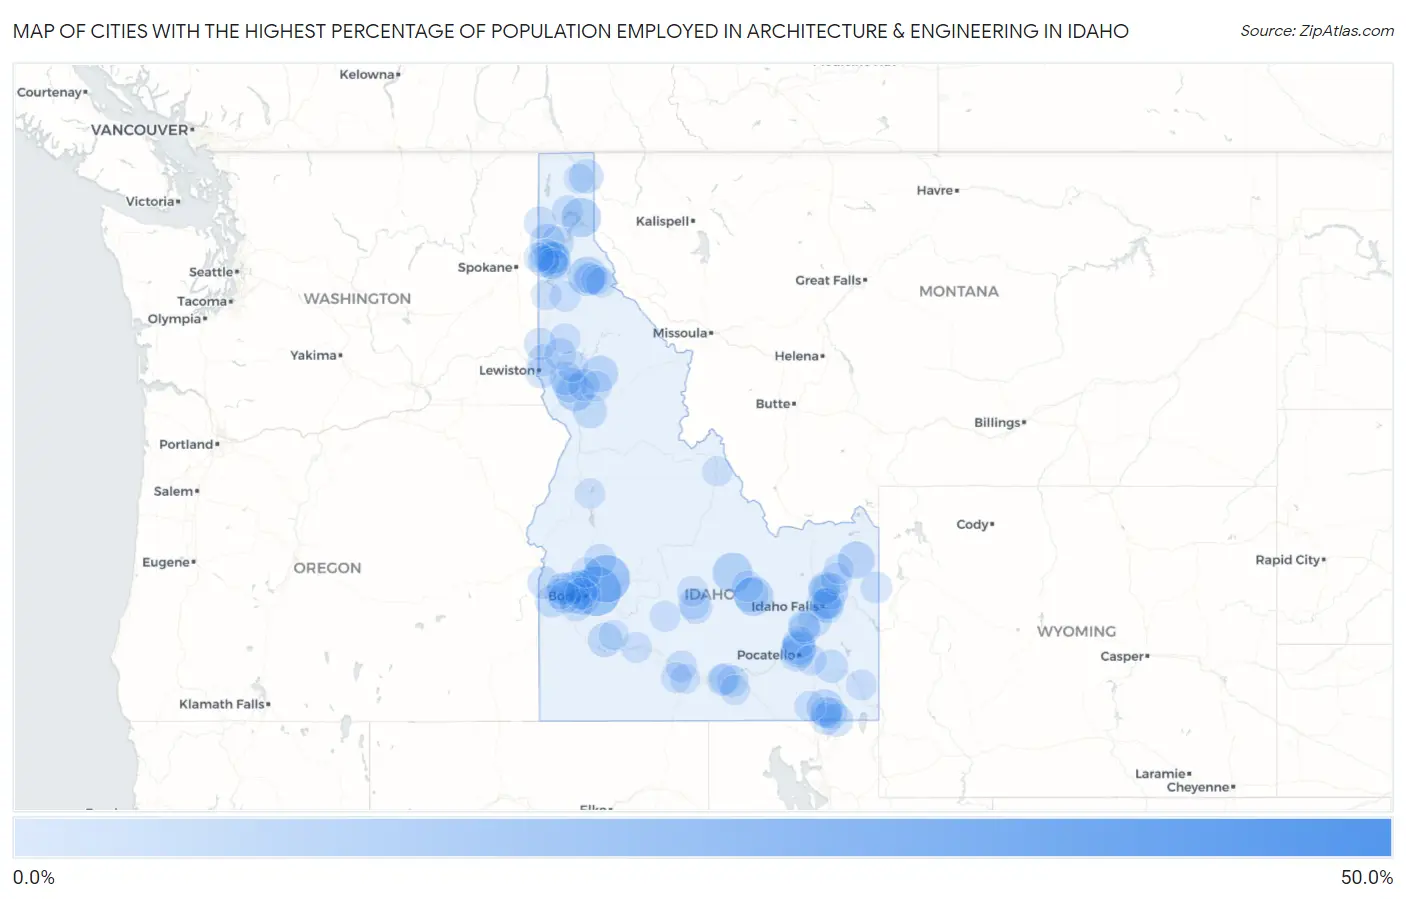
Map of Cities with the Highest Percentage of Population Employed in Architecture & Engineering in Idaho
0.0%
50.0%
Cities with the Highest Percentage of Population Employed in Architecture & Engineering in Idaho
| City | % Employed | vs State | vs National | |
| 1. | Viola | 40.9% | 2.2%(+38.7)#1 | 2.1%(+38.8)#37 |
| 2. | Robie Creek | 15.3% | 2.2%(+13.1)#2 | 2.1%(+13.2)#222 |
| 3. | Idaho City | 13.9% | 2.2%(+11.7)#3 | 2.1%(+11.7)#270 |
| 4. | Mackay | 8.0% | 2.2%(+5.79)#4 | 2.1%(+5.82)#728 |
| 5. | East Hope | 7.5% | 2.2%(+5.35)#5 | 2.1%(+5.38)#805 |
| 6. | Smelterville | 7.5% | 2.2%(+5.33)#6 | 2.1%(+5.36)#807 |
| 7. | Butte City | 7.4% | 2.2%(+5.23)#7 | 2.1%(+5.26)#823 |
| 8. | Ferdinand | 6.2% | 2.2%(+4.07)#8 | 2.1%(+4.10)#1,139 |
| 9. | Ashton | 5.9% | 2.2%(+3.72)#9 | 2.1%(+3.75)#1,288 |
| 10. | Clifton | 5.4% | 2.2%(+3.18)#10 | 2.1%(+3.21)#1,584 |
| 11. | Weippe | 5.3% | 2.2%(+3.08)#11 | 2.1%(+3.11)#1,649 |
| 12. | Rigby | 5.2% | 2.2%(+3.04)#12 | 2.1%(+3.07)#1,681 |
| 13. | Avimor | 5.0% | 2.2%(+2.82)#13 | 2.1%(+2.85)#1,830 |
| 14. | Hidden Springs | 4.6% | 2.2%(+2.46)#14 | 2.1%(+2.49)#2,108 |
| 15. | Craigmont | 4.4% | 2.2%(+2.25)#15 | 2.1%(+2.28)#2,288 |
| 16. | Chubbuck | 4.4% | 2.2%(+2.19)#16 | 2.1%(+2.22)#2,341 |
| 17. | Spirit Lake | 4.3% | 2.2%(+2.12)#17 | 2.1%(+2.15)#2,405 |
| 18. | Arco | 4.0% | 2.2%(+1.77)#18 | 2.1%(+1.80)#2,827 |
| 19. | Boise City | 3.9% | 2.2%(+1.74)#19 | 2.1%(+1.77)#2,871 |
| 20. | Mountain Home Afb | 3.8% | 2.2%(+1.66)#20 | 2.1%(+1.69)#2,968 |
| 21. | Moyie Springs | 3.7% | 2.2%(+1.53)#21 | 2.1%(+1.56)#3,143 |
| 22. | Tyhee | 3.7% | 2.2%(+1.49)#22 | 2.1%(+1.52)#3,223 |
| 23. | Grangeville | 3.6% | 2.2%(+1.41)#23 | 2.1%(+1.44)#3,363 |
| 24. | Dalton Gardens | 3.4% | 2.2%(+1.27)#24 | 2.1%(+1.30)#3,634 |
| 25. | Reubens | 2.9% | 2.2%(+0.762)#25 | 2.1%(+0.792)#4,736 |
| 26. | Franklin | 2.9% | 2.2%(+0.756)#26 | 2.1%(+0.785)#4,745 |
| 27. | Hayden | 2.9% | 2.2%(+0.746)#27 | 2.1%(+0.775)#4,783 |
| 28. | Idaho Falls | 2.9% | 2.2%(+0.694)#28 | 2.1%(+0.724)#4,920 |
| 29. | Bancroft | 2.9% | 2.2%(+0.678)#29 | 2.1%(+0.708)#4,966 |
| 30. | Star | 2.8% | 2.2%(+0.640)#30 | 2.1%(+0.669)#5,056 |
| 31. | Basalt | 2.8% | 2.2%(+0.638)#31 | 2.1%(+0.668)#5,066 |
| 32. | Pocatello | 2.8% | 2.2%(+0.615)#32 | 2.1%(+0.644)#5,136 |
| 33. | Eagle | 2.7% | 2.2%(+0.498)#33 | 2.1%(+0.527)#5,505 |
| 34. | Athol | 2.6% | 2.2%(+0.470)#34 | 2.1%(+0.500)#5,582 |
| 35. | Kuna | 2.4% | 2.2%(+0.271)#35 | 2.1%(+0.300)#6,195 |
| 36. | Fort Hall | 2.4% | 2.2%(+0.270)#36 | 2.1%(+0.300)#6,196 |
| 37. | Hayden Lake | 2.4% | 2.2%(+0.227)#37 | 2.1%(+0.256)#6,362 |
| 38. | Parma | 2.4% | 2.2%(+0.212)#38 | 2.1%(+0.241)#6,414 |
| 39. | Marsing | 2.3% | 2.2%(+0.151)#39 | 2.1%(+0.181)#6,625 |
| 40. | Meridian | 2.3% | 2.2%(+0.100)#40 | 2.1%(+0.130)#6,813 |
| 41. | Garden Valley | 2.2% | 2.2%(+0.052)#41 | 2.1%(+0.081)#7,002 |
| 42. | Bellevue | 2.2% | 2.2%(+0.051)#42 | 2.1%(+0.081)#7,003 |
| 43. | Iona | 2.2% | 2.2%(+0.001)#43 | 2.1%(+0.031)#7,206 |
| 44. | Moscow | 2.2% | 2.2%(-0.018)#44 | 2.1%(+0.012)#7,287 |
| 45. | Rathdrum | 2.1% | 2.2%(-0.054)#45 | 2.1%(-0.024)#7,414 |
| 46. | Ammon | 2.1% | 2.2%(-0.095)#46 | 2.1%(-0.065)#7,585 |
| 47. | Oldtown | 2.1% | 2.2%(-0.106)#47 | 2.1%(-0.077)#7,641 |
| 48. | Middleton | 2.0% | 2.2%(-0.131)#48 | 2.1%(-0.102)#7,756 |
| 49. | Nampa | 2.0% | 2.2%(-0.170)#49 | 2.1%(-0.140)#7,899 |
| 50. | Blackfoot | 2.0% | 2.2%(-0.180)#50 | 2.1%(-0.150)#7,937 |
| 51. | Menan | 2.0% | 2.2%(-0.185)#51 | 2.1%(-0.156)#7,950 |
| 52. | Weston | 2.0% | 2.2%(-0.189)#52 | 2.1%(-0.159)#7,965 |
| 53. | Heyburn | 2.0% | 2.2%(-0.218)#53 | 2.1%(-0.188)#8,061 |
| 54. | Preston | 1.9% | 2.2%(-0.251)#54 | 2.1%(-0.221)#8,181 |
| 55. | Nezperce | 1.9% | 2.2%(-0.280)#55 | 2.1%(-0.250)#8,322 |
| 56. | Garden City | 1.9% | 2.2%(-0.288)#56 | 2.1%(-0.259)#8,349 |
| 57. | Fernan Lake Village | 1.9% | 2.2%(-0.327)#57 | 2.1%(-0.297)#8,538 |
| 58. | Groveland | 1.8% | 2.2%(-0.335)#58 | 2.1%(-0.306)#8,566 |
| 59. | Kellogg | 1.8% | 2.2%(-0.344)#59 | 2.1%(-0.314)#8,599 |
| 60. | Dayton | 1.8% | 2.2%(-0.344)#60 | 2.1%(-0.314)#8,603 |
| 61. | Genesee | 1.8% | 2.2%(-0.347)#61 | 2.1%(-0.318)#8,617 |
| 62. | Driggs | 1.8% | 2.2%(-0.412)#62 | 2.1%(-0.382)#8,906 |
| 63. | Kootenai | 1.7% | 2.2%(-0.481)#63 | 2.1%(-0.451)#9,237 |
| 64. | Declo | 1.7% | 2.2%(-0.484)#64 | 2.1%(-0.454)#9,258 |
| 65. | Post Falls | 1.7% | 2.2%(-0.490)#65 | 2.1%(-0.460)#9,291 |
| 66. | Hailey | 1.7% | 2.2%(-0.492)#66 | 2.1%(-0.463)#9,298 |
| 67. | Lewiston | 1.7% | 2.2%(-0.494)#67 | 2.1%(-0.464)#9,304 |
| 68. | Kendrick | 1.6% | 2.2%(-0.539)#68 | 2.1%(-0.510)#9,518 |
| 69. | Moore | 1.6% | 2.2%(-0.539)#69 | 2.1%(-0.510)#9,522 |
| 70. | Lewisville | 1.6% | 2.2%(-0.566)#70 | 2.1%(-0.536)#9,662 |
| 71. | Jerome | 1.6% | 2.2%(-0.589)#71 | 2.1%(-0.560)#9,763 |
| 72. | Burley | 1.5% | 2.2%(-0.631)#72 | 2.1%(-0.602)#9,977 |
| 73. | Rexburg | 1.5% | 2.2%(-0.654)#73 | 2.1%(-0.625)#10,106 |
| 74. | Lincoln | 1.5% | 2.2%(-0.680)#74 | 2.1%(-0.650)#10,202 |
| 75. | Coeur D Alene | 1.5% | 2.2%(-0.694)#75 | 2.1%(-0.665)#10,280 |
| 76. | Peck | 1.4% | 2.2%(-0.729)#76 | 2.1%(-0.700)#10,480 |
| 77. | Kamiah | 1.4% | 2.2%(-0.790)#77 | 2.1%(-0.760)#10,786 |
| 78. | Caldwell | 1.4% | 2.2%(-0.824)#78 | 2.1%(-0.794)#10,954 |
| 79. | Glenns Ferry | 1.3% | 2.2%(-0.868)#79 | 2.1%(-0.838)#11,212 |
| 80. | Inkom | 1.3% | 2.2%(-0.906)#80 | 2.1%(-0.877)#11,396 |
| 81. | Wardner | 1.2% | 2.2%(-0.995)#81 | 2.1%(-0.966)#11,869 |
| 82. | Georgetown | 1.2% | 2.2%(-1.01)#82 | 2.1%(-0.983)#11,950 |
| 83. | St Maries | 1.1% | 2.2%(-1.06)#83 | 2.1%(-1.03)#12,155 |
| 84. | Fairfield | 1.1% | 2.2%(-1.06)#84 | 2.1%(-1.03)#12,192 |
| 85. | Malad City | 1.1% | 2.2%(-1.06)#85 | 2.1%(-1.03)#12,198 |
| 86. | Deary | 1.1% | 2.2%(-1.10)#86 | 2.1%(-1.07)#12,385 |
| 87. | Sun Valley | 1.0% | 2.2%(-1.14)#87 | 2.1%(-1.11)#12,636 |
| 88. | Filer | 0.98% | 2.2%(-1.19)#88 | 2.1%(-1.16)#12,922 |
| 89. | Wallace | 0.90% | 2.2%(-1.28)#89 | 2.1%(-1.25)#13,378 |
| 90. | Mountain Home | 0.81% | 2.2%(-1.37)#90 | 2.1%(-1.34)#13,929 |
| 91. | Mccall | 0.80% | 2.2%(-1.38)#91 | 2.1%(-1.35)#13,987 |
| 92. | Osburn | 0.80% | 2.2%(-1.38)#92 | 2.1%(-1.35)#14,004 |
| 93. | Horseshoe Bend | 0.79% | 2.2%(-1.39)#93 | 2.1%(-1.36)#14,053 |
| 94. | Plummer | 0.74% | 2.2%(-1.44)#94 | 2.1%(-1.41)#14,340 |
| 95. | Parker | 0.69% | 2.2%(-1.49)#95 | 2.1%(-1.46)#14,634 |
| 96. | Albion | 0.68% | 2.2%(-1.50)#96 | 2.1%(-1.47)#14,677 |
| 97. | Salmon | 0.66% | 2.2%(-1.51)#97 | 2.1%(-1.49)#14,766 |
| 98. | Twin Falls | 0.63% | 2.2%(-1.55)#98 | 2.1%(-1.52)#14,939 |
| 99. | Bonners Ferry | 0.60% | 2.2%(-1.58)#99 | 2.1%(-1.55)#15,099 |
| 100. | Hauser | 0.57% | 2.2%(-1.60)#100 | 2.1%(-1.57)#15,218 |
Common Questions
What are the Top 10 Cities with the Highest Percentage of Population Employed in Architecture & Engineering in Idaho?
Top 10 Cities with the Highest Percentage of Population Employed in Architecture & Engineering in Idaho are:
#1
15.3%
#2
13.9%
#3
8.0%
#4
7.5%
#5
7.5%
#6
7.4%
#7
6.2%
#8
5.9%
#9
5.4%
#10
5.3%
What city has the Highest Percentage of Population Employed in Architecture & Engineering in Idaho?
Robie Creek has the Highest Percentage of Population Employed in Architecture & Engineering in Idaho with 15.3%.
What is the Percentage of Population Employed in Architecture & Engineering in the State of Idaho?
Percentage of Population Employed in Architecture & Engineering in Idaho is 2.2%.
What is the Percentage of Population Employed in Architecture & Engineering in the United States?
Percentage of Population Employed in Architecture & Engineering in the United States is 2.1%.