Cities with the Highest Percentage of Population Employed in Architecture & Engineering in Indiana
RELATED REPORTS & OPTIONS
Architecture & Engineering
Indiana
Compare Cities
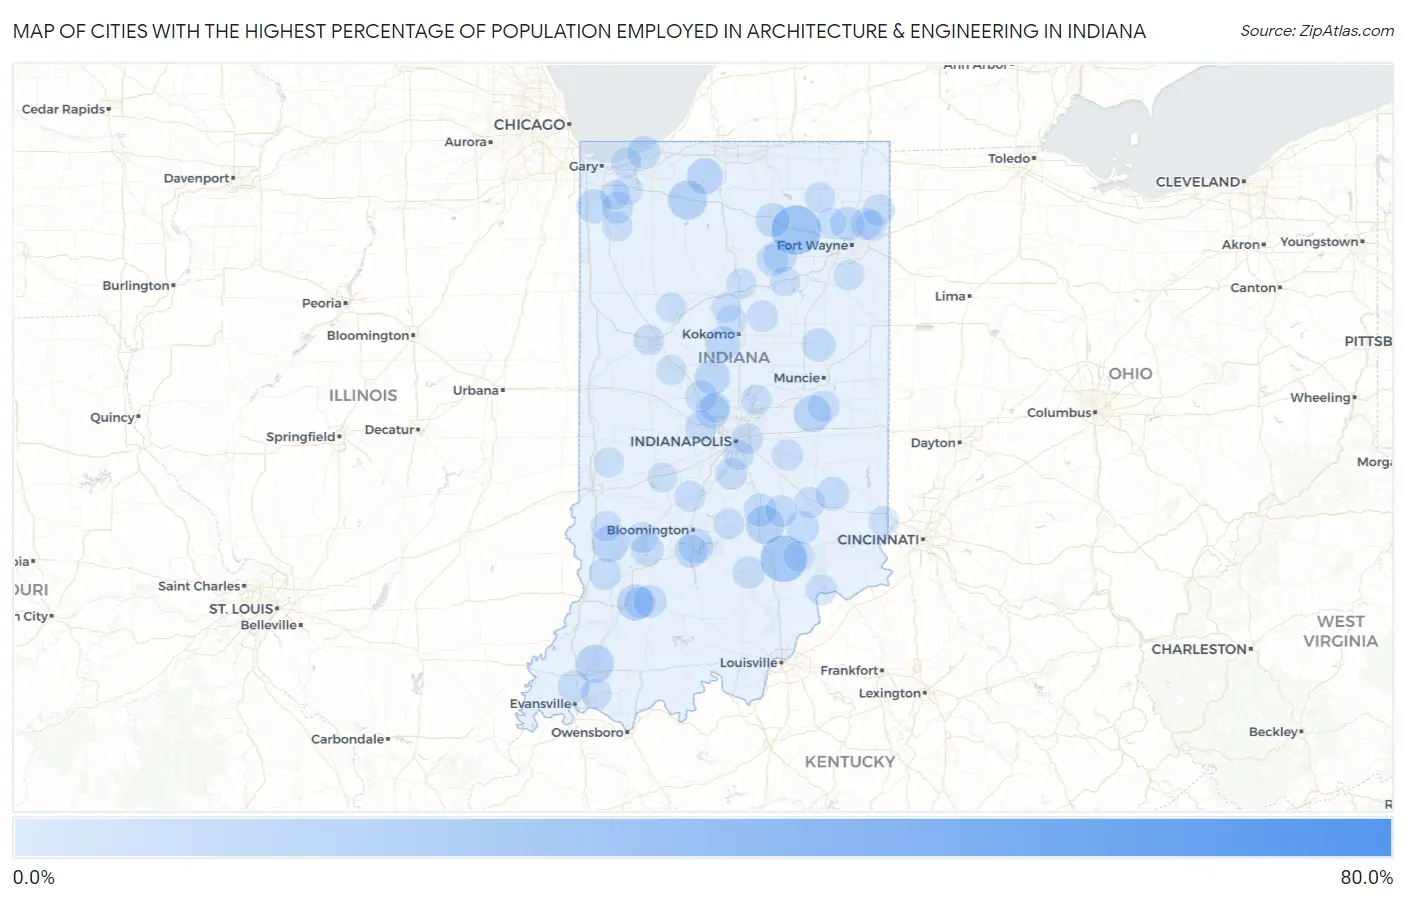
Map of Cities with the Highest Percentage of Population Employed in Architecture & Engineering in Indiana
0.0%
80.0%
Cities with the Highest Percentage of Population Employed in Architecture & Engineering in Indiana
| City | % Employed | vs State | vs National | |
| 1. | Lake Cicott | 67.6% | 2.2%(+65.4)#1 | 2.1%(+65.5)#15 |
| 2. | Linnsburg | 52.6% | 2.2%(+50.4)#2 | 2.1%(+50.5)#25 |
| 3. | Craigville | 34.9% | 2.2%(+32.7)#3 | 2.1%(+32.8)#47 |
| 4. | Rob Roy | 31.8% | 2.2%(+29.6)#4 | 2.1%(+29.7)#54 |
| 5. | Beaver Dam | 25.9% | 2.2%(+23.7)#5 | 2.1%(+23.8)#80 |
| 6. | Fair Oaks | 25.0% | 2.2%(+22.8)#6 | 2.1%(+22.9)#85 |
| 7. | East Oolitic | 24.1% | 2.2%(+21.9)#7 | 2.1%(+22.0)#93 |
| 8. | Larwill | 23.8% | 2.2%(+21.6)#8 | 2.1%(+21.7)#96 |
| 9. | Otter Lake | 21.1% | 2.2%(+18.9)#9 | 2.1%(+19.0)#122 |
| 10. | Hayden | 20.9% | 2.2%(+18.7)#10 | 2.1%(+18.7)#125 |
| 11. | Brimfield | 19.3% | 2.2%(+17.1)#11 | 2.1%(+17.1)#143 |
| 12. | Hoffman Lake | 17.2% | 2.2%(+15.0)#12 | 2.1%(+15.0)#171 |
| 13. | Ireland | 15.9% | 2.2%(+13.7)#13 | 2.1%(+13.7)#207 |
| 14. | St. Anthony | 15.8% | 2.2%(+13.6)#14 | 2.1%(+13.7)#208 |
| 15. | Nineveh | 13.7% | 2.2%(+11.4)#15 | 2.1%(+11.5)#280 |
| 16. | Hamlet | 13.0% | 2.2%(+10.8)#16 | 2.1%(+10.9)#303 |
| 17. | Columbus | 12.1% | 2.2%(+9.89)#17 | 2.1%(+9.96)#348 |
| 18. | Mackey | 11.5% | 2.2%(+9.32)#18 | 2.1%(+9.39)#387 |
| 19. | Cadiz | 10.9% | 2.2%(+8.69)#19 | 2.1%(+8.76)#429 |
| 20. | Dugger | 10.1% | 2.2%(+7.91)#20 | 2.1%(+7.98)#485 |
| 21. | North Liberty | 9.9% | 2.2%(+7.73)#21 | 2.1%(+7.80)#503 |
| 22. | Newbern | 9.6% | 2.2%(+7.35)#22 | 2.1%(+7.43)#531 |
| 23. | Montgomery | 9.5% | 2.2%(+7.31)#23 | 2.1%(+7.38)#534 |
| 24. | Kirklin | 9.2% | 2.2%(+6.94)#24 | 2.1%(+7.01)#558 |
| 25. | Flat Rock | 9.1% | 2.2%(+6.87)#25 | 2.1%(+6.94)#564 |
| 26. | Benton | 8.4% | 2.2%(+6.18)#26 | 2.1%(+6.25)#653 |
| 27. | Russiaville | 8.4% | 2.2%(+6.14)#27 | 2.1%(+6.21)#657 |
| 28. | Duneland Beach | 8.3% | 2.2%(+6.11)#28 | 2.1%(+6.18)#661 |
| 29. | Smithville Sanders | 8.2% | 2.2%(+6.02)#29 | 2.1%(+6.09)#675 |
| 30. | Lake Dalecarlia | 8.1% | 2.2%(+5.90)#30 | 2.1%(+5.98)#700 |
| 31. | Warsaw | 7.8% | 2.2%(+5.56)#31 | 2.1%(+5.63)#756 |
| 32. | Harrison Lake | 7.8% | 2.2%(+5.54)#32 | 2.1%(+5.61)#760 |
| 33. | Tippecanoe | 7.7% | 2.2%(+5.52)#33 | 2.1%(+5.59)#764 |
| 34. | Huntertown | 7.7% | 2.2%(+5.45)#34 | 2.1%(+5.53)#776 |
| 35. | Whitestown | 7.5% | 2.2%(+5.32)#35 | 2.1%(+5.40)#804 |
| 36. | Hessen Cassel | 7.3% | 2.2%(+5.11)#36 | 2.1%(+5.18)#839 |
| 37. | North Manchester | 7.2% | 2.2%(+5.02)#37 | 2.1%(+5.09)#862 |
| 38. | Lake Santee | 7.2% | 2.2%(+5.00)#38 | 2.1%(+5.07)#869 |
| 39. | Shamrock Lakes | 7.1% | 2.2%(+4.92)#39 | 2.1%(+4.99)#892 |
| 40. | Westport | 6.9% | 2.2%(+4.70)#40 | 2.1%(+4.77)#952 |
| 41. | Harrodsburg | 6.7% | 2.2%(+4.51)#41 | 2.1%(+4.59)#992 |
| 42. | Taylorsville | 6.6% | 2.2%(+4.38)#42 | 2.1%(+4.45)#1,021 |
| 43. | Merriam | 6.6% | 2.2%(+4.35)#43 | 2.1%(+4.42)#1,031 |
| 44. | Beverly Shores | 6.5% | 2.2%(+4.33)#44 | 2.1%(+4.40)#1,037 |
| 45. | Loogootee | 6.4% | 2.2%(+4.15)#45 | 2.1%(+4.22)#1,096 |
| 46. | Underwood | 6.3% | 2.2%(+4.09)#46 | 2.1%(+4.16)#1,112 |
| 47. | Bloomfield | 5.9% | 2.2%(+3.67)#47 | 2.1%(+3.74)#1,293 |
| 48. | Brownstown | 5.9% | 2.2%(+3.66)#48 | 2.1%(+3.73)#1,304 |
| 49. | Freelandville | 5.8% | 2.2%(+3.56)#49 | 2.1%(+3.64)#1,346 |
| 50. | Darmstadt | 5.8% | 2.2%(+3.56)#50 | 2.1%(+3.63)#1,348 |
| 51. | Leo Cedarville | 5.7% | 2.2%(+3.49)#51 | 2.1%(+3.56)#1,391 |
| 52. | Ulen | 5.7% | 2.2%(+3.44)#52 | 2.1%(+3.51)#1,412 |
| 53. | St Joe | 5.6% | 2.2%(+3.36)#53 | 2.1%(+3.44)#1,456 |
| 54. | Hope | 5.6% | 2.2%(+3.35)#54 | 2.1%(+3.42)#1,462 |
| 55. | Floyds Knobs | 5.5% | 2.2%(+3.28)#55 | 2.1%(+3.35)#1,506 |
| 56. | Cannelburg | 5.5% | 2.2%(+3.23)#56 | 2.1%(+3.31)#1,529 |
| 57. | Pleasant View | 5.5% | 2.2%(+3.23)#57 | 2.1%(+3.30)#1,532 |
| 58. | Laketon | 5.4% | 2.2%(+3.17)#58 | 2.1%(+3.24)#1,569 |
| 59. | Bargersville | 5.2% | 2.2%(+3.02)#59 | 2.1%(+3.10)#1,668 |
| 60. | Pittsboro | 5.2% | 2.2%(+3.01)#60 | 2.1%(+3.08)#1,677 |
| 61. | Hebron | 5.1% | 2.2%(+2.90)#61 | 2.1%(+2.97)#1,751 |
| 62. | Morristown | 5.1% | 2.2%(+2.87)#62 | 2.1%(+2.95)#1,767 |
| 63. | Mount Summit | 5.1% | 2.2%(+2.84)#63 | 2.1%(+2.91)#1,789 |
| 64. | Amboy | 5.0% | 2.2%(+2.75)#64 | 2.1%(+2.82)#1,857 |
| 65. | Lake Of The Woods | 4.8% | 2.2%(+2.54)#65 | 2.1%(+2.61)#2,004 |
| 66. | Greensburg | 4.7% | 2.2%(+2.46)#66 | 2.1%(+2.54)#2,067 |
| 67. | Nashville | 4.6% | 2.2%(+2.34)#67 | 2.1%(+2.42)#2,164 |
| 68. | Paragon | 4.5% | 2.2%(+2.32)#68 | 2.1%(+2.40)#2,188 |
| 69. | Worthington | 4.5% | 2.2%(+2.32)#69 | 2.1%(+2.39)#2,198 |
| 70. | Vernon | 4.5% | 2.2%(+2.29)#70 | 2.1%(+2.36)#2,228 |
| 71. | Madison | 4.5% | 2.2%(+2.23)#71 | 2.1%(+2.31)#2,259 |
| 72. | Hymera | 4.4% | 2.2%(+2.17)#72 | 2.1%(+2.24)#2,321 |
| 73. | Foxcliff Estates | 4.4% | 2.2%(+2.16)#73 | 2.1%(+2.24)#2,331 |
| 74. | Warren Park | 4.4% | 2.2%(+2.14)#74 | 2.1%(+2.21)#2,351 |
| 75. | Albion | 4.3% | 2.2%(+2.08)#75 | 2.1%(+2.15)#2,400 |
| 76. | Mineral Springs | 4.3% | 2.2%(+2.08)#76 | 2.1%(+2.15)#2,406 |
| 77. | Chandler | 4.2% | 2.2%(+1.99)#77 | 2.1%(+2.06)#2,504 |
| 78. | Noblesville | 4.1% | 2.2%(+1.89)#78 | 2.1%(+1.97)#2,633 |
| 79. | West Lafayette | 4.1% | 2.2%(+1.85)#79 | 2.1%(+1.92)#2,683 |
| 80. | Ossian | 4.0% | 2.2%(+1.79)#80 | 2.1%(+1.86)#2,761 |
| 81. | Mexico | 3.9% | 2.2%(+1.66)#81 | 2.1%(+1.74)#2,917 |
| 82. | De Motte | 3.8% | 2.2%(+1.61)#82 | 2.1%(+1.69)#2,969 |
| 83. | Pleasant Lake | 3.8% | 2.2%(+1.61)#83 | 2.1%(+1.68)#2,980 |
| 84. | Bright | 3.8% | 2.2%(+1.58)#84 | 2.1%(+1.65)#3,021 |
| 85. | Zionsville | 3.8% | 2.2%(+1.58)#85 | 2.1%(+1.65)#3,027 |
| 86. | Rosedale | 3.8% | 2.2%(+1.56)#86 | 2.1%(+1.63)#3,048 |
| 87. | Burns Harbor | 3.8% | 2.2%(+1.55)#87 | 2.1%(+1.62)#3,063 |
| 88. | Aberdeen | 3.8% | 2.2%(+1.54)#88 | 2.1%(+1.62)#3,066 |
| 89. | Grabill | 3.8% | 2.2%(+1.53)#89 | 2.1%(+1.61)#3,086 |
| 90. | Clarks Hill | 3.7% | 2.2%(+1.49)#90 | 2.1%(+1.57)#3,140 |
| 91. | Homecroft | 3.7% | 2.2%(+1.46)#91 | 2.1%(+1.53)#3,211 |
| 92. | Cloverdale | 3.7% | 2.2%(+1.44)#92 | 2.1%(+1.51)#3,247 |
| 93. | Everton | 3.6% | 2.2%(+1.41)#93 | 2.1%(+1.49)#3,282 |
| 94. | Lakes Of The Four Seasons | 3.6% | 2.2%(+1.36)#94 | 2.1%(+1.44)#3,364 |
| 95. | Yeoman | 3.6% | 2.2%(+1.35)#95 | 2.1%(+1.42)#3,397 |
| 96. | Galveston | 3.6% | 2.2%(+1.34)#96 | 2.1%(+1.41)#3,418 |
| 97. | Lagro | 3.6% | 2.2%(+1.33)#97 | 2.1%(+1.40)#3,434 |
| 98. | Walton | 3.5% | 2.2%(+1.31)#98 | 2.1%(+1.39)#3,465 |
| 99. | Churubusco | 3.5% | 2.2%(+1.29)#99 | 2.1%(+1.36)#3,520 |
| 100. | Jimmerson Lake | 3.5% | 2.2%(+1.27)#100 | 2.1%(+1.35)#3,539 |
Common Questions
What are the Top 10 Cities with the Highest Percentage of Population Employed in Architecture & Engineering in Indiana?
Top 10 Cities with the Highest Percentage of Population Employed in Architecture & Engineering in Indiana are:
#1
23.8%
#2
20.9%
#3
13.0%
#4
12.1%
#5
11.5%
#6
10.9%
#7
10.1%
#8
9.9%
#9
9.5%
#10
9.2%
What city has the Highest Percentage of Population Employed in Architecture & Engineering in Indiana?
Larwill has the Highest Percentage of Population Employed in Architecture & Engineering in Indiana with 23.8%.
What is the Percentage of Population Employed in Architecture & Engineering in the State of Indiana?
Percentage of Population Employed in Architecture & Engineering in Indiana is 2.2%.
What is the Percentage of Population Employed in Architecture & Engineering in the United States?
Percentage of Population Employed in Architecture & Engineering in the United States is 2.1%.