Cities with the Highest Percentage of Population Employed in Architecture & Engineering in Georgia
RELATED REPORTS & OPTIONS
Architecture & Engineering
Georgia
Compare Cities
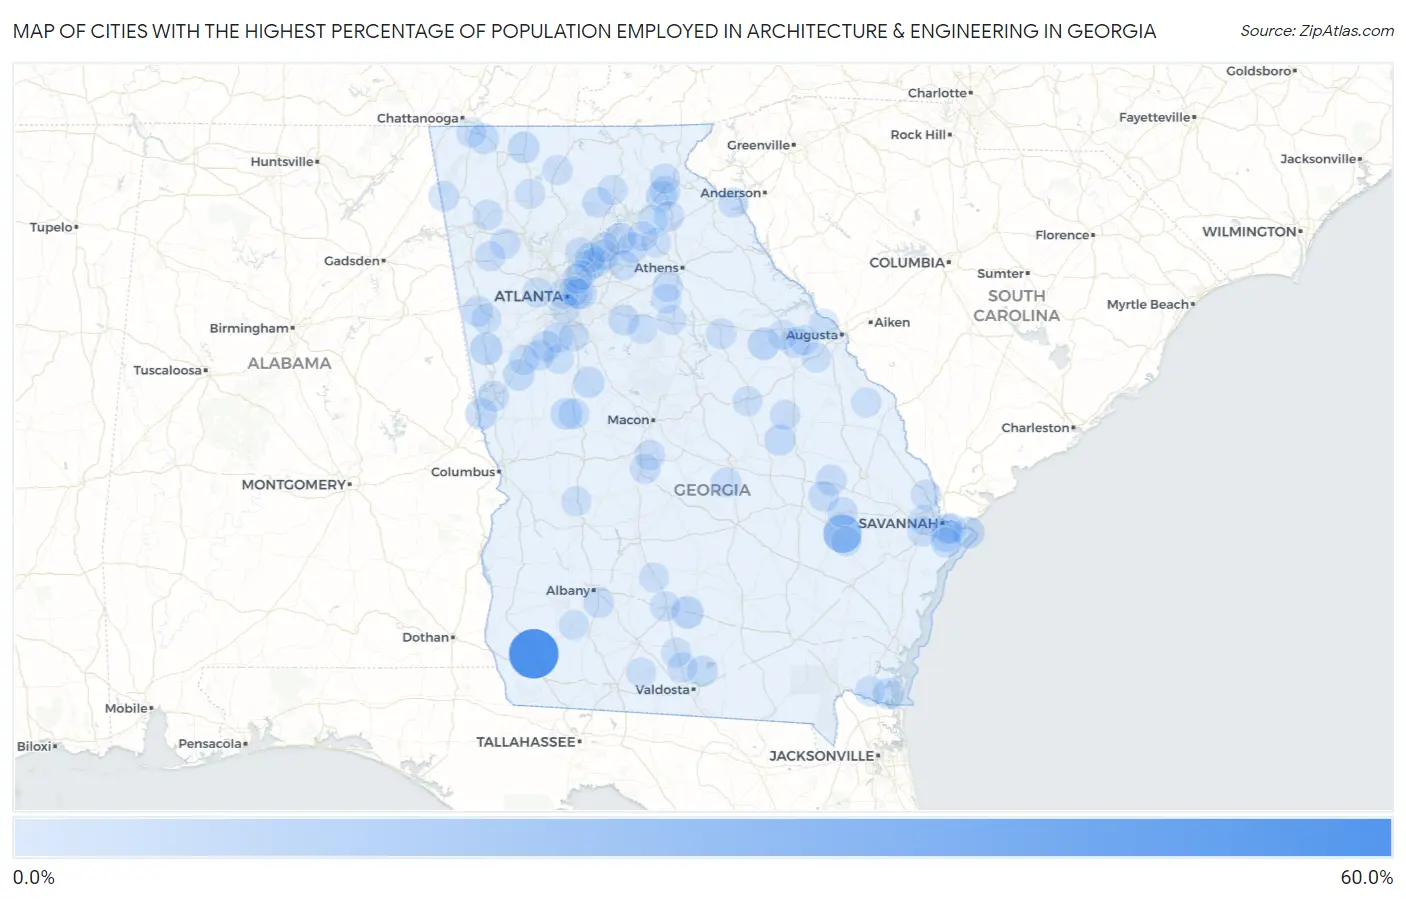
Map of Cities with the Highest Percentage of Population Employed in Architecture & Engineering in Georgia
0.0%
60.0%
Cities with the Highest Percentage of Population Employed in Architecture & Engineering in Georgia
| City | % Employed | vs State | vs National | |
| 1. | Boykin | 53.8% | 1.8%(+52.1)#1 | 2.1%(+51.7)#22 |
| 2. | Mendes | 23.6% | 1.8%(+21.8)#2 | 2.1%(+21.4)#98 |
| 3. | Bolingbroke | 16.4% | 1.8%(+14.6)#3 | 2.1%(+14.2)#191 |
| 4. | Centralhatchee | 8.6% | 1.8%(+6.81)#4 | 2.1%(+6.45)#626 |
| 5. | Enigma | 8.2% | 1.8%(+6.42)#5 | 2.1%(+6.07)#684 |
| 6. | Warrenton | 7.8% | 1.8%(+5.98)#6 | 2.1%(+5.62)#758 |
| 7. | West Point | 7.1% | 1.8%(+5.35)#7 | 2.1%(+4.99)#890 |
| 8. | Eton | 6.9% | 1.8%(+5.15)#8 | 2.1%(+4.80)#942 |
| 9. | Flowery Branch | 6.9% | 1.8%(+5.12)#9 | 2.1%(+4.76)#956 |
| 10. | Tybee Island | 6.6% | 1.8%(+4.82)#10 | 2.1%(+4.47)#1,013 |
| 11. | Wildwood | 6.2% | 1.8%(+4.46)#11 | 2.1%(+4.10)#1,136 |
| 12. | Sunset Village | 6.2% | 1.8%(+4.41)#12 | 2.1%(+4.05)#1,162 |
| 13. | Piney Grove | 5.9% | 1.8%(+4.09)#13 | 2.1%(+3.73)#1,297 |
| 14. | Milner | 5.8% | 1.8%(+4.02)#14 | 2.1%(+3.67)#1,335 |
| 15. | Kite | 5.7% | 1.8%(+3.92)#15 | 2.1%(+3.57)#1,379 |
| 16. | Lone Oak | 5.7% | 1.8%(+3.92)#16 | 2.1%(+3.57)#1,381 |
| 17. | Ellerslie | 5.6% | 1.8%(+3.79)#17 | 2.1%(+3.43)#1,459 |
| 18. | Isle Of Hope | 5.5% | 1.8%(+3.74)#18 | 2.1%(+3.38)#1,491 |
| 19. | Kings Bay Base | 5.3% | 1.8%(+3.53)#19 | 2.1%(+3.18)#1,612 |
| 20. | Baldwin | 5.1% | 1.8%(+3.33)#20 | 2.1%(+2.98)#1,749 |
| 21. | Moody Afb | 4.9% | 1.8%(+3.08)#21 | 2.1%(+2.73)#1,911 |
| 22. | Avondale Estates | 4.9% | 1.8%(+3.06)#22 | 2.1%(+2.70)#1,935 |
| 23. | Ringgold | 4.8% | 1.8%(+2.98)#23 | 2.1%(+2.62)#1,998 |
| 24. | Porterdale | 4.7% | 1.8%(+2.88)#24 | 2.1%(+2.53)#2,077 |
| 25. | Metter | 4.6% | 1.8%(+2.80)#25 | 2.1%(+2.45)#2,141 |
| 26. | Mount Zion | 4.5% | 1.8%(+2.73)#26 | 2.1%(+2.37)#2,215 |
| 27. | Suwanee | 4.5% | 1.8%(+2.72)#27 | 2.1%(+2.36)#2,224 |
| 28. | Peachtree City | 4.5% | 1.8%(+2.70)#28 | 2.1%(+2.35)#2,236 |
| 29. | Thomaston | 4.5% | 1.8%(+2.66)#29 | 2.1%(+2.31)#2,255 |
| 30. | Menlo | 4.4% | 1.8%(+2.64)#30 | 2.1%(+2.29)#2,281 |
| 31. | Turin | 4.4% | 1.8%(+2.62)#31 | 2.1%(+2.26)#2,298 |
| 32. | Dearing | 4.3% | 1.8%(+2.47)#32 | 2.1%(+2.11)#2,441 |
| 33. | Cobbtown | 4.1% | 1.8%(+2.35)#33 | 2.1%(+2.00)#2,592 |
| 34. | Braselton | 4.1% | 1.8%(+2.28)#34 | 2.1%(+1.92)#2,682 |
| 35. | North High Shoals | 4.0% | 1.8%(+2.18)#35 | 2.1%(+1.83)#2,802 |
| 36. | Cornelia | 3.9% | 1.8%(+2.14)#36 | 2.1%(+1.79)#2,848 |
| 37. | Rincon | 3.9% | 1.8%(+2.14)#37 | 2.1%(+1.78)#2,855 |
| 38. | Bellville | 3.9% | 1.8%(+2.13)#38 | 2.1%(+1.77)#2,868 |
| 39. | Whitemarsh Island | 3.9% | 1.8%(+2.11)#39 | 2.1%(+1.75)#2,899 |
| 40. | Dawsonville | 3.9% | 1.8%(+2.08)#40 | 2.1%(+1.73)#2,931 |
| 41. | Putney | 3.8% | 1.8%(+2.05)#41 | 2.1%(+1.70)#2,955 |
| 42. | White Plains | 3.8% | 1.8%(+2.01)#42 | 2.1%(+1.66)#3,009 |
| 43. | Shannon | 3.8% | 1.8%(+2.01)#43 | 2.1%(+1.65)#3,016 |
| 44. | Euharlee | 3.8% | 1.8%(+2.00)#44 | 2.1%(+1.65)#3,018 |
| 45. | Lagrange | 3.8% | 1.8%(+2.00)#45 | 2.1%(+1.64)#3,034 |
| 46. | Duluth | 3.7% | 1.8%(+1.95)#46 | 2.1%(+1.59)#3,097 |
| 47. | Gillsville | 3.7% | 1.8%(+1.94)#47 | 2.1%(+1.58)#3,123 |
| 48. | Fayetteville | 3.7% | 1.8%(+1.89)#48 | 2.1%(+1.54)#3,192 |
| 49. | Bartow | 3.7% | 1.8%(+1.88)#49 | 2.1%(+1.53)#3,218 |
| 50. | Decatur | 3.7% | 1.8%(+1.86)#50 | 2.1%(+1.51)#3,256 |
| 51. | Warner Robins | 3.6% | 1.8%(+1.83)#51 | 2.1%(+1.48)#3,300 |
| 52. | Berkeley Lake | 3.6% | 1.8%(+1.79)#52 | 2.1%(+1.44)#3,365 |
| 53. | Tifton | 3.5% | 1.8%(+1.75)#53 | 2.1%(+1.40)#3,440 |
| 54. | Homer | 3.4% | 1.8%(+1.60)#54 | 2.1%(+1.25)#3,713 |
| 55. | Thunderbolt | 3.4% | 1.8%(+1.60)#55 | 2.1%(+1.25)#3,721 |
| 56. | Dacula | 3.3% | 1.8%(+1.55)#56 | 2.1%(+1.20)#3,827 |
| 57. | Rentz | 3.3% | 1.8%(+1.50)#57 | 2.1%(+1.15)#3,913 |
| 58. | Bonanza | 3.3% | 1.8%(+1.46)#58 | 2.1%(+1.10)#3,987 |
| 59. | Perry | 3.2% | 1.8%(+1.45)#59 | 2.1%(+1.10)#3,995 |
| 60. | Moreland | 3.2% | 1.8%(+1.39)#60 | 2.1%(+1.04)#4,127 |
| 61. | Glennville | 3.2% | 1.8%(+1.39)#61 | 2.1%(+1.03)#4,138 |
| 62. | Skidaway Island | 3.2% | 1.8%(+1.38)#62 | 2.1%(+1.02)#4,167 |
| 63. | Henderson | 3.1% | 1.8%(+1.35)#63 | 2.1%(+0.994)#4,237 |
| 64. | Hahira | 3.1% | 1.8%(+1.31)#64 | 2.1%(+0.954)#4,327 |
| 65. | Reed Creek | 3.1% | 1.8%(+1.30)#65 | 2.1%(+0.943)#4,352 |
| 66. | Kingsland | 3.1% | 1.8%(+1.28)#66 | 2.1%(+0.931)#4,370 |
| 67. | Harlem | 3.1% | 1.8%(+1.27)#67 | 2.1%(+0.918)#4,408 |
| 68. | Aragon | 3.1% | 1.8%(+1.27)#68 | 2.1%(+0.912)#4,419 |
| 69. | Sandersville | 3.1% | 1.8%(+1.26)#69 | 2.1%(+0.911)#4,425 |
| 70. | Clarkesville | 3.0% | 1.8%(+1.24)#70 | 2.1%(+0.881)#4,494 |
| 71. | Pooler | 2.9% | 1.8%(+1.14)#71 | 2.1%(+0.785)#4,749 |
| 72. | Dahlonega | 2.9% | 1.8%(+1.14)#72 | 2.1%(+0.782)#4,758 |
| 73. | Evans | 2.9% | 1.8%(+1.12)#73 | 2.1%(+0.763)#4,808 |
| 74. | Fort Oglethorpe | 2.9% | 1.8%(+1.11)#74 | 2.1%(+0.760)#4,814 |
| 75. | Johns Creek | 2.9% | 1.8%(+1.09)#75 | 2.1%(+0.741)#4,876 |
| 76. | East Ellijay | 2.9% | 1.8%(+1.09)#76 | 2.1%(+0.735)#4,892 |
| 77. | Ranger | 2.9% | 1.8%(+1.06)#77 | 2.1%(+0.708)#4,972 |
| 78. | Alpharetta | 2.9% | 1.8%(+1.06)#78 | 2.1%(+0.706)#4,975 |
| 79. | Atlanta | 2.8% | 1.8%(+1.05)#79 | 2.1%(+0.701)#4,983 |
| 80. | Mansfield | 2.8% | 1.8%(+1.01)#80 | 2.1%(+0.660)#5,093 |
| 81. | Adel | 2.8% | 1.8%(+0.999)#81 | 2.1%(+0.645)#5,134 |
| 82. | Jefferson | 2.8% | 1.8%(+0.997)#82 | 2.1%(+0.643)#5,140 |
| 83. | Madison | 2.8% | 1.8%(+0.995)#83 | 2.1%(+0.641)#5,145 |
| 84. | Lithia Springs | 2.8% | 1.8%(+0.994)#84 | 2.1%(+0.640)#5,149 |
| 85. | Thomson | 2.8% | 1.8%(+0.993)#85 | 2.1%(+0.638)#5,153 |
| 86. | Carrollton | 2.8% | 1.8%(+0.977)#86 | 2.1%(+0.622)#5,200 |
| 87. | Newton | 2.7% | 1.8%(+0.952)#87 | 2.1%(+0.598)#5,273 |
| 88. | Doraville | 2.7% | 1.8%(+0.927)#88 | 2.1%(+0.573)#5,355 |
| 89. | Druid Hills | 2.7% | 1.8%(+0.926)#89 | 2.1%(+0.572)#5,357 |
| 90. | Chamblee | 2.7% | 1.8%(+0.917)#90 | 2.1%(+0.562)#5,391 |
| 91. | Sardis | 2.7% | 1.8%(+0.908)#91 | 2.1%(+0.553)#5,413 |
| 92. | Brooks | 2.7% | 1.8%(+0.890)#92 | 2.1%(+0.535)#5,485 |
| 93. | Ellaville | 2.7% | 1.8%(+0.880)#93 | 2.1%(+0.526)#5,509 |
| 94. | Hapeville | 2.6% | 1.8%(+0.804)#94 | 2.1%(+0.450)#5,720 |
| 95. | Blythe | 2.6% | 1.8%(+0.794)#95 | 2.1%(+0.440)#5,763 |
| 96. | Pavo | 2.6% | 1.8%(+0.777)#96 | 2.1%(+0.423)#5,819 |
| 97. | Sugar Hill | 2.6% | 1.8%(+0.770)#97 | 2.1%(+0.416)#5,836 |
| 98. | Sycamore | 2.5% | 1.8%(+0.755)#98 | 2.1%(+0.400)#5,891 |
| 99. | Talmo | 2.5% | 1.8%(+0.747)#99 | 2.1%(+0.393)#5,913 |
| 100. | Bostwick | 2.5% | 1.8%(+0.737)#100 | 2.1%(+0.382)#5,951 |
Common Questions
What are the Top 10 Cities with the Highest Percentage of Population Employed in Architecture & Engineering in Georgia?
Top 10 Cities with the Highest Percentage of Population Employed in Architecture & Engineering in Georgia are:
#1
53.8%
#2
23.6%
#3
8.6%
#4
8.2%
#5
7.8%
#6
7.1%
#7
6.9%
#8
6.9%
#9
6.6%
#10
6.2%
What city has the Highest Percentage of Population Employed in Architecture & Engineering in Georgia?
Boykin has the Highest Percentage of Population Employed in Architecture & Engineering in Georgia with 53.8%.
What is the Percentage of Population Employed in Architecture & Engineering in the State of Georgia?
Percentage of Population Employed in Architecture & Engineering in Georgia is 1.8%.
What is the Percentage of Population Employed in Architecture & Engineering in the United States?
Percentage of Population Employed in Architecture & Engineering in the United States is 2.1%.