Carmel Valley Village, CA Map & Demographics
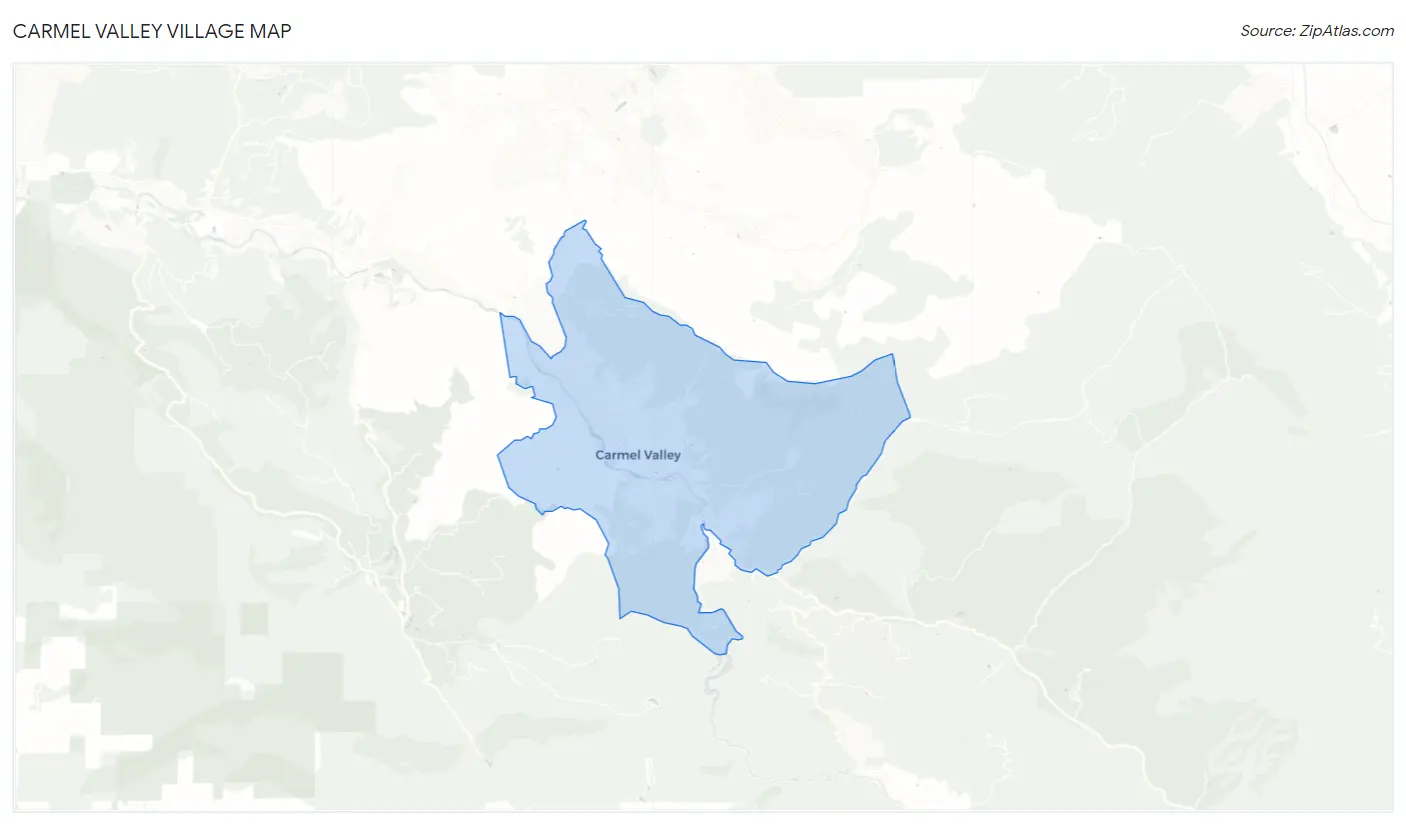
Carmel Valley Village Map
Carmel Valley Village Overview
$93,411
PER CAPITA INCOME
$177,828
AVG FAMILY INCOME
$166,117
AVG HOUSEHOLD INCOME
48.1%
WAGE / INCOME GAP [ % ]
51.9¢/ $1
WAGE / INCOME GAP [ $ ]
0.49
INEQUALITY / GINI INDEX
4,642
TOTAL POPULATION
2,150
MALE POPULATION
2,492
FEMALE POPULATION
86.28
MALES / 100 FEMALES
115.91
FEMALES / 100 MALES
58.5
MEDIAN AGE
2.7
AVG FAMILY SIZE
2.4
AVG HOUSEHOLD SIZE
2,190
LABOR FORCE [ PEOPLE ]
54.7%
PERCENT IN LABOR FORCE
4.4%
UNEMPLOYMENT RATE
Income in Carmel Valley Village
Income Overview in Carmel Valley Village
Per Capita Income in Carmel Valley Village is $93,411, while median incomes of families and households are $177,828 and $166,117 respectively.
| Characteristic | Number | Measure |
| Per Capita Income | 4,642 | $93,411 |
| Median Family Income | 1,347 | $177,828 |
| Mean Family Income | 1,347 | $260,802 |
| Median Household Income | 1,970 | $166,117 |
| Mean Household Income | 1,970 | $223,994 |
| Income Deficit | 1,347 | $0 |
| Wage / Income Gap (%) | 4,642 | 48.07% |
| Wage / Income Gap ($) | 4,642 | 51.93¢ per $1 |
| Gini / Inequality Index | 4,642 | 0.49 |
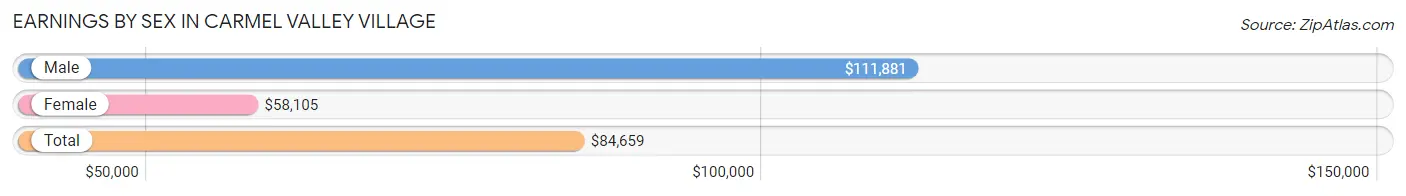
Earnings by Sex in Carmel Valley Village
Average Earnings in Carmel Valley Village are $84,659, $111,881 for men and $58,105 for women, a difference of 48.1%.
| Sex | Number | Average Earnings |
| Male | 1,249 (53.8%) | $111,881 |
| Female | 1,074 (46.2%) | $58,105 |
| Total | 2,323 (100.0%) | $84,659 |
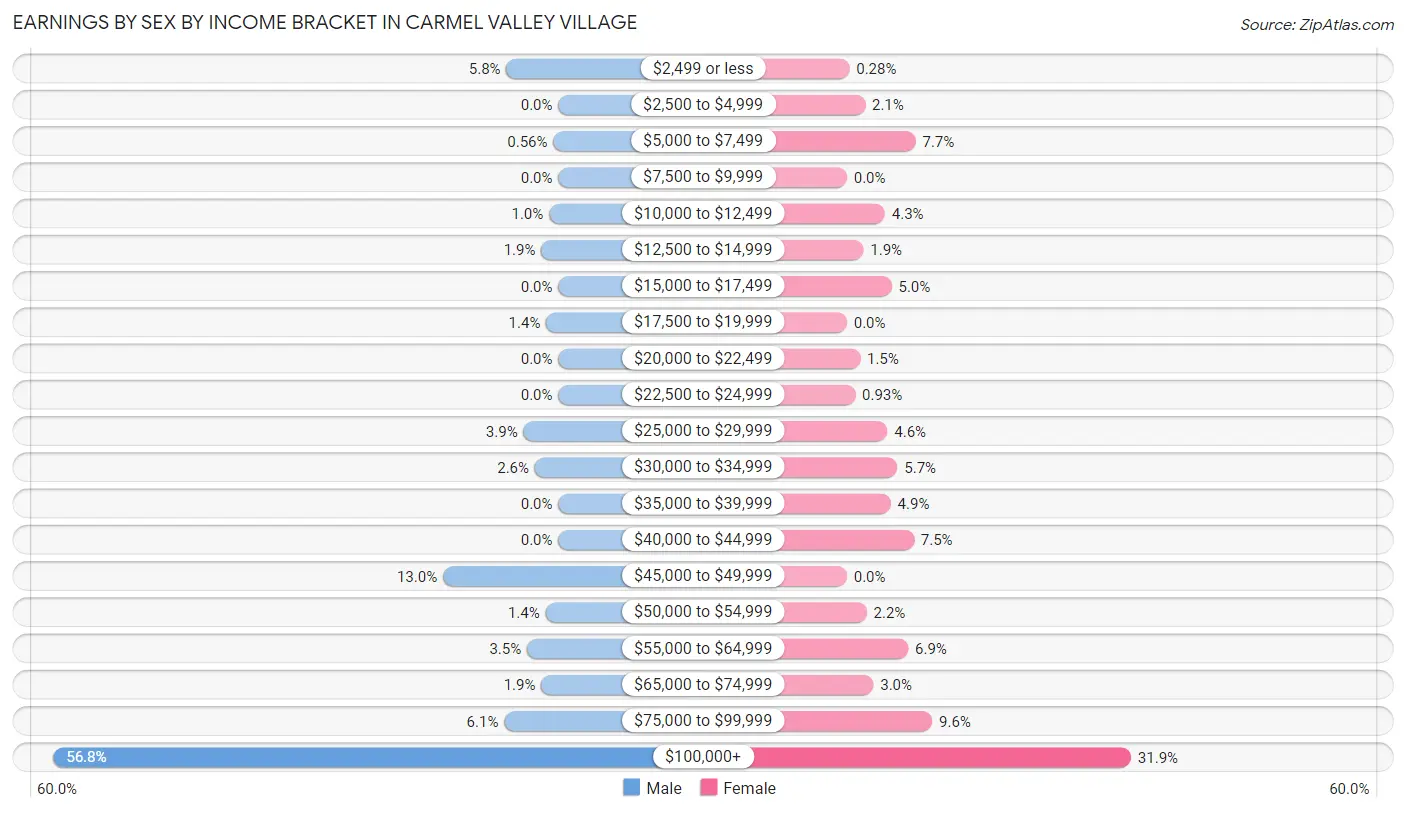
Earnings by Sex by Income Bracket in Carmel Valley Village
The most common earnings brackets in Carmel Valley Village are $100,000+ for men (709 | 56.8%) and $100,000+ for women (343 | 31.9%).
| Income | Male | Female |
| $2,499 or less | 73 (5.8%) | 3 (0.3%) |
| $2,500 to $4,999 | 0 (0.0%) | 22 (2.1%) |
| $5,000 to $7,499 | 7 (0.6%) | 83 (7.7%) |
| $7,500 to $9,999 | 0 (0.0%) | 0 (0.0%) |
| $10,000 to $12,499 | 13 (1.0%) | 46 (4.3%) |
| $12,500 to $14,999 | 24 (1.9%) | 20 (1.9%) |
| $15,000 to $17,499 | 0 (0.0%) | 54 (5.0%) |
| $17,500 to $19,999 | 17 (1.4%) | 0 (0.0%) |
| $20,000 to $22,499 | 0 (0.0%) | 16 (1.5%) |
| $22,500 to $24,999 | 0 (0.0%) | 10 (0.9%) |
| $25,000 to $29,999 | 49 (3.9%) | 49 (4.6%) |
| $30,000 to $34,999 | 33 (2.6%) | 61 (5.7%) |
| $35,000 to $39,999 | 0 (0.0%) | 53 (4.9%) |
| $40,000 to $44,999 | 0 (0.0%) | 81 (7.5%) |
| $45,000 to $49,999 | 162 (13.0%) | 0 (0.0%) |
| $50,000 to $54,999 | 18 (1.4%) | 24 (2.2%) |
| $55,000 to $64,999 | 44 (3.5%) | 74 (6.9%) |
| $65,000 to $74,999 | 24 (1.9%) | 32 (3.0%) |
| $75,000 to $99,999 | 76 (6.1%) | 103 (9.6%) |
| $100,000+ | 709 (56.8%) | 343 (31.9%) |
| Total | 1,249 (100.0%) | 1,074 (100.0%) |
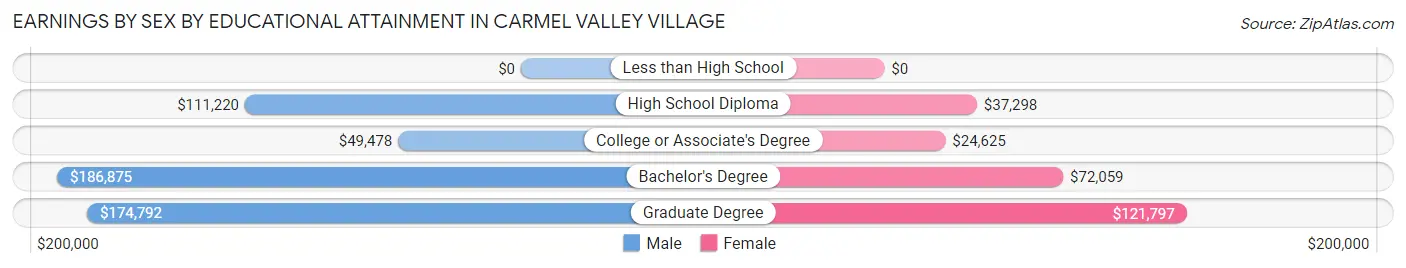
Earnings by Sex by Educational Attainment in Carmel Valley Village
Average earnings in Carmel Valley Village are $113,750 for men and $59,375 for women, a difference of 47.8%. Men with an educational attainment of bachelor's degree enjoy the highest average annual earnings of $186,875, while those with college or associate's degree education earn the least with $49,478. Women with an educational attainment of graduate degree earn the most with the average annual earnings of $121,797, while those with college or associate's degree education have the smallest earnings of $24,625.
| Educational Attainment | Male Income | Female Income |
| Less than High School | - | - |
| High School Diploma | $111,220 | $37,298 |
| College or Associate's Degree | $49,478 | $24,625 |
| Bachelor's Degree | $186,875 | $72,059 |
| Graduate Degree | $174,792 | $121,797 |
| Total | $113,750 | $59,375 |
Family Income in Carmel Valley Village
Family Income Brackets in Carmel Valley Village
According to the Carmel Valley Village family income data, there are 523 families falling into the $200,000+ income range, which is the most common income bracket and makes up 38.8% of all families.
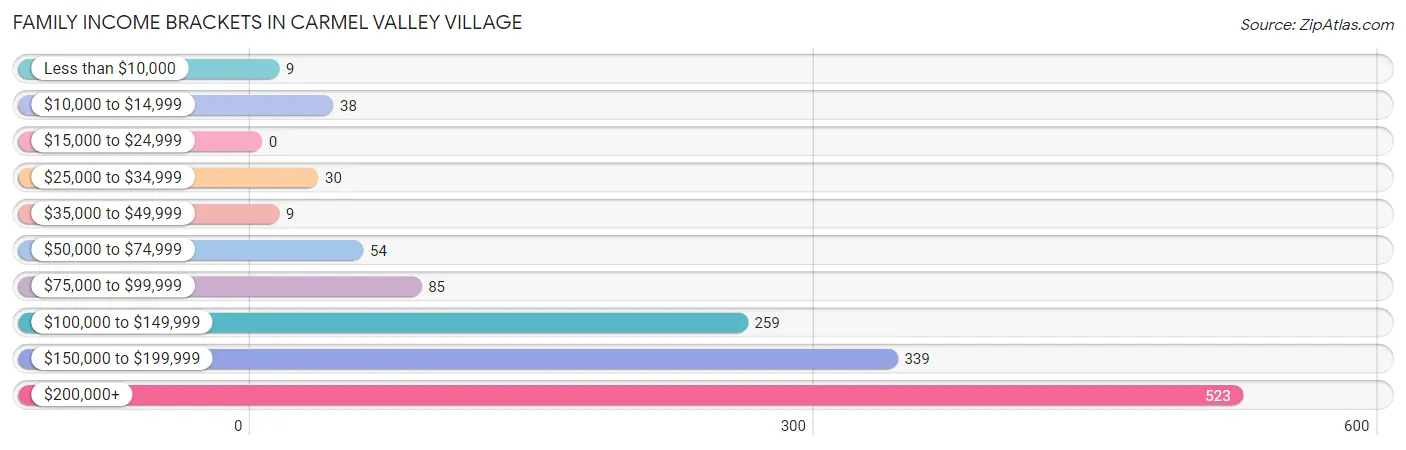
| Income Bracket | # Families | % Families |
| Less than $10,000 | 9 | 0.7% |
| $10,000 to $14,999 | 38 | 2.8% |
| $15,000 to $24,999 | 0 | 0.0% |
| $25,000 to $34,999 | 30 | 2.2% |
| $35,000 to $49,999 | 9 | 0.7% |
| $50,000 to $74,999 | 54 | 4.0% |
| $75,000 to $99,999 | 85 | 6.3% |
| $100,000 to $149,999 | 259 | 19.2% |
| $150,000 to $199,999 | 339 | 25.2% |
| $200,000+ | 523 | 38.8% |
Family Income by Famaliy Size in Carmel Valley Village
3-person families (367 | 27.3%) account for the highest median family income in Carmel Valley Village with $250,001 per family, while 2-person families (729 | 54.1%) have the highest median income of $88,780 per family member.
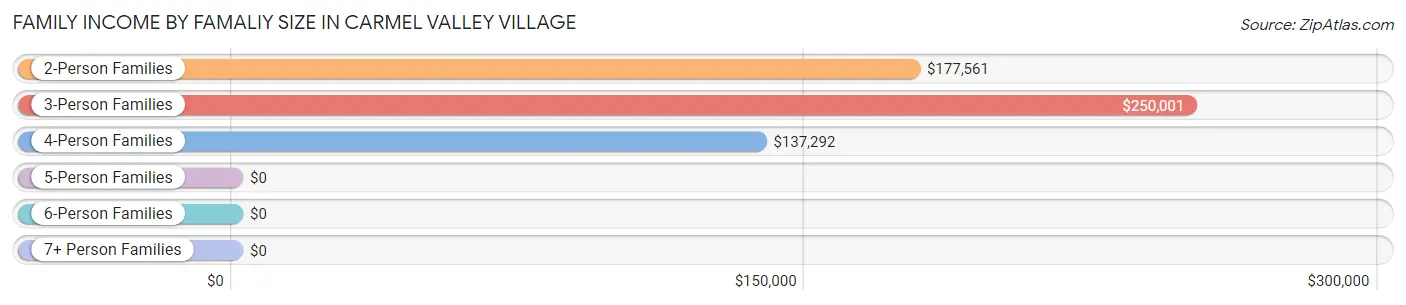
| Income Bracket | # Families | Median Income |
| 2-Person Families | 729 (54.1%) | $177,561 |
| 3-Person Families | 367 (27.3%) | $250,001 |
| 4-Person Families | 216 (16.0%) | $137,292 |
| 5-Person Families | 26 (1.9%) | $0 |
| 6-Person Families | 9 (0.7%) | $0 |
| 7+ Person Families | 0 (0.0%) | $0 |
| Total | 1,347 (100.0%) | $177,828 |
Family Income by Number of Earners in Carmel Valley Village
The median family income in Carmel Valley Village is $177,828, with families comprising 2 earners (681) having the highest median family income of $250,001, while families with no earners (332) have the lowest median family income of $89,464, accounting for 50.6% and 24.6% of families, respectively.
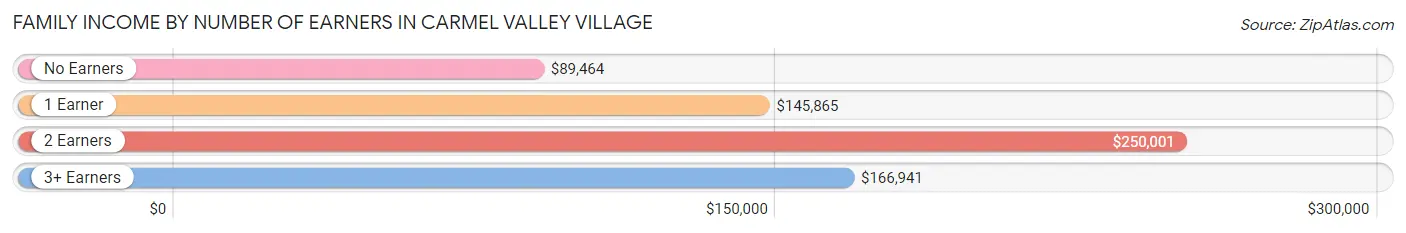
| Number of Earners | # Families | Median Income |
| No Earners | 332 (24.6%) | $89,464 |
| 1 Earner | 261 (19.4%) | $145,865 |
| 2 Earners | 681 (50.6%) | $250,001 |
| 3+ Earners | 73 (5.4%) | $166,941 |
| Total | 1,347 (100.0%) | $177,828 |
Household Income in Carmel Valley Village
Household Income Brackets in Carmel Valley Village
With 758 households falling in the category, the $200,000+ income range is the most frequent in Carmel Valley Village, accounting for 38.5% of all households. In contrast, only 53 households (2.7%) fall into the less than $10,000 income bracket, making it the least populous group.
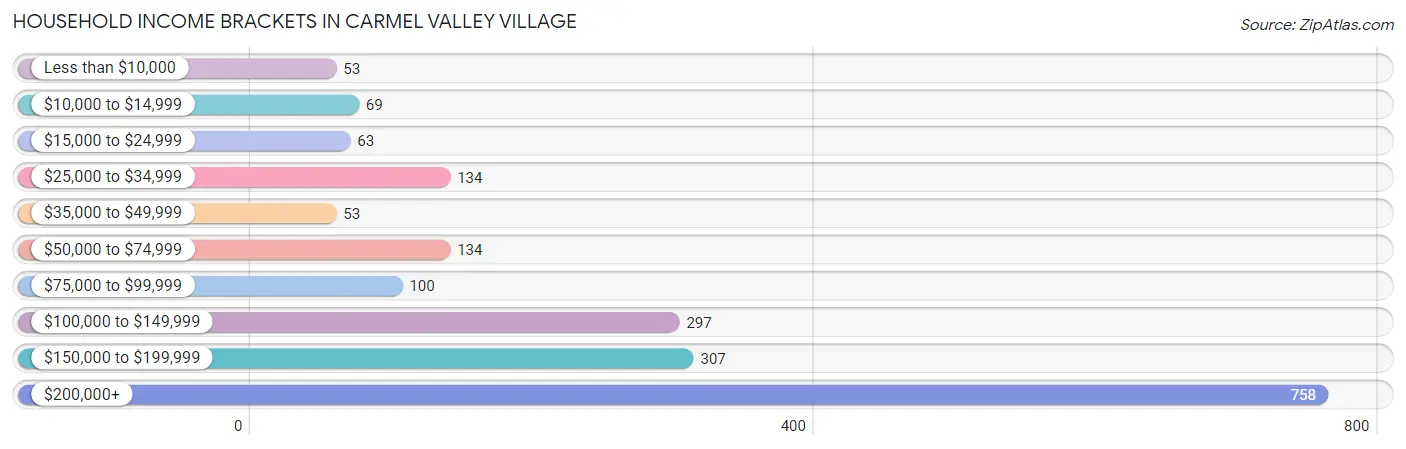
| Income Bracket | # Households | % Households |
| Less than $10,000 | 53 | 2.7% |
| $10,000 to $14,999 | 69 | 3.5% |
| $15,000 to $24,999 | 63 | 3.2% |
| $25,000 to $34,999 | 134 | 6.8% |
| $35,000 to $49,999 | 53 | 2.7% |
| $50,000 to $74,999 | 134 | 6.8% |
| $75,000 to $99,999 | 100 | 5.1% |
| $100,000 to $149,999 | 297 | 15.1% |
| $150,000 to $199,999 | 307 | 15.6% |
| $200,000+ | 758 | 38.5% |
Household Income by Householder Age in Carmel Valley Village
The median household income in Carmel Valley Village is $166,117, with the highest median household income of $250,001 found in the 25 to 44 years age bracket for the primary householder. A total of 312 households (15.8%) fall into this category.
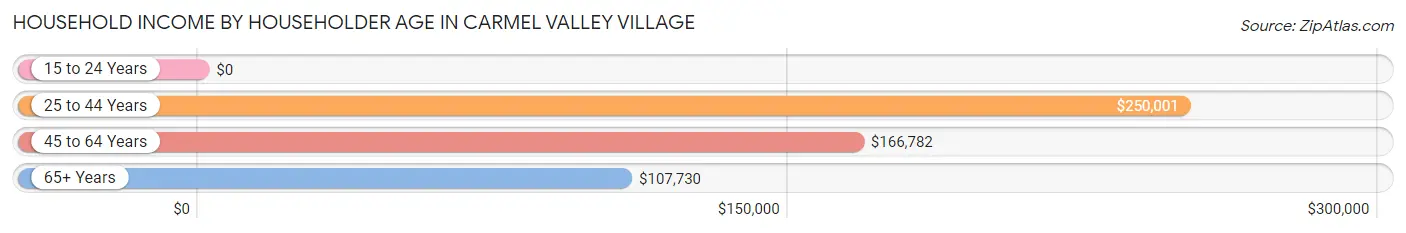
| Income Bracket | # Households | Median Income |
| 15 to 24 Years | 0 (0.0%) | $0 |
| 25 to 44 Years | 312 (15.8%) | $250,001 |
| 45 to 64 Years | 667 (33.9%) | $166,782 |
| 65+ Years | 991 (50.3%) | $107,730 |
| Total | 1,970 (100.0%) | $166,117 |
Poverty in Carmel Valley Village
Income Below Poverty by Sex and Age in Carmel Valley Village
With 8.4% poverty level for males and 4.4% for females among the residents of Carmel Valley Village, 65 to 74 year old males and 65 to 74 year old females are the most vulnerable to poverty, with 106 males (16.0%) and 88 females (13.3%) in their respective age groups living below the poverty level.
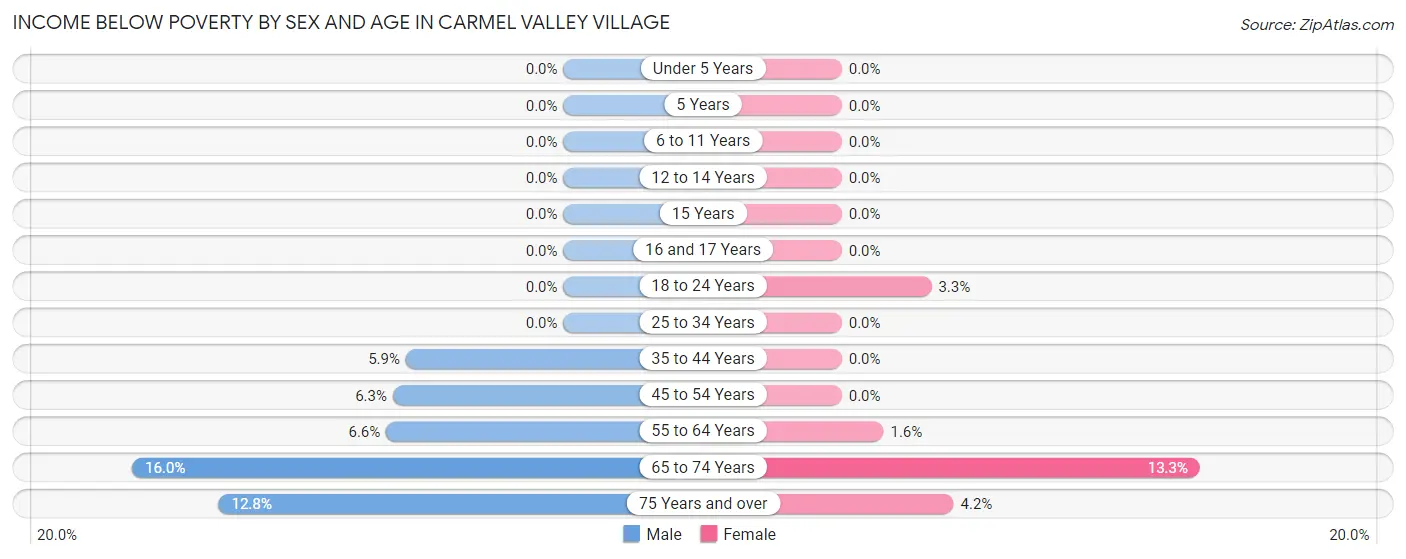
| Age Bracket | Male | Female |
| Under 5 Years | 0 (0.0%) | 0 (0.0%) |
| 5 Years | 0 (0.0%) | 0 (0.0%) |
| 6 to 11 Years | 0 (0.0%) | 0 (0.0%) |
| 12 to 14 Years | 0 (0.0%) | 0 (0.0%) |
| 15 Years | 0 (0.0%) | 0 (0.0%) |
| 16 and 17 Years | 0 (0.0%) | 0 (0.0%) |
| 18 to 24 Years | 0 (0.0%) | 3 (3.3%) |
| 25 to 34 Years | 0 (0.0%) | 0 (0.0%) |
| 35 to 44 Years | 22 (5.9%) | 0 (0.0%) |
| 45 to 54 Years | 15 (6.3%) | 0 (0.0%) |
| 55 to 64 Years | 16 (6.6%) | 9 (1.5%) |
| 65 to 74 Years | 106 (16.0%) | 88 (13.3%) |
| 75 Years and over | 21 (12.8%) | 10 (4.2%) |
| Total | 180 (8.4%) | 110 (4.4%) |
Income Above Poverty by Sex and Age in Carmel Valley Village
According to the poverty statistics in Carmel Valley Village, males aged under 5 years and females aged under 5 years are the age groups that are most secure financially, with 100.0% of males and 100.0% of females in these age groups living above the poverty line.
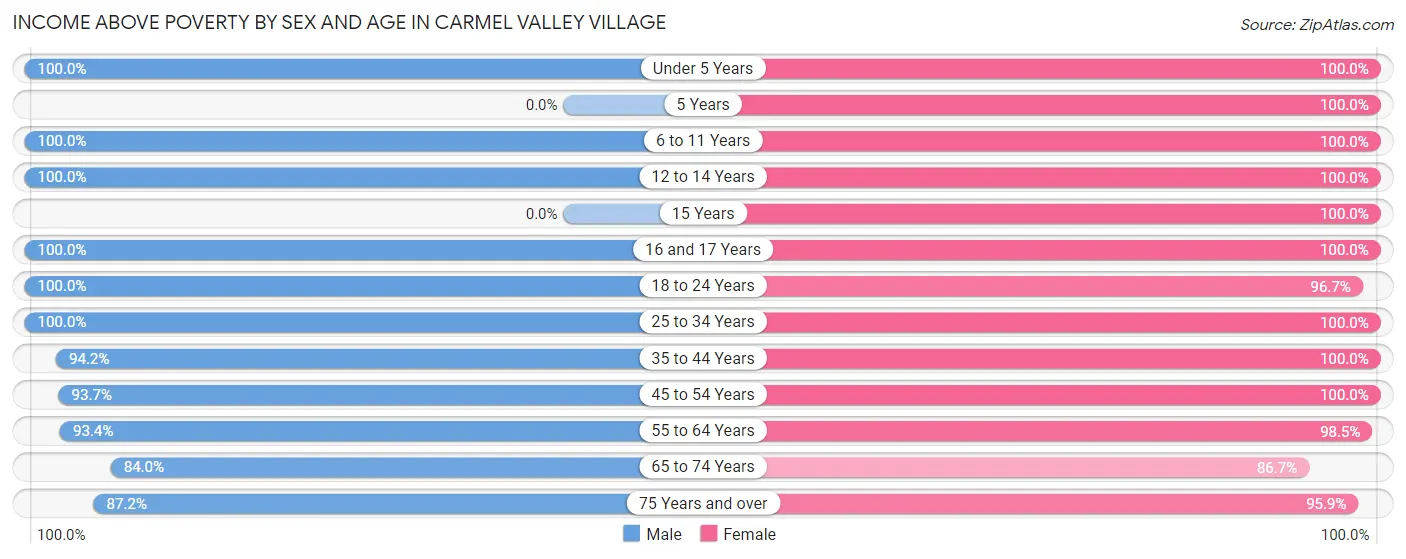
| Age Bracket | Male | Female |
| Under 5 Years | 34 (100.0%) | 46 (100.0%) |
| 5 Years | 0 (0.0%) | 26 (100.0%) |
| 6 to 11 Years | 236 (100.0%) | 83 (100.0%) |
| 12 to 14 Years | 29 (100.0%) | 164 (100.0%) |
| 15 Years | 0 (0.0%) | 20 (100.0%) |
| 16 and 17 Years | 26 (100.0%) | 16 (100.0%) |
| 18 to 24 Years | 68 (100.0%) | 87 (96.7%) |
| 25 to 34 Years | 75 (100.0%) | 9 (100.0%) |
| 35 to 44 Years | 354 (94.2%) | 406 (100.0%) |
| 45 to 54 Years | 222 (93.7%) | 136 (100.0%) |
| 55 to 64 Years | 227 (93.4%) | 572 (98.5%) |
| 65 to 74 Years | 556 (84.0%) | 574 (86.7%) |
| 75 Years and over | 143 (87.2%) | 231 (95.9%) |
| Total | 1,970 (91.6%) | 2,370 (95.6%) |
Income Below Poverty Among Married-Couple Families in Carmel Valley Village
The poverty statistics for married-couple families in Carmel Valley Village show that 3.8% or 48 of the total 1,250 families live below the poverty line. Families with no children have the highest poverty rate of 5.4%, comprising of 48 families. On the other hand, families with 1 or 2 children have the lowest poverty rate of 0.0%, which includes 0 families.
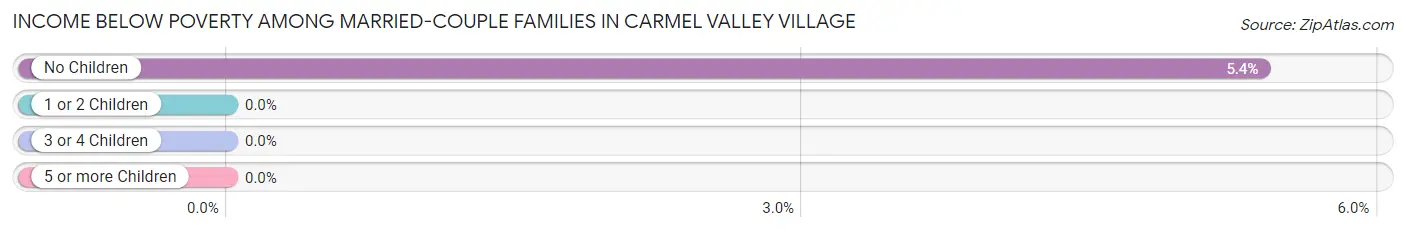
| Children | Above Poverty | Below Poverty |
| No Children | 842 (94.6%) | 48 (5.4%) |
| 1 or 2 Children | 342 (100.0%) | 0 (0.0%) |
| 3 or 4 Children | 18 (100.0%) | 0 (0.0%) |
| 5 or more Children | 0 (0.0%) | 0 (0.0%) |
| Total | 1,202 (96.2%) | 48 (3.8%) |
Income Below Poverty Among Single-Parent Households in Carmel Valley Village
| Children | Single Father | Single Mother |
| No Children | 0 (0.0%) | 0 (0.0%) |
| 1 or 2 Children | 0 (0.0%) | 0 (0.0%) |
| 3 or 4 Children | 0 (0.0%) | 0 (0.0%) |
| 5 or more Children | 0 (0.0%) | 0 (0.0%) |
| Total | 0 (0.0%) | 0 (0.0%) |
Income Below Poverty Among Married-Couple vs Single-Parent Households in Carmel Valley Village
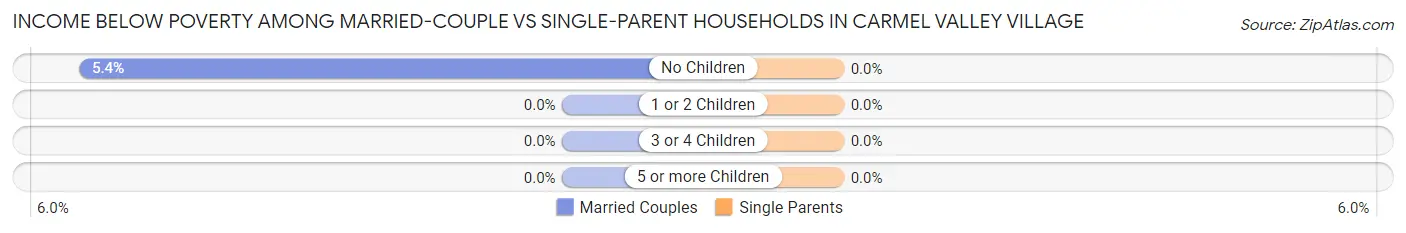
| Children | Married-Couple Families | Single-Parent Households |
| No Children | 48 (5.4%) | 0 (0.0%) |
| 1 or 2 Children | 0 (0.0%) | 0 (0.0%) |
| 3 or 4 Children | 0 (0.0%) | 0 (0.0%) |
| 5 or more Children | 0 (0.0%) | 0 (0.0%) |
| Total | 48 (3.8%) | 0 (0.0%) |
Race in Carmel Valley Village
The most populous races in Carmel Valley Village are White / Caucasian (4,114 | 88.6%), Hispanic or Latino (557 | 12.0%), and Two or more Races (404 | 8.7%).
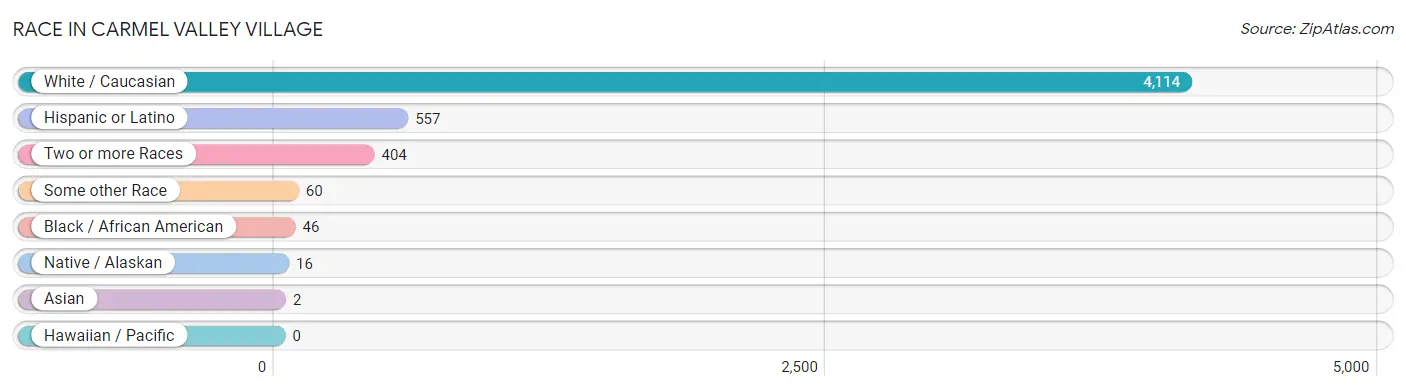
| Race | # Population | % Population |
| Asian | 2 | 0.0% |
| Black / African American | 46 | 1.0% |
| Hawaiian / Pacific | 0 | 0.0% |
| Hispanic or Latino | 557 | 12.0% |
| Native / Alaskan | 16 | 0.3% |
| White / Caucasian | 4,114 | 88.6% |
| Two or more Races | 404 | 8.7% |
| Some other Race | 60 | 1.3% |
| Total | 4,642 | 100.0% |
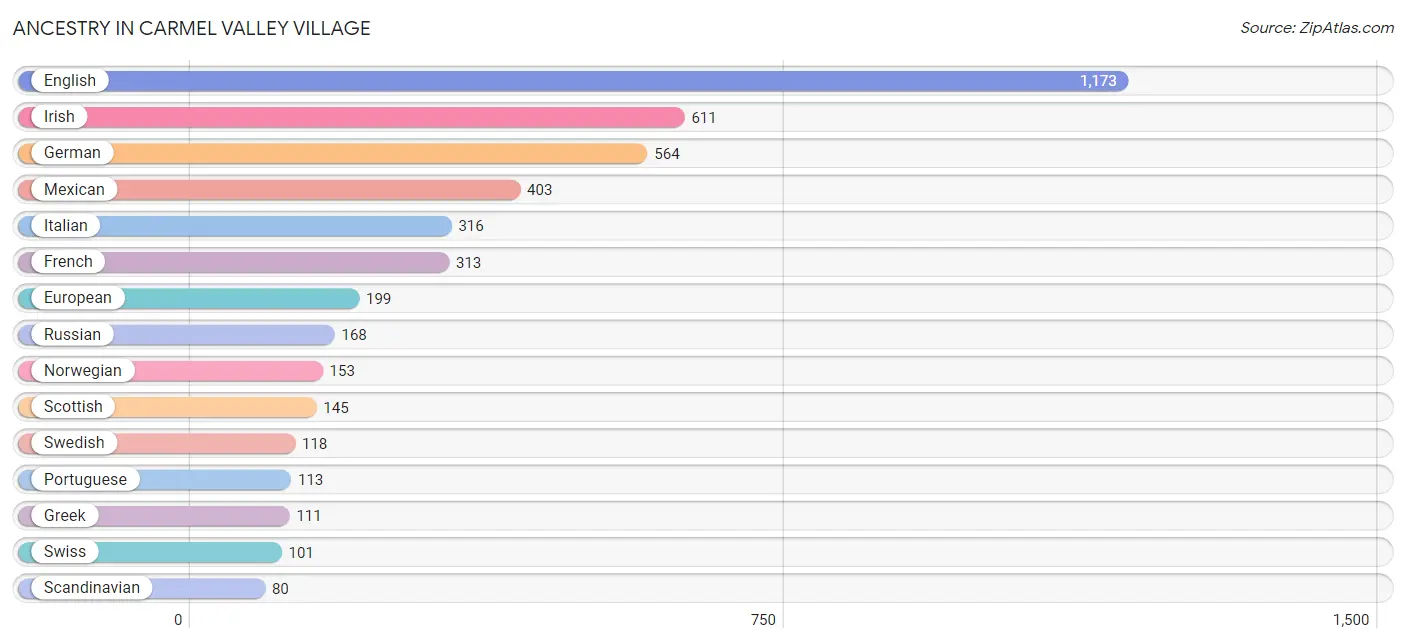
Ancestry in Carmel Valley Village
The most populous ancestries reported in Carmel Valley Village are English (1,173 | 25.3%), Irish (611 | 13.2%), German (564 | 12.1%), Mexican (403 | 8.7%), and Italian (316 | 6.8%), together accounting for 66.1% of all Carmel Valley Village residents.
| Ancestry | # Population | % Population |
| American | 13 | 0.3% |
| Armenian | 10 | 0.2% |
| Belgian | 2 | 0.0% |
| British | 53 | 1.1% |
| Cherokee | 48 | 1.0% |
| Colombian | 23 | 0.5% |
| Cuban | 75 | 1.6% |
| Czech | 2 | 0.0% |
| Danish | 10 | 0.2% |
| Dutch | 28 | 0.6% |
| Ecuadorian | 34 | 0.7% |
| English | 1,173 | 25.3% |
| European | 199 | 4.3% |
| French | 313 | 6.7% |
| French Canadian | 17 | 0.4% |
| German | 564 | 12.1% |
| Greek | 111 | 2.4% |
| Guamanian / Chamorro | 24 | 0.5% |
| Hungarian | 23 | 0.5% |
| Irish | 611 | 13.2% |
| Italian | 316 | 6.8% |
| Korean | 2 | 0.0% |
| Lithuanian | 11 | 0.2% |
| Mexican | 403 | 8.7% |
| Northern European | 52 | 1.1% |
| Norwegian | 153 | 3.3% |
| Polish | 73 | 1.6% |
| Portuguese | 113 | 2.4% |
| Russian | 168 | 3.6% |
| Samoan | 1 | 0.0% |
| Scandinavian | 80 | 1.7% |
| Scotch-Irish | 25 | 0.5% |
| Scottish | 145 | 3.1% |
| Serbian | 12 | 0.3% |
| South African | 16 | 0.3% |
| South American | 57 | 1.2% |
| Spanish | 22 | 0.5% |
| Subsaharan African | 16 | 0.3% |
| Swedish | 118 | 2.5% |
| Swiss | 101 | 2.2% |
| Welsh | 20 | 0.4% | View All 41 Rows |
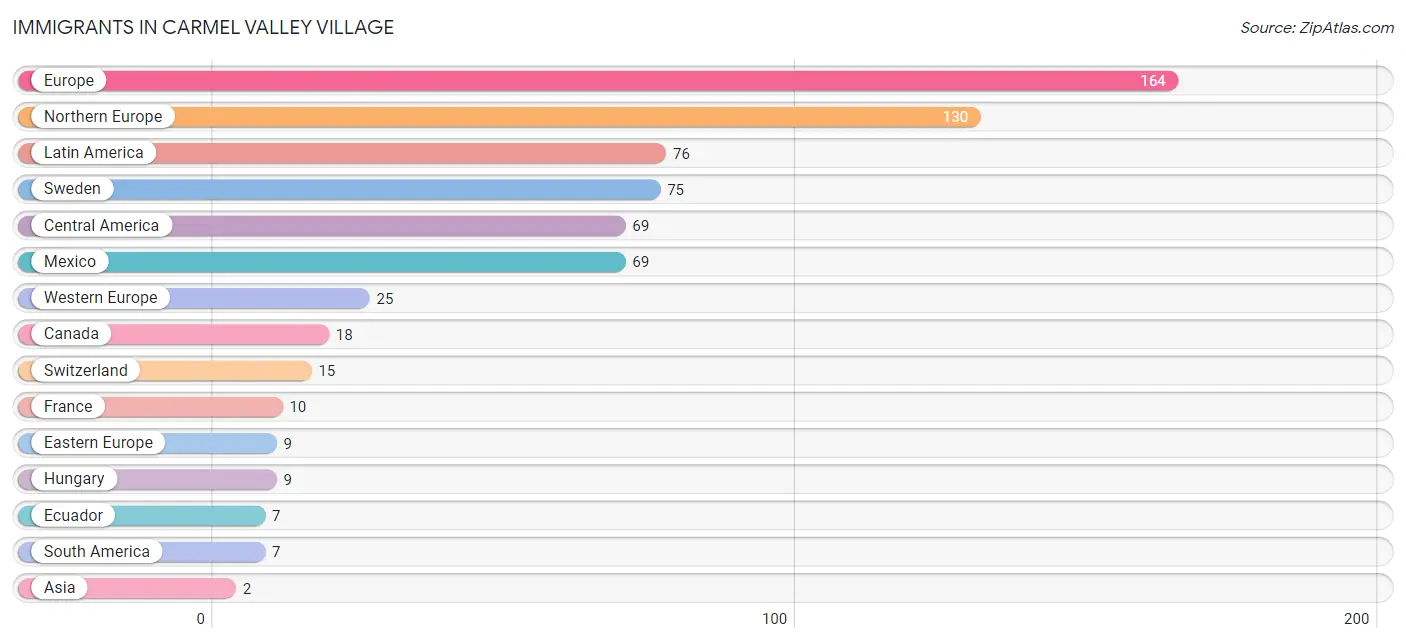
Immigrants in Carmel Valley Village
The most numerous immigrant groups reported in Carmel Valley Village came from Europe (164 | 3.5%), Northern Europe (130 | 2.8%), Latin America (76 | 1.6%), Sweden (75 | 1.6%), and Central America (69 | 1.5%), together accounting for 11.1% of all Carmel Valley Village residents.
| Immigration Origin | # Population | % Population |
| Asia | 2 | 0.0% |
| Canada | 18 | 0.4% |
| Central America | 69 | 1.5% |
| Eastern Europe | 9 | 0.2% |
| Ecuador | 7 | 0.2% |
| Europe | 164 | 3.5% |
| France | 10 | 0.2% |
| Hungary | 9 | 0.2% |
| Latin America | 76 | 1.6% |
| Mexico | 69 | 1.5% |
| Northern Europe | 130 | 2.8% |
| Philippines | 2 | 0.0% |
| South America | 7 | 0.2% |
| South Eastern Asia | 2 | 0.0% |
| Sweden | 75 | 1.6% |
| Switzerland | 15 | 0.3% |
| Western Europe | 25 | 0.5% | View All 17 Rows |
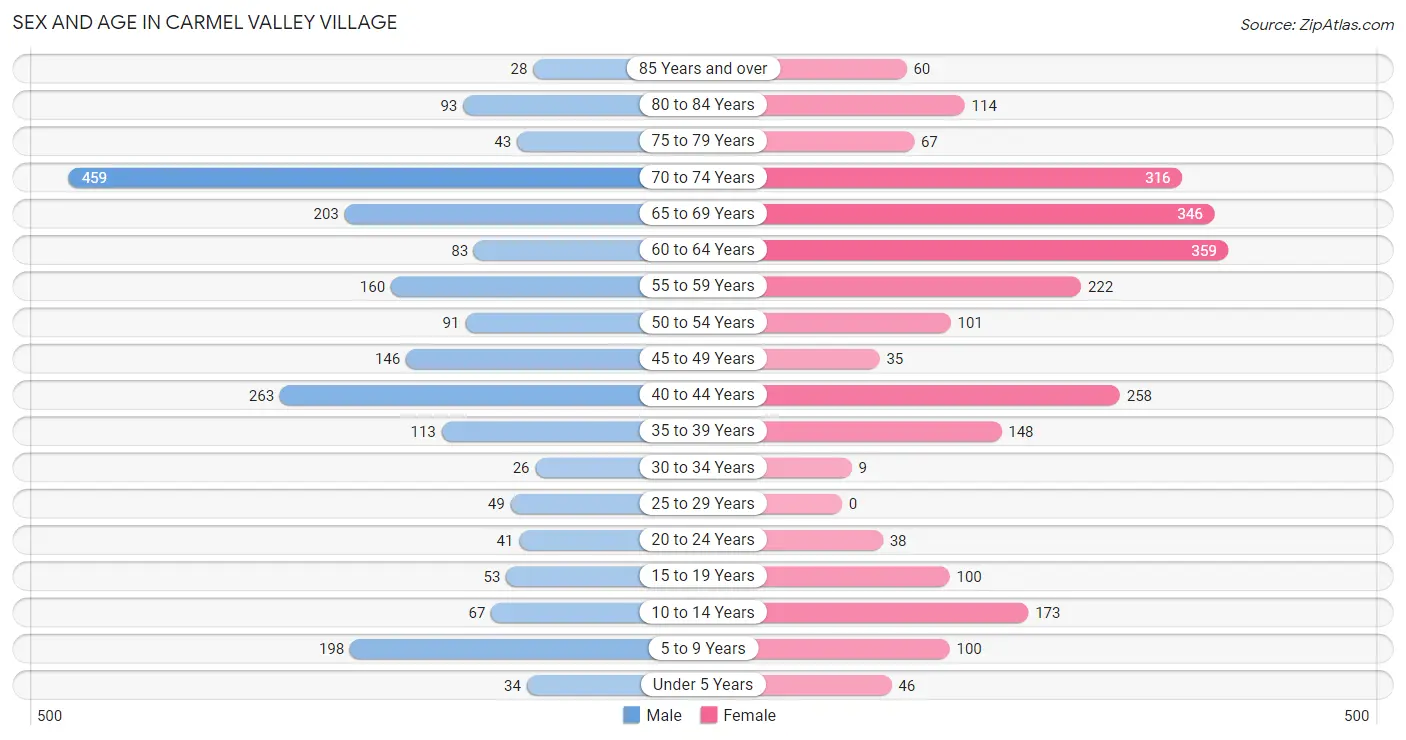
Sex and Age in Carmel Valley Village
Sex and Age in Carmel Valley Village
The most populous age groups in Carmel Valley Village are 70 to 74 Years (459 | 21.3%) for men and 60 to 64 Years (359 | 14.4%) for women.
| Age Bracket | Male | Female |
| Under 5 Years | 34 (1.6%) | 46 (1.8%) |
| 5 to 9 Years | 198 (9.2%) | 100 (4.0%) |
| 10 to 14 Years | 67 (3.1%) | 173 (6.9%) |
| 15 to 19 Years | 53 (2.5%) | 100 (4.0%) |
| 20 to 24 Years | 41 (1.9%) | 38 (1.5%) |
| 25 to 29 Years | 49 (2.3%) | 0 (0.0%) |
| 30 to 34 Years | 26 (1.2%) | 9 (0.4%) |
| 35 to 39 Years | 113 (5.3%) | 148 (5.9%) |
| 40 to 44 Years | 263 (12.2%) | 258 (10.3%) |
| 45 to 49 Years | 146 (6.8%) | 35 (1.4%) |
| 50 to 54 Years | 91 (4.2%) | 101 (4.1%) |
| 55 to 59 Years | 160 (7.4%) | 222 (8.9%) |
| 60 to 64 Years | 83 (3.9%) | 359 (14.4%) |
| 65 to 69 Years | 203 (9.4%) | 346 (13.9%) |
| 70 to 74 Years | 459 (21.3%) | 316 (12.7%) |
| 75 to 79 Years | 43 (2.0%) | 67 (2.7%) |
| 80 to 84 Years | 93 (4.3%) | 114 (4.6%) |
| 85 Years and over | 28 (1.3%) | 60 (2.4%) |
| Total | 2,150 (100.0%) | 2,492 (100.0%) |
Families and Households in Carmel Valley Village
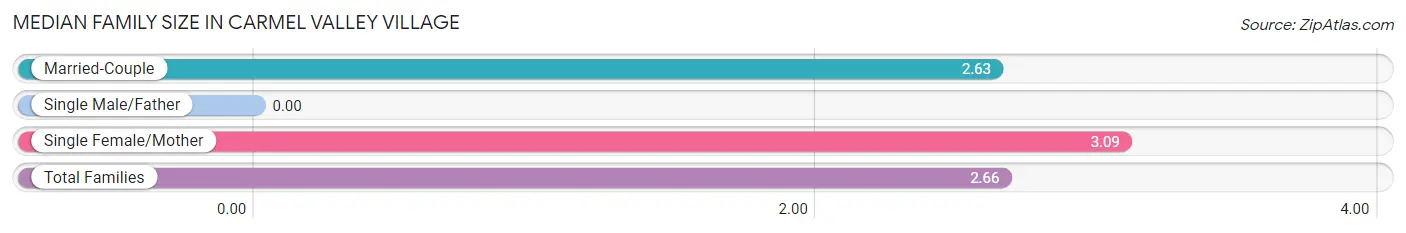
Median Family Size in Carmel Valley Village
| Family Type | # Families | Family Size |
| Married-Couple | 1,250 (92.8%) | 2.63 |
| Single Male/Father | 0 (0.0%) | - |
| Single Female/Mother | 97 (7.2%) | 3.09 |
| Total Families | 1,347 (100.0%) | 2.66 |
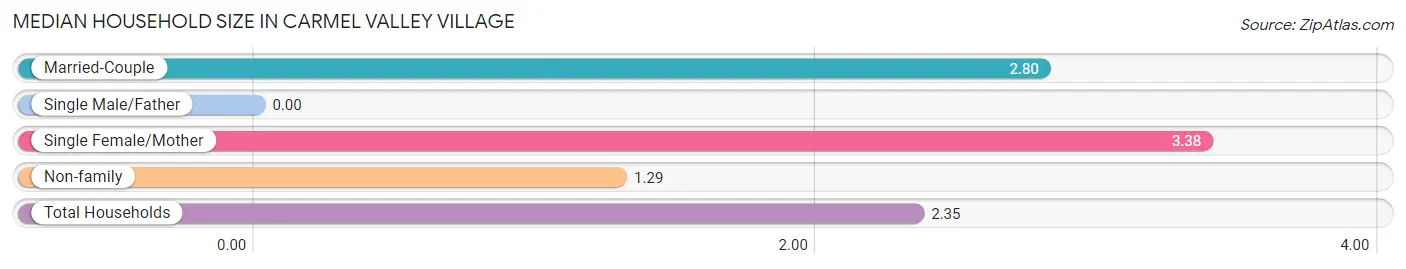
Median Household Size in Carmel Valley Village
| Household Type | # Households | Household Size |
| Married-Couple | 1,250 (63.4%) | 2.80 |
| Single Male/Father | 0 (0.0%) | - |
| Single Female/Mother | 97 (4.9%) | 3.38 |
| Non-family | 623 (31.6%) | 1.29 |
| Total Households | 1,970 (100.0%) | 2.35 |
Household Size by Marriage Status in Carmel Valley Village
Out of a total of 1,970 households in Carmel Valley Village, 1,347 (68.4%) are family households, while 623 (31.6%) are nonfamily households. The most numerous type of family households are 2-person households, comprising 595, and the most common type of nonfamily households are 1-person households, comprising 486.
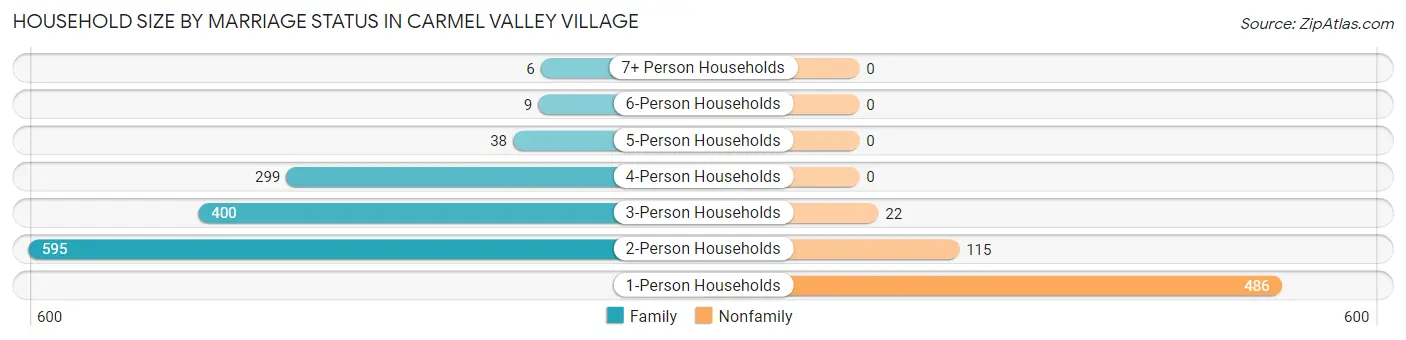
| Household Size | Family Households | Nonfamily Households |
| 1-Person Households | - | 486 (24.7%) |
| 2-Person Households | 595 (30.2%) | 115 (5.8%) |
| 3-Person Households | 400 (20.3%) | 22 (1.1%) |
| 4-Person Households | 299 (15.2%) | 0 (0.0%) |
| 5-Person Households | 38 (1.9%) | 0 (0.0%) |
| 6-Person Households | 9 (0.5%) | 0 (0.0%) |
| 7+ Person Households | 6 (0.3%) | 0 (0.0%) |
| Total | 1,347 (68.4%) | 623 (31.6%) |
Female Fertility in Carmel Valley Village
Fertility by Age in Carmel Valley Village
Average fertility rate in Carmel Valley Village is 41.0 births per 1,000 women. Women in the age bracket of 35 to 50 years have the highest fertility rate with 54.0 births per 1,000 women. Women in the age bracket of 35 to 50 years acount for 100.0% of all women with births.
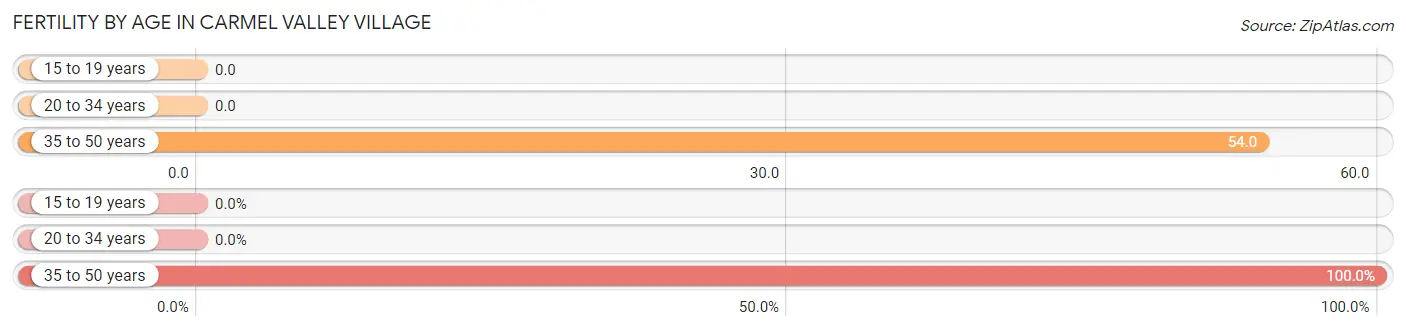
| Age Bracket | Women with Births | Births / 1,000 Women |
| 15 to 19 years | 0 (0.0%) | 0.0 |
| 20 to 34 years | 0 (0.0%) | 0.0 |
| 35 to 50 years | 24 (100.0%) | 54.0 |
| Total | 24 (100.0%) | 41.0 |
Fertility by Age by Marriage Status in Carmel Valley Village
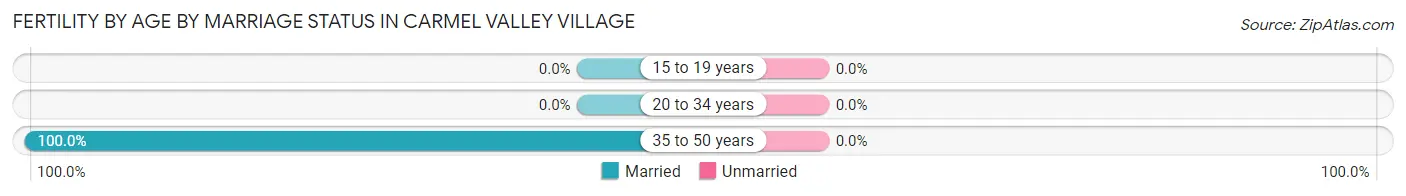
| Age Bracket | Married | Unmarried |
| 15 to 19 years | 0 (0.0%) | 0 (0.0%) |
| 20 to 34 years | 0 (0.0%) | 0 (0.0%) |
| 35 to 50 years | 24 (100.0%) | 0 (0.0%) |
| Total | 24 (100.0%) | 0 (0.0%) |
Fertility by Education in Carmel Valley Village
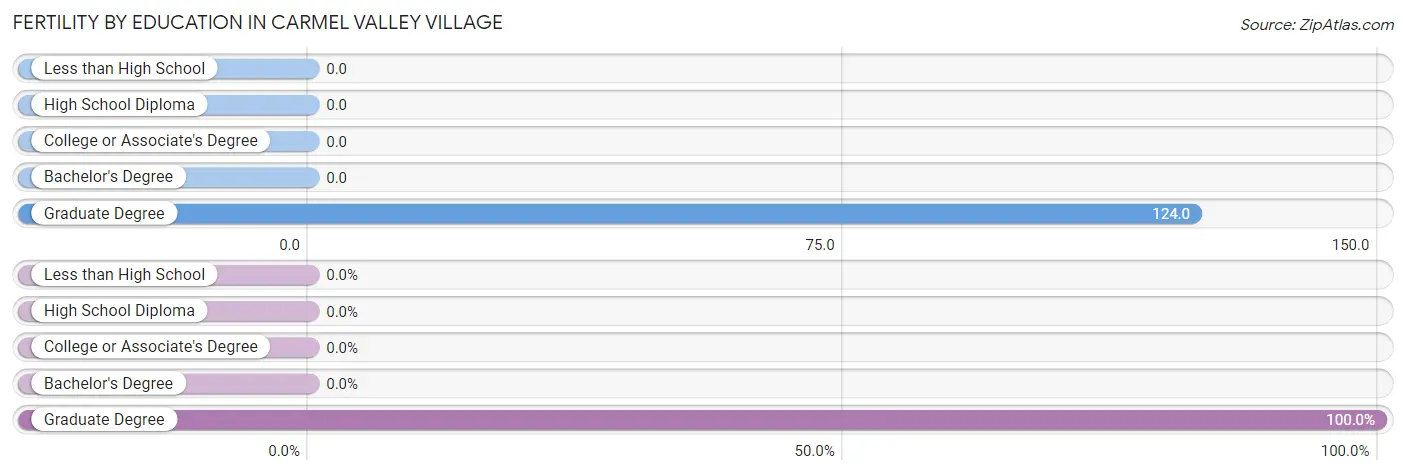
| Educational Attainment | Women with Births | Births / 1,000 Women |
| Less than High School | 0 (0.0%) | 0.0 |
| High School Diploma | 0 (0.0%) | 0.0 |
| College or Associate's Degree | 0 (0.0%) | 0.0 |
| Bachelor's Degree | 0 (0.0%) | 0.0 |
| Graduate Degree | 24 (100.0%) | 124.0 |
| Total | 24 (100.0%) | 41.0 |
Fertility by Education by Marriage Status in Carmel Valley Village
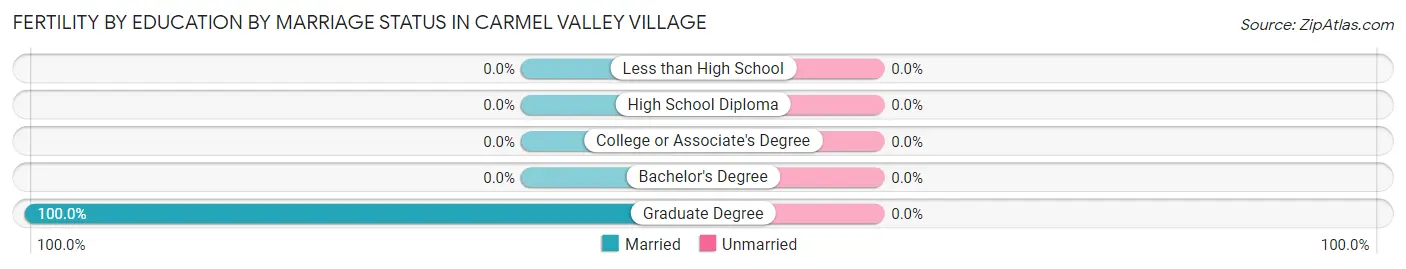
| Educational Attainment | Married | Unmarried |
| Less than High School | 0 (0.0%) | 0 (0.0%) |
| High School Diploma | 0 (0.0%) | 0 (0.0%) |
| College or Associate's Degree | 0 (0.0%) | 0 (0.0%) |
| Bachelor's Degree | 0 (0.0%) | 0 (0.0%) |
| Graduate Degree | 24 (100.0%) | 0 (0.0%) |
| Total | 24 (100.0%) | 0 (0.0%) |
Employment Characteristics in Carmel Valley Village
Employment by Class of Employer in Carmel Valley Village
Among the 1,977 employed individuals in Carmel Valley Village, private company employees (911 | 46.1%), self-employed (not incorporated) (416 | 21.0%), and not-for-profit organizations (228 | 11.5%) make up the most common classes of employment.
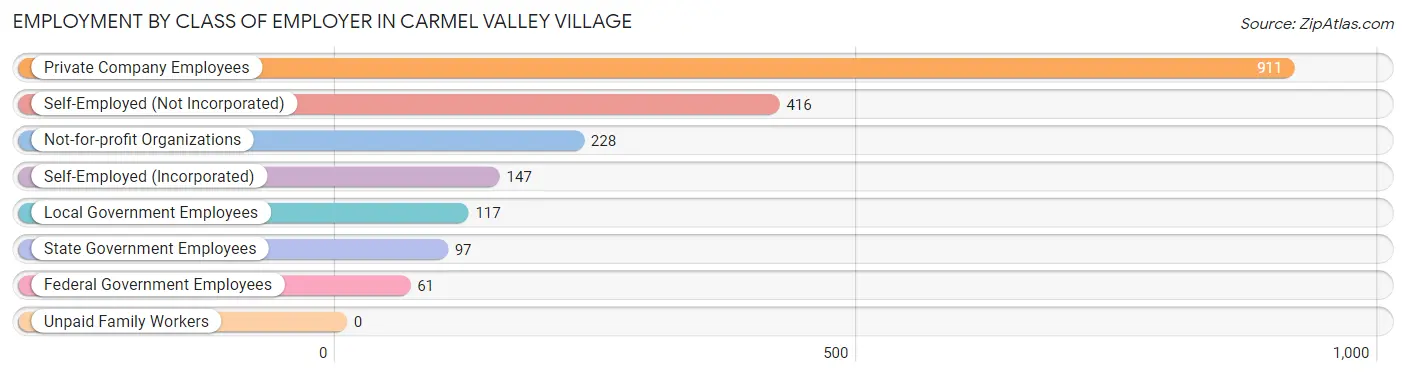
| Employer Class | # Employees | % Employees |
| Private Company Employees | 911 | 46.1% |
| Self-Employed (Incorporated) | 147 | 7.4% |
| Self-Employed (Not Incorporated) | 416 | 21.0% |
| Not-for-profit Organizations | 228 | 11.5% |
| Local Government Employees | 117 | 5.9% |
| State Government Employees | 97 | 4.9% |
| Federal Government Employees | 61 | 3.1% |
| Unpaid Family Workers | 0 | 0.0% |
| Total | 1,977 | 100.0% |
Employment Status by Age in Carmel Valley Village
According to the labor force statistics for Carmel Valley Village, out of the total population over 16 years of age (4,004), 54.7% or 2,190 individuals are in the labor force, with 4.4% or 96 of them unemployed. The age group with the highest labor force participation rate is 25 to 29 years, with 100.0% or 49 individuals in the labor force. Within the labor force, the 16 to 19 years age range has the highest percentage of unemployed individuals, with 34.8% or 8 of them being unemployed.
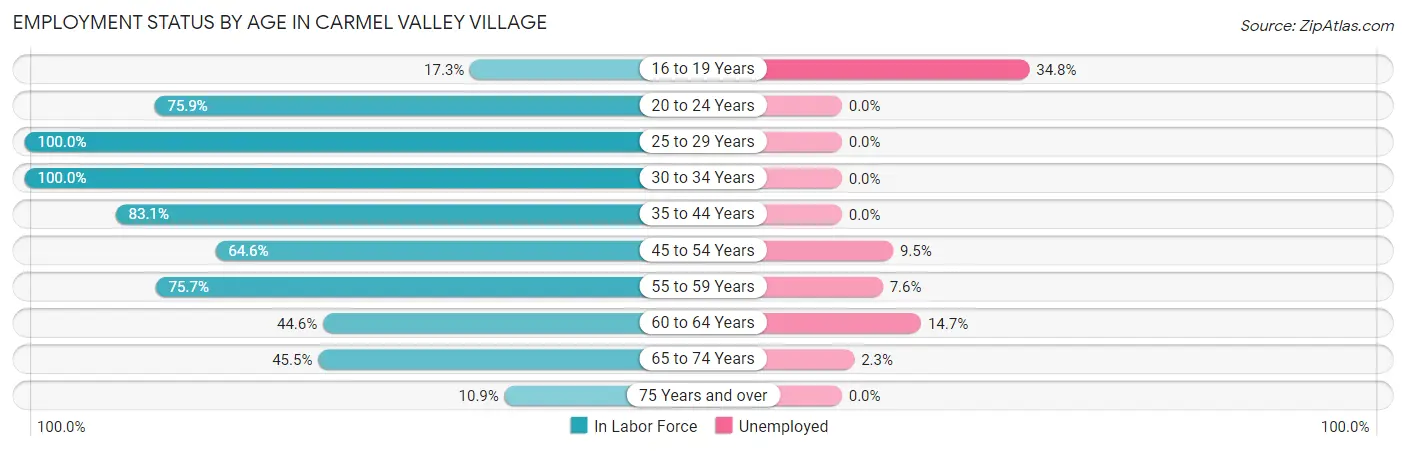
| Age Bracket | In Labor Force | Unemployed |
| 16 to 19 Years | 23 (17.3%) | 8 (34.8%) |
| 20 to 24 Years | 60 (75.9%) | 0 (0.0%) |
| 25 to 29 Years | 49 (100.0%) | 0 (0.0%) |
| 30 to 34 Years | 35 (100.0%) | 0 (0.0%) |
| 35 to 44 Years | 650 (83.1%) | 0 (0.0%) |
| 45 to 54 Years | 241 (64.6%) | 23 (9.5%) |
| 55 to 59 Years | 289 (75.7%) | 22 (7.6%) |
| 60 to 64 Years | 197 (44.6%) | 29 (14.7%) |
| 65 to 74 Years | 602 (45.5%) | 14 (2.3%) |
| 75 Years and over | 44 (10.9%) | 0 (0.0%) |
| Total | 2,190 (54.7%) | 96 (4.4%) |
Employment Status by Educational Attainment in Carmel Valley Village
According to labor force statistics for Carmel Valley Village, 70.8% of individuals (1,461) out of the total population between 25 and 64 years of age (2,063) are in the labor force, with 5.1% or 75 of them being unemployed. The group with the highest labor force participation rate are those with the educational attainment of less than high school, with 90.9% or 20 individuals in the labor force. Within the labor force, individuals with less than high school education have the highest percentage of unemployment, with 40.0% or 8 of them being unemployed.
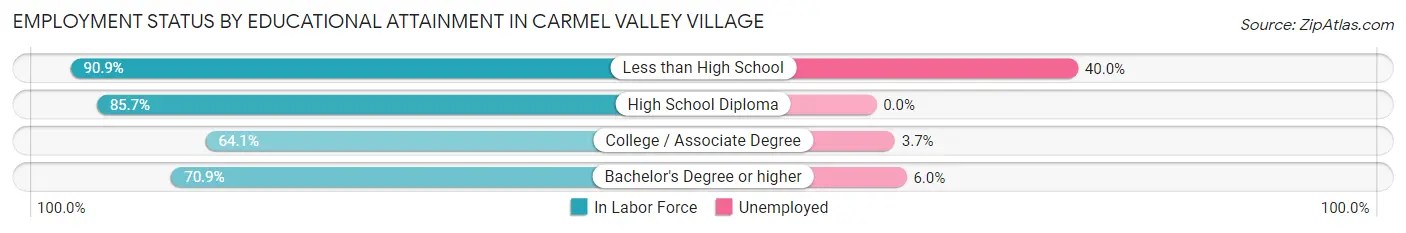
| Educational Attainment | In Labor Force | Unemployed |
| Less than High School | 20 (90.9%) | 9 (40.0%) |
| High School Diploma | 197 (85.7%) | 0 (0.0%) |
| College / Associate Degree | 377 (64.1%) | 22 (3.7%) |
| Bachelor's Degree or higher | 867 (70.9%) | 73 (6.0%) |
| Total | 1,461 (70.8%) | 105 (5.1%) |
Employment Occupations by Sex in Carmel Valley Village
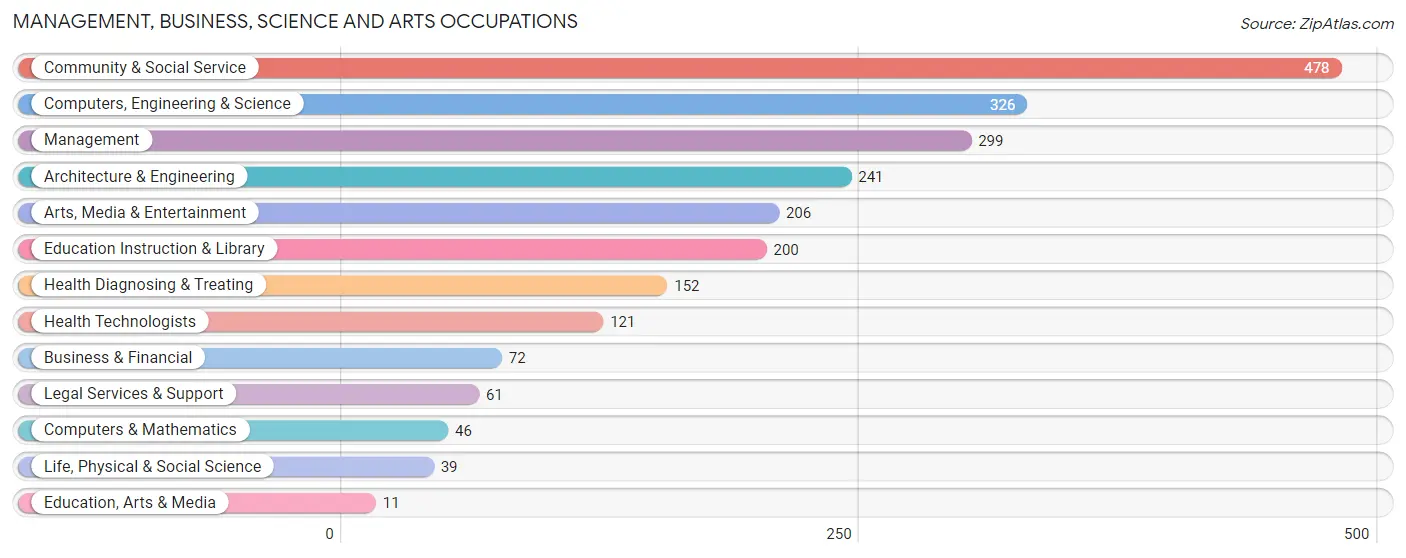
Management, Business, Science and Arts Occupations
The most common Management, Business, Science and Arts occupations in Carmel Valley Village are Community & Social Service (478 | 22.8%), Computers, Engineering & Science (326 | 15.6%), Management (299 | 14.3%), Architecture & Engineering (241 | 11.5%), and Arts, Media & Entertainment (206 | 9.8%).
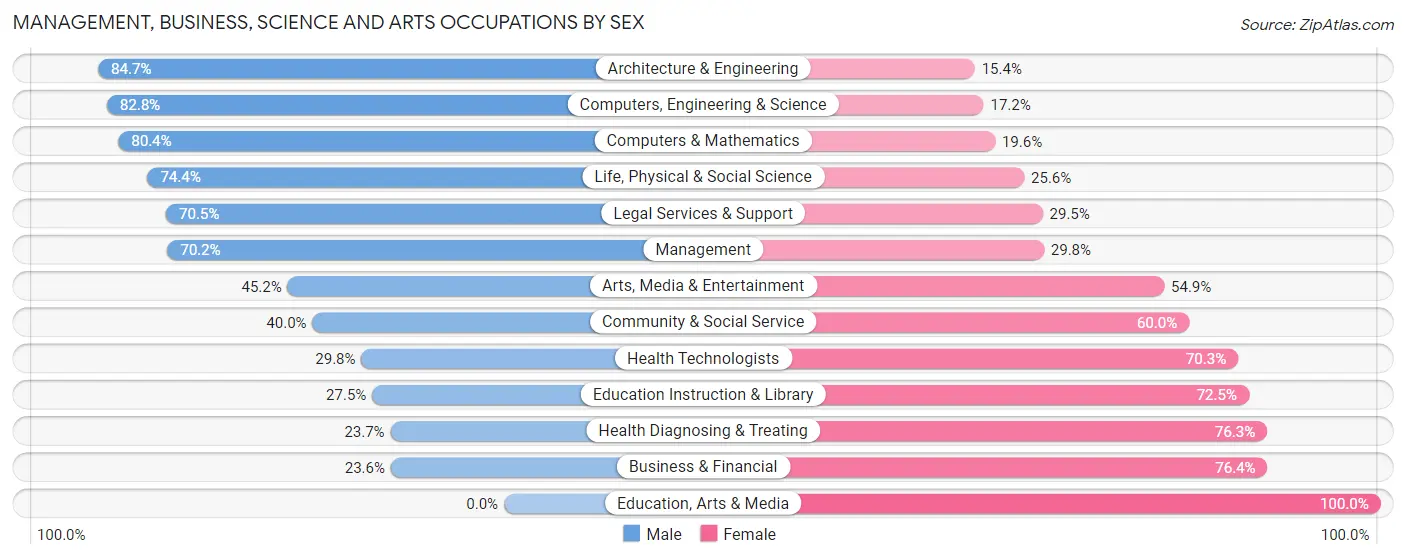
Management, Business, Science and Arts Occupations by Sex
Within the Management, Business, Science and Arts occupations in Carmel Valley Village, the most male-oriented occupations are Architecture & Engineering (84.7%), Computers, Engineering & Science (82.8%), and Computers & Mathematics (80.4%), while the most female-oriented occupations are Education, Arts & Media (100.0%), Business & Financial (76.4%), and Health Diagnosing & Treating (76.3%).
| Occupation | Male | Female |
| Management | 210 (70.2%) | 89 (29.8%) |
| Business & Financial | 17 (23.6%) | 55 (76.4%) |
| Computers, Engineering & Science | 270 (82.8%) | 56 (17.2%) |
| Computers & Mathematics | 37 (80.4%) | 9 (19.6%) |
| Architecture & Engineering | 204 (84.7%) | 37 (15.3%) |
| Life, Physical & Social Science | 29 (74.4%) | 10 (25.6%) |
| Community & Social Service | 191 (40.0%) | 287 (60.0%) |
| Education, Arts & Media | 0 (0.0%) | 11 (100.0%) |
| Legal Services & Support | 43 (70.5%) | 18 (29.5%) |
| Education Instruction & Library | 55 (27.5%) | 145 (72.5%) |
| Arts, Media & Entertainment | 93 (45.2%) | 113 (54.8%) |
| Health Diagnosing & Treating | 36 (23.7%) | 116 (76.3%) |
| Health Technologists | 36 (29.7%) | 85 (70.3%) |
| Total (Category) | 724 (54.6%) | 603 (45.4%) |
| Total (Overall) | 1,106 (52.8%) | 989 (47.2%) |
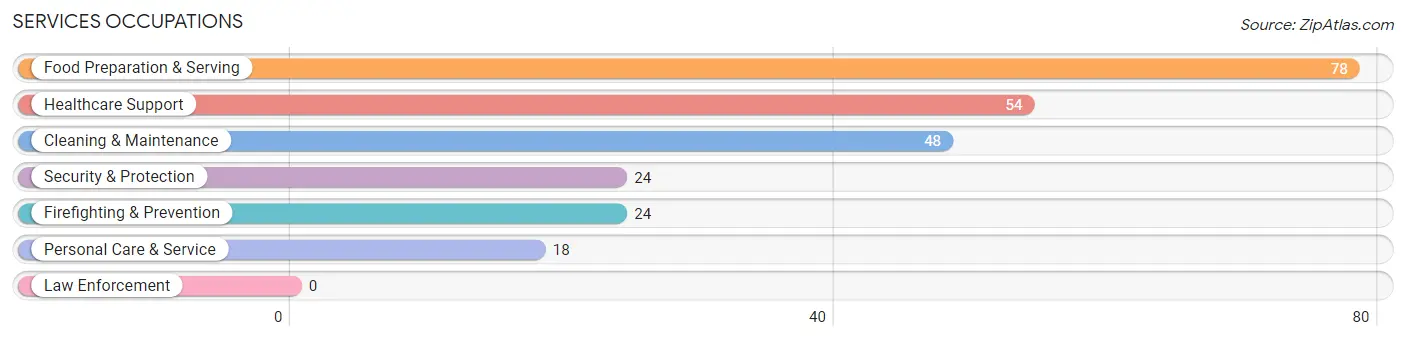
Services Occupations
The most common Services occupations in Carmel Valley Village are Food Preparation & Serving (78 | 3.7%), Healthcare Support (54 | 2.6%), Cleaning & Maintenance (48 | 2.3%), Security & Protection (24 | 1.1%), and Firefighting & Prevention (24 | 1.1%).
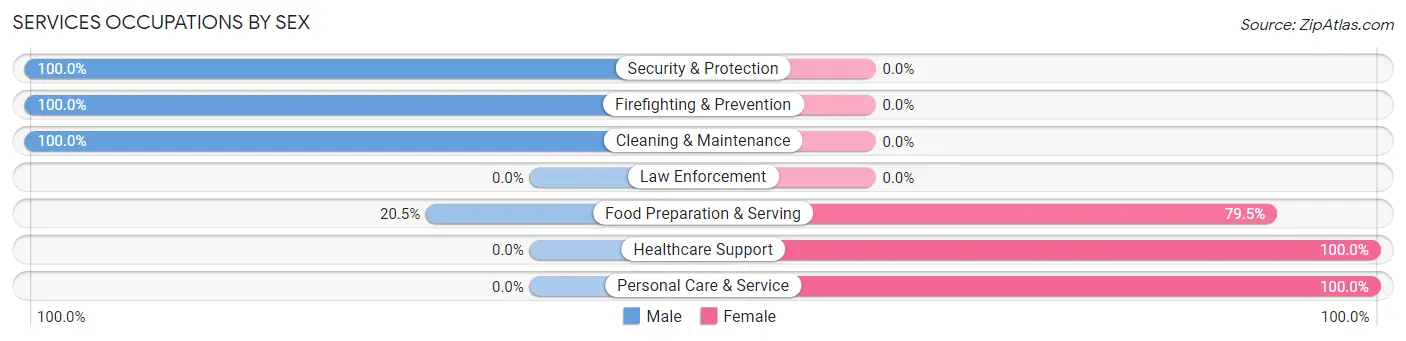
Services Occupations by Sex
Within the Services occupations in Carmel Valley Village, the most male-oriented occupations are Security & Protection (100.0%), Firefighting & Prevention (100.0%), and Cleaning & Maintenance (100.0%), while the most female-oriented occupations are Healthcare Support (100.0%), Personal Care & Service (100.0%), and Food Preparation & Serving (79.5%).
| Occupation | Male | Female |
| Healthcare Support | 0 (0.0%) | 54 (100.0%) |
| Security & Protection | 24 (100.0%) | 0 (0.0%) |
| Firefighting & Prevention | 24 (100.0%) | 0 (0.0%) |
| Law Enforcement | 0 (0.0%) | 0 (0.0%) |
| Food Preparation & Serving | 16 (20.5%) | 62 (79.5%) |
| Cleaning & Maintenance | 48 (100.0%) | 0 (0.0%) |
| Personal Care & Service | 0 (0.0%) | 18 (100.0%) |
| Total (Category) | 88 (39.6%) | 134 (60.4%) |
| Total (Overall) | 1,106 (52.8%) | 989 (47.2%) |
Sales and Office Occupations
The most common Sales and Office occupations in Carmel Valley Village are Sales & Related (262 | 12.5%), and Office & Administration (147 | 7.0%).
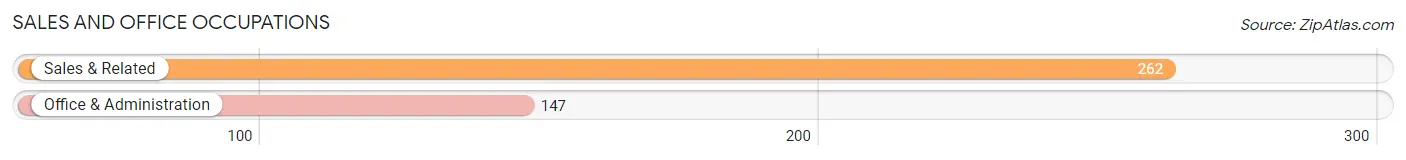
Sales and Office Occupations by Sex
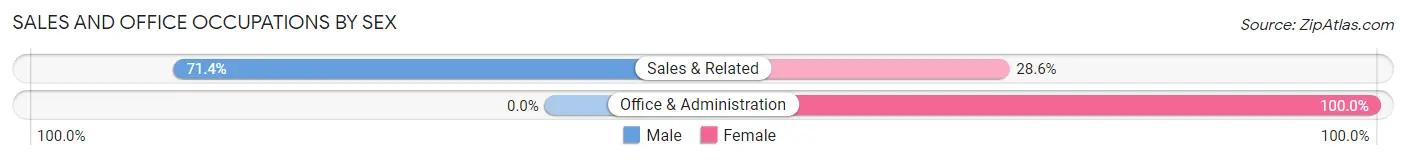
| Occupation | Male | Female |
| Sales & Related | 187 (71.4%) | 75 (28.6%) |
| Office & Administration | 0 (0.0%) | 147 (100.0%) |
| Total (Category) | 187 (45.7%) | 222 (54.3%) |
| Total (Overall) | 1,106 (52.8%) | 989 (47.2%) |
Natural Resources, Construction and Maintenance Occupations
The most common Natural Resources, Construction and Maintenance occupations in Carmel Valley Village are Construction & Extraction (106 | 5.1%), and Installation, Maintenance & Repair (17 | 0.8%).
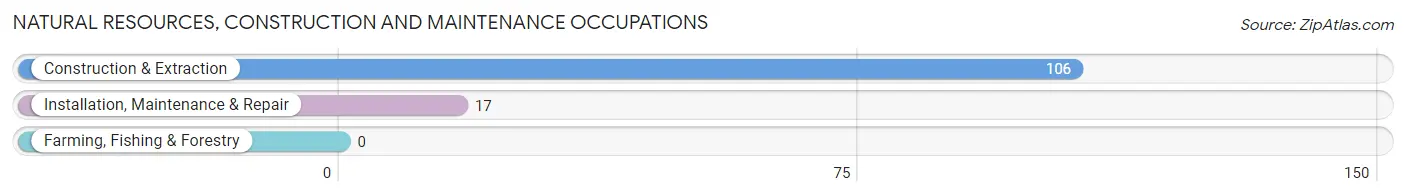
Natural Resources, Construction and Maintenance Occupations by Sex
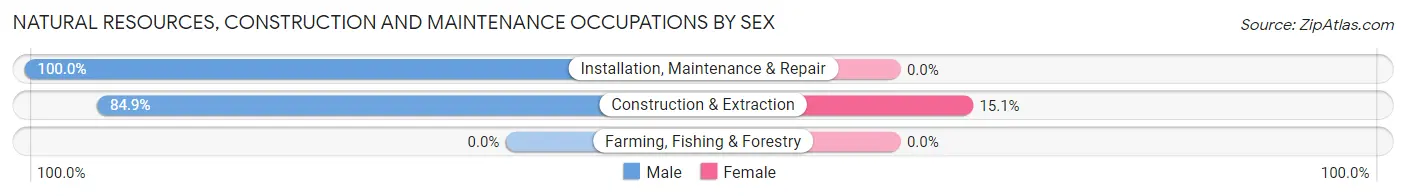
| Occupation | Male | Female |
| Farming, Fishing & Forestry | 0 (0.0%) | 0 (0.0%) |
| Construction & Extraction | 90 (84.9%) | 16 (15.1%) |
| Installation, Maintenance & Repair | 17 (100.0%) | 0 (0.0%) |
| Total (Category) | 107 (87.0%) | 16 (13.0%) |
| Total (Overall) | 1,106 (52.8%) | 989 (47.2%) |
Production, Transportation and Moving Occupations
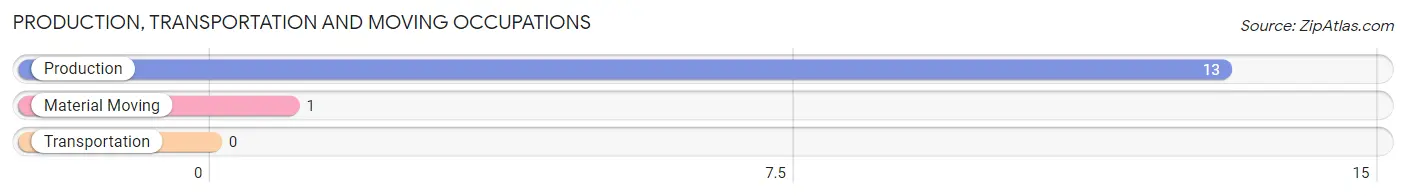
The most common Production, Transportation and Moving occupations in Carmel Valley Village are Production (13 | 0.6%), and Material Moving (1 | 0.1%).
Production, Transportation and Moving Occupations by Sex
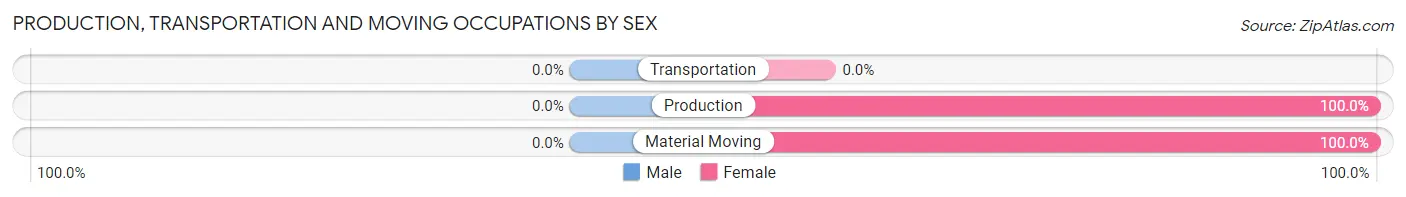
| Occupation | Male | Female |
| Production | 0 (0.0%) | 13 (100.0%) |
| Transportation | 0 (0.0%) | 0 (0.0%) |
| Material Moving | 0 (0.0%) | 1 (100.0%) |
| Total (Category) | 0 (0.0%) | 14 (100.0%) |
| Total (Overall) | 1,106 (52.8%) | 989 (47.2%) |
Employment Industries by Sex in Carmel Valley Village
Employment Industries in Carmel Valley Village
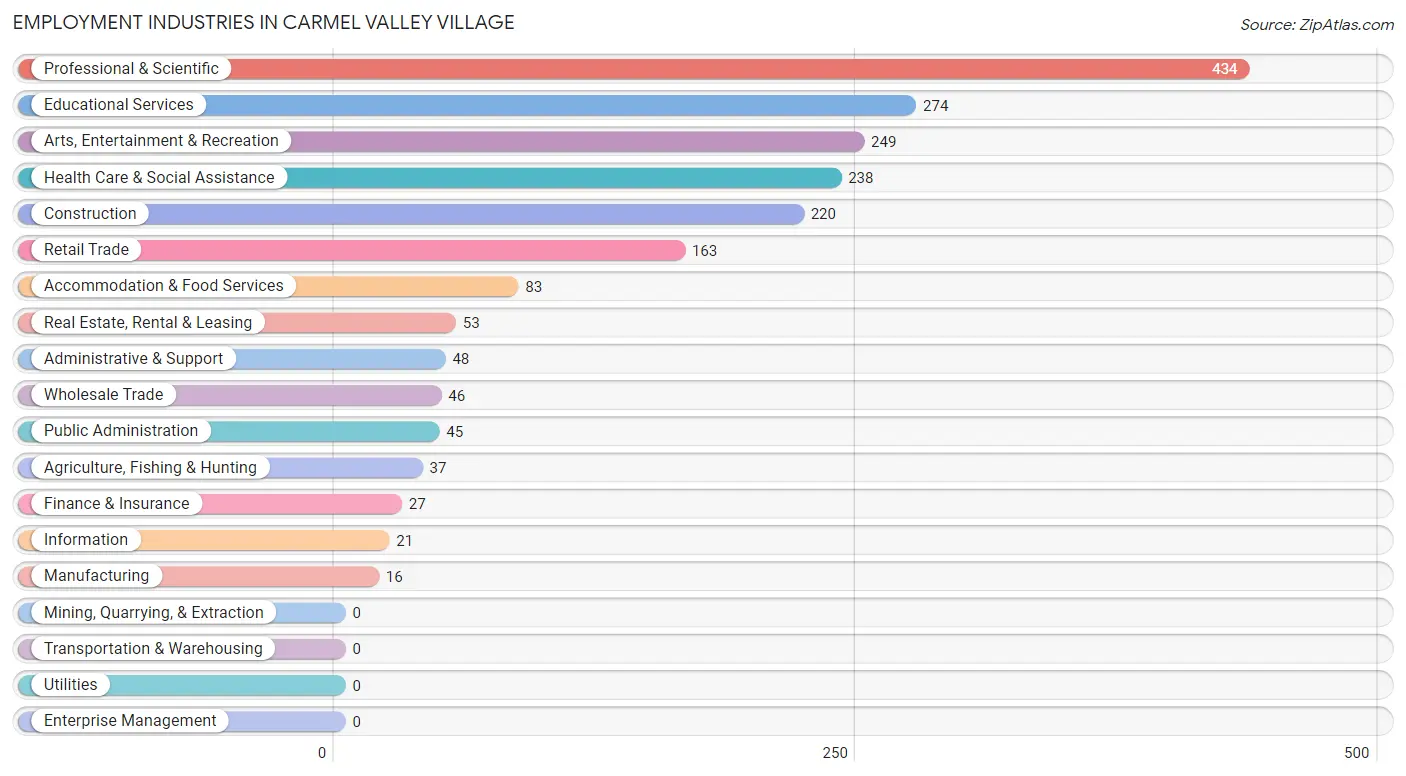
The major employment industries in Carmel Valley Village include Professional & Scientific (434 | 20.7%), Educational Services (274 | 13.1%), Arts, Entertainment & Recreation (249 | 11.9%), Health Care & Social Assistance (238 | 11.4%), and Construction (220 | 10.5%).
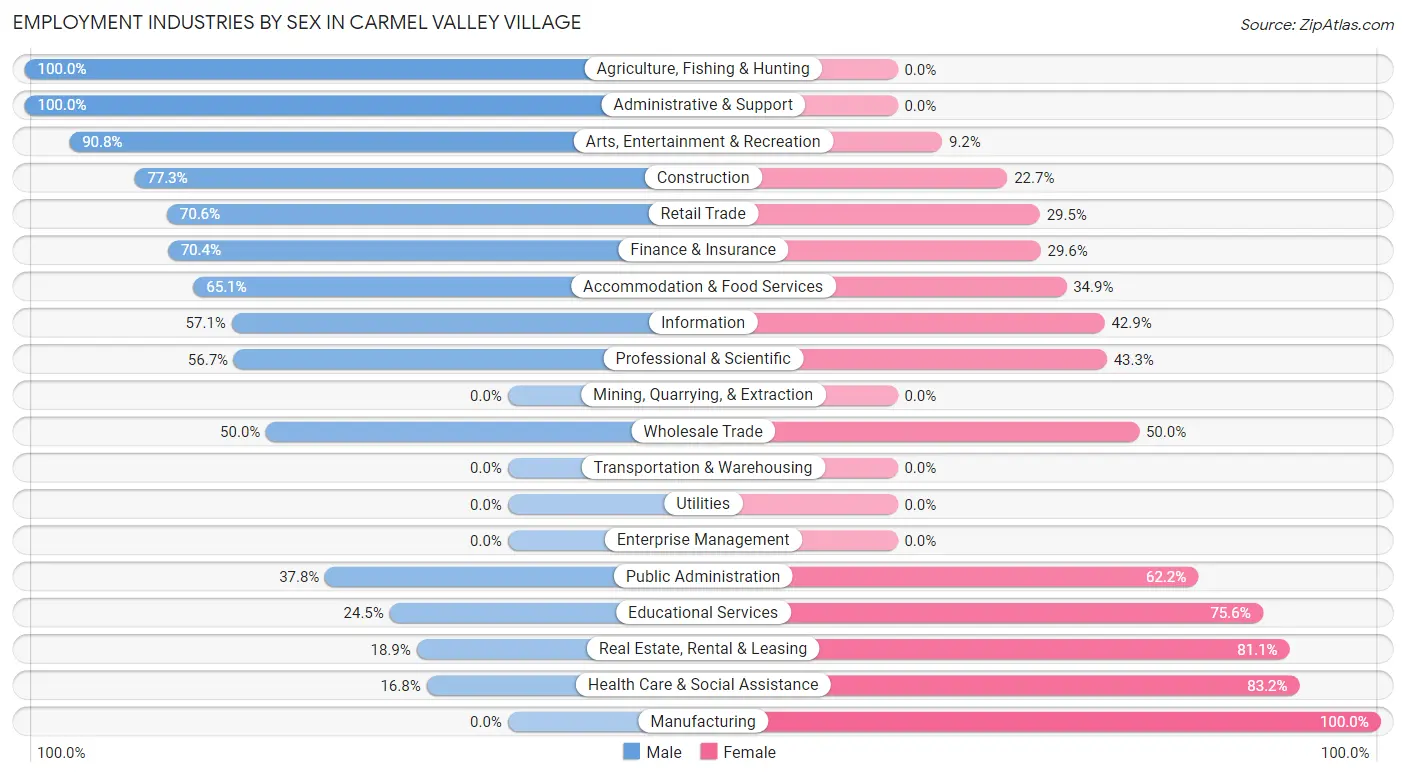
Employment Industries by Sex in Carmel Valley Village
The Carmel Valley Village industries that see more men than women are Agriculture, Fishing & Hunting (100.0%), Administrative & Support (100.0%), and Arts, Entertainment & Recreation (90.8%), whereas the industries that tend to have a higher number of women are Manufacturing (100.0%), Health Care & Social Assistance (83.2%), and Real Estate, Rental & Leasing (81.1%).
| Industry | Male | Female |
| Agriculture, Fishing & Hunting | 37 (100.0%) | 0 (0.0%) |
| Mining, Quarrying, & Extraction | 0 (0.0%) | 0 (0.0%) |
| Construction | 170 (77.3%) | 50 (22.7%) |
| Manufacturing | 0 (0.0%) | 16 (100.0%) |
| Wholesale Trade | 23 (50.0%) | 23 (50.0%) |
| Retail Trade | 115 (70.6%) | 48 (29.4%) |
| Transportation & Warehousing | 0 (0.0%) | 0 (0.0%) |
| Utilities | 0 (0.0%) | 0 (0.0%) |
| Information | 12 (57.1%) | 9 (42.9%) |
| Finance & Insurance | 19 (70.4%) | 8 (29.6%) |
| Real Estate, Rental & Leasing | 10 (18.9%) | 43 (81.1%) |
| Professional & Scientific | 246 (56.7%) | 188 (43.3%) |
| Enterprise Management | 0 (0.0%) | 0 (0.0%) |
| Administrative & Support | 48 (100.0%) | 0 (0.0%) |
| Educational Services | 67 (24.4%) | 207 (75.5%) |
| Health Care & Social Assistance | 40 (16.8%) | 198 (83.2%) |
| Arts, Entertainment & Recreation | 226 (90.8%) | 23 (9.2%) |
| Accommodation & Food Services | 54 (65.1%) | 29 (34.9%) |
| Public Administration | 17 (37.8%) | 28 (62.2%) |
| Total | 1,106 (52.8%) | 989 (47.2%) |
Education in Carmel Valley Village
School Enrollment in Carmel Valley Village
The most common levels of schooling among the 855 students in Carmel Valley Village are elementary school (258 | 30.2%), college / undergraduate (199 | 23.3%), and middle school (145 | 17.0%).
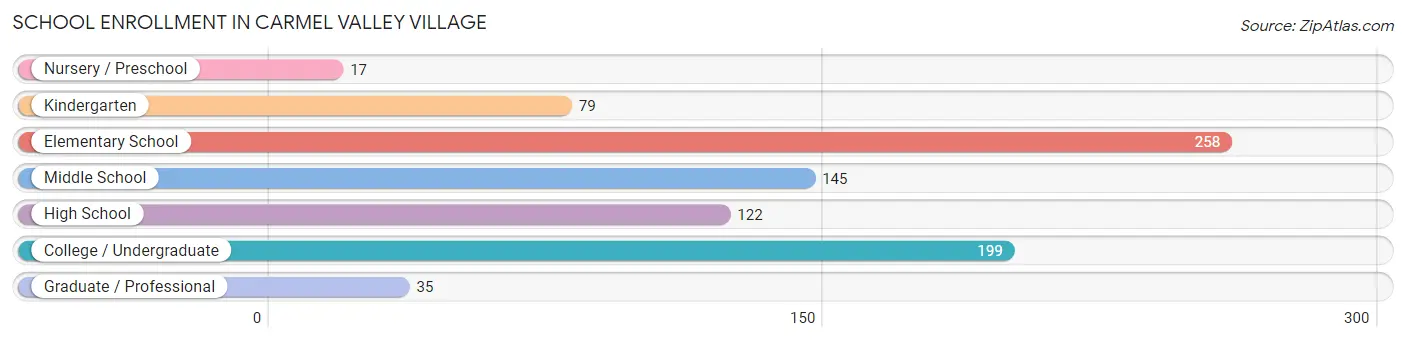
| School Level | # Students | % Students |
| Nursery / Preschool | 17 | 2.0% |
| Kindergarten | 79 | 9.2% |
| Elementary School | 258 | 30.2% |
| Middle School | 145 | 17.0% |
| High School | 122 | 14.3% |
| College / Undergraduate | 199 | 23.3% |
| Graduate / Professional | 35 | 4.1% |
| Total | 855 | 100.0% |
School Enrollment by Age by Funding Source in Carmel Valley Village
Out of a total of 855 students who are enrolled in schools in Carmel Valley Village, 126 (14.7%) attend a private institution, while the remaining 729 (85.3%) are enrolled in public schools. The age group of 3 to 4 year olds has the highest likelihood of being enrolled in private schools, with 9 (100.0% in the age bracket) enrolled. Conversely, the age group of 10 to 14 year olds has the lowest likelihood of being enrolled in a private school, with 240 (100.0% in the age bracket) attending a public institution.
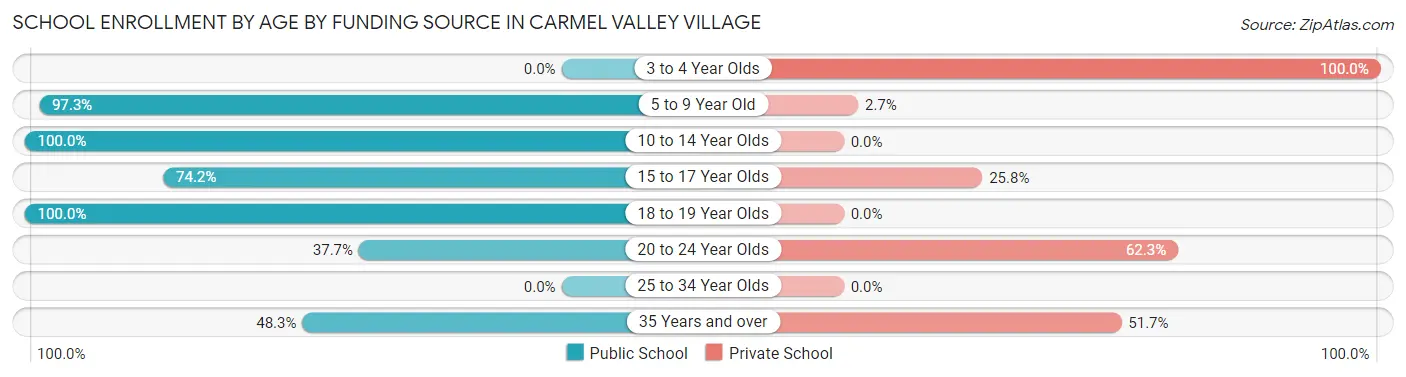
| Age Bracket | Public School | Private School |
| 3 to 4 Year Olds | 0 (0.0%) | 9 (100.0%) |
| 5 to 9 Year Old | 290 (97.3%) | 8 (2.7%) |
| 10 to 14 Year Olds | 240 (100.0%) | 0 (0.0%) |
| 15 to 17 Year Olds | 46 (74.2%) | 16 (25.8%) |
| 18 to 19 Year Olds | 77 (100.0%) | 0 (0.0%) |
| 20 to 24 Year Olds | 20 (37.7%) | 33 (62.3%) |
| 25 to 34 Year Olds | 0 (0.0%) | 0 (0.0%) |
| 35 Years and over | 56 (48.3%) | 60 (51.7%) |
| Total | 729 (85.3%) | 126 (14.7%) |
Educational Attainment by Field of Study in Carmel Valley Village
Business (358 | 13.6%), liberal arts & history (334 | 12.6%), social sciences (329 | 12.4%), literature & languages (245 | 9.3%), and visual & performing arts (222 | 8.4%) are the most common fields of study among 2,642 individuals in Carmel Valley Village who have obtained a bachelor's degree or higher.
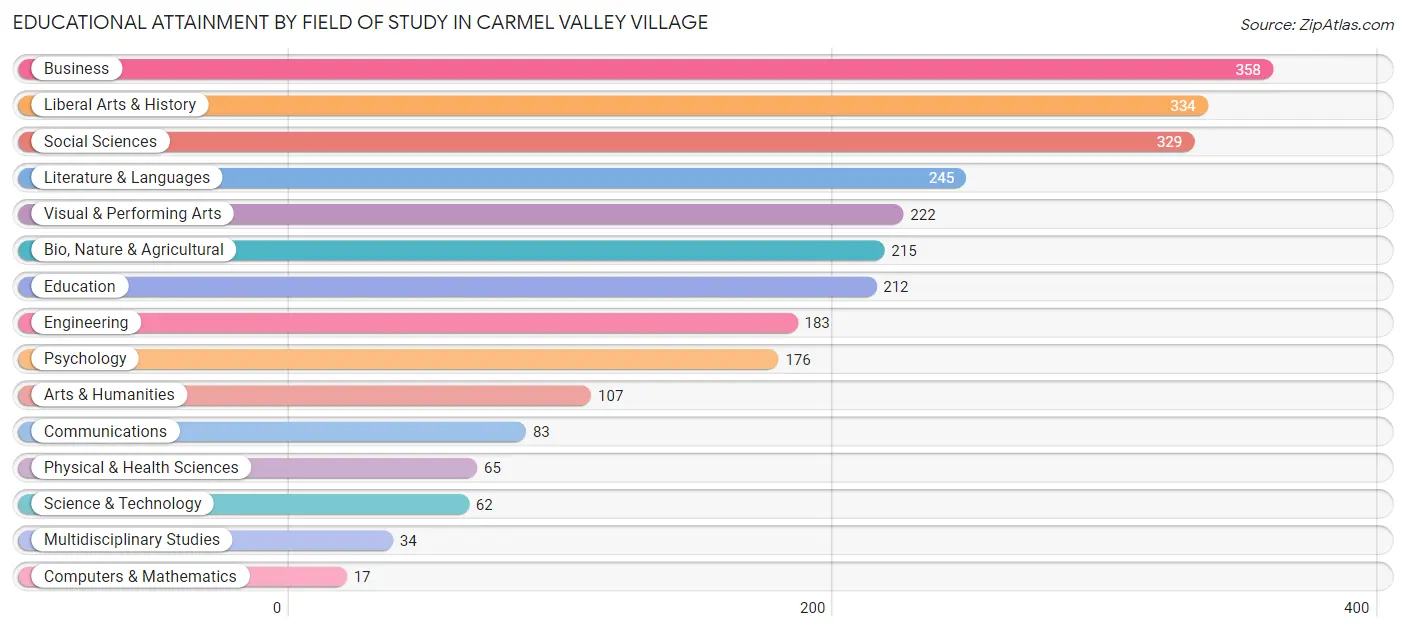
| Field of Study | # Graduates | % Graduates |
| Computers & Mathematics | 17 | 0.6% |
| Bio, Nature & Agricultural | 215 | 8.1% |
| Physical & Health Sciences | 65 | 2.5% |
| Psychology | 176 | 6.7% |
| Social Sciences | 329 | 12.4% |
| Engineering | 183 | 6.9% |
| Multidisciplinary Studies | 34 | 1.3% |
| Science & Technology | 62 | 2.4% |
| Business | 358 | 13.6% |
| Education | 212 | 8.0% |
| Literature & Languages | 245 | 9.3% |
| Liberal Arts & History | 334 | 12.6% |
| Visual & Performing Arts | 222 | 8.4% |
| Communications | 83 | 3.1% |
| Arts & Humanities | 107 | 4.1% |
| Total | 2,642 | 100.0% |
Transportation & Commute in Carmel Valley Village
Vehicle Availability by Sex in Carmel Valley Village
The most prevalent vehicle ownership categories in Carmel Valley Village are males with 2 vehicles (464, accounting for 43.6%) and females with 2 vehicles (378, making up 51.6%).
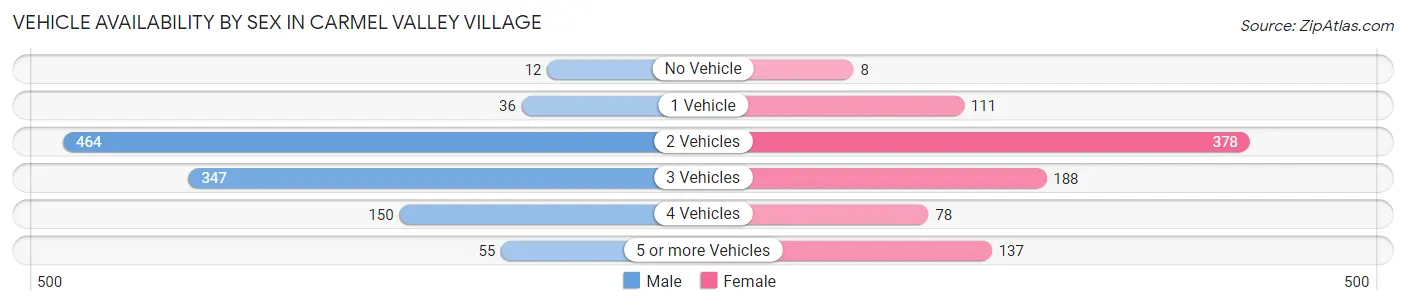
| Vehicles Available | Male | Female |
| No Vehicle | 12 (1.1%) | 8 (0.9%) |
| 1 Vehicle | 36 (3.4%) | 111 (12.3%) |
| 2 Vehicles | 464 (43.6%) | 378 (42.0%) |
| 3 Vehicles | 347 (32.6%) | 188 (20.9%) |
| 4 Vehicles | 150 (14.1%) | 78 (8.7%) |
| 5 or more Vehicles | 55 (5.2%) | 137 (15.2%) |
| Total | 1,064 (100.0%) | 900 (100.0%) |
Commute Time in Carmel Valley Village
The most frequently occuring commute durations in Carmel Valley Village are 30 to 34 minutes (331 commuters, 23.7%), 25 to 29 minutes (256 commuters, 18.3%), and 20 to 24 minutes (236 commuters, 16.9%).
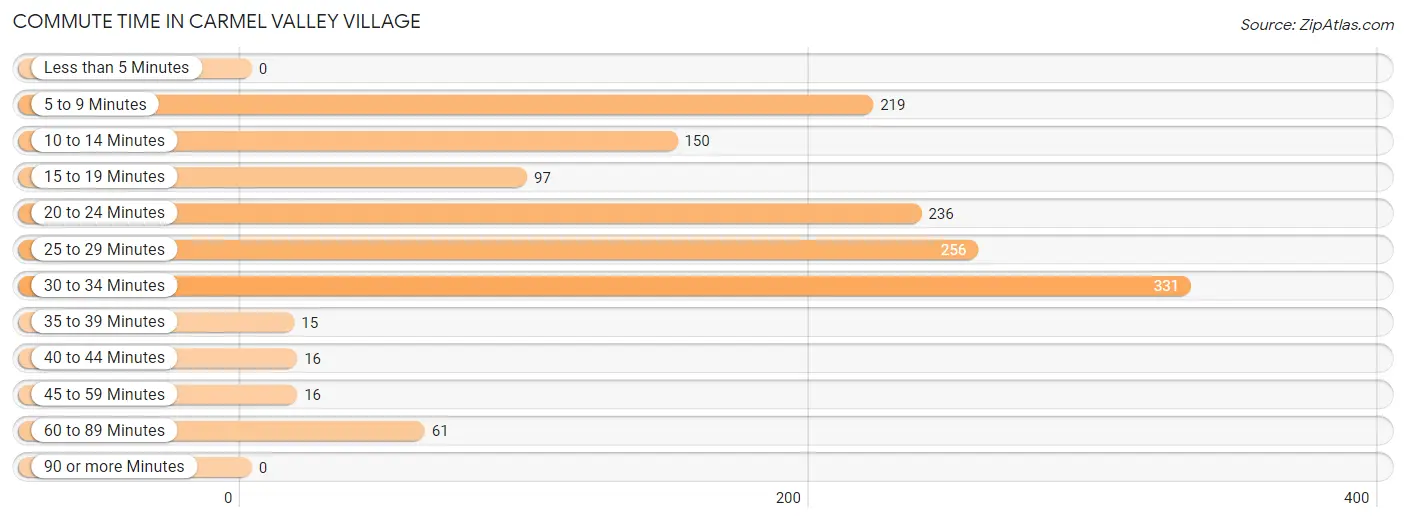
| Commute Time | # Commuters | % Commuters |
| Less than 5 Minutes | 0 | 0.0% |
| 5 to 9 Minutes | 219 | 15.7% |
| 10 to 14 Minutes | 150 | 10.7% |
| 15 to 19 Minutes | 97 | 6.9% |
| 20 to 24 Minutes | 236 | 16.9% |
| 25 to 29 Minutes | 256 | 18.3% |
| 30 to 34 Minutes | 331 | 23.7% |
| 35 to 39 Minutes | 15 | 1.1% |
| 40 to 44 Minutes | 16 | 1.1% |
| 45 to 59 Minutes | 16 | 1.1% |
| 60 to 89 Minutes | 61 | 4.4% |
| 90 or more Minutes | 0 | 0.0% |
Commute Time by Sex in Carmel Valley Village
The most common commute times in Carmel Valley Village are 20 to 24 minutes (176 commuters, 24.4%) for males and 30 to 34 minutes (215 commuters, 31.8%) for females.
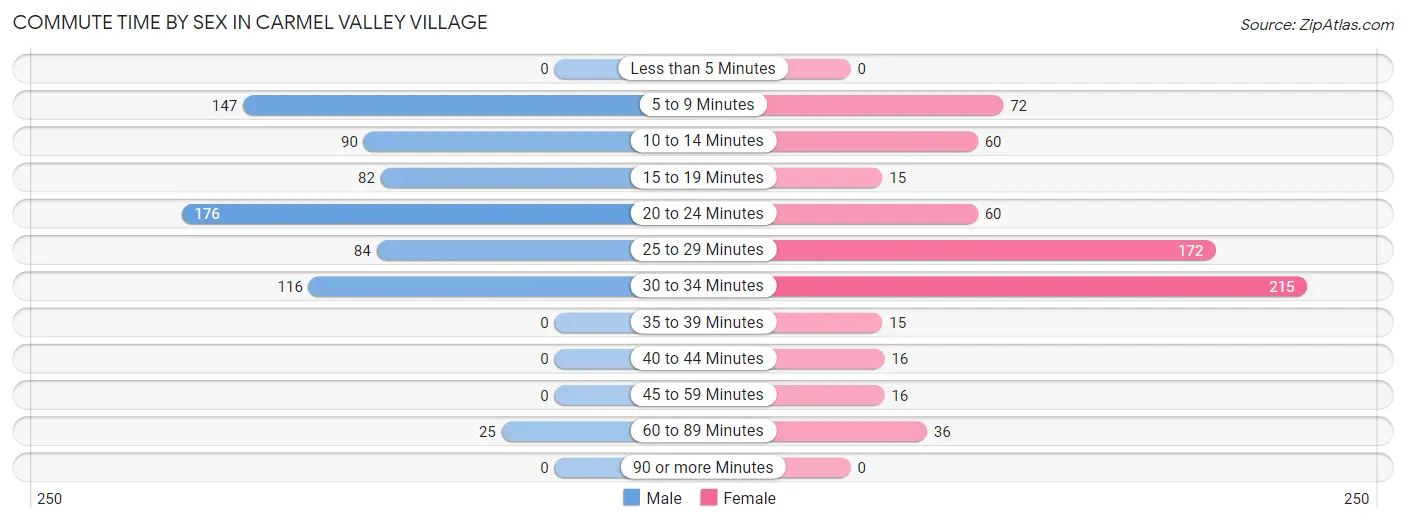
| Commute Time | Male | Female |
| Less than 5 Minutes | 0 (0.0%) | 0 (0.0%) |
| 5 to 9 Minutes | 147 (20.4%) | 72 (10.6%) |
| 10 to 14 Minutes | 90 (12.5%) | 60 (8.9%) |
| 15 to 19 Minutes | 82 (11.4%) | 15 (2.2%) |
| 20 to 24 Minutes | 176 (24.4%) | 60 (8.9%) |
| 25 to 29 Minutes | 84 (11.7%) | 172 (25.4%) |
| 30 to 34 Minutes | 116 (16.1%) | 215 (31.8%) |
| 35 to 39 Minutes | 0 (0.0%) | 15 (2.2%) |
| 40 to 44 Minutes | 0 (0.0%) | 16 (2.4%) |
| 45 to 59 Minutes | 0 (0.0%) | 16 (2.4%) |
| 60 to 89 Minutes | 25 (3.5%) | 36 (5.3%) |
| 90 or more Minutes | 0 (0.0%) | 0 (0.0%) |
Time of Departure to Work by Sex in Carmel Valley Village
The most frequent times of departure to work in Carmel Valley Village are 7:30 AM to 7:59 AM (221, 30.7%) for males and 7:30 AM to 7:59 AM (223, 32.9%) for females.
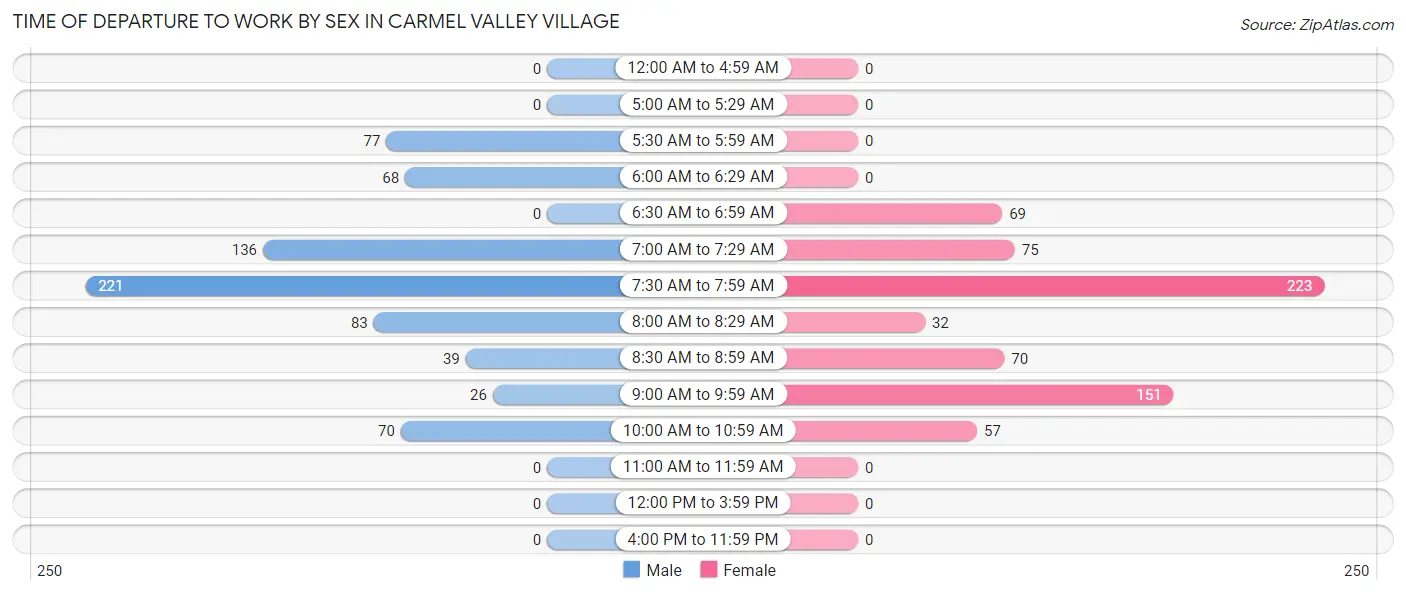
| Time of Departure | Male | Female |
| 12:00 AM to 4:59 AM | 0 (0.0%) | 0 (0.0%) |
| 5:00 AM to 5:29 AM | 0 (0.0%) | 0 (0.0%) |
| 5:30 AM to 5:59 AM | 77 (10.7%) | 0 (0.0%) |
| 6:00 AM to 6:29 AM | 68 (9.4%) | 0 (0.0%) |
| 6:30 AM to 6:59 AM | 0 (0.0%) | 69 (10.2%) |
| 7:00 AM to 7:29 AM | 136 (18.9%) | 75 (11.1%) |
| 7:30 AM to 7:59 AM | 221 (30.7%) | 223 (32.9%) |
| 8:00 AM to 8:29 AM | 83 (11.5%) | 32 (4.7%) |
| 8:30 AM to 8:59 AM | 39 (5.4%) | 70 (10.3%) |
| 9:00 AM to 9:59 AM | 26 (3.6%) | 151 (22.3%) |
| 10:00 AM to 10:59 AM | 70 (9.7%) | 57 (8.4%) |
| 11:00 AM to 11:59 AM | 0 (0.0%) | 0 (0.0%) |
| 12:00 PM to 3:59 PM | 0 (0.0%) | 0 (0.0%) |
| 4:00 PM to 11:59 PM | 0 (0.0%) | 0 (0.0%) |
| Total | 720 (100.0%) | 677 (100.0%) |
Housing Occupancy in Carmel Valley Village
Occupancy by Ownership in Carmel Valley Village
Of the total 1,970 dwellings in Carmel Valley Village, owner-occupied units account for 1,572 (79.8%), while renter-occupied units make up 398 (20.2%).
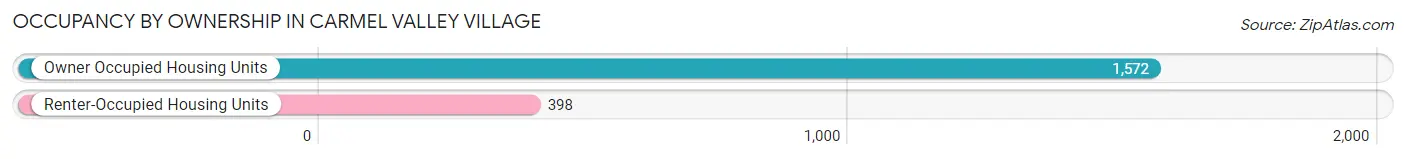
| Occupancy | # Housing Units | % Housing Units |
| Owner Occupied Housing Units | 1,572 | 79.8% |
| Renter-Occupied Housing Units | 398 | 20.2% |
| Total Occupied Housing Units | 1,970 | 100.0% |
Occupancy by Household Size in Carmel Valley Village
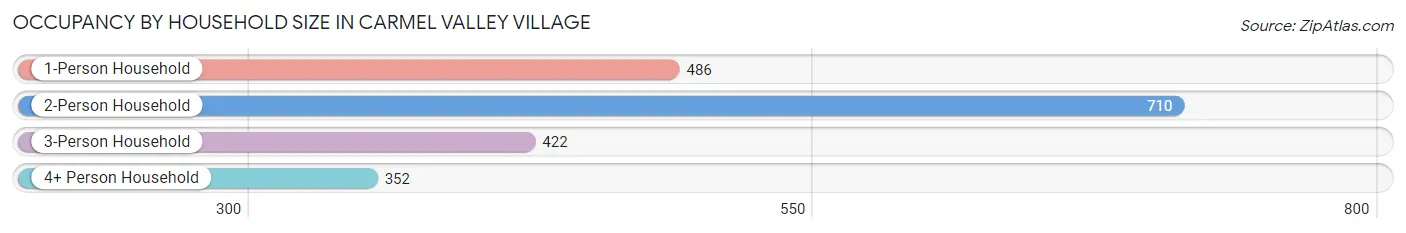
| Household Size | # Housing Units | % Housing Units |
| 1-Person Household | 486 | 24.7% |
| 2-Person Household | 710 | 36.0% |
| 3-Person Household | 422 | 21.4% |
| 4+ Person Household | 352 | 17.9% |
| Total Housing Units | 1,970 | 100.0% |
Occupancy by Ownership by Household Size in Carmel Valley Village
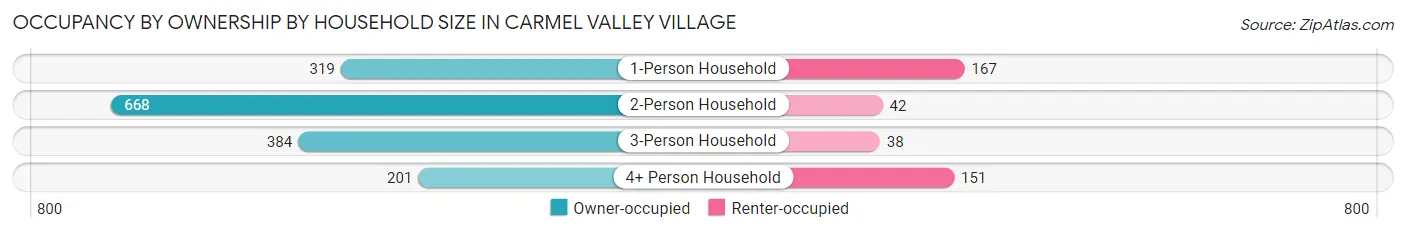
| Household Size | Owner-occupied | Renter-occupied |
| 1-Person Household | 319 (65.6%) | 167 (34.4%) |
| 2-Person Household | 668 (94.1%) | 42 (5.9%) |
| 3-Person Household | 384 (91.0%) | 38 (9.0%) |
| 4+ Person Household | 201 (57.1%) | 151 (42.9%) |
| Total Housing Units | 1,572 (79.8%) | 398 (20.2%) |
Occupancy by Educational Attainment in Carmel Valley Village
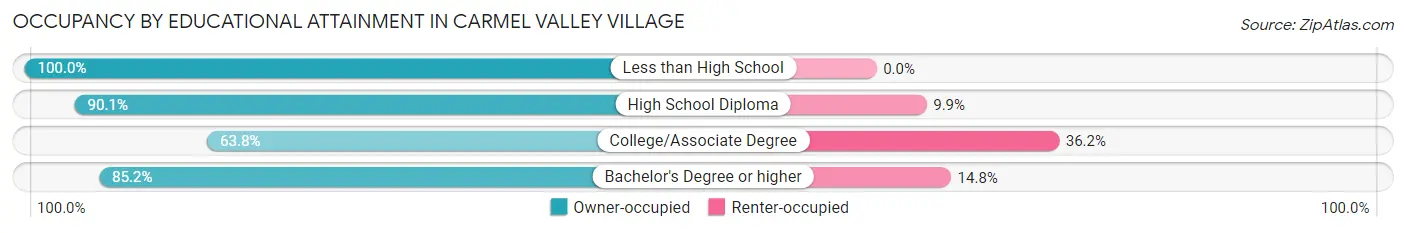
| Household Size | Owner-occupied | Renter-occupied |
| Less than High School | 55 (100.0%) | 0 (0.0%) |
| High School Diploma | 127 (90.1%) | 14 (9.9%) |
| College/Associate Degree | 363 (63.8%) | 206 (36.2%) |
| Bachelor's Degree or higher | 1,027 (85.2%) | 178 (14.8%) |
Occupancy by Age of Householder in Carmel Valley Village
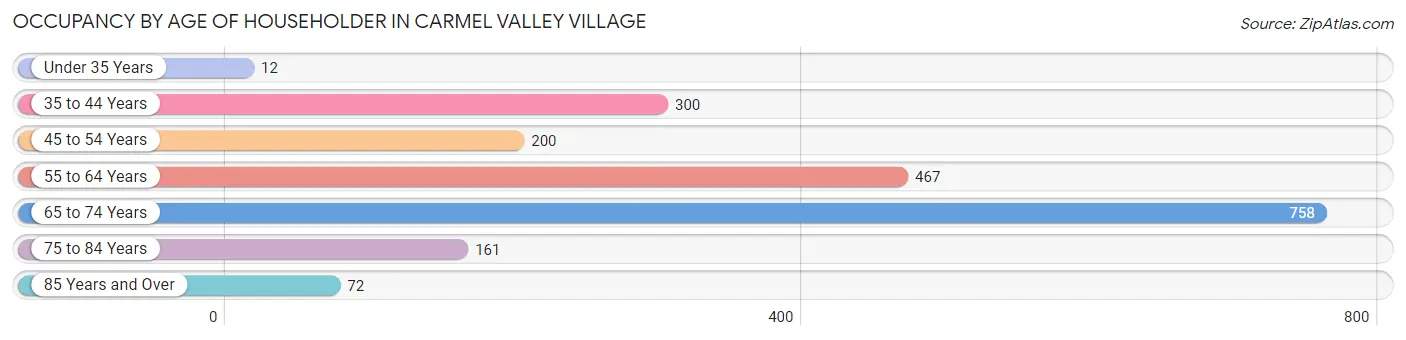
| Age Bracket | # Households | % Households |
| Under 35 Years | 12 | 0.6% |
| 35 to 44 Years | 300 | 15.2% |
| 45 to 54 Years | 200 | 10.2% |
| 55 to 64 Years | 467 | 23.7% |
| 65 to 74 Years | 758 | 38.5% |
| 75 to 84 Years | 161 | 8.2% |
| 85 Years and Over | 72 | 3.6% |
| Total | 1,970 | 100.0% |
Housing Finances in Carmel Valley Village
Median Income by Occupancy in Carmel Valley Village
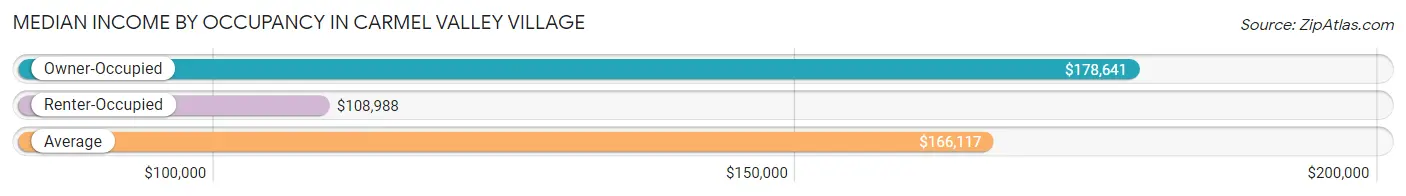
| Occupancy Type | # Households | Median Income |
| Owner-Occupied | 1,572 (79.8%) | $178,641 |
| Renter-Occupied | 398 (20.2%) | $108,988 |
| Average | 1,970 (100.0%) | $166,117 |
Occupancy by Householder Income Bracket in Carmel Valley Village
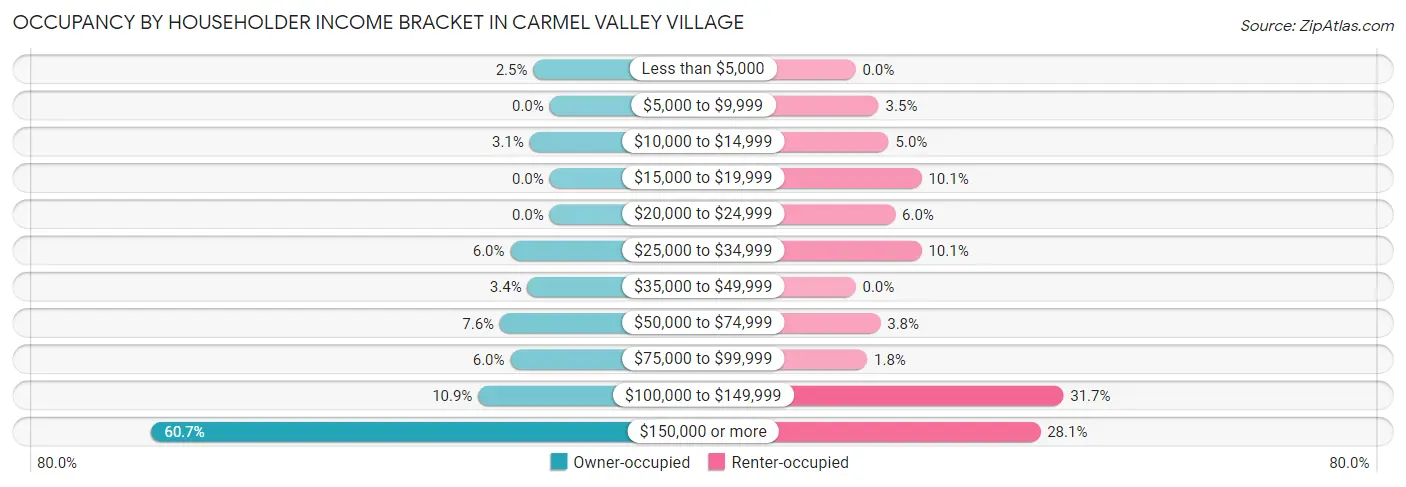
| Income Bracket | Owner-occupied | Renter-occupied |
| Less than $5,000 | 39 (2.5%) | 0 (0.0%) |
| $5,000 to $9,999 | 0 (0.0%) | 14 (3.5%) |
| $10,000 to $14,999 | 48 (3.0%) | 20 (5.0%) |
| $15,000 to $19,999 | 0 (0.0%) | 40 (10.1%) |
| $20,000 to $24,999 | 0 (0.0%) | 24 (6.0%) |
| $25,000 to $34,999 | 94 (6.0%) | 40 (10.1%) |
| $35,000 to $49,999 | 53 (3.4%) | 0 (0.0%) |
| $50,000 to $74,999 | 119 (7.6%) | 15 (3.8%) |
| $75,000 to $99,999 | 94 (6.0%) | 7 (1.8%) |
| $100,000 to $149,999 | 171 (10.9%) | 126 (31.7%) |
| $150,000 or more | 954 (60.7%) | 112 (28.1%) |
| Total | 1,572 (100.0%) | 398 (100.0%) |
Monthly Housing Cost Tiers in Carmel Valley Village
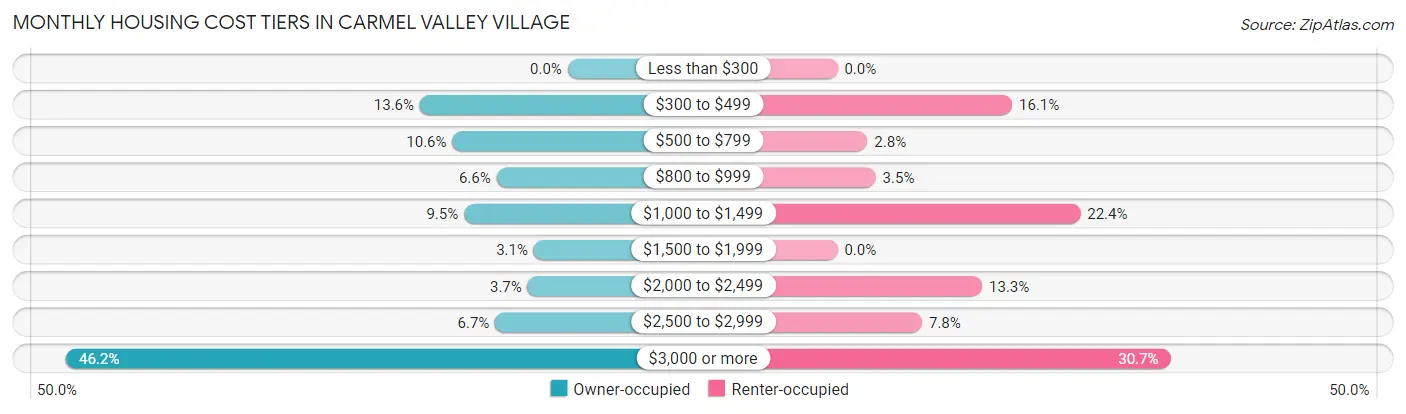
| Monthly Cost | Owner-occupied | Renter-occupied |
| Less than $300 | 0 (0.0%) | 0 (0.0%) |
| $300 to $499 | 214 (13.6%) | 64 (16.1%) |
| $500 to $799 | 167 (10.6%) | 11 (2.8%) |
| $800 to $999 | 103 (6.6%) | 14 (3.5%) |
| $1,000 to $1,499 | 150 (9.5%) | 89 (22.4%) |
| $1,500 to $1,999 | 49 (3.1%) | 0 (0.0%) |
| $2,000 to $2,499 | 58 (3.7%) | 53 (13.3%) |
| $2,500 to $2,999 | 105 (6.7%) | 31 (7.8%) |
| $3,000 or more | 726 (46.2%) | 122 (30.6%) |
| Total | 1,572 (100.0%) | 398 (100.0%) |
Physical Housing Characteristics in Carmel Valley Village
Housing Structures in Carmel Valley Village
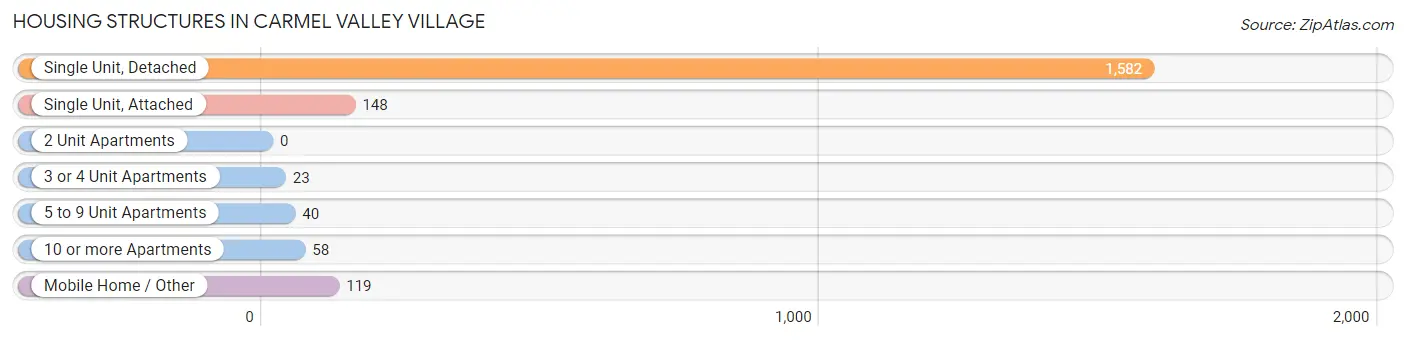
| Structure Type | # Housing Units | % Housing Units |
| Single Unit, Detached | 1,582 | 80.3% |
| Single Unit, Attached | 148 | 7.5% |
| 2 Unit Apartments | 0 | 0.0% |
| 3 or 4 Unit Apartments | 23 | 1.2% |
| 5 to 9 Unit Apartments | 40 | 2.0% |
| 10 or more Apartments | 58 | 2.9% |
| Mobile Home / Other | 119 | 6.0% |
| Total | 1,970 | 100.0% |
Housing Structures by Occupancy in Carmel Valley Village
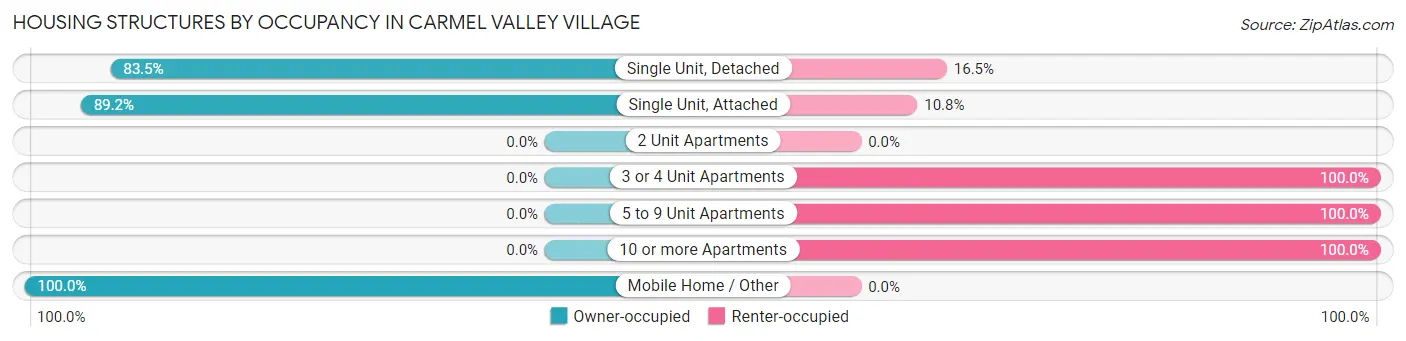
| Structure Type | Owner-occupied | Renter-occupied |
| Single Unit, Detached | 1,321 (83.5%) | 261 (16.5%) |
| Single Unit, Attached | 132 (89.2%) | 16 (10.8%) |
| 2 Unit Apartments | 0 (0.0%) | 0 (0.0%) |
| 3 or 4 Unit Apartments | 0 (0.0%) | 23 (100.0%) |
| 5 to 9 Unit Apartments | 0 (0.0%) | 40 (100.0%) |
| 10 or more Apartments | 0 (0.0%) | 58 (100.0%) |
| Mobile Home / Other | 119 (100.0%) | 0 (0.0%) |
| Total | 1,572 (79.8%) | 398 (20.2%) |
Housing Structures by Number of Rooms in Carmel Valley Village
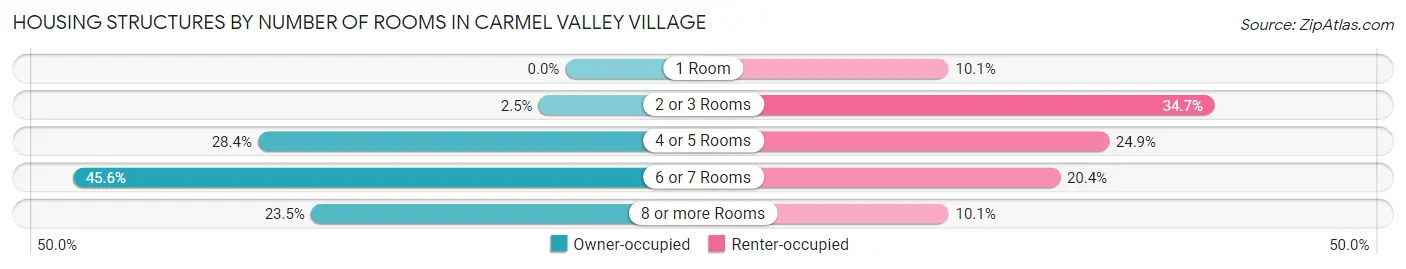
| Number of Rooms | Owner-occupied | Renter-occupied |
| 1 Room | 0 (0.0%) | 40 (10.1%) |
| 2 or 3 Rooms | 39 (2.5%) | 138 (34.7%) |
| 4 or 5 Rooms | 447 (28.4%) | 99 (24.9%) |
| 6 or 7 Rooms | 716 (45.6%) | 81 (20.3%) |
| 8 or more Rooms | 370 (23.5%) | 40 (10.1%) |
| Total | 1,572 (100.0%) | 398 (100.0%) |
Housing Structure by Heating Type in Carmel Valley Village
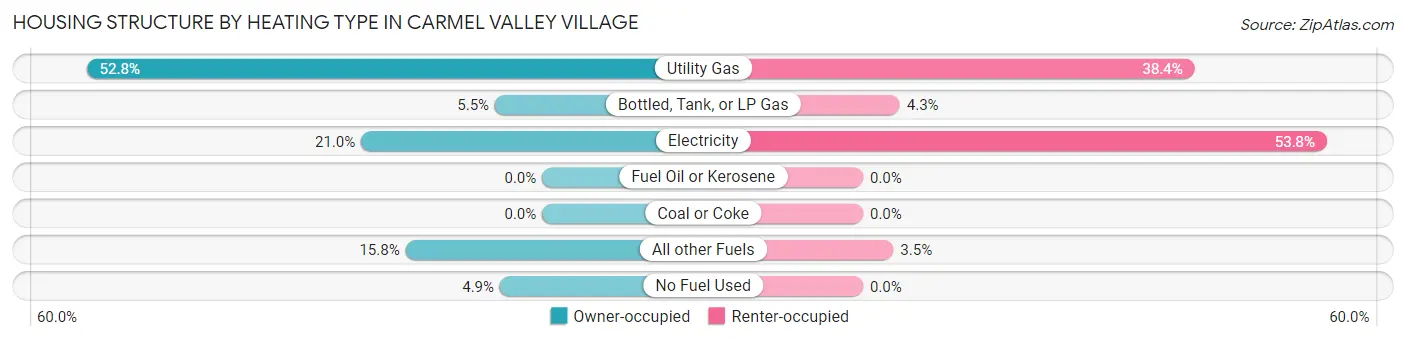
| Heating Type | Owner-occupied | Renter-occupied |
| Utility Gas | 830 (52.8%) | 153 (38.4%) |
| Bottled, Tank, or LP Gas | 86 (5.5%) | 17 (4.3%) |
| Electricity | 330 (21.0%) | 214 (53.8%) |
| Fuel Oil or Kerosene | 0 (0.0%) | 0 (0.0%) |
| Coal or Coke | 0 (0.0%) | 0 (0.0%) |
| All other Fuels | 249 (15.8%) | 14 (3.5%) |
| No Fuel Used | 77 (4.9%) | 0 (0.0%) |
| Total | 1,572 (100.0%) | 398 (100.0%) |
Household Vehicle Usage in Carmel Valley Village
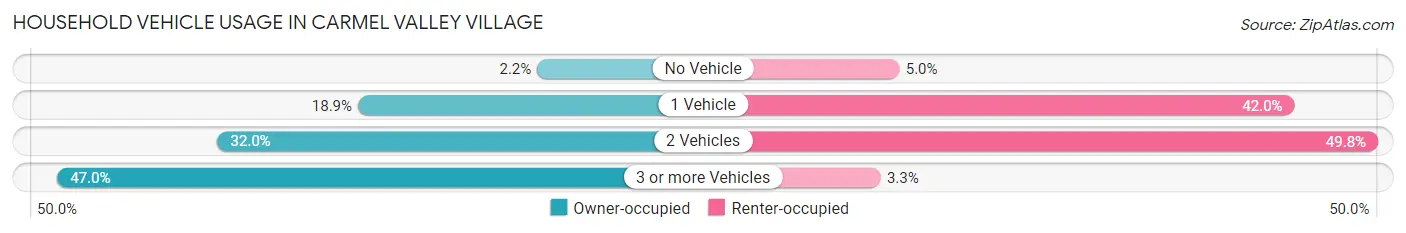
| Vehicles per Household | Owner-occupied | Renter-occupied |
| No Vehicle | 34 (2.2%) | 20 (5.0%) |
| 1 Vehicle | 297 (18.9%) | 167 (42.0%) |
| 2 Vehicles | 503 (32.0%) | 198 (49.7%) |
| 3 or more Vehicles | 738 (46.9%) | 13 (3.3%) |
| Total | 1,572 (100.0%) | 398 (100.0%) |
Real Estate & Mortgages in Carmel Valley Village
Real Estate and Mortgage Overview in Carmel Valley Village
| Characteristic | Without Mortgage | With Mortgage |
| Housing Units | 639 | 933 |
| Median Property Value | $880,900 | $1,164,400 |
| Median Household Income | $120,375 | $643 |
| Monthly Housing Costs | $619 | $704 |
| Real Estate Taxes | $2,569 | $77 |
Property Value by Mortgage Status in Carmel Valley Village
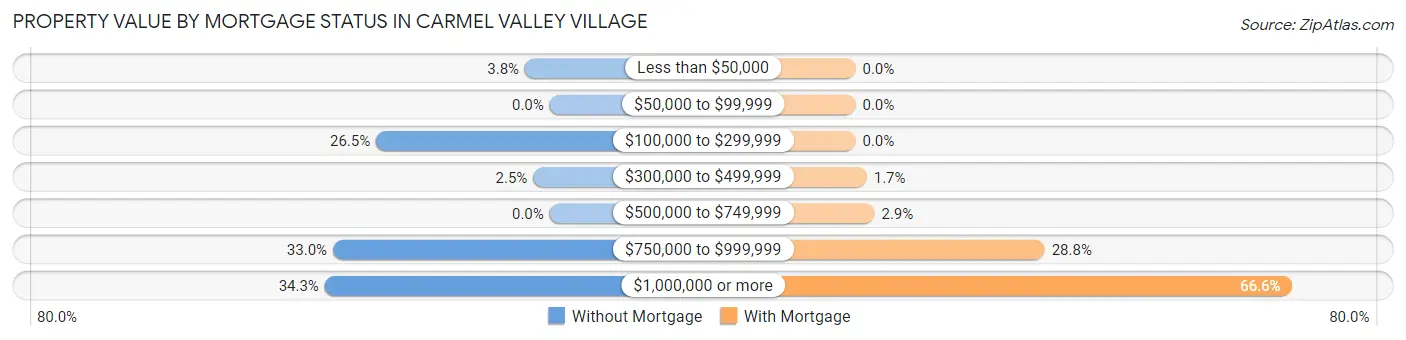
| Property Value | Without Mortgage | With Mortgage |
| Less than $50,000 | 24 (3.8%) | 0 (0.0%) |
| $50,000 to $99,999 | 0 (0.0%) | 0 (0.0%) |
| $100,000 to $299,999 | 169 (26.5%) | 0 (0.0%) |
| $300,000 to $499,999 | 16 (2.5%) | 16 (1.7%) |
| $500,000 to $749,999 | 0 (0.0%) | 27 (2.9%) |
| $750,000 to $999,999 | 211 (33.0%) | 269 (28.8%) |
| $1,000,000 or more | 219 (34.3%) | 621 (66.6%) |
| Total | 639 (100.0%) | 933 (100.0%) |
Household Income by Mortgage Status in Carmel Valley Village
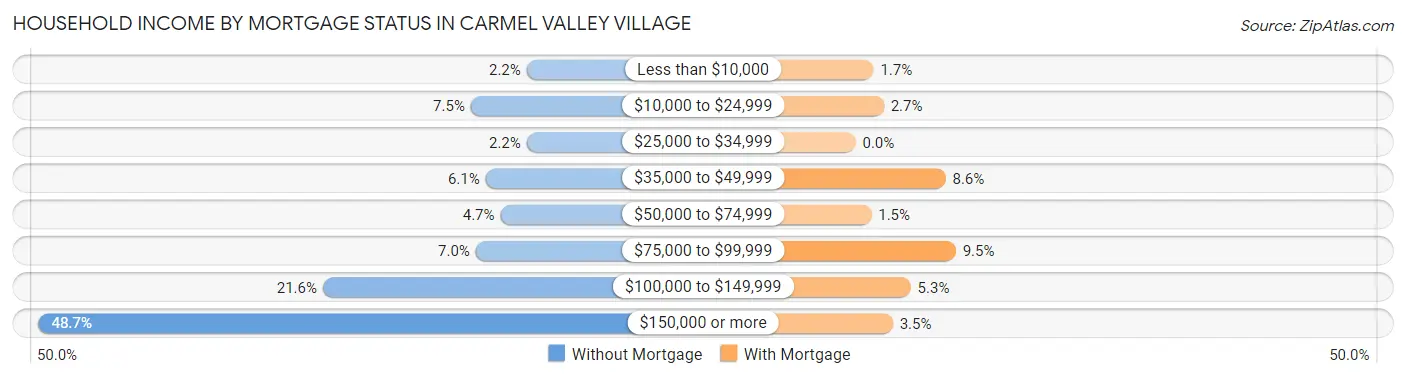
| Household Income | Without Mortgage | With Mortgage |
| Less than $10,000 | 14 (2.2%) | 16 (1.7%) |
| $10,000 to $24,999 | 48 (7.5%) | 25 (2.7%) |
| $25,000 to $34,999 | 14 (2.2%) | 0 (0.0%) |
| $35,000 to $49,999 | 39 (6.1%) | 80 (8.6%) |
| $50,000 to $74,999 | 30 (4.7%) | 14 (1.5%) |
| $75,000 to $99,999 | 45 (7.0%) | 89 (9.5%) |
| $100,000 to $149,999 | 138 (21.6%) | 49 (5.2%) |
| $150,000 or more | 311 (48.7%) | 33 (3.5%) |
| Total | 639 (100.0%) | 933 (100.0%) |
Property Value to Household Income Ratio in Carmel Valley Village
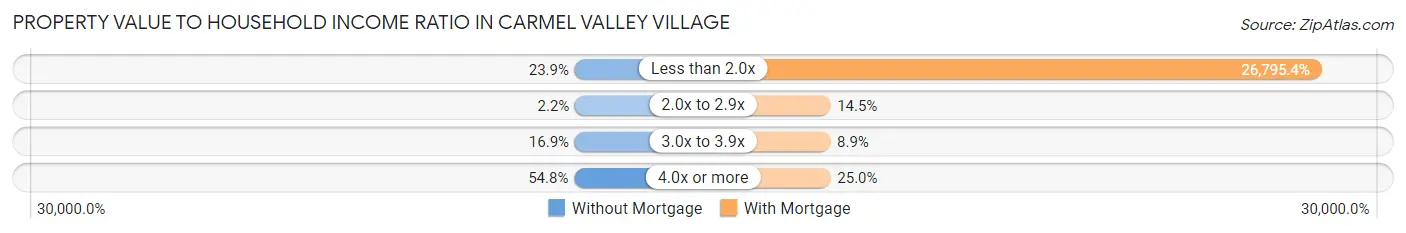
| Value-to-Income Ratio | Without Mortgage | With Mortgage |
| Less than 2.0x | 153 (23.9%) | 250,001 (26,795.4%) |
| 2.0x to 2.9x | 14 (2.2%) | 135 (14.5%) |
| 3.0x to 3.9x | 108 (16.9%) | 83 (8.9%) |
| 4.0x or more | 350 (54.8%) | 233 (25.0%) |
| Total | 639 (100.0%) | 933 (100.0%) |
Real Estate Taxes by Mortgage Status in Carmel Valley Village
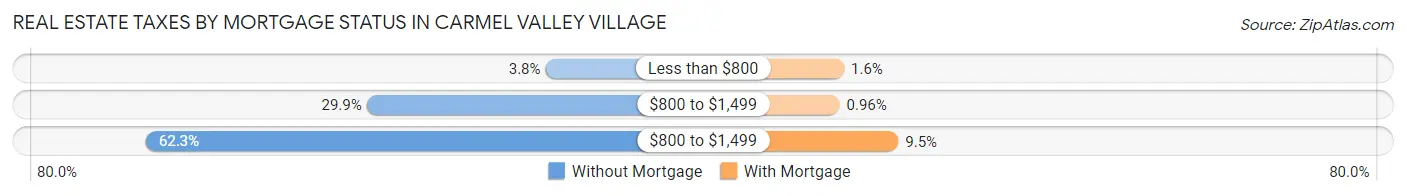
| Property Taxes | Without Mortgage | With Mortgage |
| Less than $800 | 24 (3.8%) | 15 (1.6%) |
| $800 to $1,499 | 191 (29.9%) | 9 (1.0%) |
| $800 to $1,499 | 398 (62.3%) | 89 (9.5%) |
| Total | 639 (100.0%) | 933 (100.0%) |
Health & Disability in Carmel Valley Village
Health Insurance Coverage by Age in Carmel Valley Village
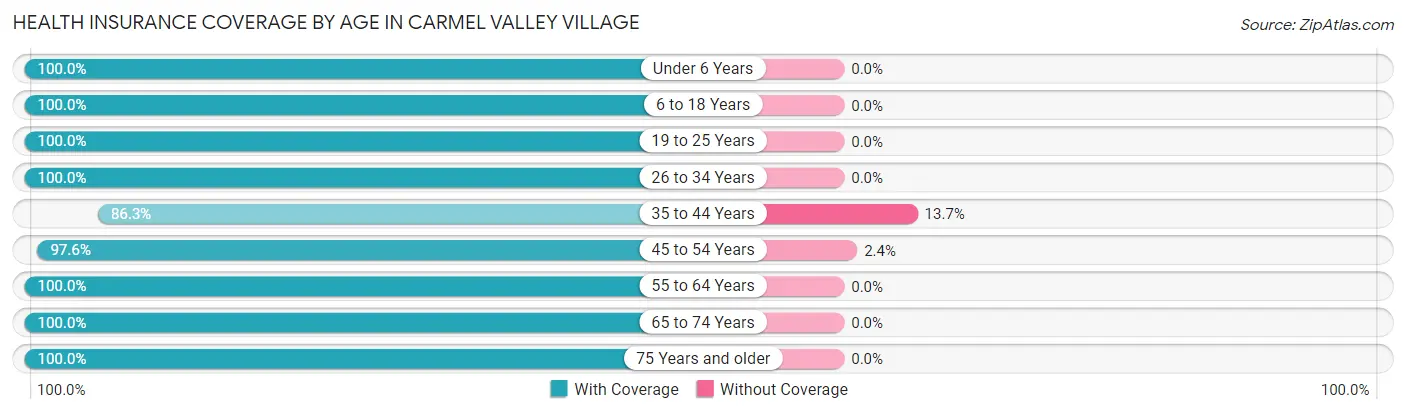
| Age Bracket | With Coverage | Without Coverage |
| Under 6 Years | 106 (100.0%) | 0 (0.0%) |
| 6 to 18 Years | 596 (100.0%) | 0 (0.0%) |
| 19 to 25 Years | 197 (100.0%) | 0 (0.0%) |
| 26 to 34 Years | 35 (100.0%) | 0 (0.0%) |
| 35 to 44 Years | 675 (86.3%) | 107 (13.7%) |
| 45 to 54 Years | 364 (97.6%) | 9 (2.4%) |
| 55 to 64 Years | 824 (100.0%) | 0 (0.0%) |
| 65 to 74 Years | 1,324 (100.0%) | 0 (0.0%) |
| 75 Years and older | 405 (100.0%) | 0 (0.0%) |
| Total | 4,526 (97.5%) | 116 (2.5%) |
Health Insurance Coverage by Citizenship Status in Carmel Valley Village
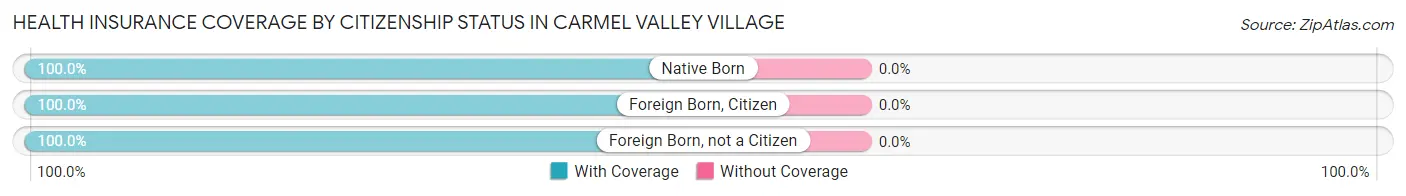
| Citizenship Status | With Coverage | Without Coverage |
| Native Born | 106 (100.0%) | 0 (0.0%) |
| Foreign Born, Citizen | 596 (100.0%) | 0 (0.0%) |
| Foreign Born, not a Citizen | 197 (100.0%) | 0 (0.0%) |
Health Insurance Coverage by Household Income in Carmel Valley Village
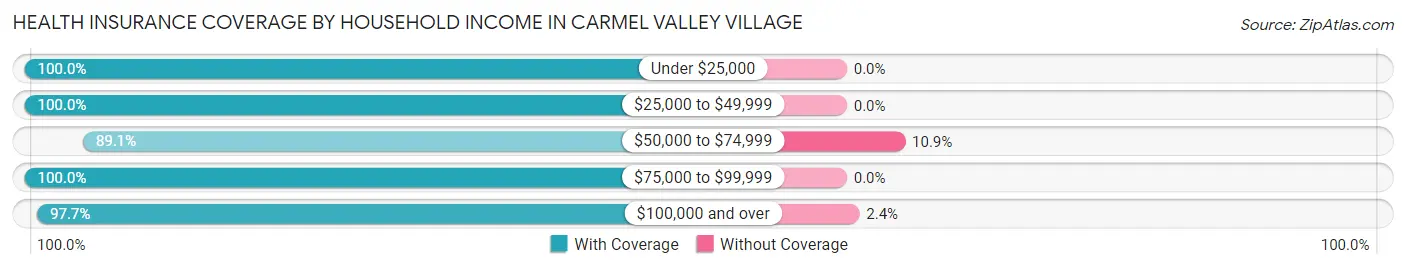
| Household Income | With Coverage | Without Coverage |
| Under $25,000 | 235 (100.0%) | 0 (0.0%) |
| $25,000 to $49,999 | 282 (100.0%) | 0 (0.0%) |
| $50,000 to $74,999 | 253 (89.1%) | 31 (10.9%) |
| $75,000 to $99,999 | 214 (100.0%) | 0 (0.0%) |
| $100,000 and over | 3,525 (97.7%) | 85 (2.4%) |
Public vs Private Health Insurance Coverage by Age in Carmel Valley Village
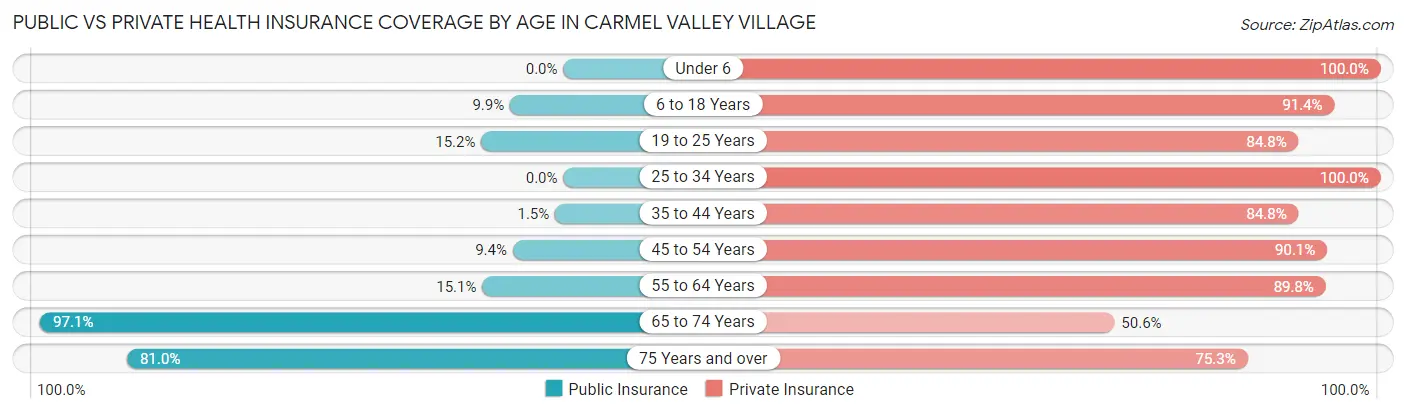
| Age Bracket | Public Insurance | Private Insurance |
| Under 6 | 0 (0.0%) | 106 (100.0%) |
| 6 to 18 Years | 59 (9.9%) | 545 (91.4%) |
| 19 to 25 Years | 30 (15.2%) | 167 (84.8%) |
| 25 to 34 Years | 0 (0.0%) | 35 (100.0%) |
| 35 to 44 Years | 12 (1.5%) | 663 (84.8%) |
| 45 to 54 Years | 35 (9.4%) | 336 (90.1%) |
| 55 to 64 Years | 124 (15.0%) | 740 (89.8%) |
| 65 to 74 Years | 1,286 (97.1%) | 670 (50.6%) |
| 75 Years and over | 328 (81.0%) | 305 (75.3%) |
| Total | 1,874 (40.4%) | 3,567 (76.8%) |
Disability Status by Sex by Age in Carmel Valley Village
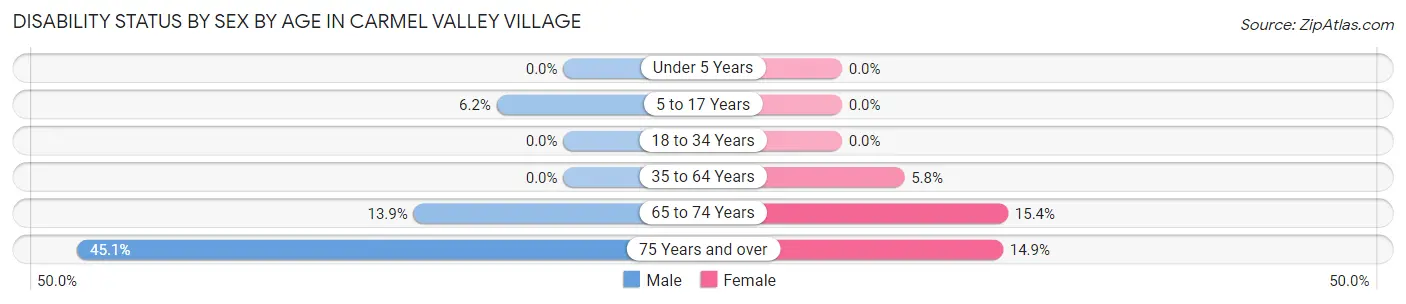
| Age Bracket | Male | Female |
| Under 5 Years | 0 (0.0%) | 0 (0.0%) |
| 5 to 17 Years | 18 (6.2%) | 0 (0.0%) |
| 18 to 34 Years | 0 (0.0%) | 0 (0.0%) |
| 35 to 64 Years | 0 (0.0%) | 65 (5.8%) |
| 65 to 74 Years | 92 (13.9%) | 102 (15.4%) |
| 75 Years and over | 74 (45.1%) | 36 (14.9%) |
Disability Class by Sex by Age in Carmel Valley Village
Disability Class: Hearing Difficulty
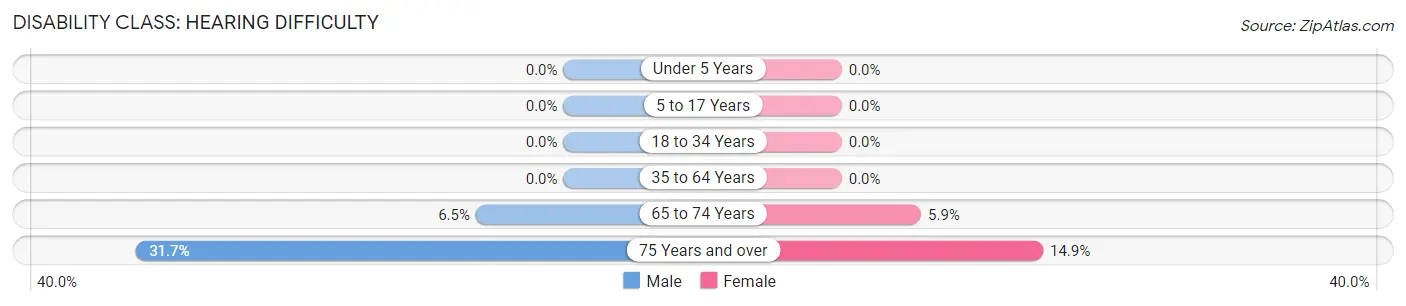
| Age Bracket | Male | Female |
| Under 5 Years | 0 (0.0%) | 0 (0.0%) |
| 5 to 17 Years | 0 (0.0%) | 0 (0.0%) |
| 18 to 34 Years | 0 (0.0%) | 0 (0.0%) |
| 35 to 64 Years | 0 (0.0%) | 0 (0.0%) |
| 65 to 74 Years | 43 (6.5%) | 39 (5.9%) |
| 75 Years and over | 52 (31.7%) | 36 (14.9%) |
Disability Class: Vision Difficulty
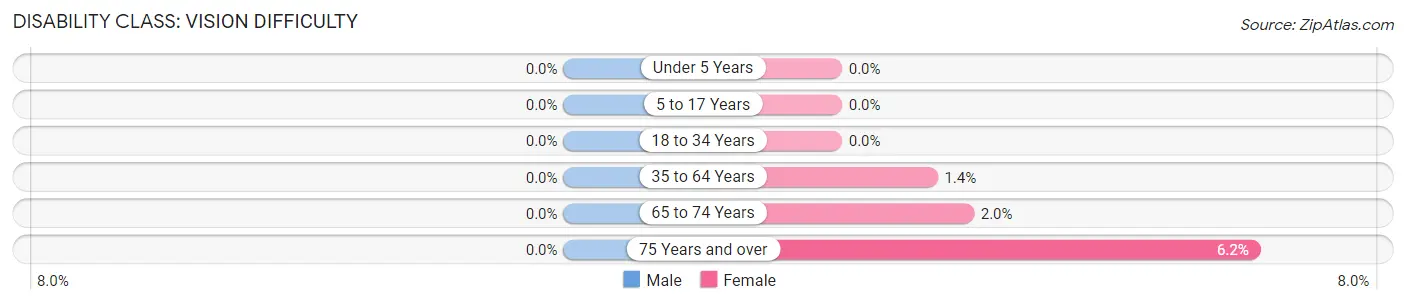
| Age Bracket | Male | Female |
| Under 5 Years | 0 (0.0%) | 0 (0.0%) |
| 5 to 17 Years | 0 (0.0%) | 0 (0.0%) |
| 18 to 34 Years | 0 (0.0%) | 0 (0.0%) |
| 35 to 64 Years | 0 (0.0%) | 16 (1.4%) |
| 65 to 74 Years | 0 (0.0%) | 13 (2.0%) |
| 75 Years and over | 0 (0.0%) | 15 (6.2%) |
Disability Class: Cognitive Difficulty
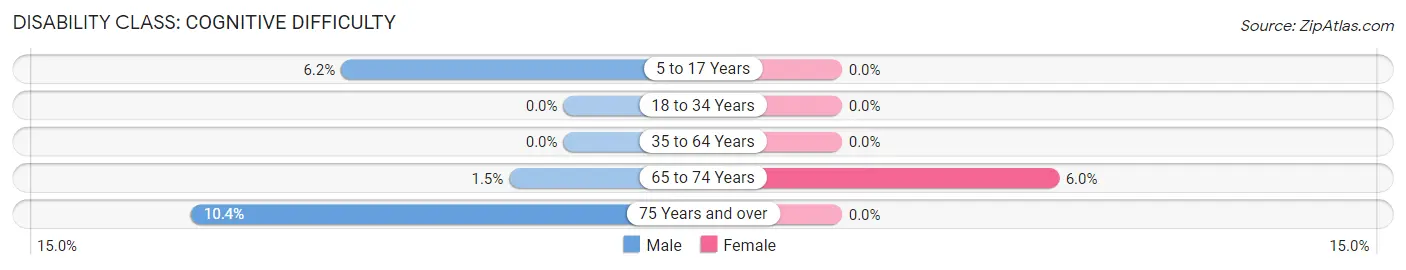
| Age Bracket | Male | Female |
| 5 to 17 Years | 18 (6.2%) | 0 (0.0%) |
| 18 to 34 Years | 0 (0.0%) | 0 (0.0%) |
| 35 to 64 Years | 0 (0.0%) | 0 (0.0%) |
| 65 to 74 Years | 10 (1.5%) | 40 (6.0%) |
| 75 Years and over | 17 (10.4%) | 0 (0.0%) |
Disability Class: Ambulatory Difficulty
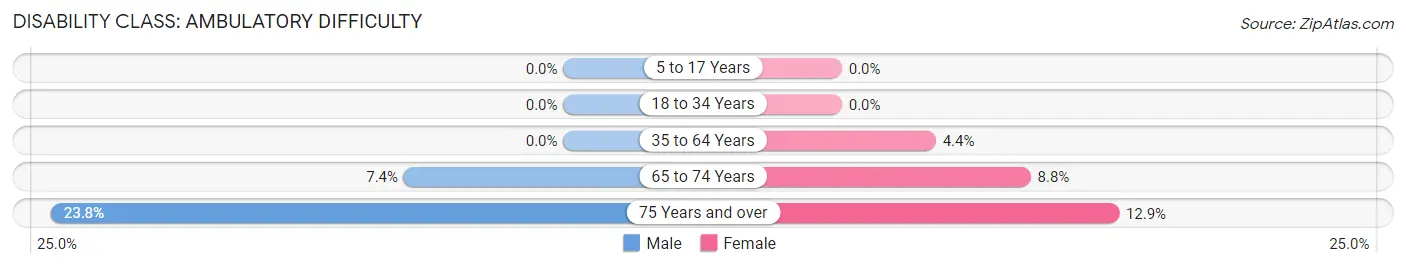
| Age Bracket | Male | Female |
| 5 to 17 Years | 0 (0.0%) | 0 (0.0%) |
| 18 to 34 Years | 0 (0.0%) | 0 (0.0%) |
| 35 to 64 Years | 0 (0.0%) | 49 (4.4%) |
| 65 to 74 Years | 49 (7.4%) | 58 (8.8%) |
| 75 Years and over | 39 (23.8%) | 31 (12.9%) |
Disability Class: Self-Care Difficulty
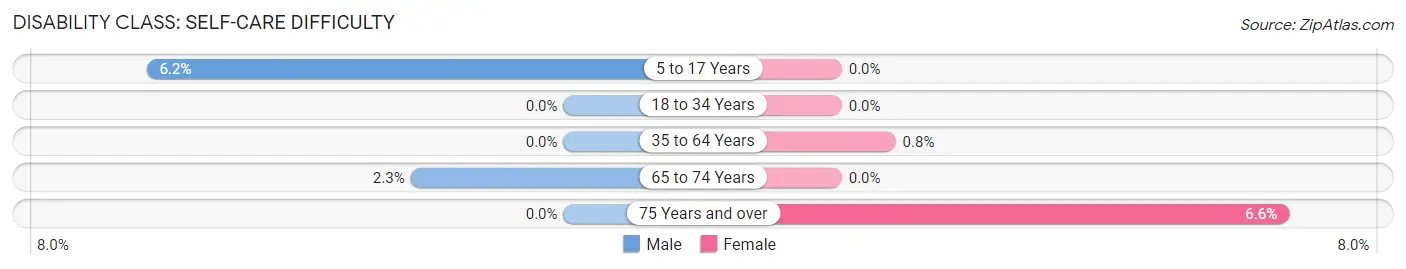
| Age Bracket | Male | Female |
| 5 to 17 Years | 18 (6.2%) | 0 (0.0%) |
| 18 to 34 Years | 0 (0.0%) | 0 (0.0%) |
| 35 to 64 Years | 0 (0.0%) | 9 (0.8%) |
| 65 to 74 Years | 15 (2.3%) | 0 (0.0%) |
| 75 Years and over | 0 (0.0%) | 16 (6.6%) |
Technology Access in Carmel Valley Village
Computing Device Access in Carmel Valley Village
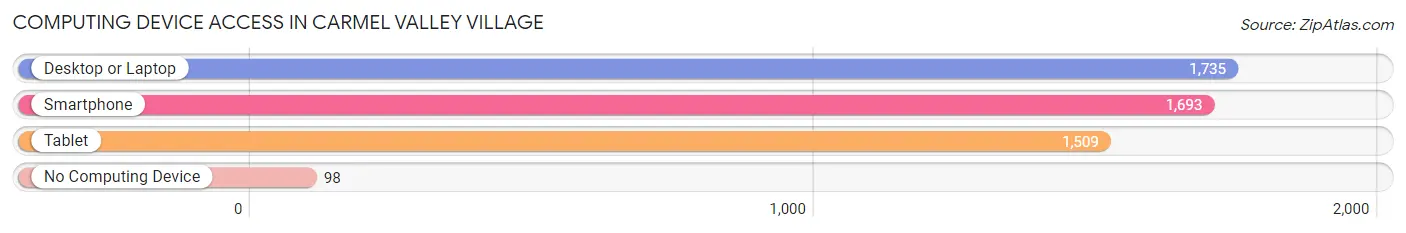
| Device Type | # Households | % Households |
| Desktop or Laptop | 1,735 | 88.1% |
| Smartphone | 1,693 | 85.9% |
| Tablet | 1,509 | 76.6% |
| No Computing Device | 98 | 5.0% |
| Total | 1,970 | 100.0% |
Internet Access in Carmel Valley Village
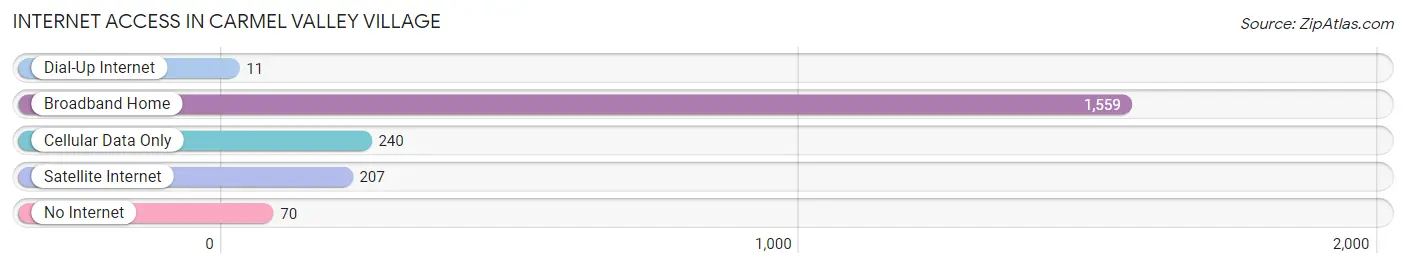
| Internet Type | # Households | % Households |
| Dial-Up Internet | 11 | 0.6% |
| Broadband Home | 1,559 | 79.1% |
| Cellular Data Only | 240 | 12.2% |
| Satellite Internet | 207 | 10.5% |
| No Internet | 70 | 3.5% |
| Total | 1,970 | 100.0% |
Carmel Valley Village Summary
Carmel Valley Village is a small unincorporated community located in Monterey County, California. It is situated in the Santa Lucia Mountains, approximately 8 miles east of the city of Carmel-by-the-Sea. The village is home to a population of approximately 3,000 people and is known for its rural atmosphere and stunning views of the surrounding hills and valleys.
History
The area that is now Carmel Valley Village was originally inhabited by the Ohlone people, who lived in the area for thousands of years before the arrival of Europeans. The first Europeans to settle in the area were Spanish missionaries, who established the Mission San Carlos Borromeo de Carmelo in 1770. The mission was the headquarters of the Spanish colonization of the area, and the surrounding land was used for grazing and farming.
In the late 19th century, the area was settled by ranchers and farmers, who established small communities in the area. The first post office in the area was established in 1887, and the town was officially incorporated in 1906. The town was named after the nearby Carmel Valley, which was named for the Carmelite friars who had established the mission.
In the early 20th century, the area began to attract tourists, who were drawn to the area’s natural beauty and rural atmosphere. The town was also home to a number of artists, writers, and musicians, who were attracted to the area’s peaceful atmosphere.
In the 1950s, the area began to experience rapid growth, as more people moved to the area to take advantage of the area’s natural beauty and rural atmosphere. The population of the town grew from just over 1,000 in 1950 to over 3,000 in 2000.
Geography
Carmel Valley Village is located in the Santa Lucia Mountains, approximately 8 miles east of the city of Carmel-by-the-Sea. The village is situated at an elevation of approximately 1,000 feet, and is surrounded by rolling hills and valleys. The area is known for its stunning views of the surrounding hills and valleys, as well as its rural atmosphere.
The climate in Carmel Valley Village is mild and temperate, with warm summers and cool winters. The average high temperature in the summer is around 75 degrees Fahrenheit, and the average low temperature in the winter is around 45 degrees Fahrenheit.
Economy
The economy of Carmel Valley Village is largely based on tourism and agriculture. The area is home to a number of wineries, which attract tourists from all over the world. The area is also home to a number of small farms, which produce a variety of fruits and vegetables.
The village is also home to a number of small businesses, including restaurants, shops, and galleries. The village is also home to a number of bed and breakfasts, which attract tourists from all over the world.
Demographics
As of the 2010 census, the population of Carmel Valley Village was 3,077. The racial makeup of the village was 87.3% White, 0.7% African American, 0.3% Native American, 0.9% Asian, 0.1% Pacific Islander, 8.2% from other races, and 2.5% from two or more races. Hispanic or Latino of any race were 16.2% of the population.
The median household income in the village was $68,750, and the median family income was $76,250. The per capita income in the village was $35,945. About 8.2% of families and 10.2% of the population were below the poverty line, including 14.2% of those under age 18 and 4.2% of those age 65 or over.
Common Questions
What is Per Capita Income in Carmel Valley Village?
Per Capita income in Carmel Valley Village is $93,411.
What is the Median Family Income in Carmel Valley Village?
Median Family Income in Carmel Valley Village is $177,828.
What is the Median Household income in Carmel Valley Village?
Median Household Income in Carmel Valley Village is $166,117.
What is Income or Wage Gap in Carmel Valley Village?
Income or Wage Gap in Carmel Valley Village is 48.1%.
Women in Carmel Valley Village earn 51.9 cents for every dollar earned by a man.
What is Inequality or Gini Index in Carmel Valley Village?
Inequality or Gini Index in Carmel Valley Village is 0.49.
What is the Total Population of Carmel Valley Village?
Total Population of Carmel Valley Village is 4,642.
What is the Total Male Population of Carmel Valley Village?
Total Male Population of Carmel Valley Village is 2,150.
What is the Total Female Population of Carmel Valley Village?
Total Female Population of Carmel Valley Village is 2,492.
What is the Ratio of Males per 100 Females in Carmel Valley Village?
There are 86.28 Males per 100 Females in Carmel Valley Village.
What is the Ratio of Females per 100 Males in Carmel Valley Village?
There are 115.91 Females per 100 Males in Carmel Valley Village.
What is the Median Population Age in Carmel Valley Village?
Median Population Age in Carmel Valley Village is 58.5 Years.
What is the Average Family Size in Carmel Valley Village
Average Family Size in Carmel Valley Village is 2.7 People.
What is the Average Household Size in Carmel Valley Village
Average Household Size in Carmel Valley Village is 2.4 People.
How Large is the Labor Force in Carmel Valley Village?
There are 2,190 People in the Labor Forcein in Carmel Valley Village.
What is the Percentage of People in the Labor Force in Carmel Valley Village?
54.7% of People are in the Labor Force in Carmel Valley Village.
What is the Unemployment Rate in Carmel Valley Village?
Unemployment Rate in Carmel Valley Village is 4.4%.