Cities with the Highest Percentage of Population Employed in Architecture & Engineering in New Hampshire
RELATED REPORTS & OPTIONS
Architecture & Engineering
New Hampshire
Compare Cities
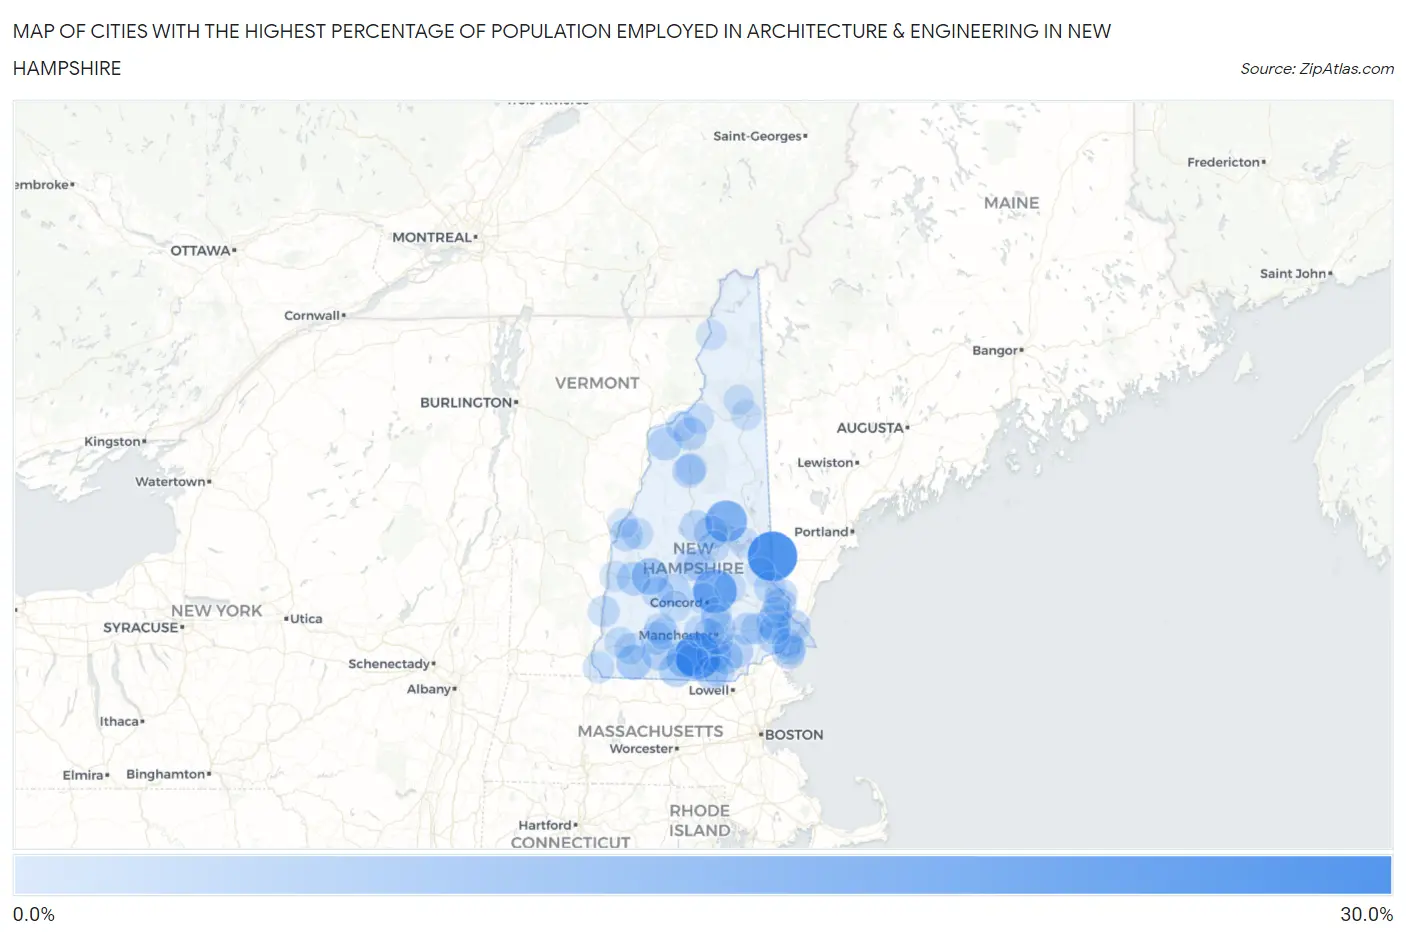
Map of Cities with the Highest Percentage of Population Employed in Architecture & Engineering in New Hampshire
0.0%
30.0%
Cities with the Highest Percentage of Population Employed in Architecture & Engineering in New Hampshire
| City | % Employed | vs State | vs National | |
| 1. | Milton Mills | 25.8% | 3.1%(+22.7)#1 | 2.1%(+23.7)#82 |
| 2. | Amherst | 21.0% | 3.1%(+17.9)#2 | 2.1%(+18.9)#123 |
| 3. | Loudon | 17.8% | 3.1%(+14.7)#3 | 2.1%(+15.7)#158 |
| 4. | Suissevale | 15.0% | 3.1%(+11.9)#4 | 2.1%(+12.9)#229 |
| 5. | Wilton | 9.0% | 3.1%(+5.86)#5 | 2.1%(+6.82)#581 |
| 6. | Blodgett Landing | 8.3% | 3.1%(+5.22)#6 | 2.1%(+6.18)#662 |
| 7. | Troy | 6.1% | 3.1%(+3.01)#7 | 2.1%(+3.97)#1,188 |
| 8. | Newmarket | 5.8% | 3.1%(+2.64)#8 | 2.1%(+3.61)#1,360 |
| 9. | East Merrimack | 5.7% | 3.1%(+2.57)#9 | 2.1%(+3.54)#1,403 |
| 10. | Greenville | 5.2% | 3.1%(+2.04)#10 | 2.1%(+3.00)#1,735 |
| 11. | Peterborough | 4.8% | 3.1%(+1.67)#11 | 2.1%(+2.63)#1,990 |
| 12. | Newport | 4.7% | 3.1%(+1.57)#12 | 2.1%(+2.54)#2,070 |
| 13. | Derry | 4.6% | 3.1%(+1.45)#13 | 2.1%(+2.41)#2,170 |
| 14. | Meredith | 4.4% | 3.1%(+1.33)#14 | 2.1%(+2.30)#2,269 |
| 15. | Lisbon | 4.4% | 3.1%(+1.28)#15 | 2.1%(+2.24)#2,323 |
| 16. | Londonderry | 4.3% | 3.1%(+1.15)#16 | 2.1%(+2.11)#2,449 |
| 17. | Seabrook Beach | 4.2% | 3.1%(+1.08)#17 | 2.1%(+2.04)#2,542 |
| 18. | Nashua | 4.1% | 3.1%(+1.01)#18 | 2.1%(+1.97)#2,618 |
| 19. | Portsmouth | 4.1% | 3.1%(+0.964)#19 | 2.1%(+1.93)#2,677 |
| 20. | North Woodstock | 3.9% | 3.1%(+0.790)#20 | 2.1%(+1.75)#2,901 |
| 21. | Milford | 3.9% | 3.1%(+0.753)#21 | 2.1%(+1.72)#2,941 |
| 22. | Bethlehem | 3.8% | 3.1%(+0.666)#22 | 2.1%(+1.63)#3,053 |
| 23. | Dover | 3.7% | 3.1%(+0.616)#23 | 2.1%(+1.58)#3,129 |
| 24. | Exeter | 3.6% | 3.1%(+0.470)#24 | 2.1%(+1.43)#3,372 |
| 25. | Warner | 3.5% | 3.1%(+0.418)#25 | 2.1%(+1.38)#3,476 |
| 26. | Lebanon | 3.5% | 3.1%(+0.348)#26 | 2.1%(+1.31)#3,593 |
| 27. | Somersworth | 3.1% | 3.1%(+0.023)#27 | 2.1%(+0.985)#4,251 |
| 28. | Raymond | 3.1% | 3.1%(-0.051)#28 | 2.1%(+0.911)#4,424 |
| 29. | Ashland | 3.0% | 3.1%(-0.115)#29 | 2.1%(+0.847)#4,596 |
| 30. | Hancock | 2.9% | 3.1%(-0.170)#30 | 2.1%(+0.792)#4,733 |
| 31. | Franklin | 2.9% | 3.1%(-0.241)#31 | 2.1%(+0.721)#4,924 |
| 32. | Rochester | 2.6% | 3.1%(-0.469)#32 | 2.1%(+0.493)#5,604 |
| 33. | Laconia | 2.6% | 3.1%(-0.524)#33 | 2.1%(+0.438)#5,765 |
| 34. | Goffstown | 2.6% | 3.1%(-0.550)#34 | 2.1%(+0.412)#5,849 |
| 35. | Bradford | 2.6% | 3.1%(-0.558)#35 | 2.1%(+0.404)#5,878 |
| 36. | Bennington | 2.5% | 3.1%(-0.652)#36 | 2.1%(+0.310)#6,166 |
| 37. | Manchester | 2.4% | 3.1%(-0.699)#37 | 2.1%(+0.262)#6,336 |
| 38. | Tilton Northfield | 2.4% | 3.1%(-0.723)#38 | 2.1%(+0.239)#6,418 |
| 39. | Hampton | 2.4% | 3.1%(-0.735)#39 | 2.1%(+0.227)#6,468 |
| 40. | Concord | 2.4% | 3.1%(-0.757)#40 | 2.1%(+0.204)#6,538 |
| 41. | Durham | 2.3% | 3.1%(-0.797)#41 | 2.1%(+0.165)#6,690 |
| 42. | North Walpole | 2.3% | 3.1%(-0.808)#42 | 2.1%(+0.153)#6,734 |
| 43. | Antrim | 2.3% | 3.1%(-0.852)#43 | 2.1%(+0.110)#6,897 |
| 44. | Pittsfield | 2.3% | 3.1%(-0.853)#44 | 2.1%(+0.109)#6,899 |
| 45. | Keene | 2.1% | 3.1%(-1.01)#45 | 2.1%(-0.052)#7,536 |
| 46. | Marlborough | 2.1% | 3.1%(-1.05)#46 | 2.1%(-0.089)#7,699 |
| 47. | Hinsdale | 2.1% | 3.1%(-1.06)#47 | 2.1%(-0.098)#7,740 |
| 48. | Epping | 2.0% | 3.1%(-1.13)#48 | 2.1%(-0.165)#7,988 |
| 49. | Hudson | 2.0% | 3.1%(-1.15)#49 | 2.1%(-0.191)#8,081 |
| 50. | Lincoln | 1.9% | 3.1%(-1.20)#50 | 2.1%(-0.234)#8,238 |
| 51. | South Hooksett | 1.9% | 3.1%(-1.21)#51 | 2.1%(-0.249)#8,316 |
| 52. | Hampton Beach | 1.9% | 3.1%(-1.24)#52 | 2.1%(-0.275)#8,416 |
| 53. | Enfield | 1.8% | 3.1%(-1.27)#53 | 2.1%(-0.307)#8,568 |
| 54. | Newfields | 1.8% | 3.1%(-1.36)#54 | 2.1%(-0.395)#8,965 |
| 55. | Henniker | 1.7% | 3.1%(-1.38)#55 | 2.1%(-0.415)#9,066 |
| 56. | Littleton | 1.5% | 3.1%(-1.63)#56 | 2.1%(-0.672)#10,337 |
| 57. | Suncook | 1.4% | 3.1%(-1.70)#57 | 2.1%(-0.742)#10,685 |
| 58. | Claremont | 1.4% | 3.1%(-1.72)#58 | 2.1%(-0.755)#10,760 |
| 59. | Hooksett | 1.2% | 3.1%(-1.88)#59 | 2.1%(-0.913)#11,576 |
| 60. | Pinardville | 1.2% | 3.1%(-1.88)#60 | 2.1%(-0.919)#11,617 |
| 61. | Whitefield | 1.1% | 3.1%(-2.06)#61 | 2.1%(-1.10)#12,541 |
| 62. | Wolfeboro | 1.00% | 3.1%(-2.11)#62 | 2.1%(-1.15)#12,846 |
| 63. | Hanover | 0.95% | 3.1%(-2.16)#63 | 2.1%(-1.20)#13,134 |
| 64. | Gorham | 0.94% | 3.1%(-2.17)#64 | 2.1%(-1.21)#13,173 |
| 65. | Colebrook | 0.82% | 3.1%(-2.29)#65 | 2.1%(-1.33)#13,900 |
| 66. | Berlin | 0.68% | 3.1%(-2.44)#66 | 2.1%(-1.47)#14,701 |
| 67. | Farmington | 0.35% | 3.1%(-2.76)#67 | 2.1%(-1.80)#16,296 |
1
Common Questions
What are the Top 10 Cities with the Highest Percentage of Population Employed in Architecture & Engineering in New Hampshire?
Top 10 Cities with the Highest Percentage of Population Employed in Architecture & Engineering in New Hampshire are:
#1
25.8%
#2
21.0%
#3
17.8%
#4
15.0%
#5
9.0%
#6
8.3%
#7
6.1%
#8
5.8%
#9
5.7%
#10
5.2%
What city has the Highest Percentage of Population Employed in Architecture & Engineering in New Hampshire?
Milton Mills has the Highest Percentage of Population Employed in Architecture & Engineering in New Hampshire with 25.8%.
What is the Percentage of Population Employed in Architecture & Engineering in the State of New Hampshire?
Percentage of Population Employed in Architecture & Engineering in New Hampshire is 3.1%.
What is the Percentage of Population Employed in Architecture & Engineering in the United States?
Percentage of Population Employed in Architecture & Engineering in the United States is 2.1%.