Cities with the Highest Percentage of Population Employed in Architecture & Engineering in New Mexico
RELATED REPORTS & OPTIONS
Architecture & Engineering
New Mexico
Compare Cities
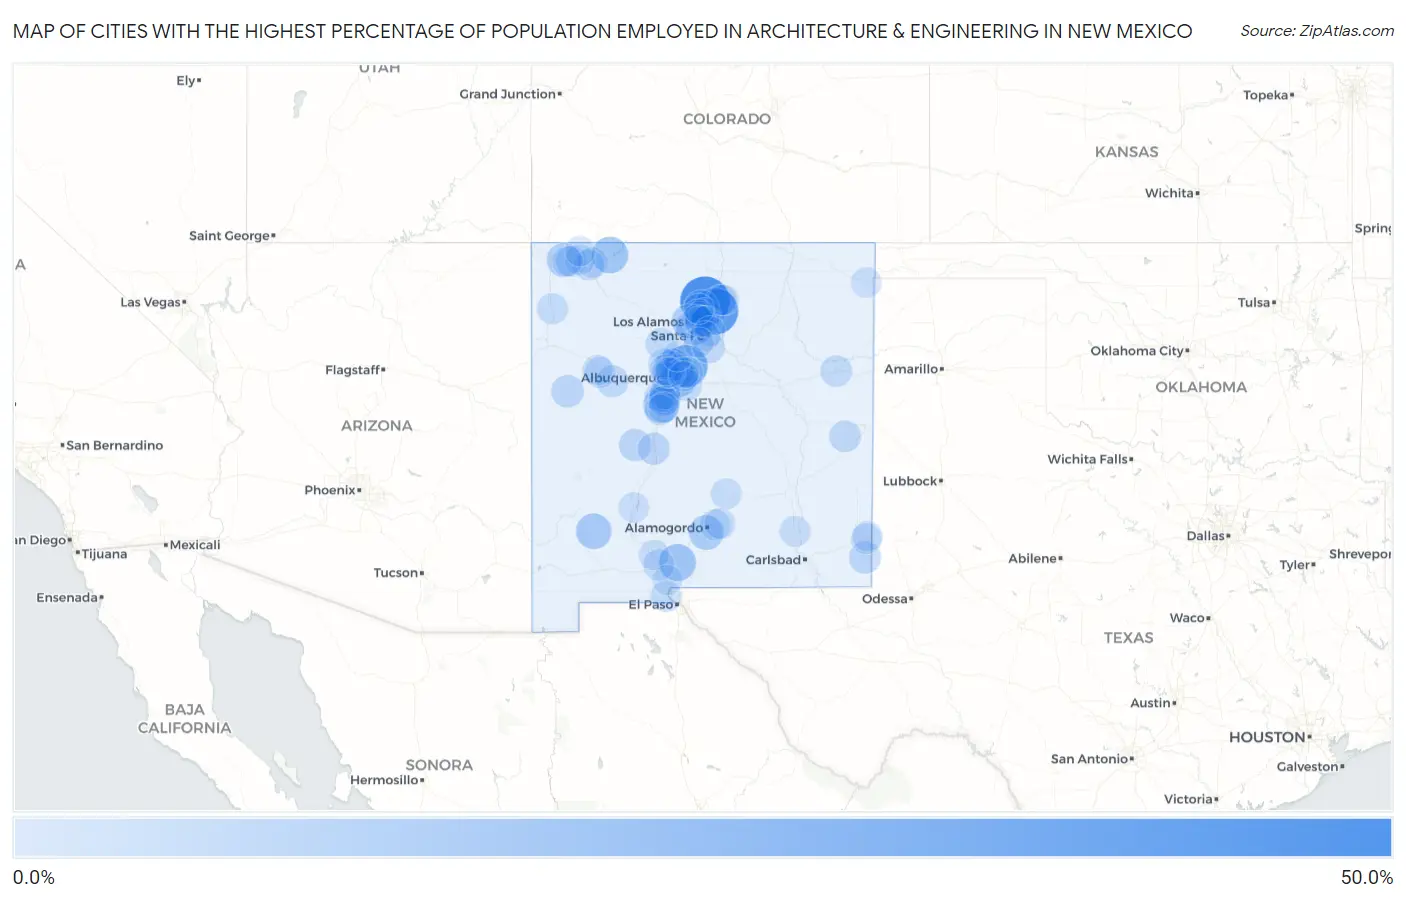
Map of Cities with the Highest Percentage of Population Employed in Architecture & Engineering in New Mexico
0.0%
50.0%
Cities with the Highest Percentage of Population Employed in Architecture & Engineering in New Mexico
| City | % Employed | vs State | vs National | |
| 1. | Canova | 44.9% | 2.5%(+42.4)#1 | 2.1%(+42.8)#33 |
| 2. | Crestview | 38.1% | 2.5%(+35.6)#2 | 2.1%(+35.9)#41 |
| 3. | Truchas | 37.8% | 2.5%(+35.3)#3 | 2.1%(+35.7)#42 |
| 4. | La Madera | 29.1% | 2.5%(+26.6)#4 | 2.1%(+26.9)#62 |
| 5. | White Sands | 16.3% | 2.5%(+13.7)#5 | 2.1%(+14.1)#195 |
| 6. | Navajo Dam | 15.2% | 2.5%(+12.7)#6 | 2.1%(+13.0)#224 |
| 7. | Carnuel | 14.8% | 2.5%(+12.3)#7 | 2.1%(+12.7)#235 |
| 8. | Sausal | 14.2% | 2.5%(+11.7)#8 | 2.1%(+12.1)#256 |
| 9. | Mimbres | 12.8% | 2.5%(+10.3)#9 | 2.1%(+10.7)#312 |
| 10. | White Rock | 12.8% | 2.5%(+10.3)#10 | 2.1%(+10.7)#313 |
| 11. | Boles Acres | 11.3% | 2.5%(+8.79)#11 | 2.1%(+9.16)#398 |
| 12. | Alcalde | 11.1% | 2.5%(+8.59)#12 | 2.1%(+8.96)#409 |
| 13. | Little Walnut | 11.0% | 2.5%(+8.44)#13 | 2.1%(+8.81)#426 |
| 14. | San Antonito Cdp Bernalillo County | 10.4% | 2.5%(+7.87)#14 | 2.1%(+8.24)#461 |
| 15. | Los Alamos | 10.3% | 2.5%(+7.81)#15 | 2.1%(+8.18)#470 |
| 16. | Tano Road | 10.1% | 2.5%(+7.59)#16 | 2.1%(+7.96)#486 |
| 17. | Waterflow | 10.0% | 2.5%(+7.45)#17 | 2.1%(+7.81)#502 |
| 18. | Sandia Heights | 9.7% | 2.5%(+7.18)#18 | 2.1%(+7.55)#521 |
| 19. | Pueblo Of Sandia Village | 7.9% | 2.5%(+5.42)#19 | 2.1%(+5.79)#733 |
| 20. | Pinehill | 6.5% | 2.5%(+3.99)#20 | 2.1%(+4.35)#1,045 |
| 21. | Placitas Cdp Sandoval County | 6.3% | 2.5%(+3.77)#21 | 2.1%(+4.14)#1,123 |
| 22. | Becenti | 6.1% | 2.5%(+3.54)#22 | 2.1%(+3.91)#1,207 |
| 23. | Paa-Ko | 6.0% | 2.5%(+3.44)#23 | 2.1%(+3.80)#1,266 |
| 24. | Magdalena | 5.8% | 2.5%(+3.24)#24 | 2.1%(+3.61)#1,359 |
| 25. | Eunice | 5.5% | 2.5%(+2.94)#25 | 2.1%(+3.31)#1,526 |
| 26. | Socorro | 5.4% | 2.5%(+2.93)#26 | 2.1%(+3.30)#1,536 |
| 27. | El Cerro | 5.4% | 2.5%(+2.85)#27 | 2.1%(+3.21)#1,582 |
| 28. | Eldorado At Santa Fe | 5.2% | 2.5%(+2.67)#28 | 2.1%(+3.03)#1,706 |
| 29. | Skyline Ganipa | 5.1% | 2.5%(+2.59)#29 | 2.1%(+2.96)#1,757 |
| 30. | Valencia | 4.9% | 2.5%(+2.42)#30 | 2.1%(+2.79)#1,874 |
| 31. | Floyd | 4.8% | 2.5%(+2.25)#31 | 2.1%(+2.61)#2,012 |
| 32. | Ponderosa Pine | 4.7% | 2.5%(+2.13)#32 | 2.1%(+2.50)#2,094 |
| 33. | Corrales | 4.6% | 2.5%(+2.07)#33 | 2.1%(+2.44)#2,153 |
| 34. | Tucumcari | 4.5% | 2.5%(+2.02)#34 | 2.1%(+2.38)#2,203 |
| 35. | La Mesilla | 4.5% | 2.5%(+1.97)#35 | 2.1%(+2.33)#2,243 |
| 36. | San Ysidro | 4.4% | 2.5%(+1.88)#36 | 2.1%(+2.25)#2,316 |
| 37. | La Puebla | 4.1% | 2.5%(+1.55)#37 | 2.1%(+1.92)#2,692 |
| 38. | Kirtland Afb | 4.0% | 2.5%(+1.47)#38 | 2.1%(+1.83)#2,796 |
| 39. | Santa Clara Pueblo | 3.7% | 2.5%(+1.22)#39 | 2.1%(+1.59)#3,099 |
| 40. | Ojo Encino | 3.6% | 2.5%(+1.12)#40 | 2.1%(+1.49)#3,283 |
| 41. | Las Cruces | 3.6% | 2.5%(+1.12)#41 | 2.1%(+1.49)#3,286 |
| 42. | Santa Teresa | 3.6% | 2.5%(+1.06)#42 | 2.1%(+1.42)#3,382 |
| 43. | Naschitti | 3.5% | 2.5%(+0.992)#43 | 2.1%(+1.36)#3,513 |
| 44. | Tres Arroyos | 3.4% | 2.5%(+0.892)#44 | 2.1%(+1.26)#3,703 |
| 45. | West Hammond | 3.4% | 2.5%(+0.850)#45 | 2.1%(+1.22)#3,786 |
| 46. | Los Lunas | 3.3% | 2.5%(+0.792)#46 | 2.1%(+1.16)#3,890 |
| 47. | Albuquerque | 3.2% | 2.5%(+0.705)#47 | 2.1%(+1.07)#4,061 |
| 48. | Thunder Mountain | 3.2% | 2.5%(+0.693)#48 | 2.1%(+1.06)#4,084 |
| 49. | Grants | 3.2% | 2.5%(+0.655)#49 | 2.1%(+1.02)#4,168 |
| 50. | Rio Rancho Estates | 3.2% | 2.5%(+0.651)#50 | 2.1%(+1.02)#4,179 |
| 51. | Ruidoso | 3.1% | 2.5%(+0.601)#51 | 2.1%(+0.969)#4,300 |
| 52. | Artesia | 3.1% | 2.5%(+0.557)#52 | 2.1%(+0.924)#4,385 |
| 53. | Edith Enclave | 3.0% | 2.5%(+0.514)#53 | 2.1%(+0.881)#4,504 |
| 54. | Rio Rancho | 3.0% | 2.5%(+0.504)#54 | 2.1%(+0.871)#4,532 |
| 55. | Bosque Farms | 3.0% | 2.5%(+0.458)#55 | 2.1%(+0.825)#4,649 |
| 56. | High Rolls | 2.8% | 2.5%(+0.328)#56 | 2.1%(+0.695)#5,000 |
| 57. | Jaconita | 2.8% | 2.5%(+0.327)#57 | 2.1%(+0.694)#5,004 |
| 58. | Picacho Hills | 2.8% | 2.5%(+0.300)#58 | 2.1%(+0.668)#5,061 |
| 59. | Sundance | 2.8% | 2.5%(+0.261)#59 | 2.1%(+0.629)#5,178 |
| 60. | El Rancho | 2.8% | 2.5%(+0.249)#60 | 2.1%(+0.616)#5,217 |
| 61. | Espanola | 2.8% | 2.5%(+0.239)#61 | 2.1%(+0.607)#5,254 |
| 62. | Isleta | 2.7% | 2.5%(+0.227)#62 | 2.1%(+0.595)#5,279 |
| 63. | San Ildefonso Pueblo | 2.7% | 2.5%(+0.223)#63 | 2.1%(+0.591)#5,290 |
| 64. | Paradise Hills | 2.7% | 2.5%(+0.222)#64 | 2.1%(+0.590)#5,297 |
| 65. | Cloudcroft | 2.7% | 2.5%(+0.207)#65 | 2.1%(+0.575)#5,348 |
| 66. | Iyanbito | 2.7% | 2.5%(+0.201)#66 | 2.1%(+0.568)#5,375 |
| 67. | Pueblitos | 2.7% | 2.5%(+0.186)#67 | 2.1%(+0.553)#5,419 |
| 68. | Vadito | 2.7% | 2.5%(+0.186)#68 | 2.1%(+0.553)#5,422 |
| 69. | Nambe | 2.6% | 2.5%(+0.118)#69 | 2.1%(+0.486)#5,625 |
| 70. | Angustura | 2.6% | 2.5%(+0.081)#70 | 2.1%(+0.448)#5,726 |
| 71. | Kirtland | 2.6% | 2.5%(+0.037)#71 | 2.1%(+0.404)#5,877 |
| 72. | Hobbs | 2.5% | 2.5%(+0.033)#72 | 2.1%(+0.400)#5,892 |
| 73. | Santa Fe Foothills | 2.5% | 2.5%(-0.048)#73 | 2.1%(+0.320)#6,131 |
| 74. | Tome | 2.4% | 2.5%(-0.082)#74 | 2.1%(+0.285)#6,242 |
| 75. | Truth Or Consequences | 2.4% | 2.5%(-0.095)#75 | 2.1%(+0.272)#6,292 |
| 76. | Bloomfield | 2.4% | 2.5%(-0.107)#76 | 2.1%(+0.261)#6,342 |
| 77. | Rio Lucio | 2.4% | 2.5%(-0.158)#77 | 2.1%(+0.209)#6,515 |
| 78. | Los Ranchos De Albuquerque | 2.3% | 2.5%(-0.190)#78 | 2.1%(+0.177)#6,635 |
| 79. | Pojoaque | 2.3% | 2.5%(-0.210)#79 | 2.1%(+0.157)#6,719 |
| 80. | Sandia Knolls | 2.2% | 2.5%(-0.292)#80 | 2.1%(+0.076)#7,021 |
| 81. | Las Campanas | 2.2% | 2.5%(-0.294)#81 | 2.1%(+0.073)#7,033 |
| 82. | Sandia Park | 2.2% | 2.5%(-0.352)#82 | 2.1%(+0.015)#7,274 |
| 83. | Radium Springs | 2.2% | 2.5%(-0.362)#83 | 2.1%(+0.005)#7,314 |
| 84. | Clayton | 2.1% | 2.5%(-0.400)#84 | 2.1%(-0.032)#7,441 |
| 85. | Rio Communities | 2.1% | 2.5%(-0.406)#85 | 2.1%(-0.038)#7,472 |
| 86. | Farmington | 2.1% | 2.5%(-0.460)#86 | 2.1%(-0.092)#7,715 |
| 87. | Penasco | 2.0% | 2.5%(-0.525)#87 | 2.1%(-0.157)#7,954 |
| 88. | Milan | 1.9% | 2.5%(-0.583)#88 | 2.1%(-0.216)#8,162 |
| 89. | Nenahnezad | 1.9% | 2.5%(-0.642)#89 | 2.1%(-0.274)#8,414 |
| 90. | Tesuque | 1.8% | 2.5%(-0.676)#90 | 2.1%(-0.309)#8,575 |
| 91. | North Valley | 1.7% | 2.5%(-0.800)#91 | 2.1%(-0.432)#9,146 |
| 92. | Santa Fe | 1.7% | 2.5%(-0.809)#92 | 2.1%(-0.442)#9,185 |
| 93. | Vado | 1.7% | 2.5%(-0.831)#93 | 2.1%(-0.464)#9,303 |
| 94. | Cedar Crest | 1.7% | 2.5%(-0.858)#94 | 2.1%(-0.490)#9,421 |
| 95. | La Plata | 1.6% | 2.5%(-0.887)#95 | 2.1%(-0.520)#9,560 |
| 96. | Algodones | 1.6% | 2.5%(-0.922)#96 | 2.1%(-0.555)#9,738 |
| 97. | North Hobbs | 1.5% | 2.5%(-0.987)#97 | 2.1%(-0.620)#10,077 |
| 98. | Barton | 1.5% | 2.5%(-1.06)#98 | 2.1%(-0.692)#10,437 |
| 99. | Chamita | 1.4% | 2.5%(-1.07)#99 | 2.1%(-0.704)#10,502 |
| 100. | La Cienega | 1.4% | 2.5%(-1.07)#100 | 2.1%(-0.705)#10,505 |
Common Questions
What are the Top 10 Cities with the Highest Percentage of Population Employed in Architecture & Engineering in New Mexico?
Top 10 Cities with the Highest Percentage of Population Employed in Architecture & Engineering in New Mexico are:
#1
44.9%
#2
37.8%
#3
29.1%
#4
16.3%
#5
15.2%
#6
14.8%
#7
14.2%
#8
12.8%
#9
12.8%
#10
11.3%
What city has the Highest Percentage of Population Employed in Architecture & Engineering in New Mexico?
Canova has the Highest Percentage of Population Employed in Architecture & Engineering in New Mexico with 44.9%.
What is the Percentage of Population Employed in Architecture & Engineering in the State of New Mexico?
Percentage of Population Employed in Architecture & Engineering in New Mexico is 2.5%.
What is the Percentage of Population Employed in Architecture & Engineering in the United States?
Percentage of Population Employed in Architecture & Engineering in the United States is 2.1%.