Blue Lake, CA Map & Demographics
Blue Lake Map
Blue Lake Overview
$40,965
PER CAPITA INCOME
$100,469
AVG FAMILY INCOME
$48,807
AVG HOUSEHOLD INCOME
21.3%
WAGE / INCOME GAP [ % ]
78.7¢/ $1
WAGE / INCOME GAP [ $ ]
0.49
INEQUALITY / GINI INDEX
841
TOTAL POPULATION
404
MALE POPULATION
437
FEMALE POPULATION
92.45
MALES / 100 FEMALES
108.17
FEMALES / 100 MALES
56.3
MEDIAN AGE
2.3
AVG FAMILY SIZE
1.9
AVG HOUSEHOLD SIZE
414
LABOR FORCE [ PEOPLE ]
56.1%
PERCENT IN LABOR FORCE
7.7%
UNEMPLOYMENT RATE
Blue Lake Zip Codes
Blue Lake Area Codes
Income in Blue Lake
Income Overview in Blue Lake
Per Capita Income in Blue Lake is $40,965, while median incomes of families and households are $100,469 and $48,807 respectively.
| Characteristic | Number | Measure |
| Per Capita Income | 841 | $40,965 |
| Median Family Income | 230 | $100,469 |
| Mean Family Income | 230 | $110,704 |
| Median Household Income | 449 | $48,807 |
| Mean Household Income | 449 | $76,152 |
| Income Deficit | 230 | $0 |
| Wage / Income Gap (%) | 841 | 21.27% |
| Wage / Income Gap ($) | 841 | 78.73¢ per $1 |
| Gini / Inequality Index | 841 | 0.49 |
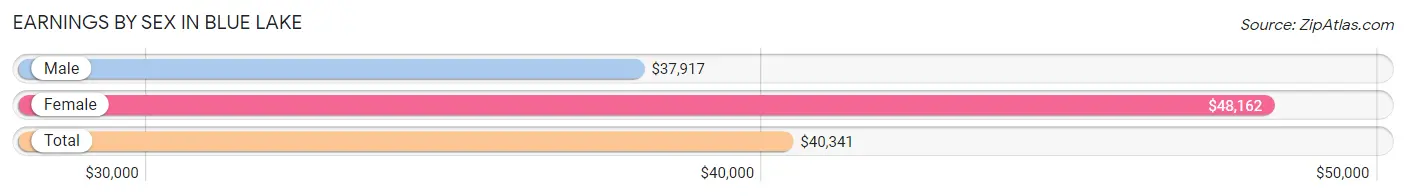
Earnings by Sex in Blue Lake
Average Earnings in Blue Lake are $40,341, $37,917 for men and $48,162 for women, a difference of 21.3%.
| Sex | Number | Average Earnings |
| Male | 191 (44.3%) | $37,917 |
| Female | 240 (55.7%) | $48,162 |
| Total | 431 (100.0%) | $40,341 |
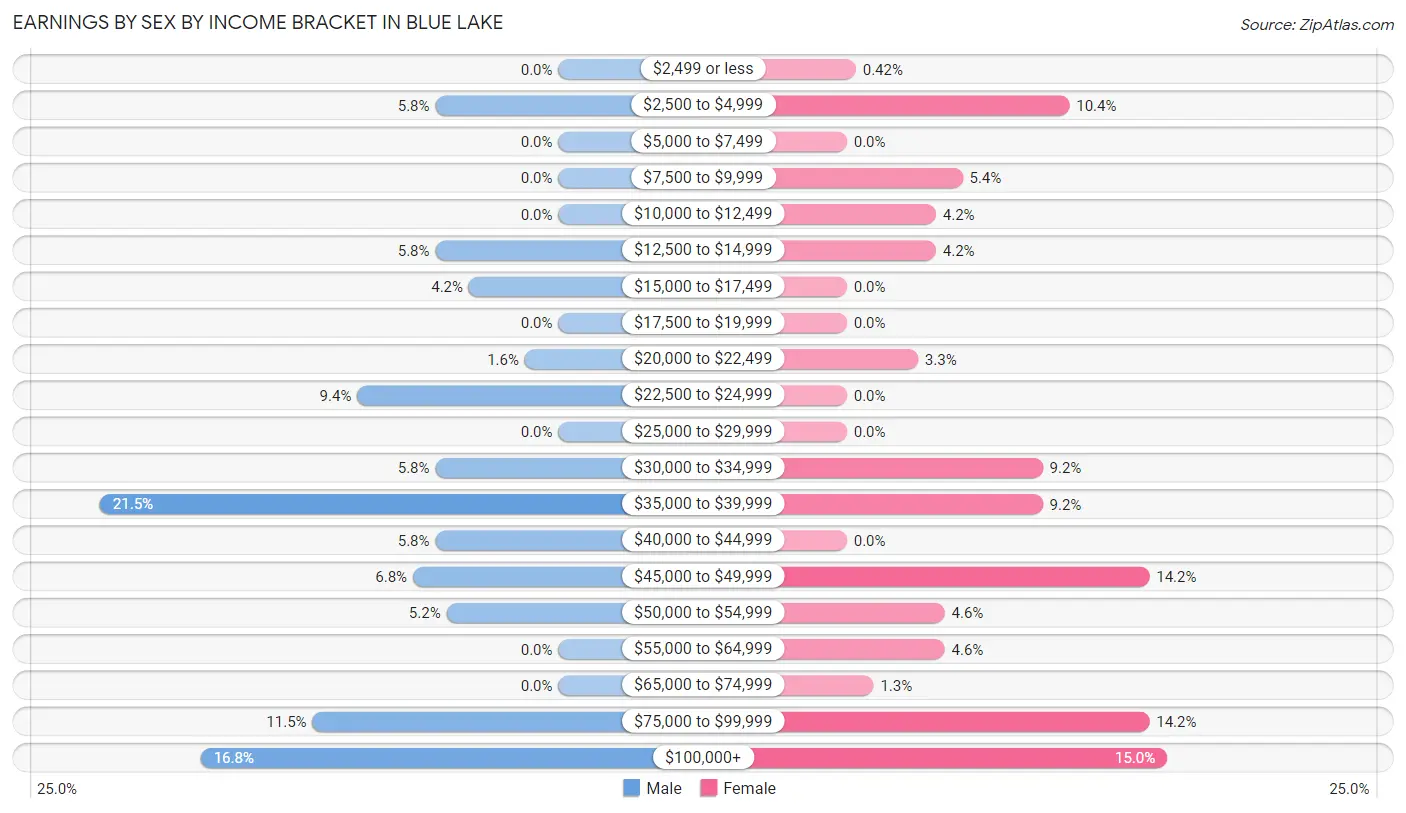
Earnings by Sex by Income Bracket in Blue Lake
The most common earnings brackets in Blue Lake are $35,000 to $39,999 for men (41 | 21.5%) and $100,000+ for women (36 | 15.0%).
| Income | Male | Female |
| $2,499 or less | 0 (0.0%) | 1 (0.4%) |
| $2,500 to $4,999 | 11 (5.8%) | 25 (10.4%) |
| $5,000 to $7,499 | 0 (0.0%) | 0 (0.0%) |
| $7,500 to $9,999 | 0 (0.0%) | 13 (5.4%) |
| $10,000 to $12,499 | 0 (0.0%) | 10 (4.2%) |
| $12,500 to $14,999 | 11 (5.8%) | 10 (4.2%) |
| $15,000 to $17,499 | 8 (4.2%) | 0 (0.0%) |
| $17,500 to $19,999 | 0 (0.0%) | 0 (0.0%) |
| $20,000 to $22,499 | 3 (1.6%) | 8 (3.3%) |
| $22,500 to $24,999 | 18 (9.4%) | 0 (0.0%) |
| $25,000 to $29,999 | 0 (0.0%) | 0 (0.0%) |
| $30,000 to $34,999 | 11 (5.8%) | 22 (9.2%) |
| $35,000 to $39,999 | 41 (21.5%) | 22 (9.2%) |
| $40,000 to $44,999 | 11 (5.8%) | 0 (0.0%) |
| $45,000 to $49,999 | 13 (6.8%) | 34 (14.2%) |
| $50,000 to $54,999 | 10 (5.2%) | 11 (4.6%) |
| $55,000 to $64,999 | 0 (0.0%) | 11 (4.6%) |
| $65,000 to $74,999 | 0 (0.0%) | 3 (1.3%) |
| $75,000 to $99,999 | 22 (11.5%) | 34 (14.2%) |
| $100,000+ | 32 (16.8%) | 36 (15.0%) |
| Total | 191 (100.0%) | 240 (100.0%) |
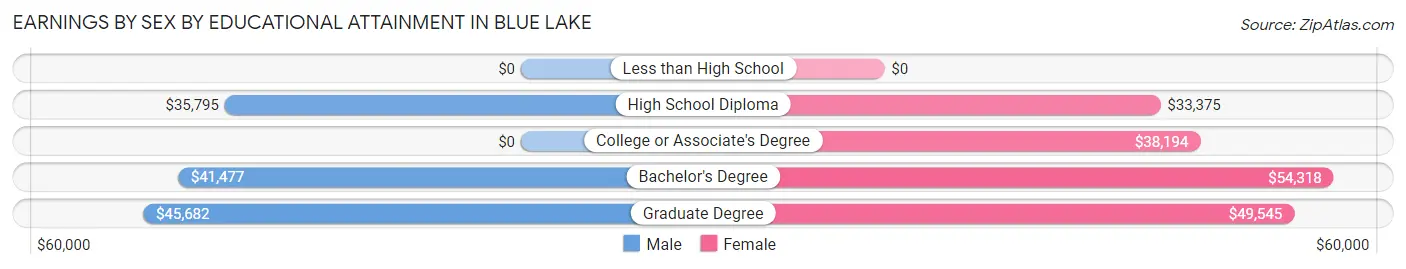
Earnings by Sex by Educational Attainment in Blue Lake
Average earnings in Blue Lake are $37,917 for men and $48,199 for women, a difference of 21.3%. Men with an educational attainment of graduate degree enjoy the highest average annual earnings of $45,682, while those with high school diploma education earn the least with $35,795. Women with an educational attainment of bachelor's degree earn the most with the average annual earnings of $54,318, while those with high school diploma education have the smallest earnings of $33,375.
| Educational Attainment | Male Income | Female Income |
| Less than High School | - | - |
| High School Diploma | $35,795 | $33,375 |
| College or Associate's Degree | - | - |
| Bachelor's Degree | $41,477 | $54,318 |
| Graduate Degree | $45,682 | $49,545 |
| Total | $37,917 | $48,199 |
Family Income in Blue Lake
Family Income Brackets in Blue Lake
According to the Blue Lake family income data, there are 63 families falling into the $100,000 to $149,999 income range, which is the most common income bracket and makes up 27.4% of all families.
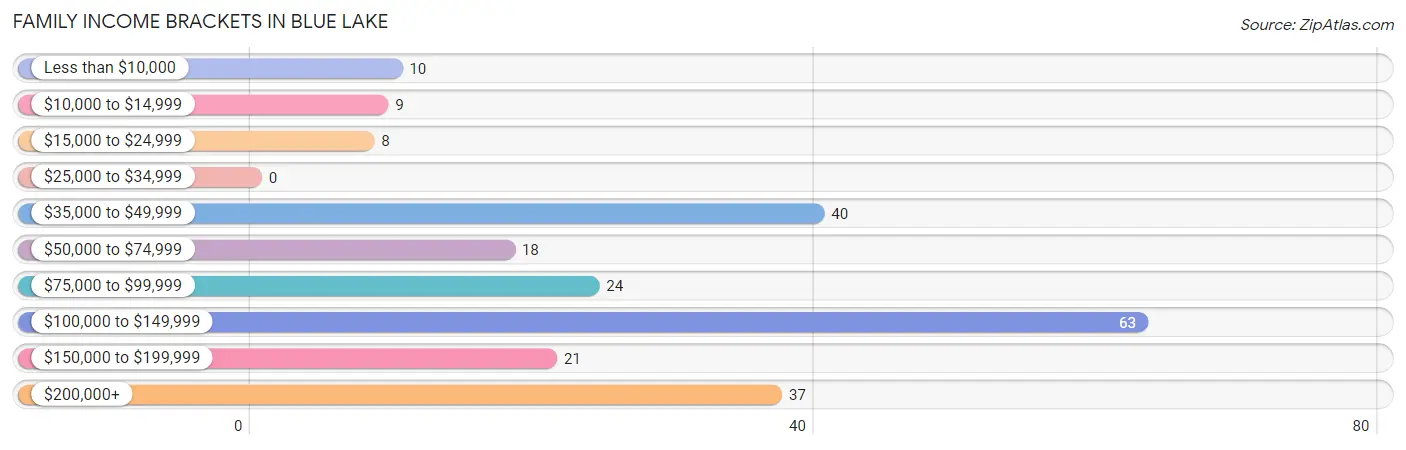
| Income Bracket | # Families | % Families |
| Less than $10,000 | 10 | 4.3% |
| $10,000 to $14,999 | 9 | 3.9% |
| $15,000 to $24,999 | 8 | 3.5% |
| $25,000 to $34,999 | 0 | 0.0% |
| $35,000 to $49,999 | 40 | 17.4% |
| $50,000 to $74,999 | 18 | 7.8% |
| $75,000 to $99,999 | 24 | 10.4% |
| $100,000 to $149,999 | 63 | 27.4% |
| $150,000 to $199,999 | 21 | 9.1% |
| $200,000+ | 37 | 16.1% |
Family Income by Famaliy Size in Blue Lake
3-person families (30 | 13.0%) account for the highest median family income in Blue Lake with $106,250 per family, while 2-person families (192 | 83.5%) have the highest median income of $44,432 per family member.
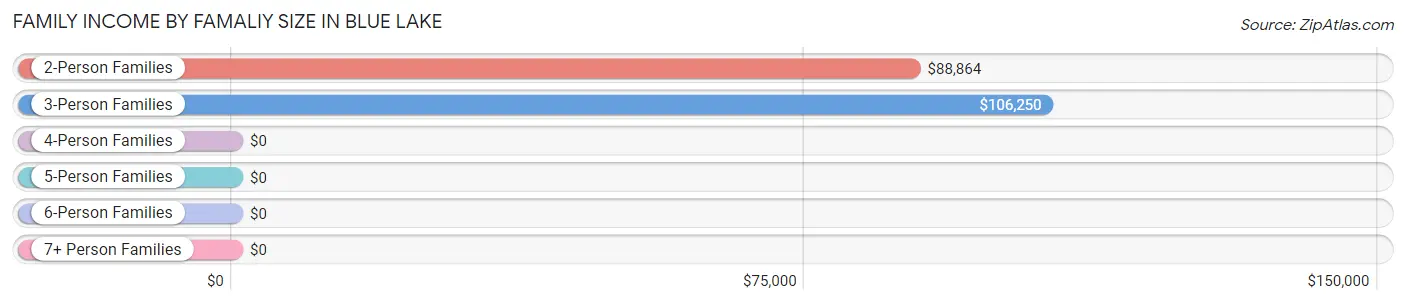
| Income Bracket | # Families | Median Income |
| 2-Person Families | 192 (83.5%) | $88,864 |
| 3-Person Families | 30 (13.0%) | $106,250 |
| 4-Person Families | 8 (3.5%) | $0 |
| 5-Person Families | 0 (0.0%) | $0 |
| 6-Person Families | 0 (0.0%) | $0 |
| 7+ Person Families | 0 (0.0%) | $0 |
| Total | 230 (100.0%) | $100,469 |
Family Income by Number of Earners in Blue Lake
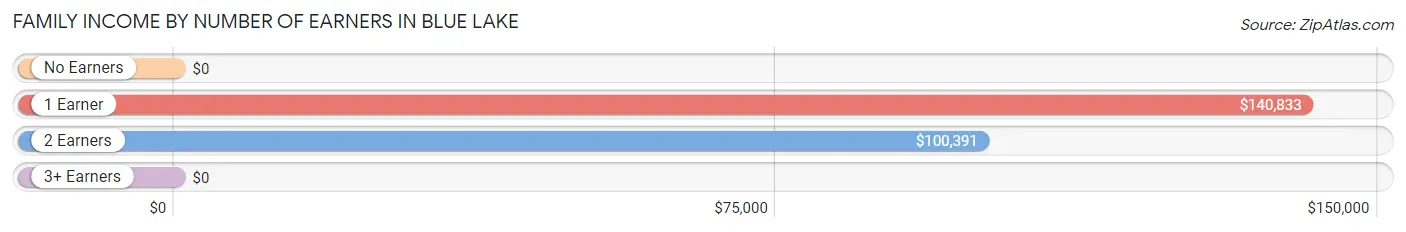
| Number of Earners | # Families | Median Income |
| No Earners | 30 (13.0%) | $0 |
| 1 Earner | 94 (40.9%) | $140,833 |
| 2 Earners | 96 (41.7%) | $100,391 |
| 3+ Earners | 10 (4.3%) | $0 |
| Total | 230 (100.0%) | $100,469 |
Household Income in Blue Lake
Household Income Brackets in Blue Lake
With 82 households falling in the category, the $35,000 to $49,999 income range is the most frequent in Blue Lake, accounting for 18.3% of all households. In contrast, only 9 households (2.0%) fall into the $10,000 to $14,999 income bracket, making it the least populous group.
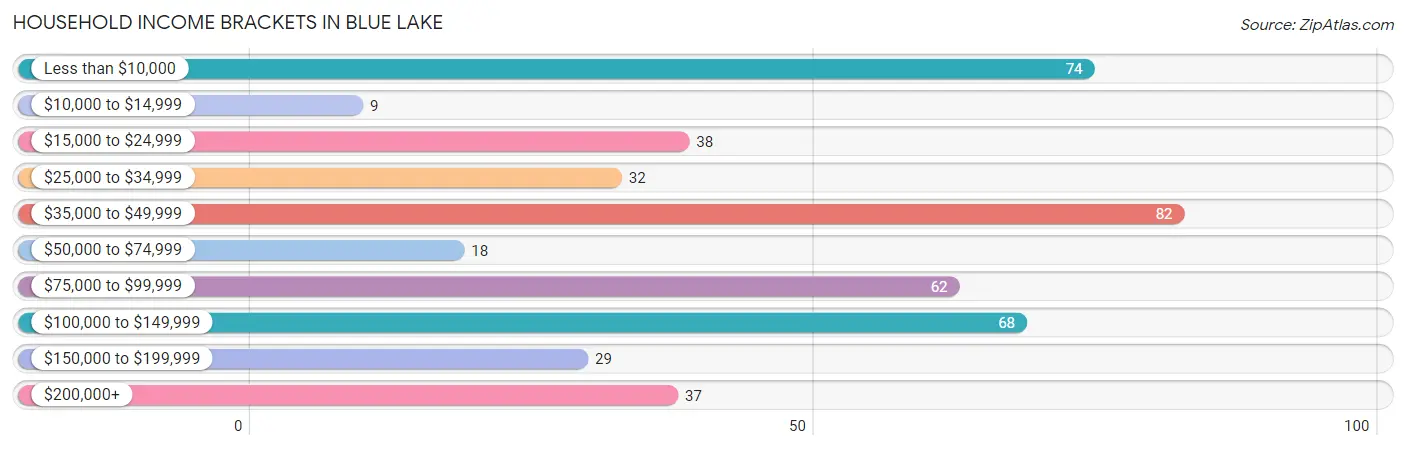
| Income Bracket | # Households | % Households |
| Less than $10,000 | 74 | 16.5% |
| $10,000 to $14,999 | 9 | 2.0% |
| $15,000 to $24,999 | 38 | 8.5% |
| $25,000 to $34,999 | 32 | 7.1% |
| $35,000 to $49,999 | 82 | 18.3% |
| $50,000 to $74,999 | 18 | 4.0% |
| $75,000 to $99,999 | 62 | 13.8% |
| $100,000 to $149,999 | 68 | 15.1% |
| $150,000 to $199,999 | 29 | 6.5% |
| $200,000+ | 37 | 8.2% |
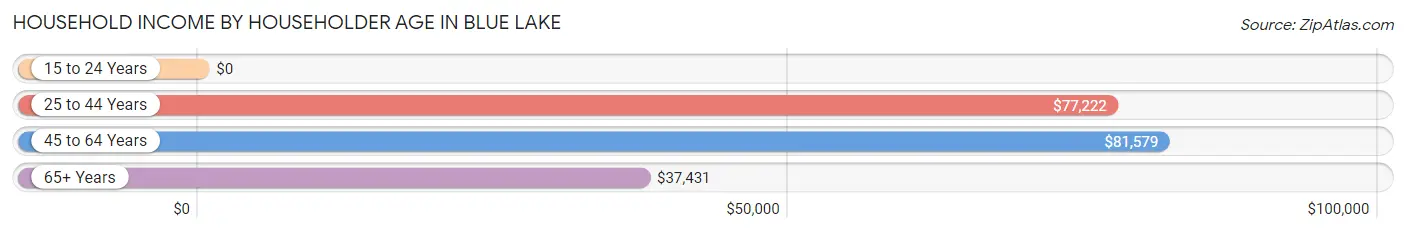
Household Income by Householder Age in Blue Lake
The median household income in Blue Lake is $48,807, with the highest median household income of $81,579 found in the 45 to 64 years age bracket for the primary householder. A total of 156 households (34.7%) fall into this category. Meanwhile, the 15 to 24 years age bracket for the primary householder has the lowest median household income of $0, with 16 households (3.6%) in this group.
| Income Bracket | # Households | Median Income |
| 15 to 24 Years | 16 (3.6%) | $0 |
| 25 to 44 Years | 132 (29.4%) | $77,222 |
| 45 to 64 Years | 156 (34.7%) | $81,579 |
| 65+ Years | 145 (32.3%) | $37,431 |
| Total | 449 (100.0%) | $48,807 |
Poverty in Blue Lake
Income Below Poverty by Sex and Age in Blue Lake
With 32.0% poverty level for males and 17.1% for females among the residents of Blue Lake, 18 to 24 year old males and 6 to 11 year old females are the most vulnerable to poverty, with 16 males (100.0%) and 19 females (100.0%) in their respective age groups living below the poverty level.
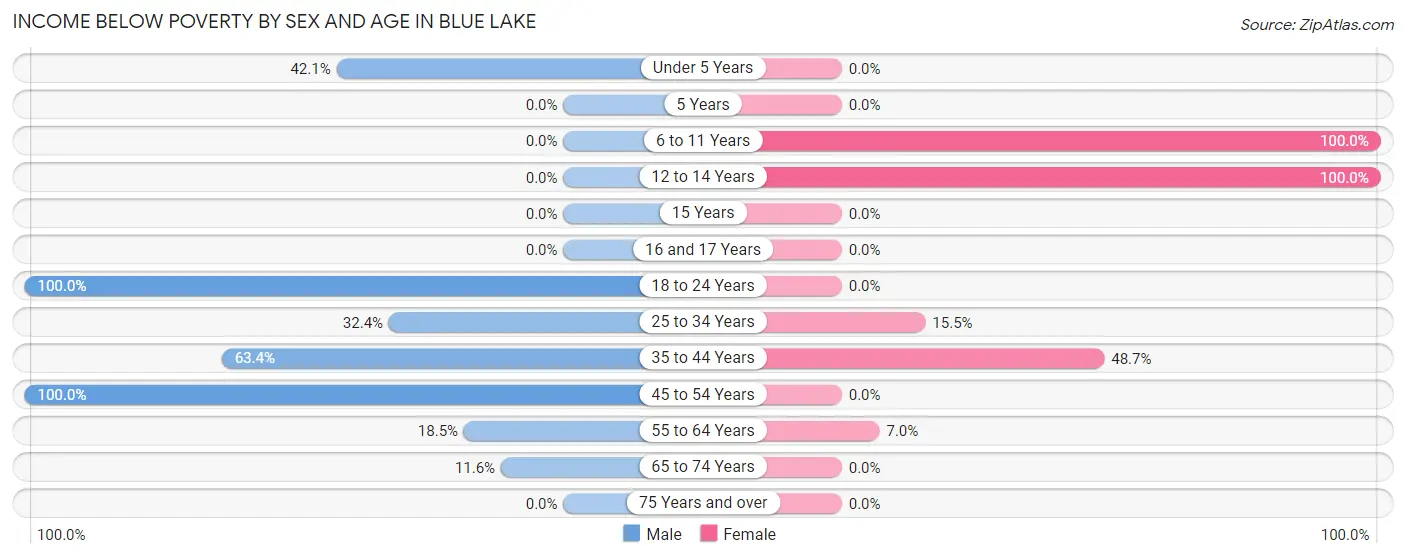
| Age Bracket | Male | Female |
| Under 5 Years | 8 (42.1%) | 0 (0.0%) |
| 5 Years | 0 (0.0%) | 0 (0.0%) |
| 6 to 11 Years | 0 (0.0%) | 19 (100.0%) |
| 12 to 14 Years | 0 (0.0%) | 12 (100.0%) |
| 15 Years | 0 (0.0%) | 0 (0.0%) |
| 16 and 17 Years | 0 (0.0%) | 0 (0.0%) |
| 18 to 24 Years | 16 (100.0%) | 0 (0.0%) |
| 25 to 34 Years | 34 (32.4%) | 9 (15.5%) |
| 35 to 44 Years | 26 (63.4%) | 19 (48.7%) |
| 45 to 54 Years | 19 (100.0%) | 0 (0.0%) |
| 55 to 64 Years | 12 (18.5%) | 11 (7.0%) |
| 65 to 74 Years | 11 (11.6%) | 0 (0.0%) |
| 75 Years and over | 0 (0.0%) | 0 (0.0%) |
| Total | 126 (32.0%) | 70 (17.1%) |
Income Above Poverty by Sex and Age in Blue Lake
According to the poverty statistics in Blue Lake, males aged 75 years and over and females aged under 5 years are the age groups that are most secure financially, with 100.0% of males and 100.0% of females in these age groups living above the poverty line.
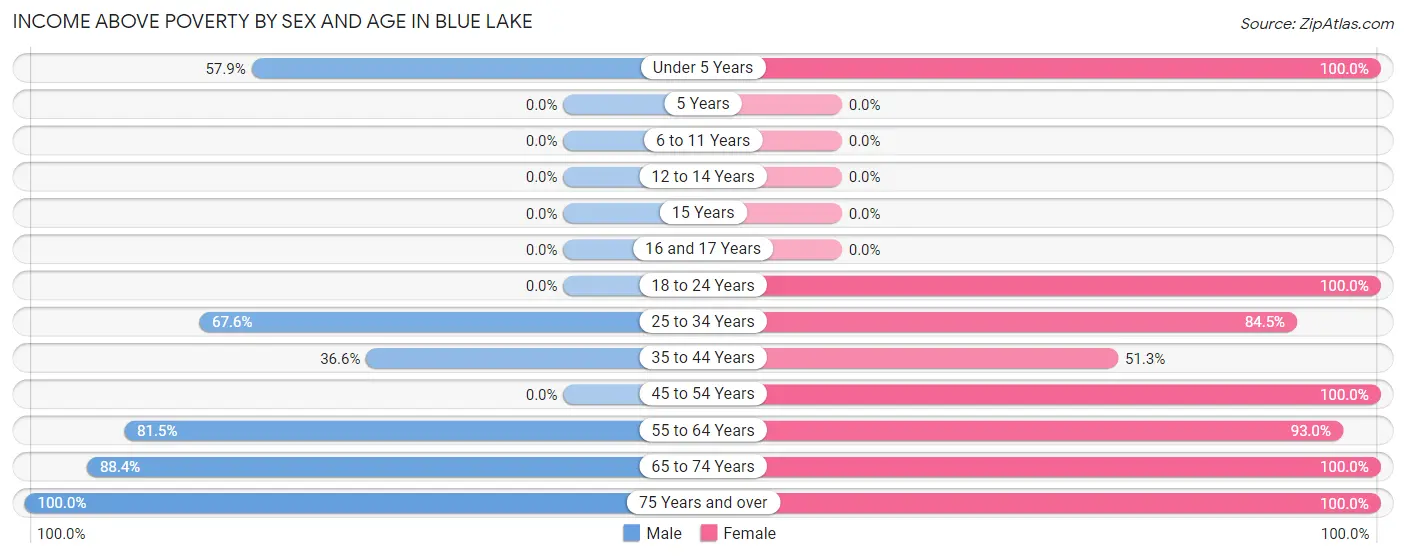
| Age Bracket | Male | Female |
| Under 5 Years | 11 (57.9%) | 15 (100.0%) |
| 5 Years | 0 (0.0%) | 0 (0.0%) |
| 6 to 11 Years | 0 (0.0%) | 0 (0.0%) |
| 12 to 14 Years | 0 (0.0%) | 0 (0.0%) |
| 15 Years | 0 (0.0%) | 0 (0.0%) |
| 16 and 17 Years | 0 (0.0%) | 0 (0.0%) |
| 18 to 24 Years | 0 (0.0%) | 1 (100.0%) |
| 25 to 34 Years | 71 (67.6%) | 49 (84.5%) |
| 35 to 44 Years | 15 (36.6%) | 20 (51.3%) |
| 45 to 54 Years | 0 (0.0%) | 17 (100.0%) |
| 55 to 64 Years | 53 (81.5%) | 146 (93.0%) |
| 65 to 74 Years | 84 (88.4%) | 88 (100.0%) |
| 75 Years and over | 34 (100.0%) | 3 (100.0%) |
| Total | 268 (68.0%) | 339 (82.9%) |
Income Below Poverty Among Married-Couple Families in Blue Lake
The poverty statistics for married-couple families in Blue Lake show that 5.0% or 9 of the total 181 families live below the poverty line. Families with no children have the highest poverty rate of 5.6%, comprising of 9 families. On the other hand, families with 1 or 2 children have the lowest poverty rate of 0.0%, which includes 0 families.
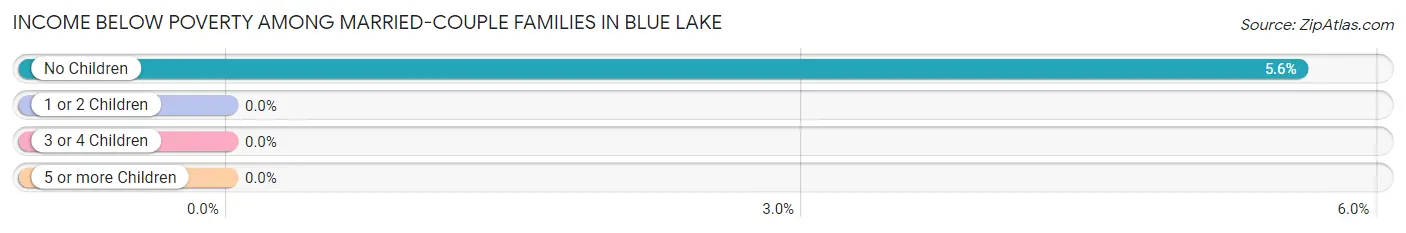
| Children | Above Poverty | Below Poverty |
| No Children | 152 (94.4%) | 9 (5.6%) |
| 1 or 2 Children | 20 (100.0%) | 0 (0.0%) |
| 3 or 4 Children | 0 (0.0%) | 0 (0.0%) |
| 5 or more Children | 0 (0.0%) | 0 (0.0%) |
| Total | 172 (95.0%) | 9 (5.0%) |
Income Below Poverty Among Single-Parent Households in Blue Lake
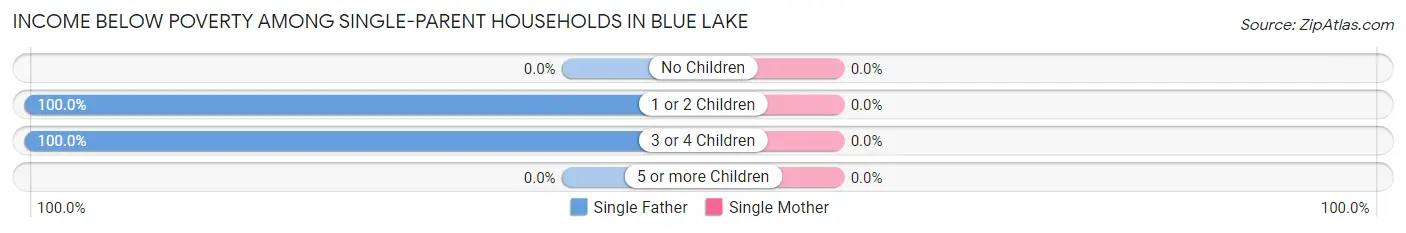
| Children | Single Father | Single Mother |
| No Children | 0 (0.0%) | 0 (0.0%) |
| 1 or 2 Children | 10 (100.0%) | 0 (0.0%) |
| 3 or 4 Children | 8 (100.0%) | 0 (0.0%) |
| 5 or more Children | 0 (0.0%) | 0 (0.0%) |
| Total | 18 (48.6%) | 0 (0.0%) |
Income Below Poverty Among Married-Couple vs Single-Parent Households in Blue Lake
The poverty data for Blue Lake shows that 9 of the married-couple family households (5.0%) and 18 of the single-parent households (36.7%) are living below the poverty level. Within the married-couple family households, those with no children have the highest poverty rate, with 9 households (5.6%) falling below the poverty line. Among the single-parent households, those with 1 or 2 children have the highest poverty rate, with 10 household (100.0%) living below poverty.
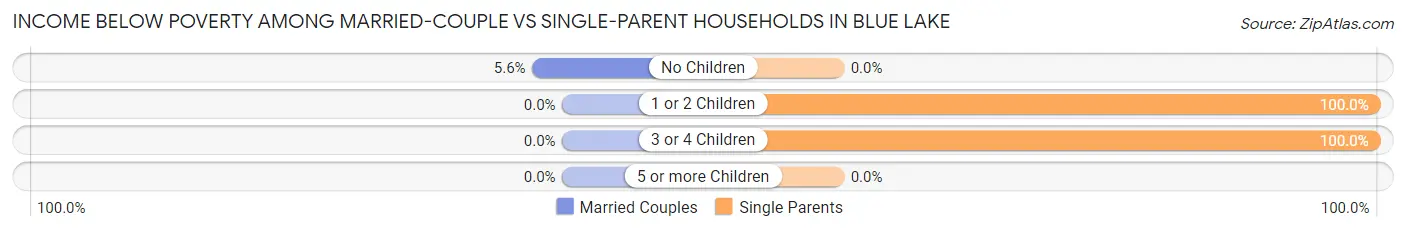
| Children | Married-Couple Families | Single-Parent Households |
| No Children | 9 (5.6%) | 0 (0.0%) |
| 1 or 2 Children | 0 (0.0%) | 10 (100.0%) |
| 3 or 4 Children | 0 (0.0%) | 8 (100.0%) |
| 5 or more Children | 0 (0.0%) | 0 (0.0%) |
| Total | 9 (5.0%) | 18 (36.7%) |
Race in Blue Lake
The most populous races in Blue Lake are White / Caucasian (708 | 84.2%), Two or more Races (64 | 7.6%), and Native / Alaskan (45 | 5.3%).
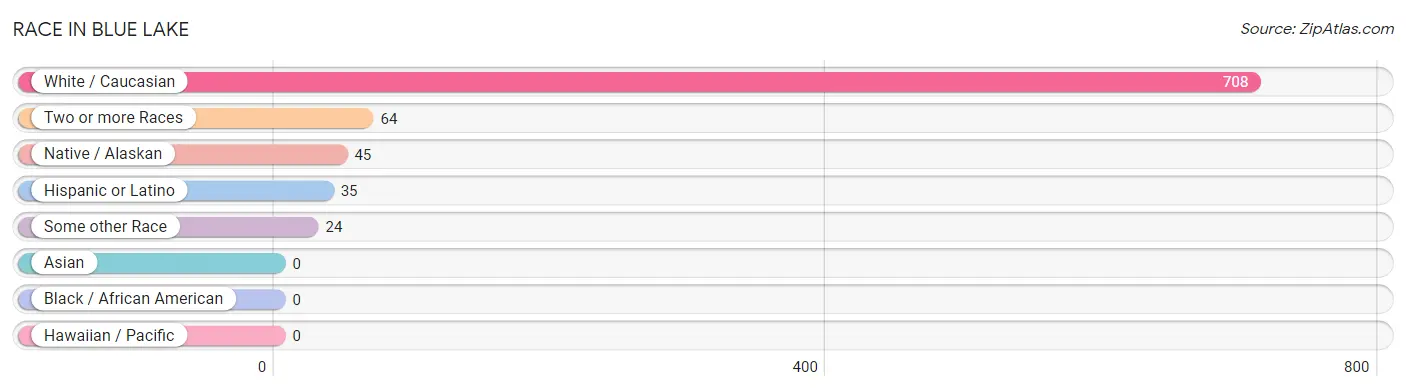
| Race | # Population | % Population |
| Asian | 0 | 0.0% |
| Black / African American | 0 | 0.0% |
| Hawaiian / Pacific | 0 | 0.0% |
| Hispanic or Latino | 35 | 4.2% |
| Native / Alaskan | 45 | 5.3% |
| White / Caucasian | 708 | 84.2% |
| Two or more Races | 64 | 7.6% |
| Some other Race | 24 | 2.9% |
| Total | 841 | 100.0% |
Ancestry in Blue Lake
The most populous ancestries reported in Blue Lake are German (132 | 15.7%), Irish (129 | 15.3%), English (105 | 12.5%), Italian (61 | 7.2%), and European (37 | 4.4%), together accounting for 55.2% of all Blue Lake residents.
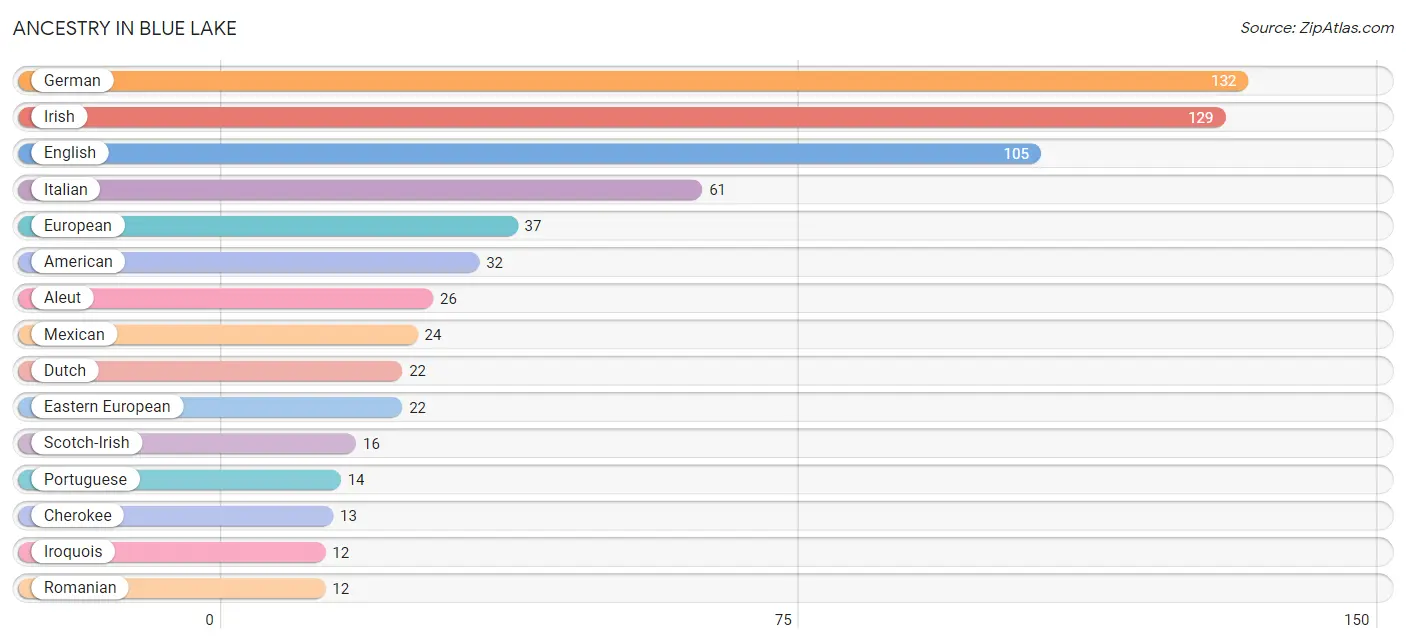
| Ancestry | # Population | % Population |
| Aleut | 26 | 3.1% |
| American | 32 | 3.8% |
| Austrian | 11 | 1.3% |
| Central American | 11 | 1.3% |
| Cherokee | 13 | 1.5% |
| Dutch | 22 | 2.6% |
| Eastern European | 22 | 2.6% |
| English | 105 | 12.5% |
| European | 37 | 4.4% |
| French | 11 | 1.3% |
| German | 132 | 15.7% |
| Irish | 129 | 15.3% |
| Iroquois | 12 | 1.4% |
| Italian | 61 | 7.2% |
| Mexican | 24 | 2.9% |
| Norwegian | 3 | 0.4% |
| Polish | 11 | 1.3% |
| Portuguese | 14 | 1.7% |
| Romanian | 12 | 1.4% |
| Russian | 10 | 1.2% |
| Salvadoran | 11 | 1.3% |
| Scandinavian | 9 | 1.1% |
| Scotch-Irish | 16 | 1.9% |
| Slovene | 10 | 1.2% |
| Swedish | 10 | 1.2% |
| Swiss | 9 | 1.1% |
| Welsh | 10 | 1.2% | View All 27 Rows |
Immigrants in Blue Lake

| Immigration Origin | # Population | % Population | View All 0 Rows |
Sex and Age in Blue Lake
Sex and Age in Blue Lake
The most populous age groups in Blue Lake are 65 to 69 Years (83 | 20.5%) for men and 60 to 64 Years (110 | 25.2%) for women.
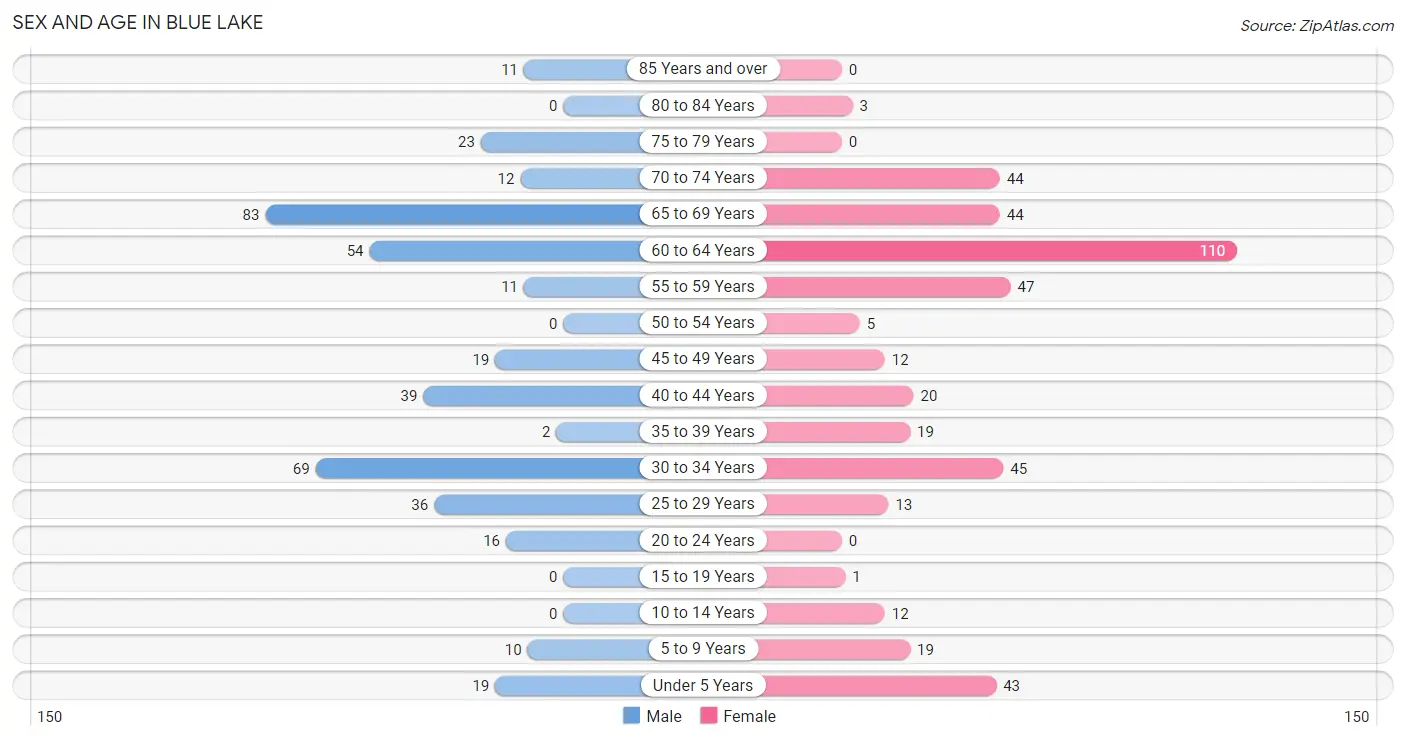
| Age Bracket | Male | Female |
| Under 5 Years | 19 (4.7%) | 43 (9.8%) |
| 5 to 9 Years | 10 (2.5%) | 19 (4.3%) |
| 10 to 14 Years | 0 (0.0%) | 12 (2.8%) |
| 15 to 19 Years | 0 (0.0%) | 1 (0.2%) |
| 20 to 24 Years | 16 (4.0%) | 0 (0.0%) |
| 25 to 29 Years | 36 (8.9%) | 13 (3.0%) |
| 30 to 34 Years | 69 (17.1%) | 45 (10.3%) |
| 35 to 39 Years | 2 (0.5%) | 19 (4.3%) |
| 40 to 44 Years | 39 (9.7%) | 20 (4.6%) |
| 45 to 49 Years | 19 (4.7%) | 12 (2.8%) |
| 50 to 54 Years | 0 (0.0%) | 5 (1.1%) |
| 55 to 59 Years | 11 (2.7%) | 47 (10.8%) |
| 60 to 64 Years | 54 (13.4%) | 110 (25.2%) |
| 65 to 69 Years | 83 (20.5%) | 44 (10.1%) |
| 70 to 74 Years | 12 (3.0%) | 44 (10.1%) |
| 75 to 79 Years | 23 (5.7%) | 0 (0.0%) |
| 80 to 84 Years | 0 (0.0%) | 3 (0.7%) |
| 85 Years and over | 11 (2.7%) | 0 (0.0%) |
| Total | 404 (100.0%) | 437 (100.0%) |
Families and Households in Blue Lake
Median Family Size in Blue Lake
The median family size in Blue Lake is 2.28 persons per family, with single male/father families (37 | 16.1%) accounting for the largest median family size of 2.76 persons per family. On the other hand, married-couple families (181 | 78.7%) represent the smallest median family size with 2.16 persons per family.
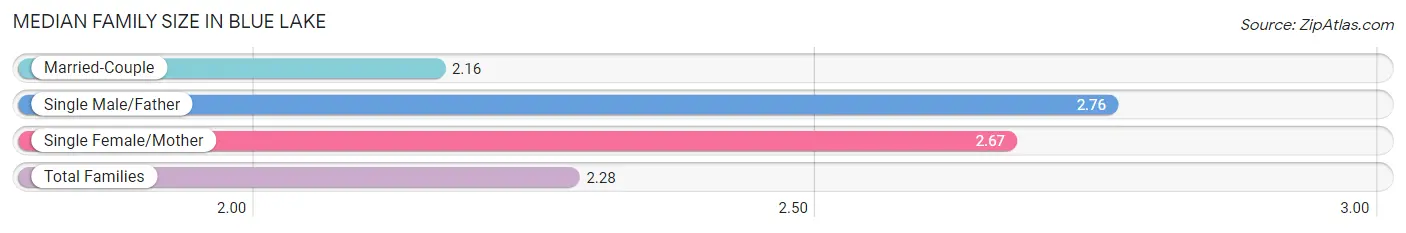
| Family Type | # Families | Family Size |
| Married-Couple | 181 (78.7%) | 2.16 |
| Single Male/Father | 37 (16.1%) | 2.76 |
| Single Female/Mother | 12 (5.2%) | 2.67 |
| Total Families | 230 (100.0%) | 2.28 |
Median Household Size in Blue Lake
The median household size in Blue Lake is 1.87 persons per household, with single male/father households (37 | 8.2%) accounting for the largest median household size of 3 persons per household. non-family households (219 | 48.8%) represent the smallest median household size with 1.22 persons per household.
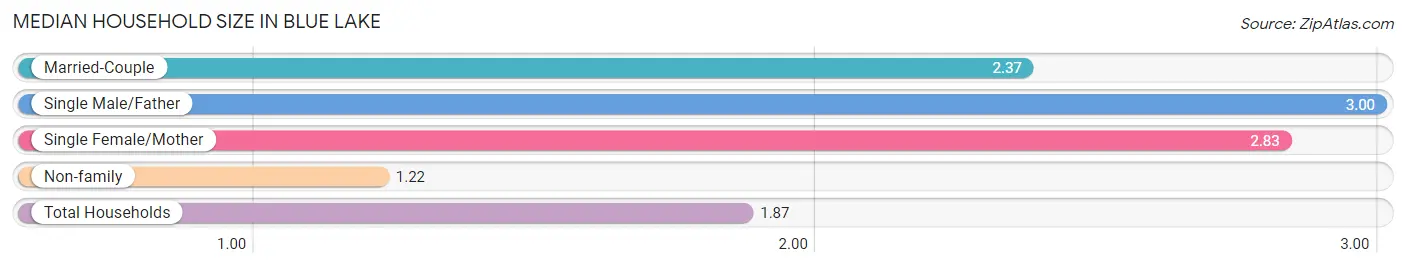
| Household Type | # Households | Household Size |
| Married-Couple | 181 (40.3%) | 2.37 |
| Single Male/Father | 37 (8.2%) | 3.00 |
| Single Female/Mother | 12 (2.7%) | 2.83 |
| Non-family | 219 (48.8%) | 1.22 |
| Total Households | 449 (100.0%) | 1.87 |
Household Size by Marriage Status in Blue Lake
Out of a total of 449 households in Blue Lake, 230 (51.2%) are family households, while 219 (48.8%) are nonfamily households. The most numerous type of family households are 2-person households, comprising 181, and the most common type of nonfamily households are 1-person households, comprising 177.
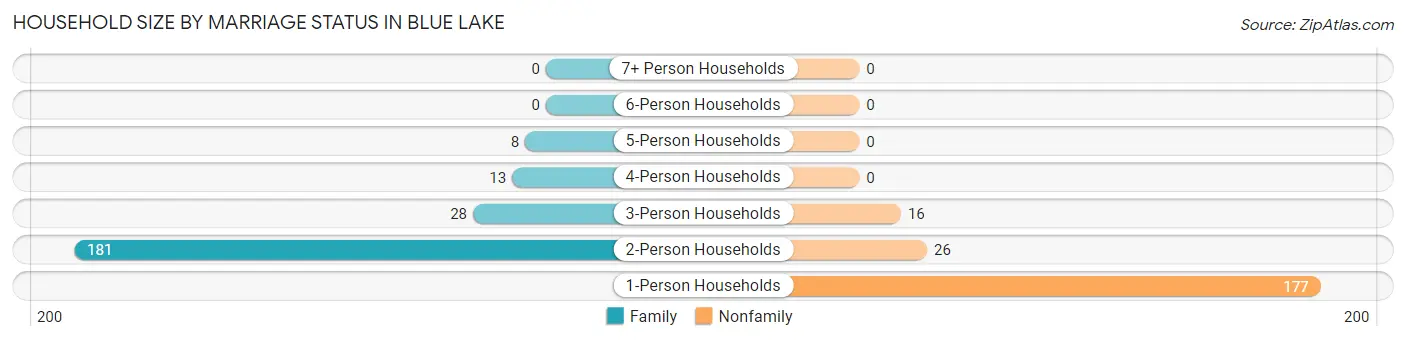
| Household Size | Family Households | Nonfamily Households |
| 1-Person Households | - | 177 (39.4%) |
| 2-Person Households | 181 (40.3%) | 26 (5.8%) |
| 3-Person Households | 28 (6.2%) | 16 (3.6%) |
| 4-Person Households | 13 (2.9%) | 0 (0.0%) |
| 5-Person Households | 8 (1.8%) | 0 (0.0%) |
| 6-Person Households | 0 (0.0%) | 0 (0.0%) |
| 7+ Person Households | 0 (0.0%) | 0 (0.0%) |
| Total | 230 (51.2%) | 219 (48.8%) |
Female Fertility in Blue Lake
Fertility by Age in Blue Lake
Average fertility rate in Blue Lake is 100.0 births per 1,000 women. Women in the age bracket of 20 to 34 years have the highest fertility rate with 190.0 births per 1,000 women. Women in the age bracket of 20 to 34 years acount for 100.0% of all women with births.
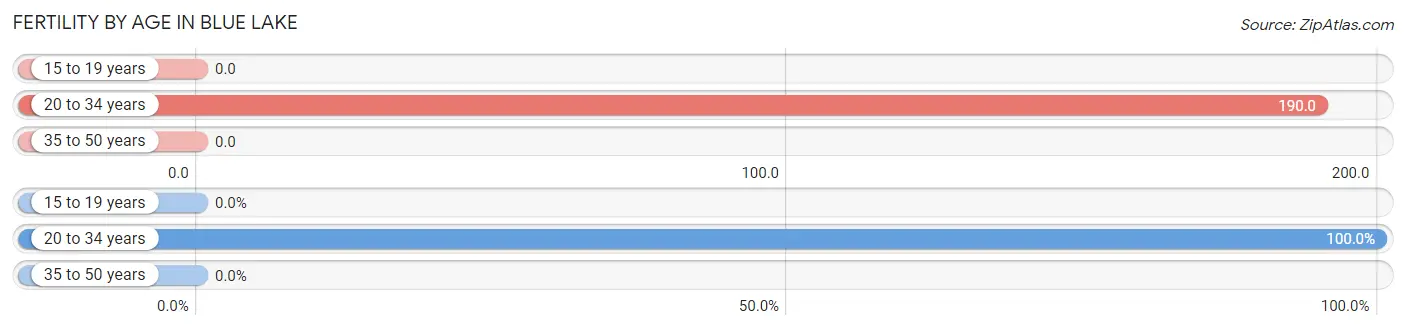
| Age Bracket | Women with Births | Births / 1,000 Women |
| 15 to 19 years | 0 (0.0%) | 0.0 |
| 20 to 34 years | 11 (100.0%) | 190.0 |
| 35 to 50 years | 0 (0.0%) | 0.0 |
| Total | 11 (100.0%) | 100.0 |
Fertility by Age by Marriage Status in Blue Lake
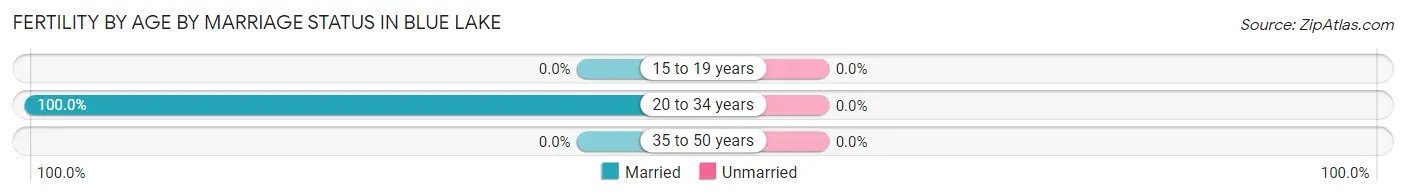
| Age Bracket | Married | Unmarried |
| 15 to 19 years | 0 (0.0%) | 0 (0.0%) |
| 20 to 34 years | 11 (100.0%) | 0 (0.0%) |
| 35 to 50 years | 0 (0.0%) | 0 (0.0%) |
| Total | 11 (100.0%) | 0 (0.0%) |
Fertility by Education in Blue Lake
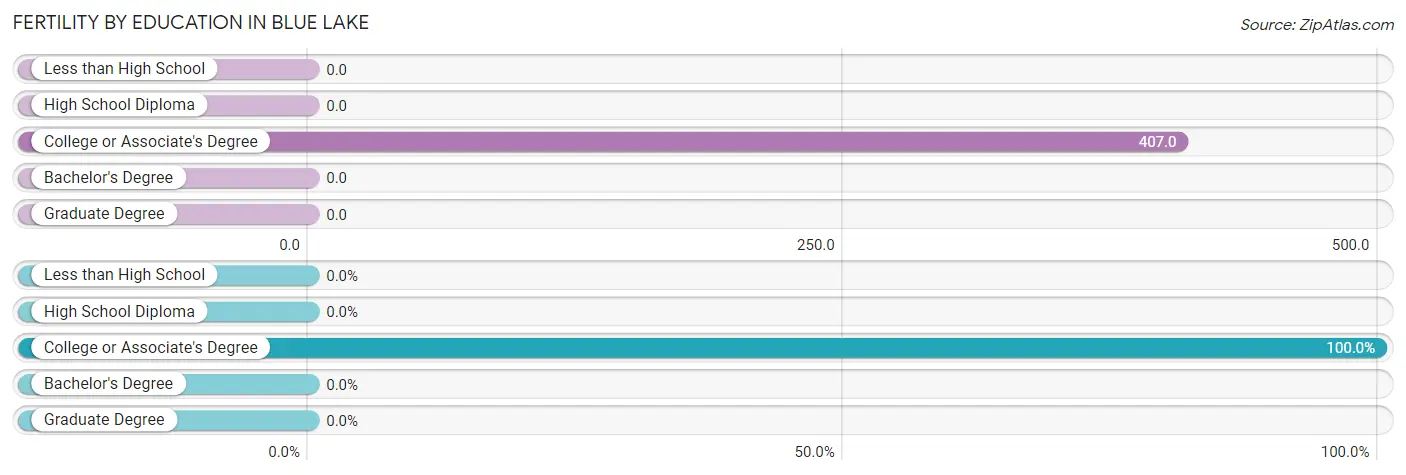
| Educational Attainment | Women with Births | Births / 1,000 Women |
| Less than High School | 0 (0.0%) | 0.0 |
| High School Diploma | 0 (0.0%) | 0.0 |
| College or Associate's Degree | 11 (100.0%) | 407.0 |
| Bachelor's Degree | 0 (0.0%) | 0.0 |
| Graduate Degree | 0 (0.0%) | 0.0 |
| Total | 11 (100.0%) | 100.0 |
Fertility by Education by Marriage Status in Blue Lake
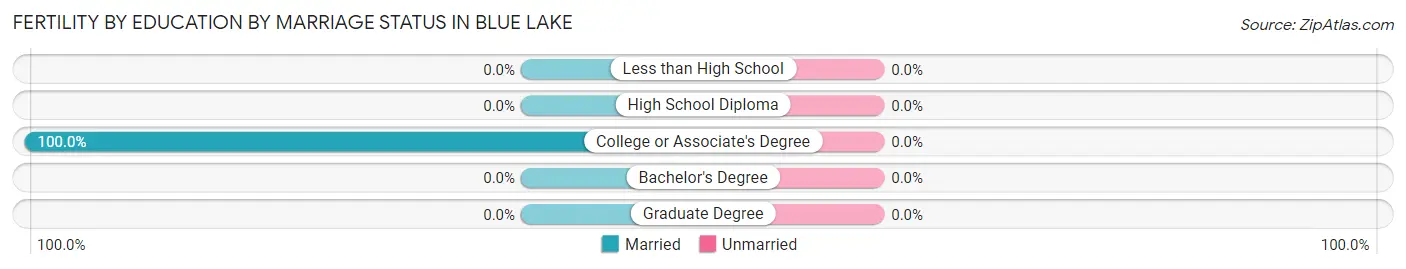
| Educational Attainment | Married | Unmarried |
| Less than High School | 0 (0.0%) | 0 (0.0%) |
| High School Diploma | 0 (0.0%) | 0 (0.0%) |
| College or Associate's Degree | 11 (100.0%) | 0 (0.0%) |
| Bachelor's Degree | 0 (0.0%) | 0 (0.0%) |
| Graduate Degree | 0 (0.0%) | 0 (0.0%) |
| Total | 11 (100.0%) | 0 (0.0%) |
Employment Characteristics in Blue Lake
Employment by Class of Employer in Blue Lake
Among the 381 employed individuals in Blue Lake, private company employees (174 | 45.7%), not-for-profit organizations (61 | 16.0%), and self-employed (not incorporated) (56 | 14.7%) make up the most common classes of employment.
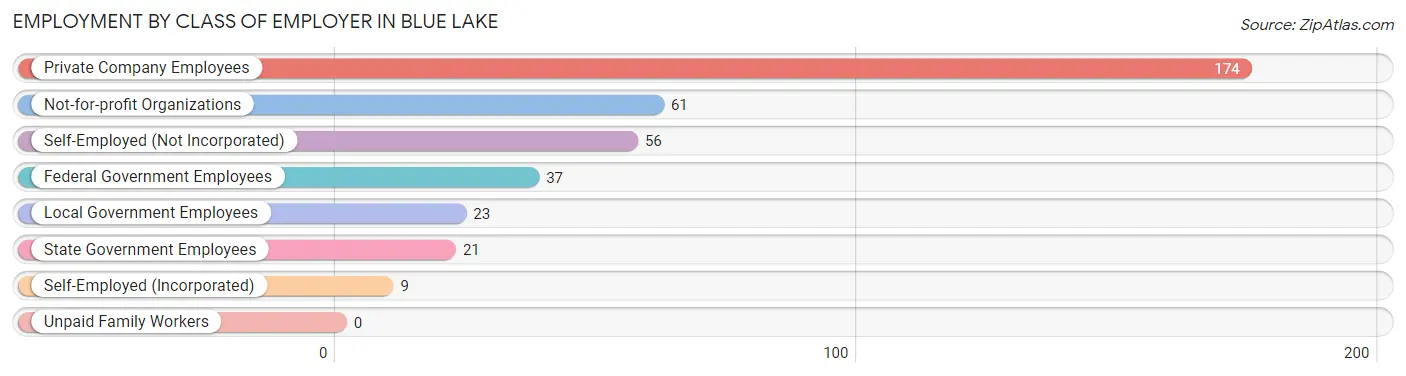
| Employer Class | # Employees | % Employees |
| Private Company Employees | 174 | 45.7% |
| Self-Employed (Incorporated) | 9 | 2.4% |
| Self-Employed (Not Incorporated) | 56 | 14.7% |
| Not-for-profit Organizations | 61 | 16.0% |
| Local Government Employees | 23 | 6.0% |
| State Government Employees | 21 | 5.5% |
| Federal Government Employees | 37 | 9.7% |
| Unpaid Family Workers | 0 | 0.0% |
| Total | 381 | 100.0% |
Employment Status by Age in Blue Lake
According to the labor force statistics for Blue Lake, out of the total population over 16 years of age (738), 56.1% or 414 individuals are in the labor force, with 7.7% or 32 of them unemployed. The age group with the highest labor force participation rate is 16 to 19 years, with 100.0% or 1 individuals in the labor force. Within the labor force, the 35 to 44 years age range has the highest percentage of unemployed individuals, with 22.2% or 10 of them being unemployed.
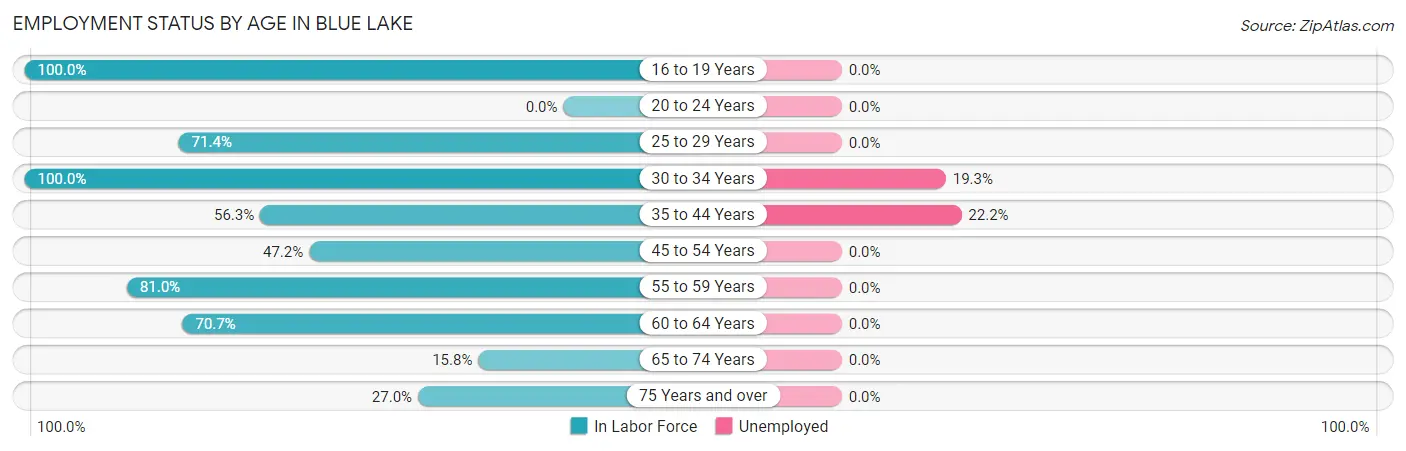
| Age Bracket | In Labor Force | Unemployed |
| 16 to 19 Years | 1 (100.0%) | 0 (0.0%) |
| 20 to 24 Years | 0 (0.0%) | 0 (0.0%) |
| 25 to 29 Years | 35 (71.4%) | 0 (0.0%) |
| 30 to 34 Years | 114 (100.0%) | 22 (19.3%) |
| 35 to 44 Years | 45 (56.3%) | 10 (22.2%) |
| 45 to 54 Years | 17 (47.2%) | 0 (0.0%) |
| 55 to 59 Years | 47 (81.0%) | 0 (0.0%) |
| 60 to 64 Years | 116 (70.7%) | 0 (0.0%) |
| 65 to 74 Years | 29 (15.8%) | 0 (0.0%) |
| 75 Years and over | 10 (27.0%) | 0 (0.0%) |
| Total | 414 (56.1%) | 32 (7.7%) |
Employment Status by Educational Attainment in Blue Lake
According to labor force statistics for Blue Lake, 74.7% of individuals (374) out of the total population between 25 and 64 years of age (501) are in the labor force, with 8.6% or 32 of them being unemployed. The group with the highest labor force participation rate are those with the educational attainment of bachelor's degree or higher, with 95.2% or 200 individuals in the labor force. Within the labor force, individuals with college / associate degree education have the highest percentage of unemployment, with 11.0% or 11 of them being unemployed.
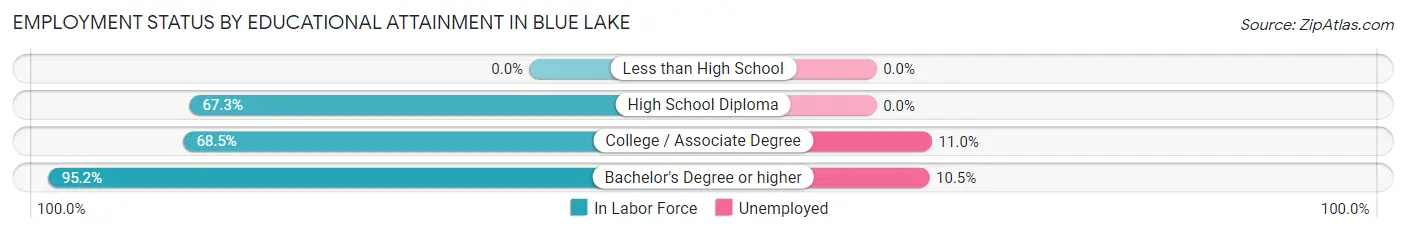
| Educational Attainment | In Labor Force | Unemployed |
| Less than High School | 0 (0.0%) | 0 (0.0%) |
| High School Diploma | 74 (67.3%) | 0 (0.0%) |
| College / Associate Degree | 100 (68.5%) | 16 (11.0%) |
| Bachelor's Degree or higher | 200 (95.2%) | 22 (10.5%) |
| Total | 374 (74.7%) | 43 (8.6%) |
Employment Occupations by Sex in Blue Lake
Management, Business, Science and Arts Occupations
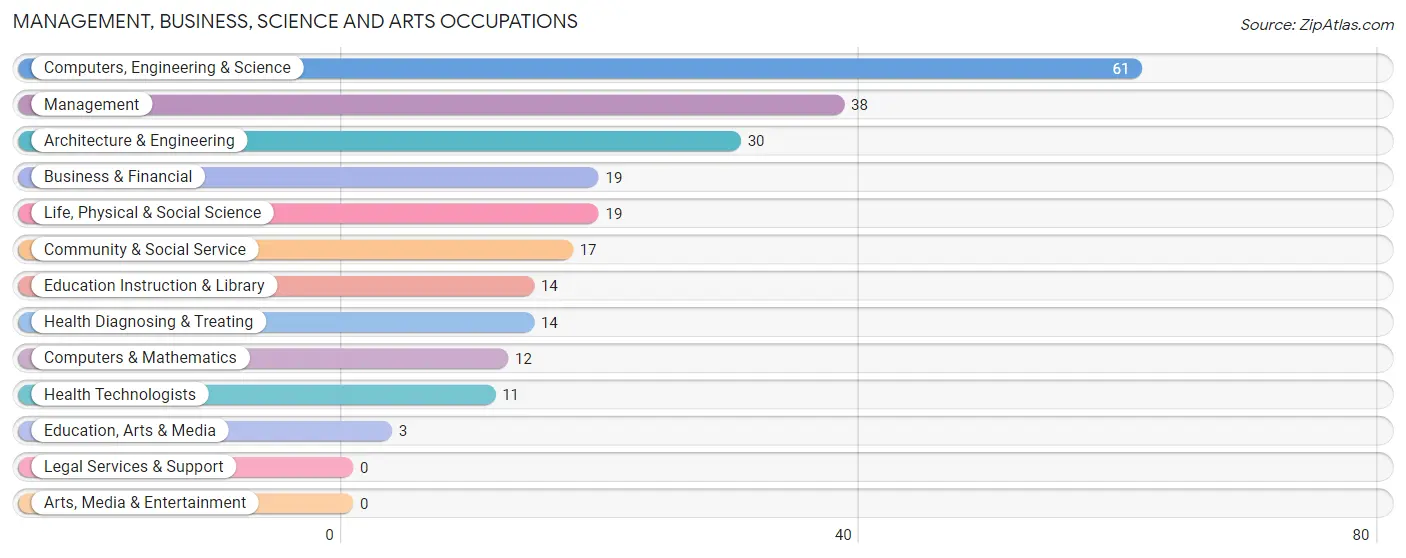
The most common Management, Business, Science and Arts occupations in Blue Lake are Computers, Engineering & Science (61 | 16.0%), Management (38 | 10.0%), Architecture & Engineering (30 | 7.9%), Business & Financial (19 | 5.0%), and Life, Physical & Social Science (19 | 5.0%).
Management, Business, Science and Arts Occupations by Sex
Within the Management, Business, Science and Arts occupations in Blue Lake, the most male-oriented occupations are Education, Arts & Media (100.0%), Health Technologists (100.0%), and Health Diagnosing & Treating (78.6%), while the most female-oriented occupations are Business & Financial (100.0%), Computers & Mathematics (100.0%), and Education Instruction & Library (100.0%).
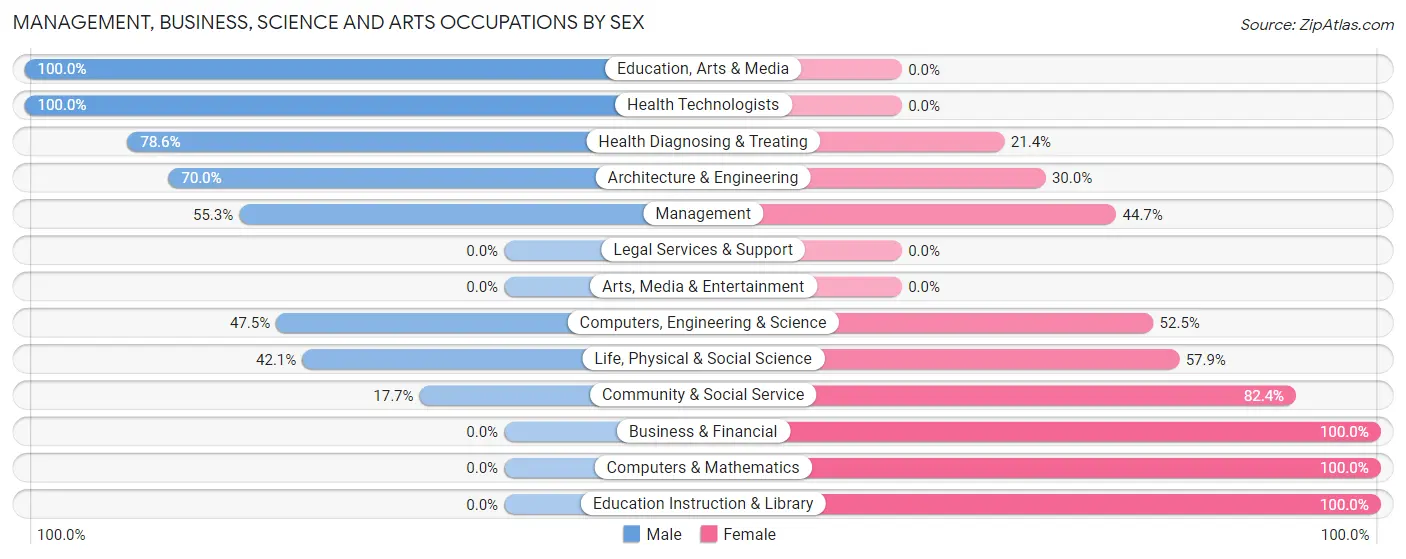
| Occupation | Male | Female |
| Management | 21 (55.3%) | 17 (44.7%) |
| Business & Financial | 0 (0.0%) | 19 (100.0%) |
| Computers, Engineering & Science | 29 (47.5%) | 32 (52.5%) |
| Computers & Mathematics | 0 (0.0%) | 12 (100.0%) |
| Architecture & Engineering | 21 (70.0%) | 9 (30.0%) |
| Life, Physical & Social Science | 8 (42.1%) | 11 (57.9%) |
| Community & Social Service | 3 (17.6%) | 14 (82.4%) |
| Education, Arts & Media | 3 (100.0%) | 0 (0.0%) |
| Legal Services & Support | 0 (0.0%) | 0 (0.0%) |
| Education Instruction & Library | 0 (0.0%) | 14 (100.0%) |
| Arts, Media & Entertainment | 0 (0.0%) | 0 (0.0%) |
| Health Diagnosing & Treating | 11 (78.6%) | 3 (21.4%) |
| Health Technologists | 11 (100.0%) | 0 (0.0%) |
| Total (Category) | 64 (42.9%) | 85 (57.1%) |
| Total (Overall) | 158 (41.4%) | 224 (58.6%) |
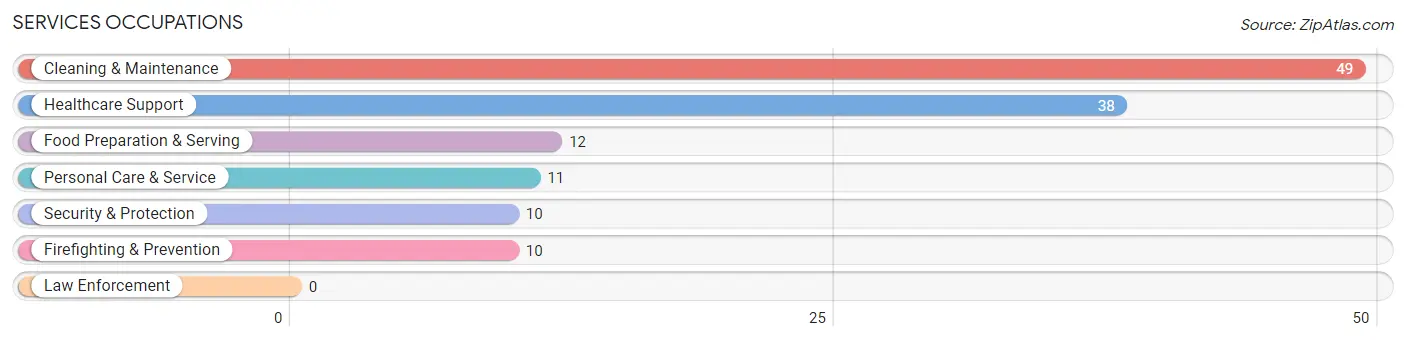
Services Occupations
The most common Services occupations in Blue Lake are Cleaning & Maintenance (49 | 12.8%), Healthcare Support (38 | 10.0%), Food Preparation & Serving (12 | 3.1%), Personal Care & Service (11 | 2.9%), and Security & Protection (10 | 2.6%).
Services Occupations by Sex
Within the Services occupations in Blue Lake, the most male-oriented occupations are Security & Protection (100.0%), Firefighting & Prevention (100.0%), and Food Preparation & Serving (100.0%), while the most female-oriented occupations are Personal Care & Service (90.9%), Cleaning & Maintenance (59.2%), and Healthcare Support (47.4%).
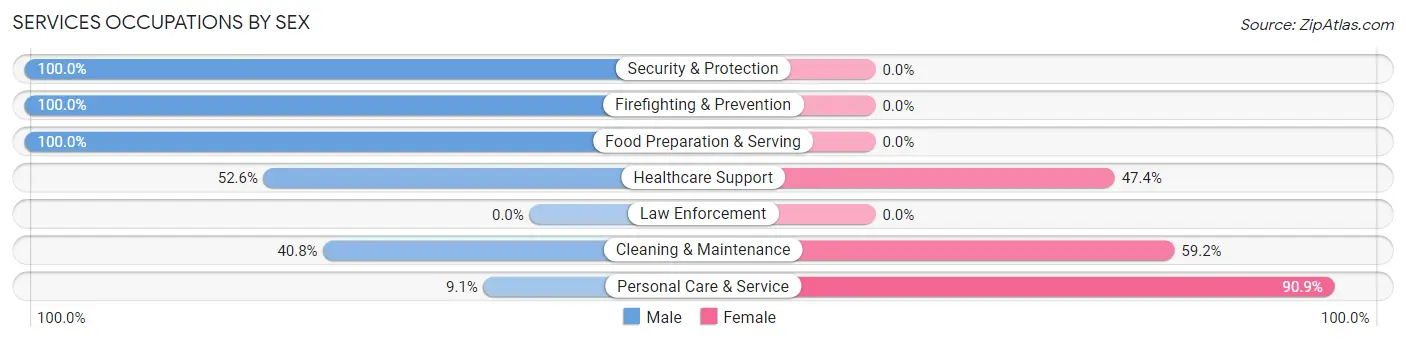
| Occupation | Male | Female |
| Healthcare Support | 20 (52.6%) | 18 (47.4%) |
| Security & Protection | 10 (100.0%) | 0 (0.0%) |
| Firefighting & Prevention | 10 (100.0%) | 0 (0.0%) |
| Law Enforcement | 0 (0.0%) | 0 (0.0%) |
| Food Preparation & Serving | 12 (100.0%) | 0 (0.0%) |
| Cleaning & Maintenance | 20 (40.8%) | 29 (59.2%) |
| Personal Care & Service | 1 (9.1%) | 10 (90.9%) |
| Total (Category) | 63 (52.5%) | 57 (47.5%) |
| Total (Overall) | 158 (41.4%) | 224 (58.6%) |
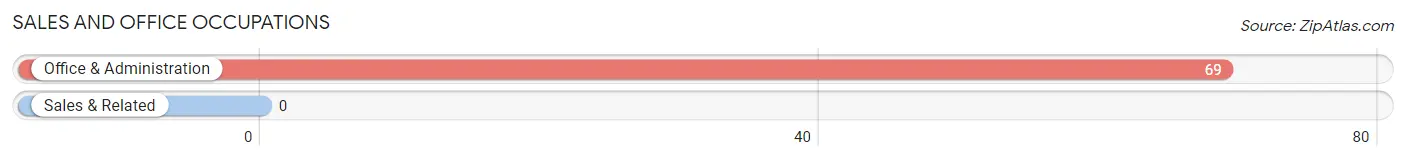
Sales and Office Occupations
The most common Sales and Office occupations in Blue Lake are , and Office & Administration (69 | 18.1%).
Sales and Office Occupations by Sex
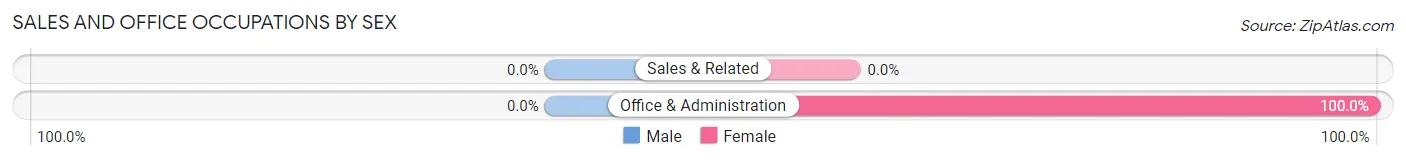
| Occupation | Male | Female |
| Sales & Related | 0 (0.0%) | 0 (0.0%) |
| Office & Administration | 0 (0.0%) | 69 (100.0%) |
| Total (Category) | 0 (0.0%) | 69 (100.0%) |
| Total (Overall) | 158 (41.4%) | 224 (58.6%) |
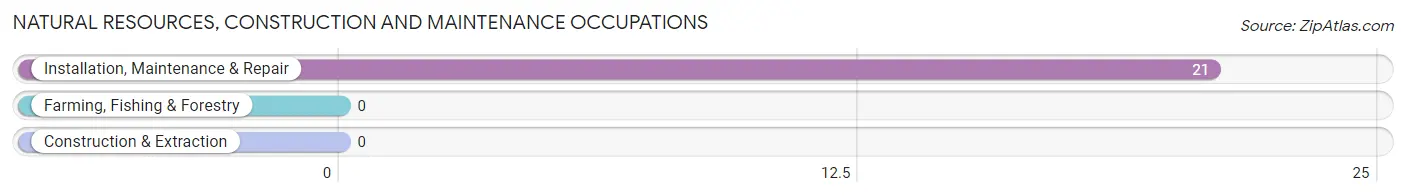
Natural Resources, Construction and Maintenance Occupations
The most common Natural Resources, Construction and Maintenance occupations in Blue Lake are , and Installation, Maintenance & Repair (21 | 5.5%).
Natural Resources, Construction and Maintenance Occupations by Sex
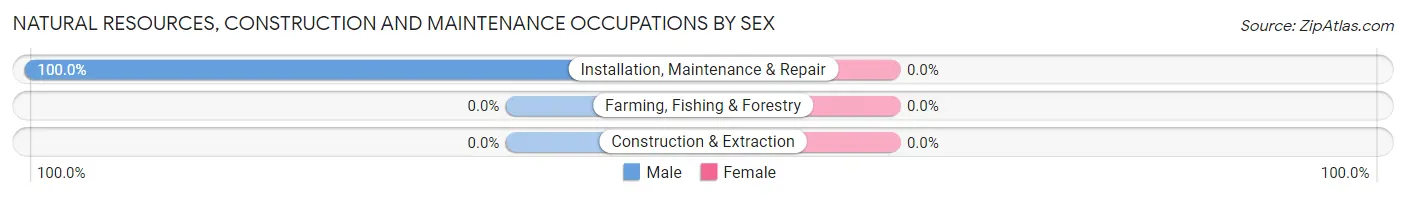
| Occupation | Male | Female |
| Farming, Fishing & Forestry | 0 (0.0%) | 0 (0.0%) |
| Construction & Extraction | 0 (0.0%) | 0 (0.0%) |
| Installation, Maintenance & Repair | 21 (100.0%) | 0 (0.0%) |
| Total (Category) | 21 (100.0%) | 0 (0.0%) |
| Total (Overall) | 158 (41.4%) | 224 (58.6%) |
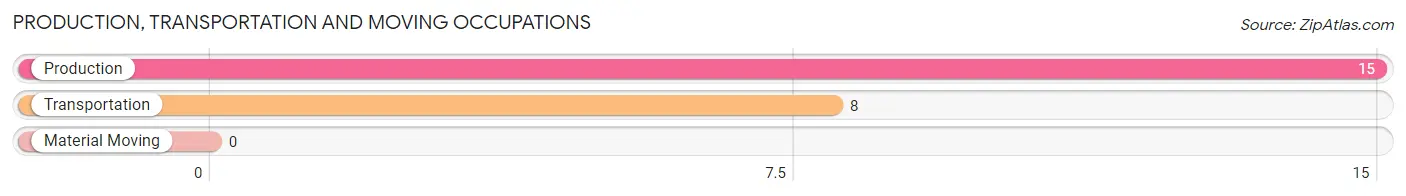
Production, Transportation and Moving Occupations
The most common Production, Transportation and Moving occupations in Blue Lake are Production (15 | 3.9%), and Transportation (8 | 2.1%).
Production, Transportation and Moving Occupations by Sex
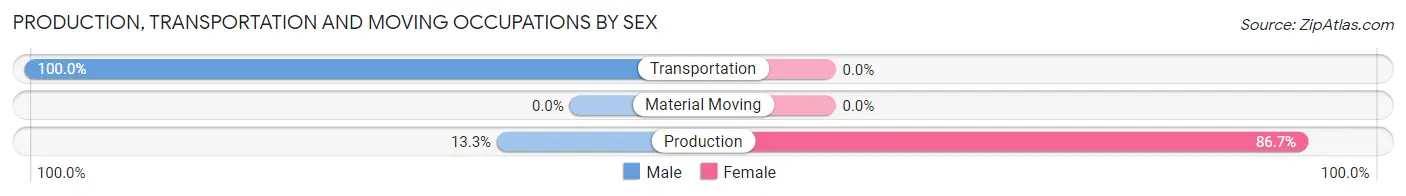
| Occupation | Male | Female |
| Production | 2 (13.3%) | 13 (86.7%) |
| Transportation | 8 (100.0%) | 0 (0.0%) |
| Material Moving | 0 (0.0%) | 0 (0.0%) |
| Total (Category) | 10 (43.5%) | 13 (56.5%) |
| Total (Overall) | 158 (41.4%) | 224 (58.6%) |
Employment Industries by Sex in Blue Lake
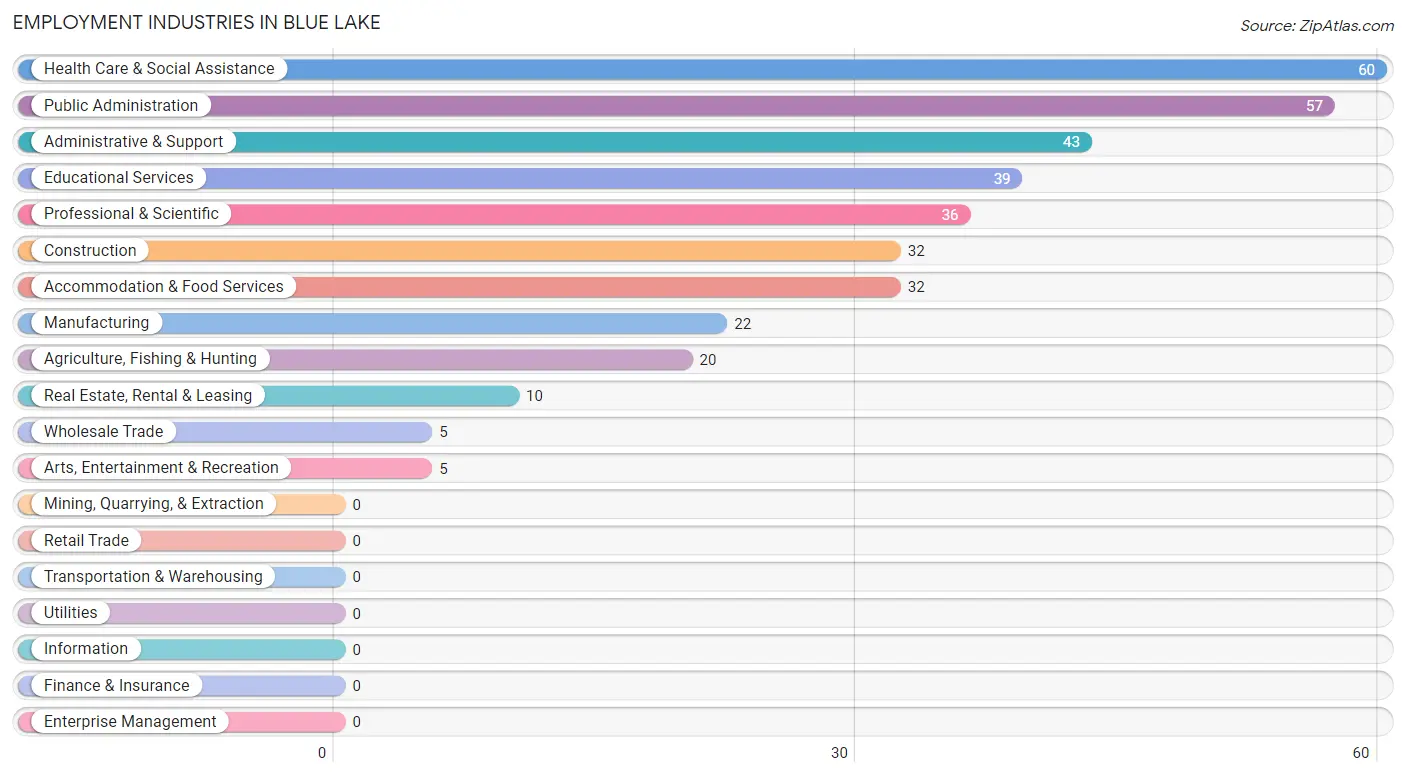
Employment Industries in Blue Lake
The major employment industries in Blue Lake include Health Care & Social Assistance (60 | 15.7%), Public Administration (57 | 14.9%), Administrative & Support (43 | 11.3%), Educational Services (39 | 10.2%), and Professional & Scientific (36 | 9.4%).
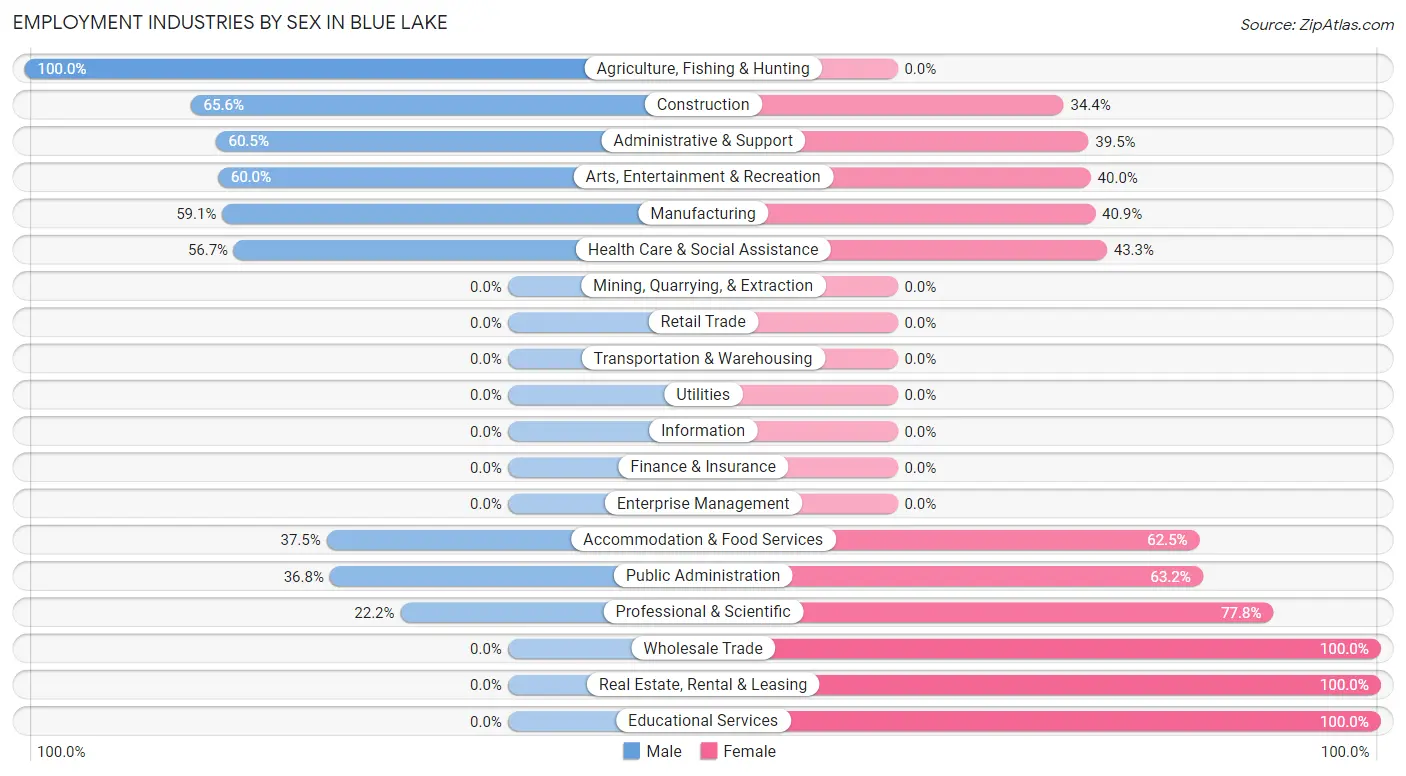
Employment Industries by Sex in Blue Lake
The Blue Lake industries that see more men than women are Agriculture, Fishing & Hunting (100.0%), Construction (65.6%), and Administrative & Support (60.5%), whereas the industries that tend to have a higher number of women are Wholesale Trade (100.0%), Real Estate, Rental & Leasing (100.0%), and Educational Services (100.0%).
| Industry | Male | Female |
| Agriculture, Fishing & Hunting | 20 (100.0%) | 0 (0.0%) |
| Mining, Quarrying, & Extraction | 0 (0.0%) | 0 (0.0%) |
| Construction | 21 (65.6%) | 11 (34.4%) |
| Manufacturing | 13 (59.1%) | 9 (40.9%) |
| Wholesale Trade | 0 (0.0%) | 5 (100.0%) |
| Retail Trade | 0 (0.0%) | 0 (0.0%) |
| Transportation & Warehousing | 0 (0.0%) | 0 (0.0%) |
| Utilities | 0 (0.0%) | 0 (0.0%) |
| Information | 0 (0.0%) | 0 (0.0%) |
| Finance & Insurance | 0 (0.0%) | 0 (0.0%) |
| Real Estate, Rental & Leasing | 0 (0.0%) | 10 (100.0%) |
| Professional & Scientific | 8 (22.2%) | 28 (77.8%) |
| Enterprise Management | 0 (0.0%) | 0 (0.0%) |
| Administrative & Support | 26 (60.5%) | 17 (39.5%) |
| Educational Services | 0 (0.0%) | 39 (100.0%) |
| Health Care & Social Assistance | 34 (56.7%) | 26 (43.3%) |
| Arts, Entertainment & Recreation | 3 (60.0%) | 2 (40.0%) |
| Accommodation & Food Services | 12 (37.5%) | 20 (62.5%) |
| Public Administration | 21 (36.8%) | 36 (63.2%) |
| Total | 158 (41.4%) | 224 (58.6%) |
Education in Blue Lake
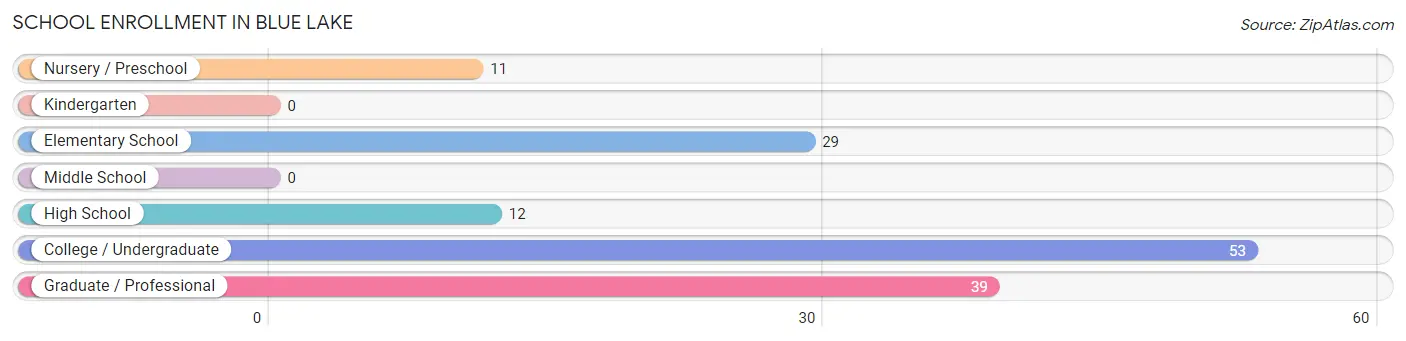
School Enrollment in Blue Lake
The most common levels of schooling among the 144 students in Blue Lake are college / undergraduate (53 | 36.8%), graduate / professional (39 | 27.1%), and elementary school (29 | 20.1%).
| School Level | # Students | % Students |
| Nursery / Preschool | 11 | 7.6% |
| Kindergarten | 0 | 0.0% |
| Elementary School | 29 | 20.1% |
| Middle School | 0 | 0.0% |
| High School | 12 | 8.3% |
| College / Undergraduate | 53 | 36.8% |
| Graduate / Professional | 39 | 27.1% |
| Total | 144 | 100.0% |
School Enrollment by Age by Funding Source in Blue Lake
Out of a total of 144 students who are enrolled in schools in Blue Lake, 32 (22.2%) attend a private institution, while the remaining 112 (77.8%) are enrolled in public schools. The age group of 3 to 4 year olds has the highest likelihood of being enrolled in private schools, with 11 (100.0% in the age bracket) enrolled. Conversely, the age group of 5 to 9 year old has the lowest likelihood of being enrolled in a private school, with 29 (100.0% in the age bracket) attending a public institution.
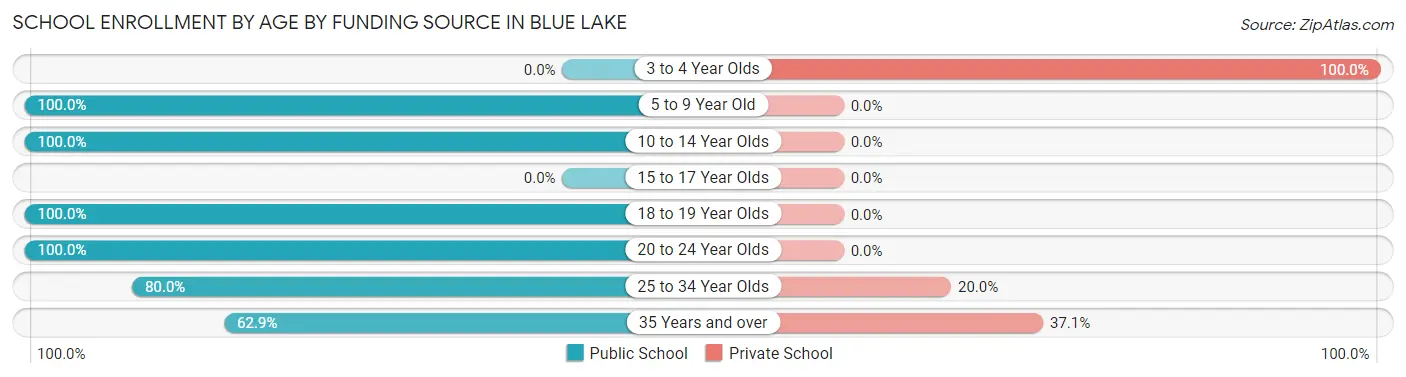
| Age Bracket | Public School | Private School |
| 3 to 4 Year Olds | 0 (0.0%) | 11 (100.0%) |
| 5 to 9 Year Old | 29 (100.0%) | 0 (0.0%) |
| 10 to 14 Year Olds | 12 (100.0%) | 0 (0.0%) |
| 15 to 17 Year Olds | 0 (0.0%) | 0 (0.0%) |
| 18 to 19 Year Olds | 1 (100.0%) | 0 (0.0%) |
| 20 to 24 Year Olds | 16 (100.0%) | 0 (0.0%) |
| 25 to 34 Year Olds | 32 (80.0%) | 8 (20.0%) |
| 35 Years and over | 22 (62.9%) | 13 (37.1%) |
| Total | 112 (77.8%) | 32 (22.2%) |
Educational Attainment by Field of Study in Blue Lake
Psychology (68 | 19.5%), business (68 | 19.5%), bio, nature & agricultural (59 | 16.9%), liberal arts & history (38 | 10.9%), and social sciences (31 | 8.9%) are the most common fields of study among 349 individuals in Blue Lake who have obtained a bachelor's degree or higher.
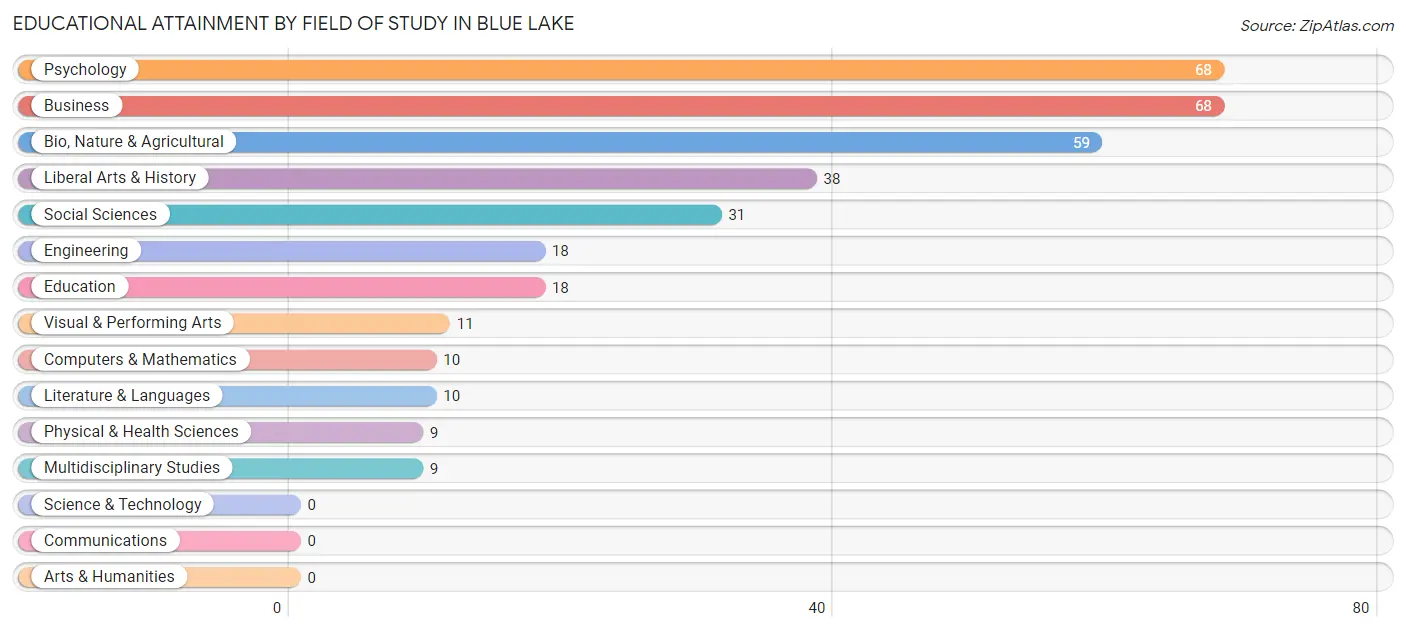
| Field of Study | # Graduates | % Graduates |
| Computers & Mathematics | 10 | 2.9% |
| Bio, Nature & Agricultural | 59 | 16.9% |
| Physical & Health Sciences | 9 | 2.6% |
| Psychology | 68 | 19.5% |
| Social Sciences | 31 | 8.9% |
| Engineering | 18 | 5.2% |
| Multidisciplinary Studies | 9 | 2.6% |
| Science & Technology | 0 | 0.0% |
| Business | 68 | 19.5% |
| Education | 18 | 5.2% |
| Literature & Languages | 10 | 2.9% |
| Liberal Arts & History | 38 | 10.9% |
| Visual & Performing Arts | 11 | 3.2% |
| Communications | 0 | 0.0% |
| Arts & Humanities | 0 | 0.0% |
| Total | 349 | 100.0% |
Transportation & Commute in Blue Lake
Vehicle Availability by Sex in Blue Lake
The most prevalent vehicle ownership categories in Blue Lake are males with 2 vehicles (62, accounting for 39.5%) and females with 2 vehicles (90, making up 27.7%).
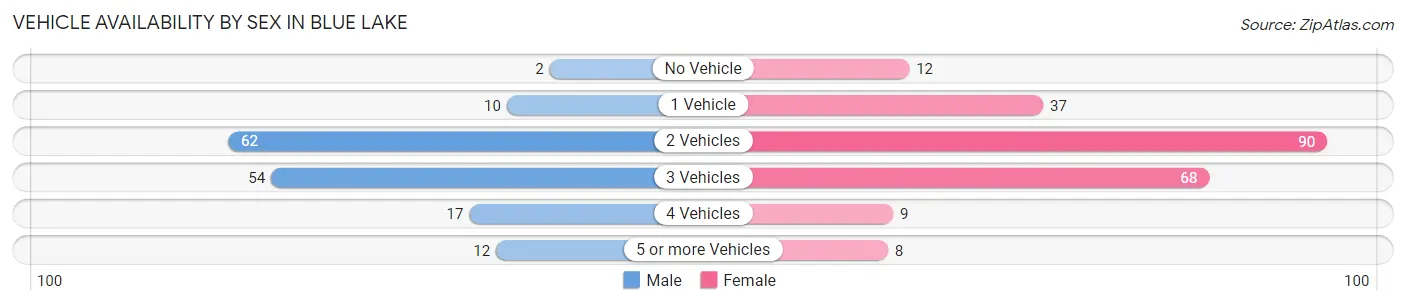
| Vehicles Available | Male | Female |
| No Vehicle | 2 (1.3%) | 12 (5.4%) |
| 1 Vehicle | 10 (6.4%) | 37 (16.5%) |
| 2 Vehicles | 62 (39.5%) | 90 (40.2%) |
| 3 Vehicles | 54 (34.4%) | 68 (30.4%) |
| 4 Vehicles | 17 (10.8%) | 9 (4.0%) |
| 5 or more Vehicles | 12 (7.6%) | 8 (3.6%) |
| Total | 157 (100.0%) | 224 (100.0%) |
Commute Time in Blue Lake
The most frequently occuring commute durations in Blue Lake are 15 to 19 minutes (54 commuters, 19.2%), 5 to 9 minutes (42 commuters, 14.9%), and less than 5 minutes (35 commuters, 12.5%).
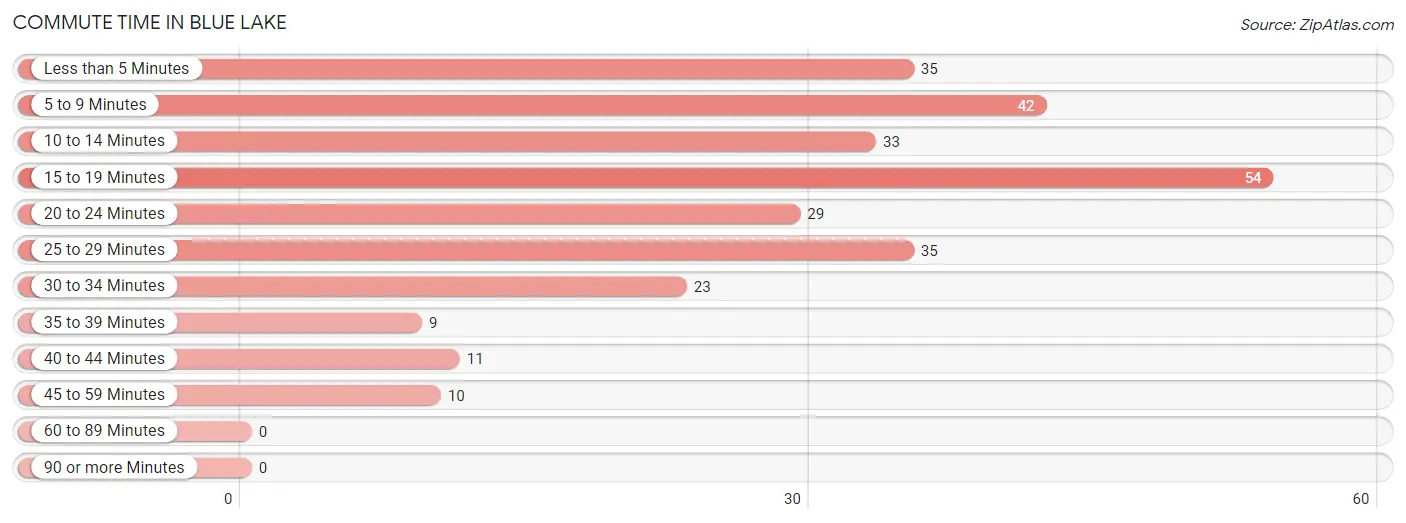
| Commute Time | # Commuters | % Commuters |
| Less than 5 Minutes | 35 | 12.5% |
| 5 to 9 Minutes | 42 | 14.9% |
| 10 to 14 Minutes | 33 | 11.7% |
| 15 to 19 Minutes | 54 | 19.2% |
| 20 to 24 Minutes | 29 | 10.3% |
| 25 to 29 Minutes | 35 | 12.5% |
| 30 to 34 Minutes | 23 | 8.2% |
| 35 to 39 Minutes | 9 | 3.2% |
| 40 to 44 Minutes | 11 | 3.9% |
| 45 to 59 Minutes | 10 | 3.6% |
| 60 to 89 Minutes | 0 | 0.0% |
| 90 or more Minutes | 0 | 0.0% |
Commute Time by Sex in Blue Lake
The most common commute times in Blue Lake are 15 to 19 minutes (30 commuters, 25.2%) for males and 5 to 9 minutes (30 commuters, 18.5%) for females.
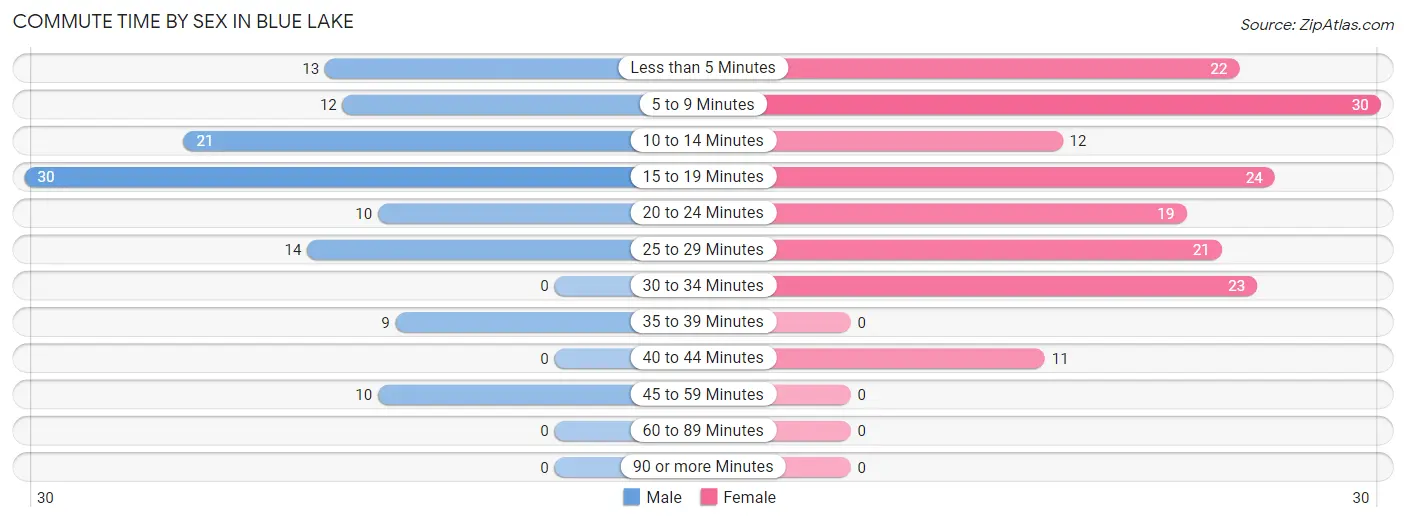
| Commute Time | Male | Female |
| Less than 5 Minutes | 13 (10.9%) | 22 (13.6%) |
| 5 to 9 Minutes | 12 (10.1%) | 30 (18.5%) |
| 10 to 14 Minutes | 21 (17.6%) | 12 (7.4%) |
| 15 to 19 Minutes | 30 (25.2%) | 24 (14.8%) |
| 20 to 24 Minutes | 10 (8.4%) | 19 (11.7%) |
| 25 to 29 Minutes | 14 (11.8%) | 21 (13.0%) |
| 30 to 34 Minutes | 0 (0.0%) | 23 (14.2%) |
| 35 to 39 Minutes | 9 (7.6%) | 0 (0.0%) |
| 40 to 44 Minutes | 0 (0.0%) | 11 (6.8%) |
| 45 to 59 Minutes | 10 (8.4%) | 0 (0.0%) |
| 60 to 89 Minutes | 0 (0.0%) | 0 (0.0%) |
| 90 or more Minutes | 0 (0.0%) | 0 (0.0%) |
Time of Departure to Work by Sex in Blue Lake
The most frequent times of departure to work in Blue Lake are 7:00 AM to 7:29 AM (42, 35.3%) for males and 9:00 AM to 9:59 AM (47, 29.0%) for females.
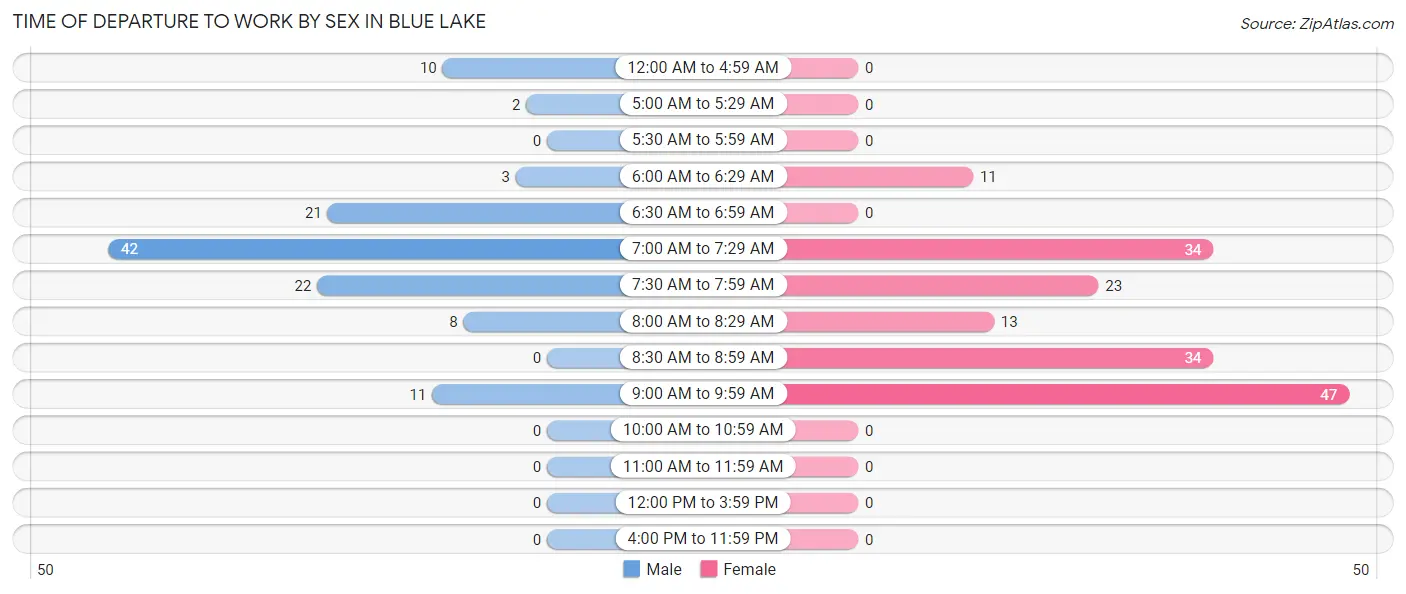
| Time of Departure | Male | Female |
| 12:00 AM to 4:59 AM | 10 (8.4%) | 0 (0.0%) |
| 5:00 AM to 5:29 AM | 2 (1.7%) | 0 (0.0%) |
| 5:30 AM to 5:59 AM | 0 (0.0%) | 0 (0.0%) |
| 6:00 AM to 6:29 AM | 3 (2.5%) | 11 (6.8%) |
| 6:30 AM to 6:59 AM | 21 (17.6%) | 0 (0.0%) |
| 7:00 AM to 7:29 AM | 42 (35.3%) | 34 (21.0%) |
| 7:30 AM to 7:59 AM | 22 (18.5%) | 23 (14.2%) |
| 8:00 AM to 8:29 AM | 8 (6.7%) | 13 (8.0%) |
| 8:30 AM to 8:59 AM | 0 (0.0%) | 34 (21.0%) |
| 9:00 AM to 9:59 AM | 11 (9.2%) | 47 (29.0%) |
| 10:00 AM to 10:59 AM | 0 (0.0%) | 0 (0.0%) |
| 11:00 AM to 11:59 AM | 0 (0.0%) | 0 (0.0%) |
| 12:00 PM to 3:59 PM | 0 (0.0%) | 0 (0.0%) |
| 4:00 PM to 11:59 PM | 0 (0.0%) | 0 (0.0%) |
| Total | 119 (100.0%) | 162 (100.0%) |
Housing Occupancy in Blue Lake
Occupancy by Ownership in Blue Lake
Of the total 449 dwellings in Blue Lake, owner-occupied units account for 246 (54.8%), while renter-occupied units make up 203 (45.2%).
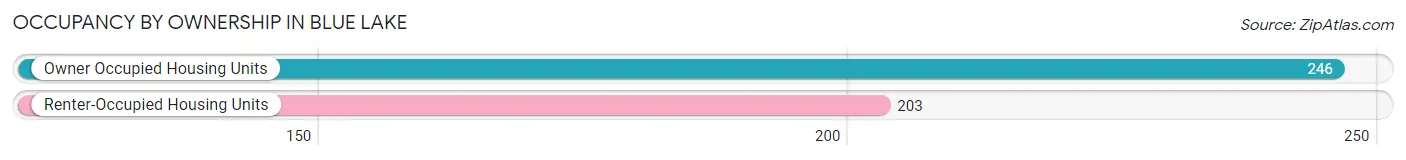
| Occupancy | # Housing Units | % Housing Units |
| Owner Occupied Housing Units | 246 | 54.8% |
| Renter-Occupied Housing Units | 203 | 45.2% |
| Total Occupied Housing Units | 449 | 100.0% |
Occupancy by Household Size in Blue Lake
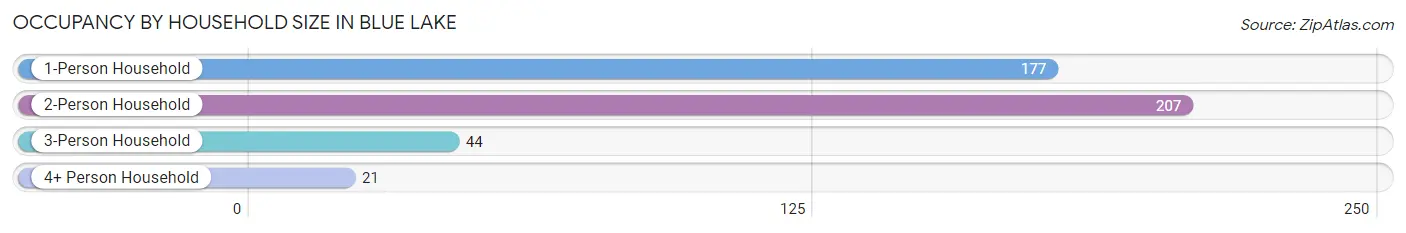
| Household Size | # Housing Units | % Housing Units |
| 1-Person Household | 177 | 39.4% |
| 2-Person Household | 207 | 46.1% |
| 3-Person Household | 44 | 9.8% |
| 4+ Person Household | 21 | 4.7% |
| Total Housing Units | 449 | 100.0% |
Occupancy by Ownership by Household Size in Blue Lake
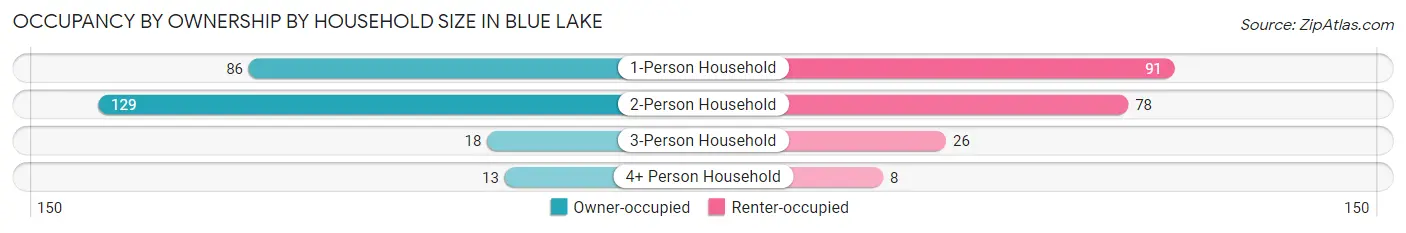
| Household Size | Owner-occupied | Renter-occupied |
| 1-Person Household | 86 (48.6%) | 91 (51.4%) |
| 2-Person Household | 129 (62.3%) | 78 (37.7%) |
| 3-Person Household | 18 (40.9%) | 26 (59.1%) |
| 4+ Person Household | 13 (61.9%) | 8 (38.1%) |
| Total Housing Units | 246 (54.8%) | 203 (45.2%) |
Occupancy by Educational Attainment in Blue Lake
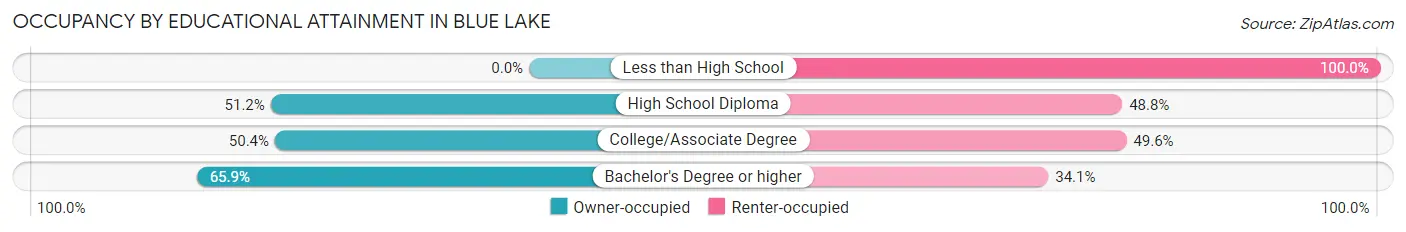
| Household Size | Owner-occupied | Renter-occupied |
| Less than High School | 0 (0.0%) | 26 (100.0%) |
| High School Diploma | 42 (51.2%) | 40 (48.8%) |
| College/Associate Degree | 67 (50.4%) | 66 (49.6%) |
| Bachelor's Degree or higher | 137 (65.9%) | 71 (34.1%) |
Occupancy by Age of Householder in Blue Lake
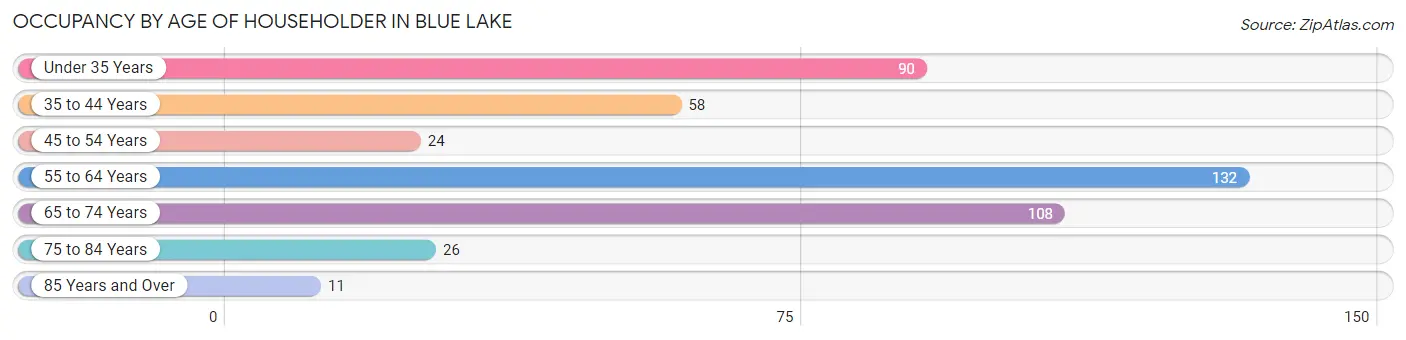
| Age Bracket | # Households | % Households |
| Under 35 Years | 90 | 20.0% |
| 35 to 44 Years | 58 | 12.9% |
| 45 to 54 Years | 24 | 5.3% |
| 55 to 64 Years | 132 | 29.4% |
| 65 to 74 Years | 108 | 24.0% |
| 75 to 84 Years | 26 | 5.8% |
| 85 Years and Over | 11 | 2.5% |
| Total | 449 | 100.0% |
Housing Finances in Blue Lake
Median Income by Occupancy in Blue Lake
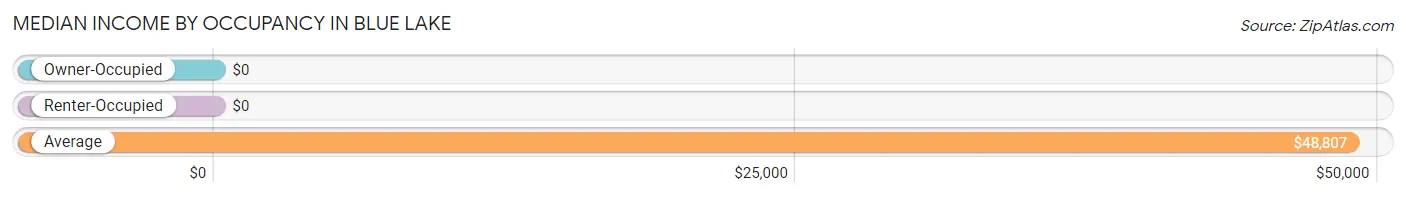
| Occupancy Type | # Households | Median Income |
| Owner-Occupied | 246 (54.8%) | $0 |
| Renter-Occupied | 203 (45.2%) | $0 |
| Average | 449 (100.0%) | $48,807 |
Occupancy by Householder Income Bracket in Blue Lake
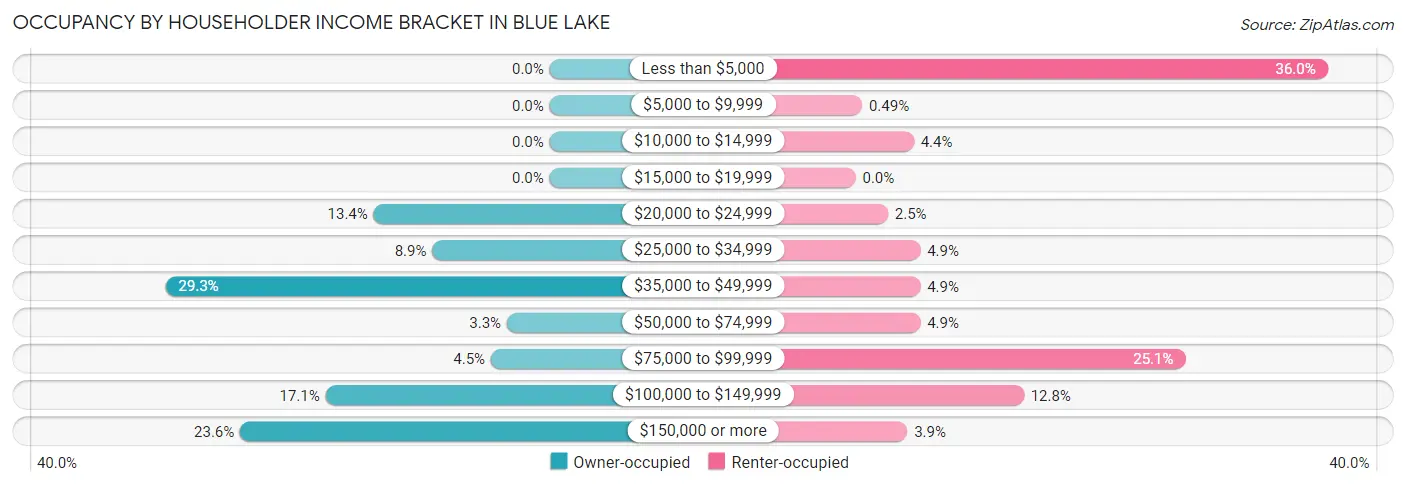
| Income Bracket | Owner-occupied | Renter-occupied |
| Less than $5,000 | 0 (0.0%) | 73 (36.0%) |
| $5,000 to $9,999 | 0 (0.0%) | 1 (0.5%) |
| $10,000 to $14,999 | 0 (0.0%) | 9 (4.4%) |
| $15,000 to $19,999 | 0 (0.0%) | 0 (0.0%) |
| $20,000 to $24,999 | 33 (13.4%) | 5 (2.5%) |
| $25,000 to $34,999 | 22 (8.9%) | 10 (4.9%) |
| $35,000 to $49,999 | 72 (29.3%) | 10 (4.9%) |
| $50,000 to $74,999 | 8 (3.3%) | 10 (4.9%) |
| $75,000 to $99,999 | 11 (4.5%) | 51 (25.1%) |
| $100,000 to $149,999 | 42 (17.1%) | 26 (12.8%) |
| $150,000 or more | 58 (23.6%) | 8 (3.9%) |
| Total | 246 (100.0%) | 203 (100.0%) |
Monthly Housing Cost Tiers in Blue Lake
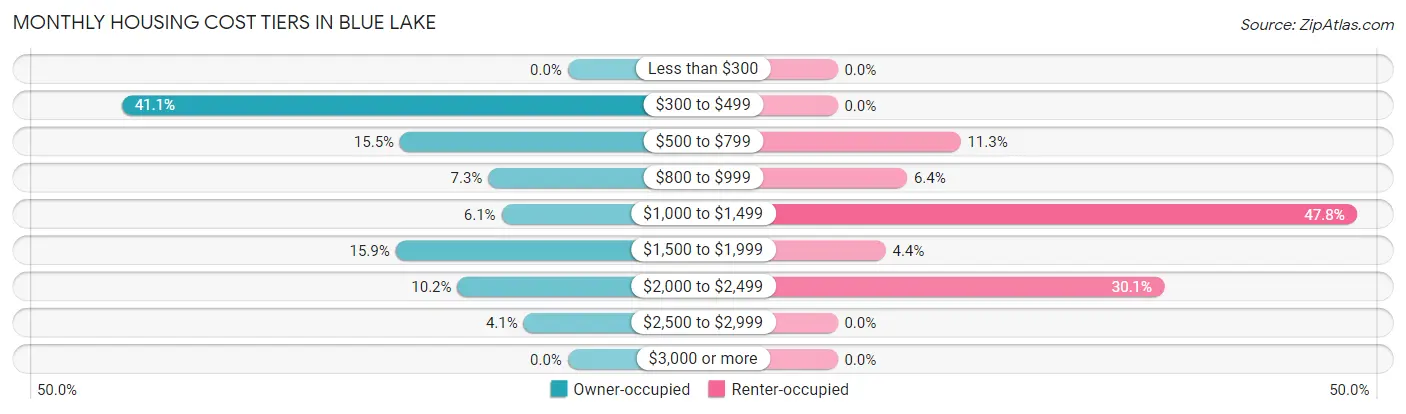
| Monthly Cost | Owner-occupied | Renter-occupied |
| Less than $300 | 0 (0.0%) | 0 (0.0%) |
| $300 to $499 | 101 (41.1%) | 0 (0.0%) |
| $500 to $799 | 38 (15.4%) | 23 (11.3%) |
| $800 to $999 | 18 (7.3%) | 13 (6.4%) |
| $1,000 to $1,499 | 15 (6.1%) | 97 (47.8%) |
| $1,500 to $1,999 | 39 (15.9%) | 9 (4.4%) |
| $2,000 to $2,499 | 25 (10.2%) | 61 (30.0%) |
| $2,500 to $2,999 | 10 (4.1%) | 0 (0.0%) |
| $3,000 or more | 0 (0.0%) | 0 (0.0%) |
| Total | 246 (100.0%) | 203 (100.0%) |
Physical Housing Characteristics in Blue Lake
Housing Structures in Blue Lake
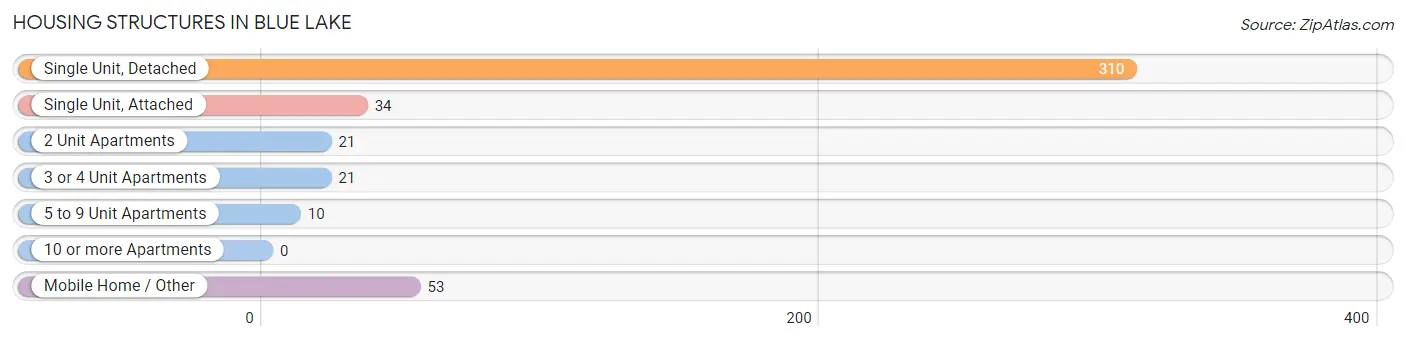
| Structure Type | # Housing Units | % Housing Units |
| Single Unit, Detached | 310 | 69.0% |
| Single Unit, Attached | 34 | 7.6% |
| 2 Unit Apartments | 21 | 4.7% |
| 3 or 4 Unit Apartments | 21 | 4.7% |
| 5 to 9 Unit Apartments | 10 | 2.2% |
| 10 or more Apartments | 0 | 0.0% |
| Mobile Home / Other | 53 | 11.8% |
| Total | 449 | 100.0% |
Housing Structures by Occupancy in Blue Lake
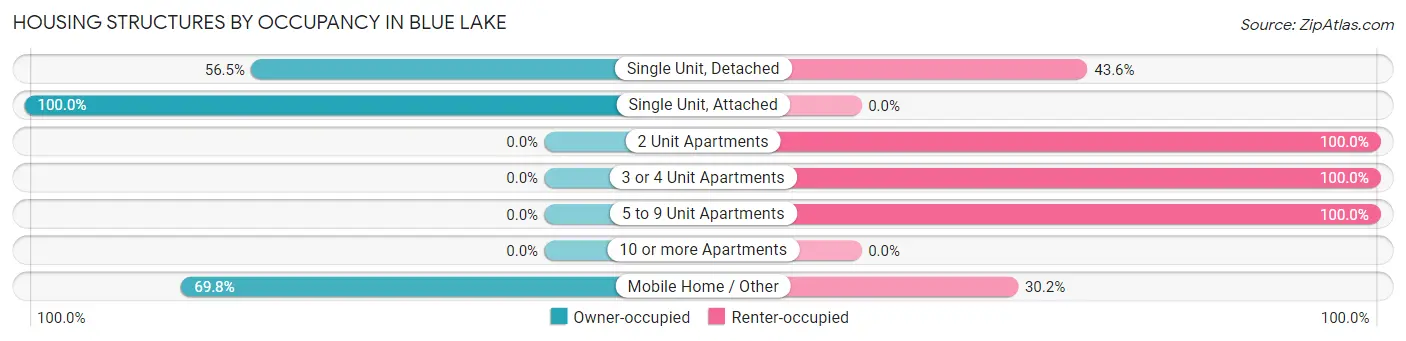
| Structure Type | Owner-occupied | Renter-occupied |
| Single Unit, Detached | 175 (56.5%) | 135 (43.5%) |
| Single Unit, Attached | 34 (100.0%) | 0 (0.0%) |
| 2 Unit Apartments | 0 (0.0%) | 21 (100.0%) |
| 3 or 4 Unit Apartments | 0 (0.0%) | 21 (100.0%) |
| 5 to 9 Unit Apartments | 0 (0.0%) | 10 (100.0%) |
| 10 or more Apartments | 0 (0.0%) | 0 (0.0%) |
| Mobile Home / Other | 37 (69.8%) | 16 (30.2%) |
| Total | 246 (54.8%) | 203 (45.2%) |
Housing Structures by Number of Rooms in Blue Lake
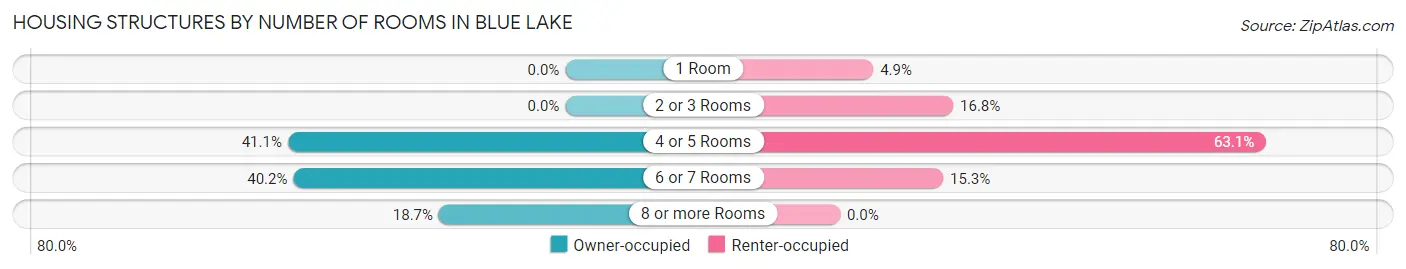
| Number of Rooms | Owner-occupied | Renter-occupied |
| 1 Room | 0 (0.0%) | 10 (4.9%) |
| 2 or 3 Rooms | 0 (0.0%) | 34 (16.8%) |
| 4 or 5 Rooms | 101 (41.1%) | 128 (63.0%) |
| 6 or 7 Rooms | 99 (40.2%) | 31 (15.3%) |
| 8 or more Rooms | 46 (18.7%) | 0 (0.0%) |
| Total | 246 (100.0%) | 203 (100.0%) |
Housing Structure by Heating Type in Blue Lake
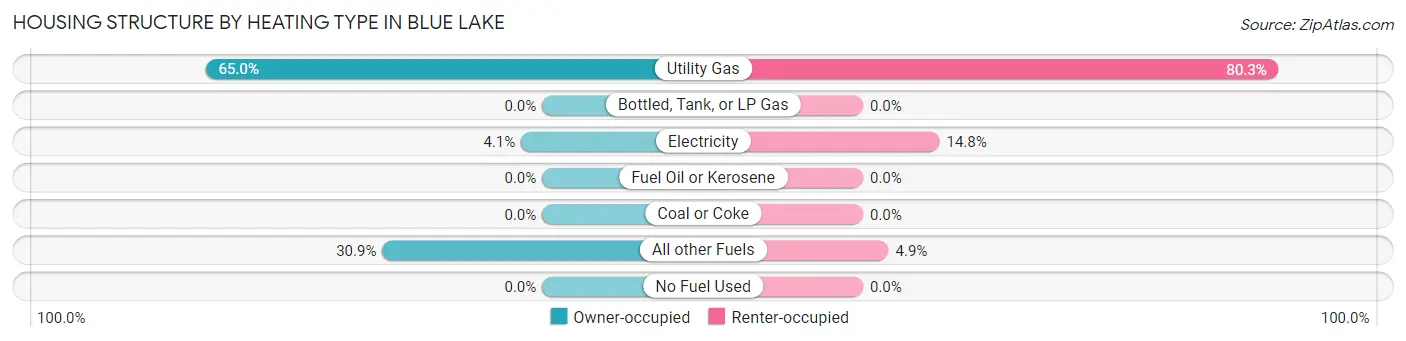
| Heating Type | Owner-occupied | Renter-occupied |
| Utility Gas | 160 (65.0%) | 163 (80.3%) |
| Bottled, Tank, or LP Gas | 0 (0.0%) | 0 (0.0%) |
| Electricity | 10 (4.1%) | 30 (14.8%) |
| Fuel Oil or Kerosene | 0 (0.0%) | 0 (0.0%) |
| Coal or Coke | 0 (0.0%) | 0 (0.0%) |
| All other Fuels | 76 (30.9%) | 10 (4.9%) |
| No Fuel Used | 0 (0.0%) | 0 (0.0%) |
| Total | 246 (100.0%) | 203 (100.0%) |
Household Vehicle Usage in Blue Lake
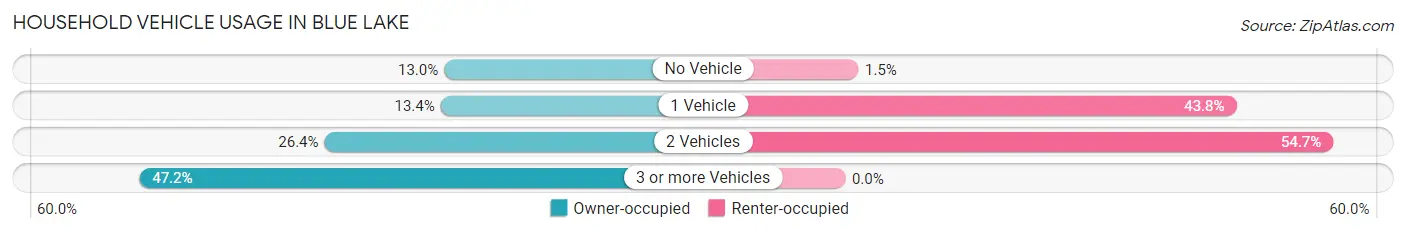
| Vehicles per Household | Owner-occupied | Renter-occupied |
| No Vehicle | 32 (13.0%) | 3 (1.5%) |
| 1 Vehicle | 33 (13.4%) | 89 (43.8%) |
| 2 Vehicles | 65 (26.4%) | 111 (54.7%) |
| 3 or more Vehicles | 116 (47.1%) | 0 (0.0%) |
| Total | 246 (100.0%) | 203 (100.0%) |
Real Estate & Mortgages in Blue Lake
Real Estate and Mortgage Overview in Blue Lake
| Characteristic | Without Mortgage | With Mortgage |
| Housing Units | 139 | 107 |
| Median Property Value | $366,400 | $435,500 |
| Median Household Income | $44,716 | $56 |
| Monthly Housing Costs | $449 | $0 |
| Real Estate Taxes | $1,408 | $10 |
Property Value by Mortgage Status in Blue Lake
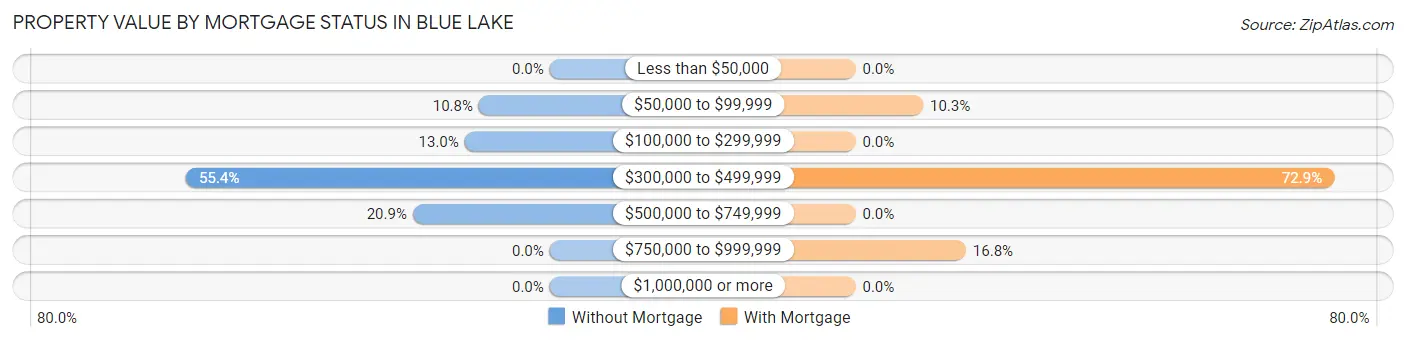
| Property Value | Without Mortgage | With Mortgage |
| Less than $50,000 | 0 (0.0%) | 0 (0.0%) |
| $50,000 to $99,999 | 15 (10.8%) | 11 (10.3%) |
| $100,000 to $299,999 | 18 (13.0%) | 0 (0.0%) |
| $300,000 to $499,999 | 77 (55.4%) | 78 (72.9%) |
| $500,000 to $749,999 | 29 (20.9%) | 0 (0.0%) |
| $750,000 to $999,999 | 0 (0.0%) | 18 (16.8%) |
| $1,000,000 or more | 0 (0.0%) | 0 (0.0%) |
| Total | 139 (100.0%) | 107 (100.0%) |
Household Income by Mortgage Status in Blue Lake
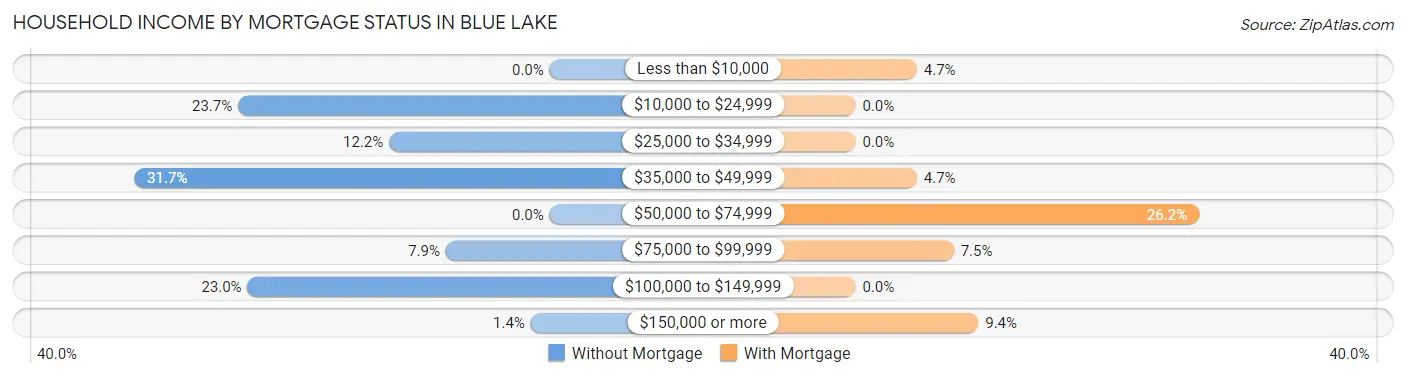
| Household Income | Without Mortgage | With Mortgage |
| Less than $10,000 | 0 (0.0%) | 5 (4.7%) |
| $10,000 to $24,999 | 33 (23.7%) | 0 (0.0%) |
| $25,000 to $34,999 | 17 (12.2%) | 0 (0.0%) |
| $35,000 to $49,999 | 44 (31.7%) | 5 (4.7%) |
| $50,000 to $74,999 | 0 (0.0%) | 28 (26.2%) |
| $75,000 to $99,999 | 11 (7.9%) | 8 (7.5%) |
| $100,000 to $149,999 | 32 (23.0%) | 0 (0.0%) |
| $150,000 or more | 2 (1.4%) | 10 (9.3%) |
| Total | 139 (100.0%) | 107 (100.0%) |
Property Value to Household Income Ratio in Blue Lake
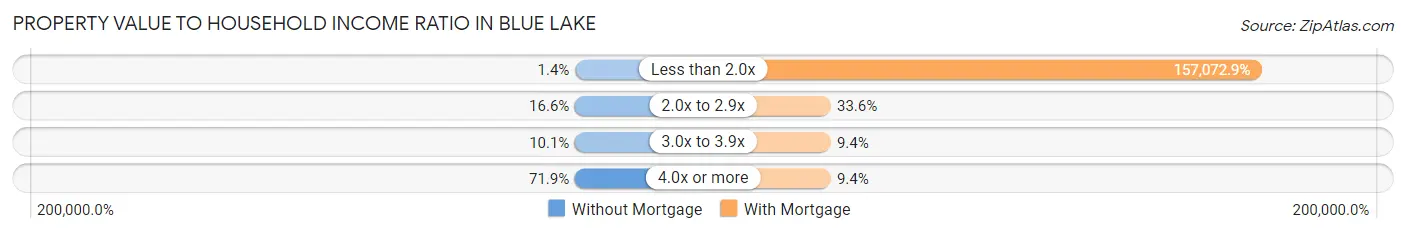
| Value-to-Income Ratio | Without Mortgage | With Mortgage |
| Less than 2.0x | 2 (1.4%) | 168,068 (157,072.9%) |
| 2.0x to 2.9x | 23 (16.6%) | 36 (33.6%) |
| 3.0x to 3.9x | 14 (10.1%) | 10 (9.3%) |
| 4.0x or more | 100 (71.9%) | 10 (9.3%) |
| Total | 139 (100.0%) | 107 (100.0%) |
Real Estate Taxes by Mortgage Status in Blue Lake
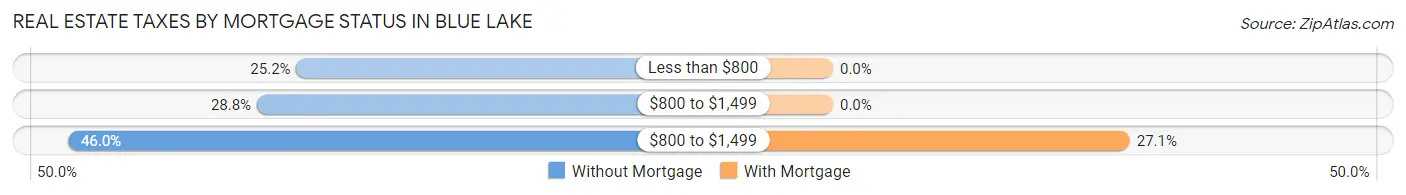
| Property Taxes | Without Mortgage | With Mortgage |
| Less than $800 | 35 (25.2%) | 0 (0.0%) |
| $800 to $1,499 | 40 (28.8%) | 0 (0.0%) |
| $800 to $1,499 | 64 (46.0%) | 29 (27.1%) |
| Total | 139 (100.0%) | 107 (100.0%) |
Health & Disability in Blue Lake
Health Insurance Coverage by Age in Blue Lake
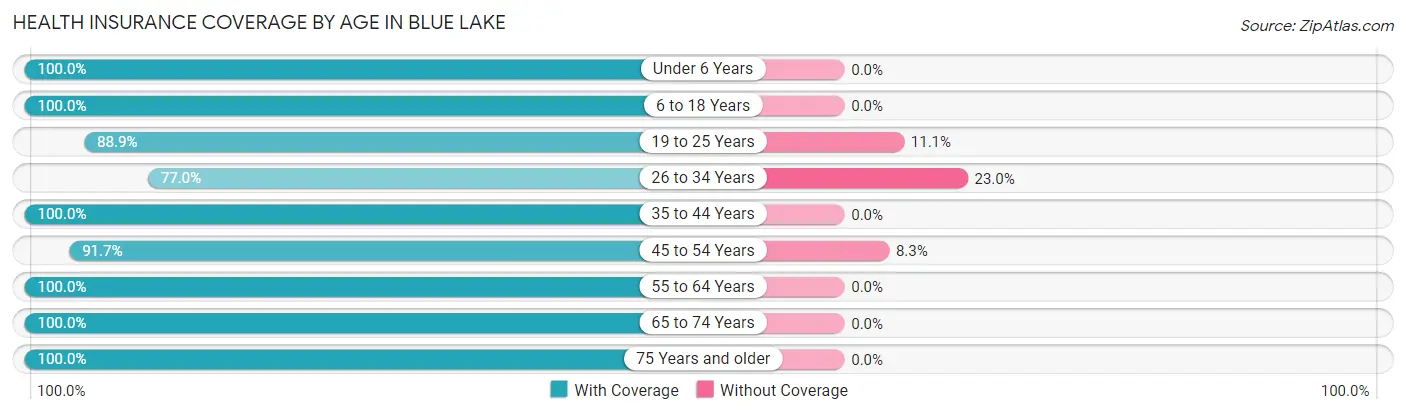
| Age Bracket | With Coverage | Without Coverage |
| Under 6 Years | 62 (100.0%) | 0 (0.0%) |
| 6 to 18 Years | 42 (100.0%) | 0 (0.0%) |
| 19 to 25 Years | 16 (88.9%) | 2 (11.1%) |
| 26 to 34 Years | 124 (77.0%) | 37 (23.0%) |
| 35 to 44 Years | 80 (100.0%) | 0 (0.0%) |
| 45 to 54 Years | 33 (91.7%) | 3 (8.3%) |
| 55 to 64 Years | 222 (100.0%) | 0 (0.0%) |
| 65 to 74 Years | 183 (100.0%) | 0 (0.0%) |
| 75 Years and older | 37 (100.0%) | 0 (0.0%) |
| Total | 799 (95.0%) | 42 (5.0%) |
Health Insurance Coverage by Citizenship Status in Blue Lake
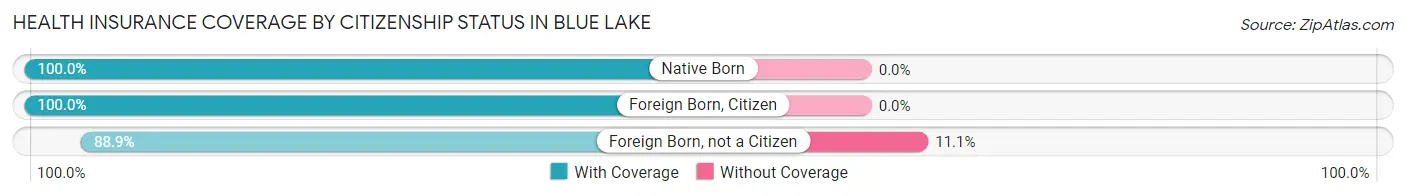
| Citizenship Status | With Coverage | Without Coverage |
| Native Born | 62 (100.0%) | 0 (0.0%) |
| Foreign Born, Citizen | 42 (100.0%) | 0 (0.0%) |
| Foreign Born, not a Citizen | 16 (88.9%) | 2 (11.1%) |
Health Insurance Coverage by Household Income in Blue Lake
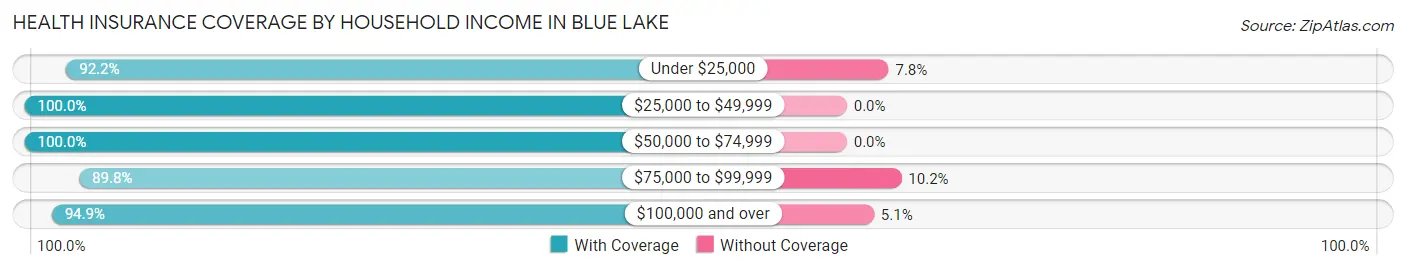
| Household Income | With Coverage | Without Coverage |
| Under $25,000 | 165 (92.2%) | 14 (7.8%) |
| $25,000 to $49,999 | 160 (100.0%) | 0 (0.0%) |
| $50,000 to $74,999 | 40 (100.0%) | 0 (0.0%) |
| $75,000 to $99,999 | 79 (89.8%) | 9 (10.2%) |
| $100,000 and over | 355 (94.9%) | 19 (5.1%) |
Public vs Private Health Insurance Coverage by Age in Blue Lake
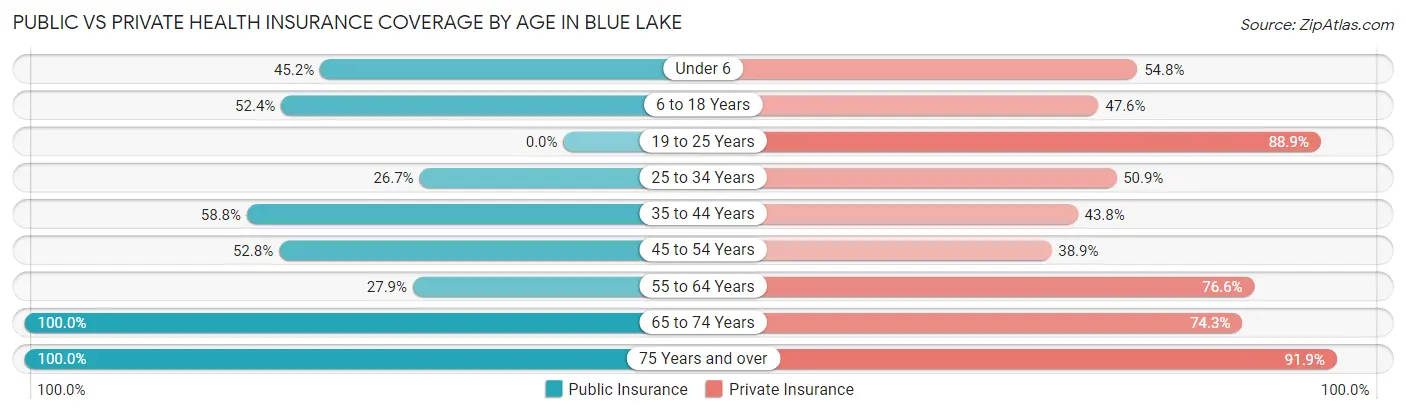
| Age Bracket | Public Insurance | Private Insurance |
| Under 6 | 28 (45.2%) | 34 (54.8%) |
| 6 to 18 Years | 22 (52.4%) | 20 (47.6%) |
| 19 to 25 Years | 0 (0.0%) | 16 (88.9%) |
| 25 to 34 Years | 43 (26.7%) | 82 (50.9%) |
| 35 to 44 Years | 47 (58.8%) | 35 (43.8%) |
| 45 to 54 Years | 19 (52.8%) | 14 (38.9%) |
| 55 to 64 Years | 62 (27.9%) | 170 (76.6%) |
| 65 to 74 Years | 183 (100.0%) | 136 (74.3%) |
| 75 Years and over | 37 (100.0%) | 34 (91.9%) |
| Total | 441 (52.4%) | 541 (64.3%) |
Disability Status by Sex by Age in Blue Lake
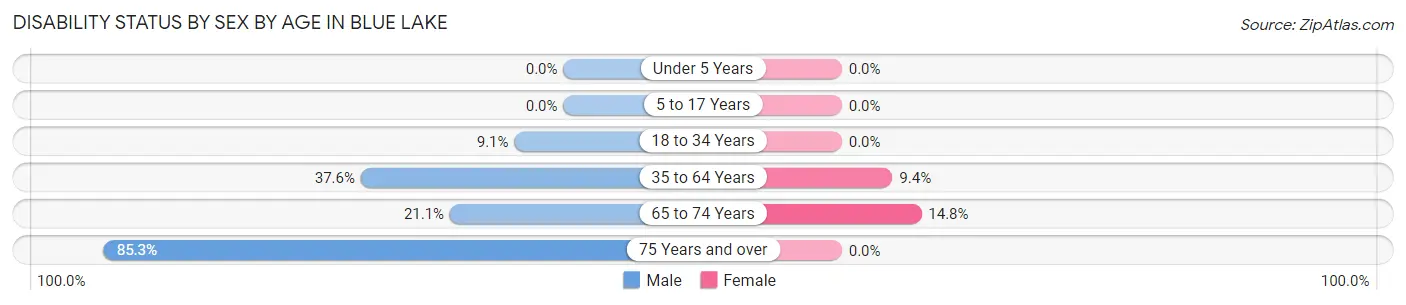
| Age Bracket | Male | Female |
| Under 5 Years | 0 (0.0%) | 0 (0.0%) |
| 5 to 17 Years | 0 (0.0%) | 0 (0.0%) |
| 18 to 34 Years | 11 (9.1%) | 0 (0.0%) |
| 35 to 64 Years | 47 (37.6%) | 20 (9.4%) |
| 65 to 74 Years | 20 (21.0%) | 13 (14.8%) |
| 75 Years and over | 29 (85.3%) | 0 (0.0%) |
Disability Class by Sex by Age in Blue Lake
Disability Class: Hearing Difficulty
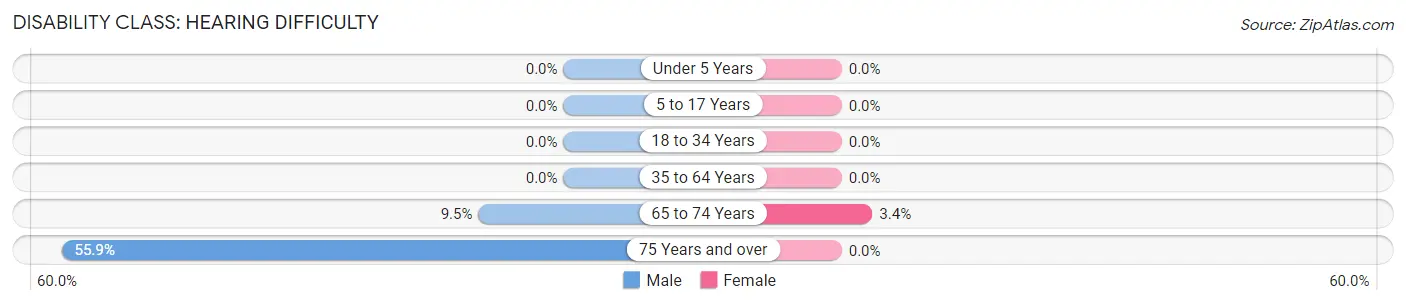
| Age Bracket | Male | Female |
| Under 5 Years | 0 (0.0%) | 0 (0.0%) |
| 5 to 17 Years | 0 (0.0%) | 0 (0.0%) |
| 18 to 34 Years | 0 (0.0%) | 0 (0.0%) |
| 35 to 64 Years | 0 (0.0%) | 0 (0.0%) |
| 65 to 74 Years | 9 (9.5%) | 3 (3.4%) |
| 75 Years and over | 19 (55.9%) | 0 (0.0%) |
Disability Class: Vision Difficulty
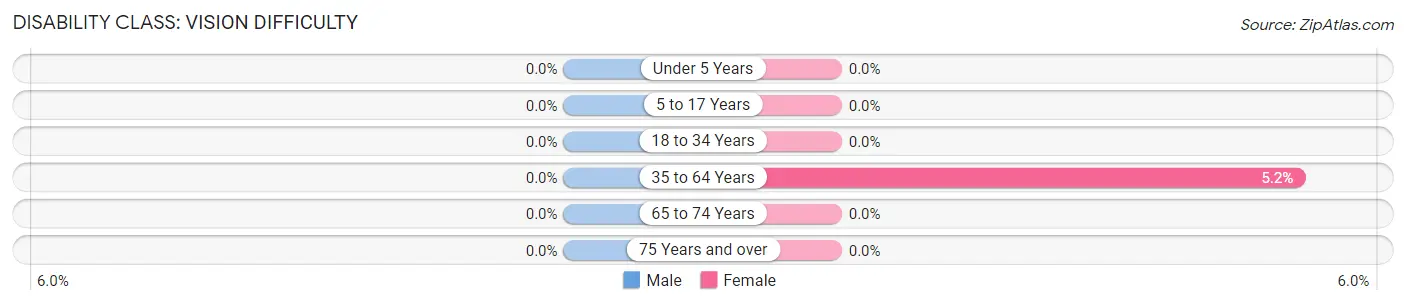
| Age Bracket | Male | Female |
| Under 5 Years | 0 (0.0%) | 0 (0.0%) |
| 5 to 17 Years | 0 (0.0%) | 0 (0.0%) |
| 18 to 34 Years | 0 (0.0%) | 0 (0.0%) |
| 35 to 64 Years | 0 (0.0%) | 11 (5.2%) |
| 65 to 74 Years | 0 (0.0%) | 0 (0.0%) |
| 75 Years and over | 0 (0.0%) | 0 (0.0%) |
Disability Class: Cognitive Difficulty
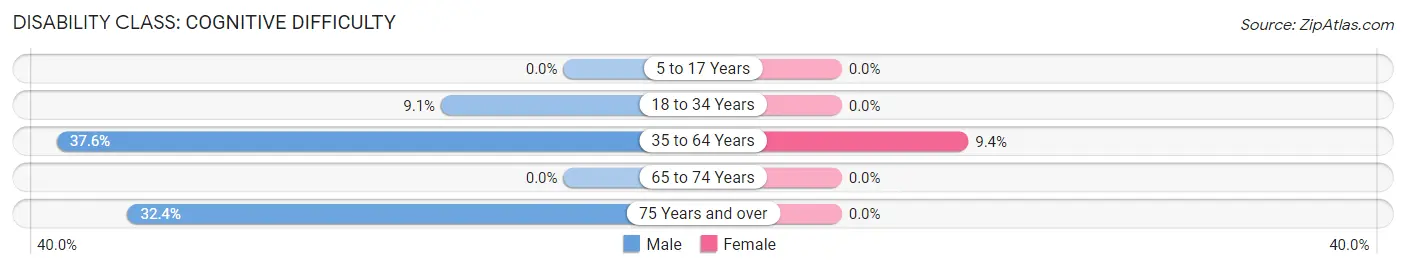
| Age Bracket | Male | Female |
| 5 to 17 Years | 0 (0.0%) | 0 (0.0%) |
| 18 to 34 Years | 11 (9.1%) | 0 (0.0%) |
| 35 to 64 Years | 47 (37.6%) | 20 (9.4%) |
| 65 to 74 Years | 0 (0.0%) | 0 (0.0%) |
| 75 Years and over | 11 (32.4%) | 0 (0.0%) |
Disability Class: Ambulatory Difficulty
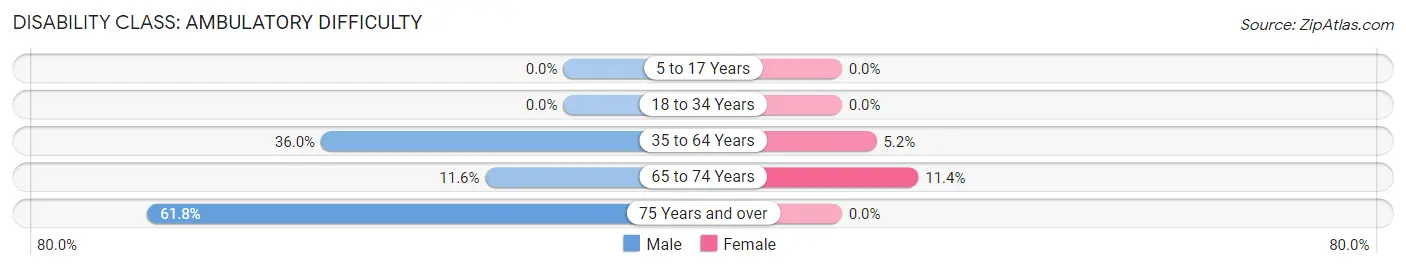
| Age Bracket | Male | Female |
| 5 to 17 Years | 0 (0.0%) | 0 (0.0%) |
| 18 to 34 Years | 0 (0.0%) | 0 (0.0%) |
| 35 to 64 Years | 45 (36.0%) | 11 (5.2%) |
| 65 to 74 Years | 11 (11.6%) | 10 (11.4%) |
| 75 Years and over | 21 (61.8%) | 0 (0.0%) |
Disability Class: Self-Care Difficulty
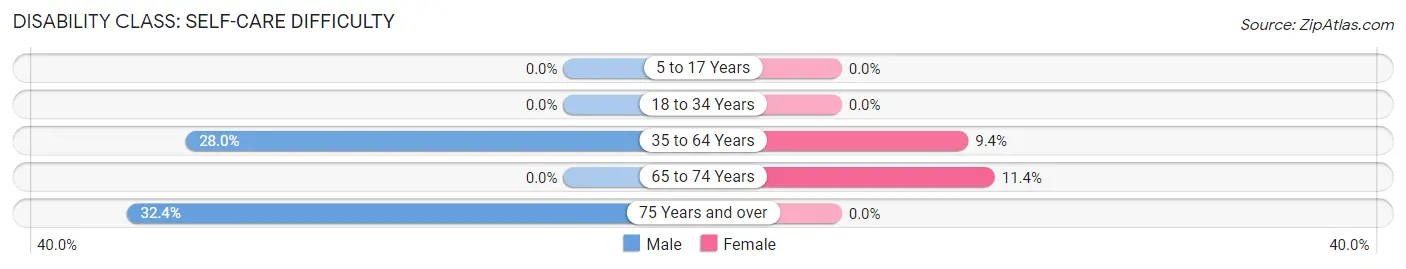
| Age Bracket | Male | Female |
| 5 to 17 Years | 0 (0.0%) | 0 (0.0%) |
| 18 to 34 Years | 0 (0.0%) | 0 (0.0%) |
| 35 to 64 Years | 35 (28.0%) | 20 (9.4%) |
| 65 to 74 Years | 0 (0.0%) | 10 (11.4%) |
| 75 Years and over | 11 (32.4%) | 0 (0.0%) |
Technology Access in Blue Lake
Computing Device Access in Blue Lake
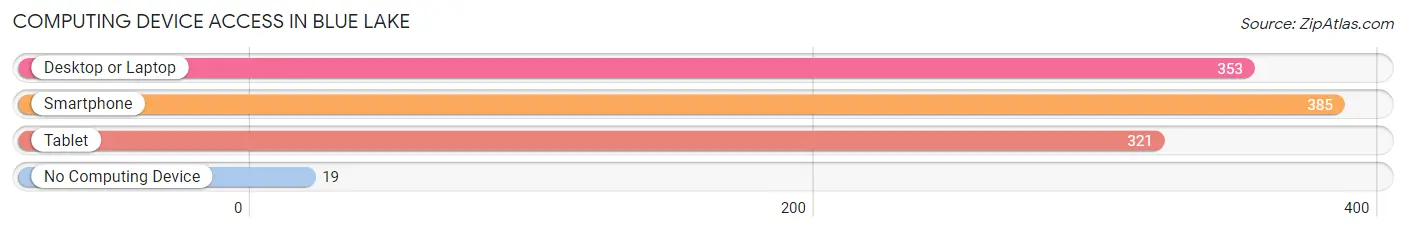
| Device Type | # Households | % Households |
| Desktop or Laptop | 353 | 78.6% |
| Smartphone | 385 | 85.8% |
| Tablet | 321 | 71.5% |
| No Computing Device | 19 | 4.2% |
| Total | 449 | 100.0% |
Internet Access in Blue Lake
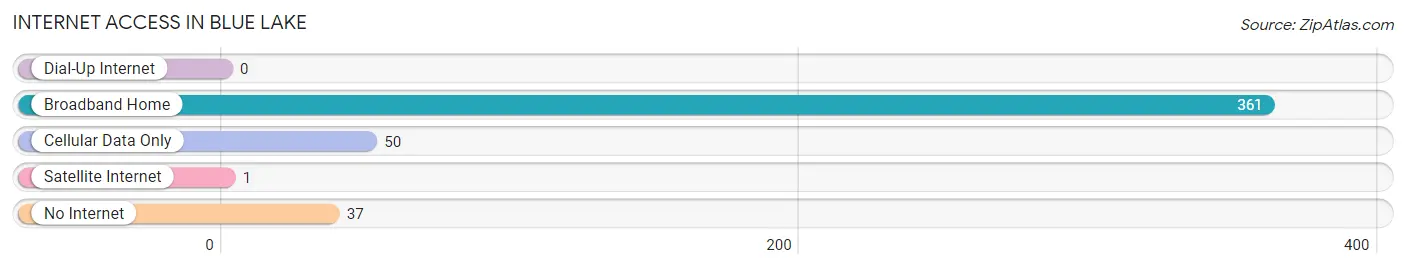
| Internet Type | # Households | % Households |
| Dial-Up Internet | 0 | 0.0% |
| Broadband Home | 361 | 80.4% |
| Cellular Data Only | 50 | 11.1% |
| Satellite Internet | 1 | 0.2% |
| No Internet | 37 | 8.2% |
| Total | 449 | 100.0% |
Blue Lake Summary
History
Blue Lake, California is a small city located in Humboldt County, California. It is situated on the Mad River, approximately 10 miles east of the city of Arcata. The city was founded in 1854 by a group of settlers from the Midwest who were looking for a place to settle and start a new life. The city was originally called “Blue Lake City”, but the name was changed to Blue Lake in 1872.
The city was originally a logging town, and the first sawmill was built in 1855. The sawmill was owned by the Blue Lake Lumber Company, which was founded by the settlers. The lumber company was the main employer in the city for many years, and it provided jobs for many of the residents.
The city was also home to a number of other businesses, including a hotel, a general store, a blacksmith shop, and a saloon. The city was also home to a number of churches, including the First Congregational Church, which was founded in 1856.
In the late 1800s, the city began to grow and prosper. The population increased from about 500 in 1880 to over 1,000 in 1900. The city was also home to a number of schools, including the Blue Lake Grammar School, which was founded in 1887.
The city continued to grow and prosper throughout the 20th century. In the 1950s, the city was home to a number of businesses, including a movie theater, a bowling alley, and a number of restaurants. The city also had a number of parks, including the Blue Lake Park, which was established in 1954.
The city has continued to grow and prosper in the 21st century. The population has increased to over 2,000, and the city is home to a number of businesses, including a grocery store, a hardware store, and a number of restaurants. The city is also home to a number of parks, including the Blue Lake Park, which is still in operation today.
Geography
Blue Lake is located in Humboldt County, California. It is situated on the Mad River, approximately 10 miles east of the city of Arcata. The city is located in a valley surrounded by hills and mountains. The city is located at an elevation of approximately 1,000 feet above sea level.
The climate in Blue Lake is mild and temperate. The average temperature in the summer is around 70 degrees Fahrenheit, and the average temperature in the winter is around 50 degrees Fahrenheit. The city receives an average of about 20 inches of rain per year.
Economy
The economy of Blue Lake is largely based on tourism and agriculture. The city is home to a number of tourist attractions, including the Blue Lake Park, which is a popular destination for visitors. The city is also home to a number of farms, which produce a variety of fruits and vegetables.
The city is also home to a number of businesses, including a grocery store, a hardware store, and a number of restaurants. The city is also home to a number of manufacturing companies, which produce a variety of products, including furniture, clothing, and electronics.
Demographics
As of the 2010 census, the population of Blue Lake was 2,068. The population is largely white, with about 75% of the population being white. The median age of the population is 44.5 years old. The median household income is $45,000, and the median home value is $220,000.
Common Questions
What is Per Capita Income in Blue Lake?
Per Capita income in Blue Lake is $40,965.
What is the Median Family Income in Blue Lake?
Median Family Income in Blue Lake is $100,469.
What is the Median Household income in Blue Lake?
Median Household Income in Blue Lake is $48,807.
What is Income or Wage Gap in Blue Lake?
Income or Wage Gap in Blue Lake is 21.3%.
Women in Blue Lake earn 78.7 cents for every dollar earned by a man.
What is Inequality or Gini Index in Blue Lake?
Inequality or Gini Index in Blue Lake is 0.49.
What is the Total Population of Blue Lake?
Total Population of Blue Lake is 841.
What is the Total Male Population of Blue Lake?
Total Male Population of Blue Lake is 404.
What is the Total Female Population of Blue Lake?
Total Female Population of Blue Lake is 437.
What is the Ratio of Males per 100 Females in Blue Lake?
There are 92.45 Males per 100 Females in Blue Lake.
What is the Ratio of Females per 100 Males in Blue Lake?
There are 108.17 Females per 100 Males in Blue Lake.
What is the Median Population Age in Blue Lake?
Median Population Age in Blue Lake is 56.3 Years.
What is the Average Family Size in Blue Lake
Average Family Size in Blue Lake is 2.3 People.
What is the Average Household Size in Blue Lake
Average Household Size in Blue Lake is 1.9 People.
How Large is the Labor Force in Blue Lake?
There are 414 People in the Labor Forcein in Blue Lake.
What is the Percentage of People in the Labor Force in Blue Lake?
56.1% of People are in the Labor Force in Blue Lake.
What is the Unemployment Rate in Blue Lake?
Unemployment Rate in Blue Lake is 7.7%.