Cities with the Highest Percentage of Population Employed in Architecture & Engineering in Nevada
RELATED REPORTS & OPTIONS
Architecture & Engineering
Nevada
Compare Cities
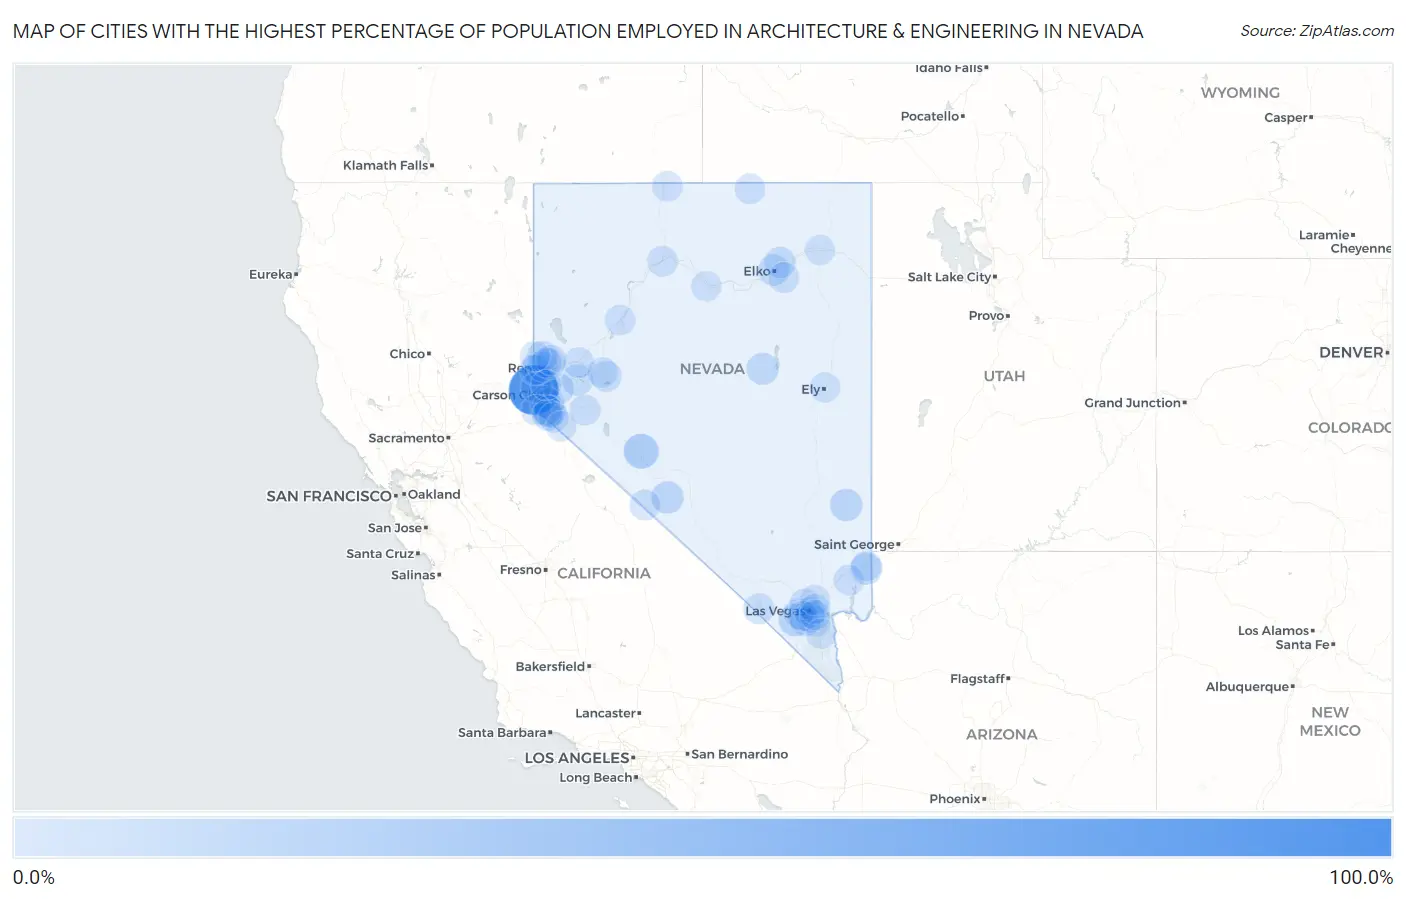
Map of Cities with the Highest Percentage of Population Employed in Architecture & Engineering in Nevada
0.0%
100.0%

Cities with the Highest Percentage of Population Employed in Architecture & Engineering in Nevada
| City | % Employed | vs State | vs National | |
| 1. | Crystal Bay | 100.0% | 1.5%(+98.5)#1 | 2.1%(+97.9)#1 |
| 2. | Mina | 22.9% | 1.5%(+21.4)#2 | 2.1%(+20.7)#103 |
| 3. | Blue Diamond | 11.8% | 1.5%(+10.3)#3 | 2.1%(+9.66)#367 |
| 4. | Caliente | 10.7% | 1.5%(+9.21)#4 | 2.1%(+8.54)#440 |
| 5. | Silver Peak | 9.9% | 1.5%(+8.45)#5 | 2.1%(+7.78)#506 |
| 6. | Eureka | 8.6% | 1.5%(+7.10)#6 | 2.1%(+6.44)#627 |
| 7. | East Valley | 7.9% | 1.5%(+6.40)#7 | 2.1%(+5.74)#743 |
| 8. | Bunkerville | 7.8% | 1.5%(+6.33)#8 | 2.1%(+5.67)#752 |
| 9. | Elko | 6.0% | 1.5%(+4.52)#9 | 2.1%(+3.86)#1,234 |
| 10. | Mogul | 6.0% | 1.5%(+4.48)#10 | 2.1%(+3.82)#1,253 |
| 11. | Silver Springs | 5.8% | 1.5%(+4.35)#11 | 2.1%(+3.69)#1,324 |
| 12. | Osino | 5.8% | 1.5%(+4.29)#12 | 2.1%(+3.63)#1,350 |
| 13. | Fallon Station | 3.9% | 1.5%(+2.43)#13 | 2.1%(+1.76)#2,882 |
| 14. | Johnson Lane | 3.8% | 1.5%(+2.32)#14 | 2.1%(+1.66)#3,007 |
| 15. | Indian Hills | 3.8% | 1.5%(+2.32)#15 | 2.1%(+1.66)#3,012 |
| 16. | Dayton | 3.4% | 1.5%(+1.95)#16 | 2.1%(+1.29)#3,647 |
| 17. | Yerington | 3.4% | 1.5%(+1.91)#17 | 2.1%(+1.25)#3,719 |
| 18. | Pahrump | 3.3% | 1.5%(+1.77)#18 | 2.1%(+1.11)#3,970 |
| 19. | Gardnerville | 3.3% | 1.5%(+1.77)#19 | 2.1%(+1.11)#3,980 |
| 20. | Incline Village | 3.1% | 1.5%(+1.57)#20 | 2.1%(+0.902)#4,448 |
| 21. | Minden | 3.0% | 1.5%(+1.55)#21 | 2.1%(+0.885)#4,486 |
| 22. | Spring Creek | 2.8% | 1.5%(+1.30)#22 | 2.1%(+0.632)#5,163 |
| 23. | Dyer | 2.8% | 1.5%(+1.29)#23 | 2.1%(+0.629)#5,185 |
| 24. | Sparks | 2.7% | 1.5%(+1.20)#24 | 2.1%(+0.540)#5,466 |
| 25. | Winnemucca | 2.7% | 1.5%(+1.19)#25 | 2.1%(+0.523)#5,520 |
| 26. | Reno | 2.7% | 1.5%(+1.18)#26 | 2.1%(+0.514)#5,545 |
| 27. | Lovelock | 1.9% | 1.5%(+0.399)#27 | 2.1%(-0.266)#8,381 |
| 28. | Fort Mcdermitt | 1.8% | 1.5%(+0.301)#28 | 2.1%(-0.363)#8,821 |
| 29. | Summerlin South | 1.8% | 1.5%(+0.280)#29 | 2.1%(-0.385)#8,916 |
| 30. | Lemmon Valley | 1.8% | 1.5%(+0.271)#30 | 2.1%(-0.393)#8,958 |
| 31. | Stateline | 1.7% | 1.5%(+0.185)#31 | 2.1%(-0.479)#9,366 |
| 32. | Verdi | 1.7% | 1.5%(+0.176)#32 | 2.1%(-0.489)#9,412 |
| 33. | Henderson | 1.6% | 1.5%(+0.134)#33 | 2.1%(-0.530)#9,624 |
| 34. | Enterprise | 1.6% | 1.5%(+0.070)#34 | 2.1%(-0.594)#9,926 |
| 35. | Fernley | 1.5% | 1.5%(+0.028)#35 | 2.1%(-0.637)#10,154 |
| 36. | Gardnerville Ranchos | 1.4% | 1.5%(-0.064)#36 | 2.1%(-0.728)#10,614 |
| 37. | Sun Valley | 1.4% | 1.5%(-0.092)#37 | 2.1%(-0.756)#10,765 |
| 38. | Carson | 1.4% | 1.5%(-0.095)#38 | 2.1%(-0.759)#10,778 |
| 39. | Moapa Valley | 1.3% | 1.5%(-0.165)#39 | 2.1%(-0.830)#11,172 |
| 40. | Spanish Springs | 1.3% | 1.5%(-0.168)#40 | 2.1%(-0.833)#11,189 |
| 41. | Owyhee | 1.3% | 1.5%(-0.213)#41 | 2.1%(-0.877)#11,395 |
| 42. | Washoe Valley | 1.2% | 1.5%(-0.279)#42 | 2.1%(-0.944)#11,743 |
| 43. | Las Vegas | 1.1% | 1.5%(-0.374)#43 | 2.1%(-1.04)#12,230 |
| 44. | Winchester | 1.1% | 1.5%(-0.430)#44 | 2.1%(-1.09)#12,531 |
| 45. | Paradise | 0.97% | 1.5%(-0.515)#45 | 2.1%(-1.18)#13,006 |
| 46. | Topaz Ranch Estates | 0.92% | 1.5%(-0.563)#46 | 2.1%(-1.23)#13,283 |
| 47. | Carter Springs | 0.92% | 1.5%(-0.563)#47 | 2.1%(-1.23)#13,285 |
| 48. | Spring Valley | 0.88% | 1.5%(-0.605)#48 | 2.1%(-1.27)#13,505 |
| 49. | Mesquite | 0.87% | 1.5%(-0.619)#49 | 2.1%(-1.28)#13,596 |
| 50. | North Las Vegas | 0.83% | 1.5%(-0.655)#50 | 2.1%(-1.32)#13,819 |
| 51. | Fallon | 0.79% | 1.5%(-0.699)#51 | 2.1%(-1.36)#14,074 |
| 52. | Battle Mountain | 0.79% | 1.5%(-0.699)#52 | 2.1%(-1.36)#14,078 |
| 53. | Ely | 0.72% | 1.5%(-0.760)#53 | 2.1%(-1.42)#14,432 |
| 54. | Sunrise Manor | 0.64% | 1.5%(-0.850)#54 | 2.1%(-1.51)#14,910 |
| 55. | Whitney | 0.60% | 1.5%(-0.888)#55 | 2.1%(-1.55)#15,107 |
| 56. | Boulder City | 0.60% | 1.5%(-0.889)#56 | 2.1%(-1.55)#15,111 |
| 57. | Wells | 0.55% | 1.5%(-0.938)#57 | 2.1%(-1.60)#15,372 |
| 58. | Cold Springs | 0.20% | 1.5%(-1.28)#58 | 2.1%(-1.95)#16,717 |
1
2Common Questions
What are the Top 10 Cities with the Highest Percentage of Population Employed in Architecture & Engineering in Nevada?
Top 10 Cities with the Highest Percentage of Population Employed in Architecture & Engineering in Nevada are:
#1
100.0%
#2
22.9%
#3
11.8%
#4
10.7%
#5
9.9%
#6
8.6%
#7
7.9%
#8
7.8%
#9
6.0%
#10
6.0%
What city has the Highest Percentage of Population Employed in Architecture & Engineering in Nevada?
Crystal Bay has the Highest Percentage of Population Employed in Architecture & Engineering in Nevada with 100.0%.
What is the Percentage of Population Employed in Architecture & Engineering in the State of Nevada?
Percentage of Population Employed in Architecture & Engineering in Nevada is 1.5%.
What is the Percentage of Population Employed in Architecture & Engineering in the United States?
Percentage of Population Employed in Architecture & Engineering in the United States is 2.1%.