Cities with the Highest Percentage of Population Employed in Architecture & Engineering in Connecticut
RELATED REPORTS & OPTIONS
Architecture & Engineering
Connecticut
Compare Cities
Map of Cities with the Highest Percentage of Population Employed in Architecture & Engineering in Connecticut
0.0%
30.0%
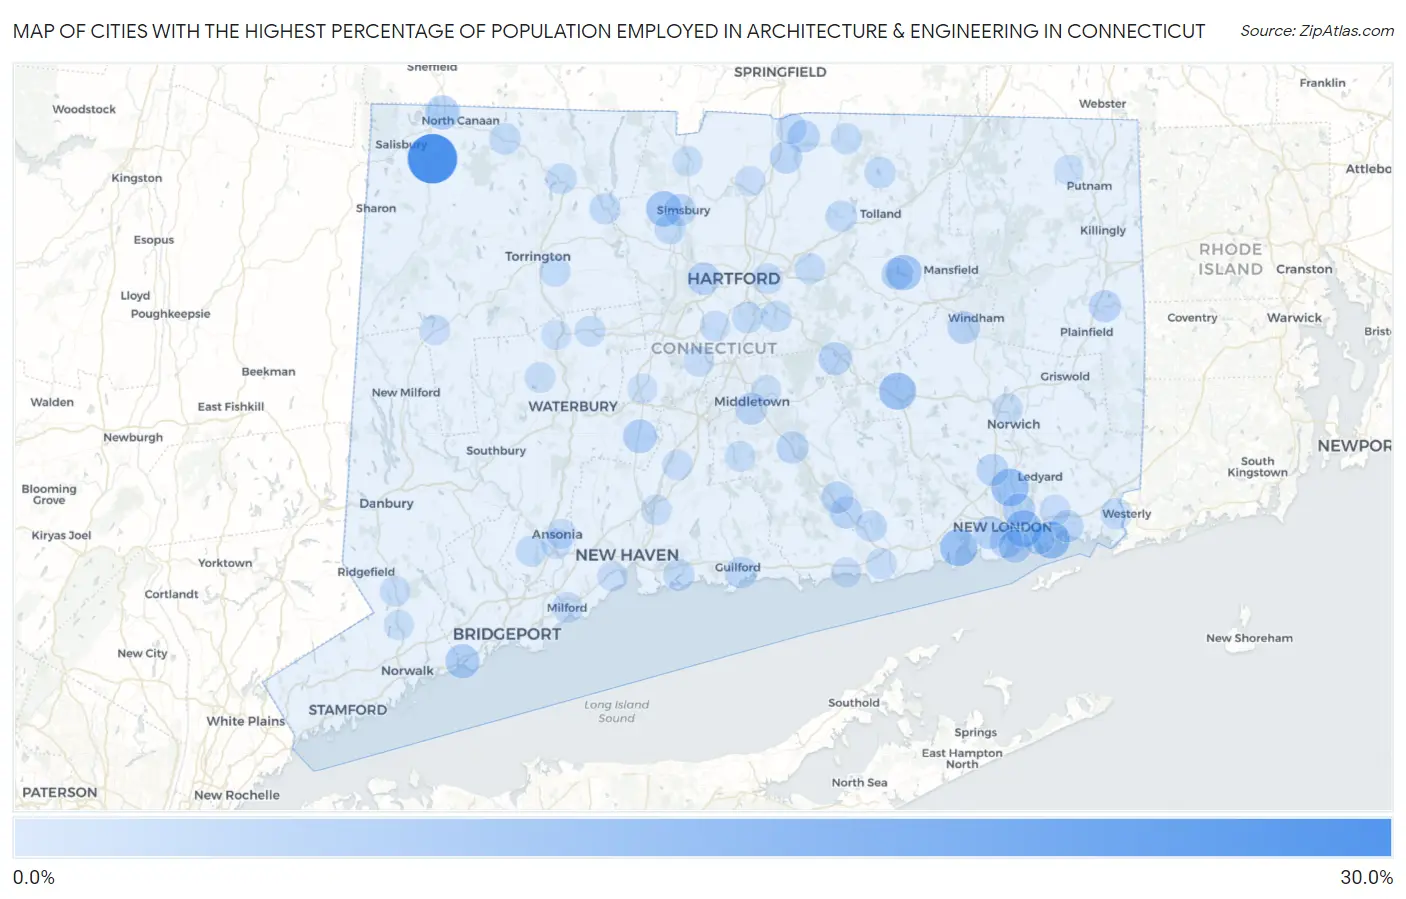
Cities with the Highest Percentage of Population Employed in Architecture & Engineering in Connecticut
| City | % Employed | vs State | vs National | |
| 1. | Falls Village | 26.5% | 2.6%(+23.9)#1 | 2.1%(+24.3)#76 |
| 2. | Gales Ferry | 11.1% | 2.6%(+8.51)#2 | 2.1%(+8.94)#415 |
| 3. | Niantic | 10.7% | 2.6%(+8.14)#3 | 2.1%(+8.56)#439 |
| 4. | Colchester | 10.4% | 2.6%(+7.83)#4 | 2.1%(+8.25)#460 |
| 5. | Noank | 10.3% | 2.6%(+7.77)#5 | 2.1%(+8.19)#469 |
| 6. | Long Hill | 10.0% | 2.6%(+7.44)#6 | 2.1%(+7.87)#490 |
| 7. | West Simsbury | 8.5% | 2.6%(+5.88)#7 | 2.1%(+6.31)#647 |
| 8. | South Coventry | 8.4% | 2.6%(+5.82)#8 | 2.1%(+6.24)#655 |
| 9. | Weston | 8.1% | 2.6%(+5.50)#9 | 2.1%(+5.92)#709 |
| 10. | Canaan | 7.0% | 2.6%(+4.40)#10 | 2.1%(+4.83)#934 |
| 11. | Candlewood Orchards | 7.0% | 2.6%(+4.40)#11 | 2.1%(+4.83)#935 |
| 12. | Candlewood Knolls | 6.9% | 2.6%(+4.37)#12 | 2.1%(+4.80)#943 |
| 13. | Southport | 6.8% | 2.6%(+4.20)#13 | 2.1%(+4.63)#985 |
| 14. | Cheshire Village | 6.4% | 2.6%(+3.83)#14 | 2.1%(+4.26)#1,082 |
| 15. | Lakeside Woods | 5.9% | 2.6%(+3.28)#15 | 2.1%(+3.71)#1,309 |
| 16. | Dayville | 5.7% | 2.6%(+3.12)#16 | 2.1%(+3.55)#1,396 |
| 17. | Waterford | 5.7% | 2.6%(+3.10)#17 | 2.1%(+3.52)#1,409 |
| 18. | New London | 5.6% | 2.6%(+3.06)#18 | 2.1%(+3.48)#1,427 |
| 19. | Bridgewater | 5.6% | 2.6%(+2.98)#19 | 2.1%(+3.41)#1,476 |
| 20. | Plattsville | 5.5% | 2.6%(+2.96)#20 | 2.1%(+3.39)#1,488 |
| 21. | Bigelow Corners | 5.5% | 2.6%(+2.93)#21 | 2.1%(+3.35)#1,507 |
| 22. | Terramuggus | 5.5% | 2.6%(+2.89)#22 | 2.1%(+3.32)#1,521 |
| 23. | Groton | 5.4% | 2.6%(+2.87)#23 | 2.1%(+3.30)#1,534 |
| 24. | Conning Towers Nautilus Park | 5.4% | 2.6%(+2.86)#24 | 2.1%(+3.28)#1,545 |
| 25. | Stepney | 5.2% | 2.6%(+2.60)#25 | 2.1%(+3.02)#1,711 |
| 26. | South Windham | 5.1% | 2.6%(+2.52)#26 | 2.1%(+2.95)#1,765 |
| 27. | West Hartford | 5.0% | 2.6%(+2.47)#27 | 2.1%(+2.90)#1,800 |
| 28. | Daniels Farm | 4.9% | 2.6%(+2.34)#28 | 2.1%(+2.77)#1,887 |
| 29. | Woodmont Borough | 4.9% | 2.6%(+2.33)#29 | 2.1%(+2.76)#1,896 |
| 30. | Stratford Downtown | 4.8% | 2.6%(+2.25)#30 | 2.1%(+2.68)#1,963 |
| 31. | Hazardville | 4.7% | 2.6%(+2.11)#31 | 2.1%(+2.54)#2,063 |
| 32. | South Wilton | 4.7% | 2.6%(+2.09)#32 | 2.1%(+2.52)#2,084 |
| 33. | Deep River Center | 4.5% | 2.6%(+1.96)#33 | 2.1%(+2.38)#2,204 |
| 34. | Moosup | 4.5% | 2.6%(+1.93)#34 | 2.1%(+2.36)#2,229 |
| 35. | Simsbury Center | 4.5% | 2.6%(+1.89)#35 | 2.1%(+2.31)#2,254 |
| 36. | Mystic | 4.5% | 2.6%(+1.88)#36 | 2.1%(+2.30)#2,261 |
| 37. | Chester Center | 4.4% | 2.6%(+1.86)#37 | 2.1%(+2.29)#2,276 |
| 38. | Southwood Acres | 4.4% | 2.6%(+1.85)#38 | 2.1%(+2.28)#2,284 |
| 39. | Higganum | 4.4% | 2.6%(+1.82)#39 | 2.1%(+2.25)#2,311 |
| 40. | Middletown | 4.3% | 2.6%(+1.71)#40 | 2.1%(+2.14)#2,413 |
| 41. | Oxoboxo River | 4.3% | 2.6%(+1.70)#41 | 2.1%(+2.12)#2,429 |
| 42. | Coventry Lake | 4.2% | 2.6%(+1.64)#42 | 2.1%(+2.07)#2,497 |
| 43. | Cornwall Bridge | 4.1% | 2.6%(+1.51)#43 | 2.1%(+1.93)#2,665 |
| 44. | Guilford Center | 3.9% | 2.6%(+1.35)#44 | 2.1%(+1.78)#2,859 |
| 45. | Stonington Borough | 3.8% | 2.6%(+1.24)#45 | 2.1%(+1.67)#3,001 |
| 46. | Compo | 3.7% | 2.6%(+1.16)#46 | 2.1%(+1.58)#3,119 |
| 47. | Norfolk | 3.7% | 2.6%(+1.13)#47 | 2.1%(+1.55)#3,156 |
| 48. | Rockville | 3.7% | 2.6%(+1.11)#48 | 2.1%(+1.54)#3,190 |
| 49. | Branford Center | 3.7% | 2.6%(+1.09)#49 | 2.1%(+1.51)#3,245 |
| 50. | Crystal Lake | 3.6% | 2.6%(+1.05)#50 | 2.1%(+1.48)#3,293 |
| 51. | Pawcatuck | 3.6% | 2.6%(+1.04)#51 | 2.1%(+1.47)#3,308 |
| 52. | Wethersfield | 3.6% | 2.6%(+1.03)#52 | 2.1%(+1.45)#3,341 |
| 53. | Trumbull Center | 3.6% | 2.6%(+0.989)#53 | 2.1%(+1.42)#3,408 |
| 54. | Candlewood Isle | 3.5% | 2.6%(+0.958)#54 | 2.1%(+1.38)#3,469 |
| 55. | Poquonock Bridge | 3.5% | 2.6%(+0.928)#55 | 2.1%(+1.35)#3,528 |
| 56. | Essex Village | 3.4% | 2.6%(+0.865)#56 | 2.1%(+1.29)#3,638 |
| 57. | New Hartford Center | 3.4% | 2.6%(+0.860)#57 | 2.1%(+1.29)#3,651 |
| 58. | Weatogue | 3.4% | 2.6%(+0.811)#58 | 2.1%(+1.24)#3,743 |
| 59. | Murray | 3.3% | 2.6%(+0.724)#59 | 2.1%(+1.15)#3,906 |
| 60. | Glastonbury Center | 3.3% | 2.6%(+0.675)#60 | 2.1%(+1.10)#3,991 |
| 61. | Northwest Harwinton | 3.2% | 2.6%(+0.616)#61 | 2.1%(+1.04)#4,116 |
| 62. | Somers | 3.2% | 2.6%(+0.612)#62 | 2.1%(+1.04)#4,124 |
| 63. | Sherwood Manor | 3.1% | 2.6%(+0.522)#63 | 2.1%(+0.949)#4,339 |
| 64. | Winsted | 3.1% | 2.6%(+0.480)#64 | 2.1%(+0.907)#4,435 |
| 65. | Litchfield Borough | 3.0% | 2.6%(+0.463)#65 | 2.1%(+0.890)#4,477 |
| 66. | East Hartford | 3.0% | 2.6%(+0.395)#66 | 2.1%(+0.822)#4,656 |
| 67. | Shelton | 3.0% | 2.6%(+0.393)#67 | 2.1%(+0.820)#4,660 |
| 68. | Milford City Balance | 3.0% | 2.6%(+0.387)#68 | 2.1%(+0.814)#4,673 |
| 69. | Manchester | 3.0% | 2.6%(+0.386)#69 | 2.1%(+0.813)#4,681 |
| 70. | Watertown | 2.9% | 2.6%(+0.356)#70 | 2.1%(+0.783)#4,757 |
| 71. | Norwich | 2.9% | 2.6%(+0.345)#71 | 2.1%(+0.771)#4,793 |
| 72. | Old Mystic | 2.9% | 2.6%(+0.316)#72 | 2.1%(+0.743)#4,866 |
| 73. | Kensington | 2.9% | 2.6%(+0.300)#73 | 2.1%(+0.727)#4,912 |
| 74. | Old Saybrook Center | 2.8% | 2.6%(+0.273)#74 | 2.1%(+0.700)#4,985 |
| 75. | Durham | 2.8% | 2.6%(+0.265)#75 | 2.1%(+0.691)#5,010 |
| 76. | Wallingford Center | 2.7% | 2.6%(+0.137)#76 | 2.1%(+0.564)#5,388 |
| 77. | Lakes East | 2.7% | 2.6%(+0.099)#77 | 2.1%(+0.526)#5,508 |
| 78. | Newington | 2.7% | 2.6%(+0.075)#78 | 2.1%(+0.501)#5,579 |
| 79. | Terryville | 2.6% | 2.6%(+0.056)#79 | 2.1%(+0.483)#5,631 |
| 80. | North Haven | 2.6% | 2.6%(+0.046)#80 | 2.1%(+0.473)#5,668 |
| 81. | Georgetown | 2.6% | 2.6%(+0.028)#81 | 2.1%(+0.454)#5,711 |
| 82. | Poplar Plains | 2.6% | 2.6%(-0.005)#82 | 2.1%(+0.422)#5,821 |
| 83. | Derby | 2.5% | 2.6%(-0.031)#83 | 2.1%(+0.396)#5,903 |
| 84. | Old Hill | 2.5% | 2.6%(-0.098)#84 | 2.1%(+0.328)#6,097 |
| 85. | New Preston | 2.5% | 2.6%(-0.112)#85 | 2.1%(+0.315)#6,146 |
| 86. | West Haven | 2.4% | 2.6%(-0.145)#86 | 2.1%(+0.281)#6,260 |
| 87. | Wilton Center | 2.2% | 2.6%(-0.351)#87 | 2.1%(+0.076)#7,023 |
| 88. | Salmon Brook | 2.2% | 2.6%(-0.358)#88 | 2.1%(+0.069)#7,051 |
| 89. | Windsor Locks | 2.2% | 2.6%(-0.395)#89 | 2.1%(+0.032)#7,199 |
| 90. | Ball Pond | 2.2% | 2.6%(-0.413)#90 | 2.1%(+0.013)#7,278 |
| 91. | Westbrook Center | 2.2% | 2.6%(-0.426)#91 | 2.1%(+0.001)#7,326 |
| 92. | Lakes West | 2.1% | 2.6%(-0.481)#92 | 2.1%(-0.054)#7,544 |
| 93. | Plantsville | 2.1% | 2.6%(-0.502)#93 | 2.1%(-0.075)#7,636 |
| 94. | Naugatuck Borough | 2.0% | 2.6%(-0.584)#94 | 2.1%(-0.157)#7,951 |
| 95. | Northford | 2.0% | 2.6%(-0.588)#95 | 2.1%(-0.161)#7,972 |
| 96. | Ansonia | 2.0% | 2.6%(-0.588)#96 | 2.1%(-0.161)#7,974 |
| 97. | Ridgebury | 2.0% | 2.6%(-0.615)#97 | 2.1%(-0.188)#8,063 |
| 98. | Thomaston | 2.0% | 2.6%(-0.619)#98 | 2.1%(-0.192)#8,085 |
| 99. | South Woodstock | 1.9% | 2.6%(-0.635)#99 | 2.1%(-0.208)#8,138 |
| 100. | Portland | 1.9% | 2.6%(-0.650)#100 | 2.1%(-0.223)#8,184 |
Common Questions
What are the Top 10 Cities with the Highest Percentage of Population Employed in Architecture & Engineering in Connecticut?
Top 10 Cities with the Highest Percentage of Population Employed in Architecture & Engineering in Connecticut are:
#1
26.5%
#2
11.1%
#3
10.7%
#4
10.4%
#5
10.3%
#6
10.0%
#7
8.5%
#8
8.4%
#9
7.0%
#10
6.8%
What city has the Highest Percentage of Population Employed in Architecture & Engineering in Connecticut?
Falls Village has the Highest Percentage of Population Employed in Architecture & Engineering in Connecticut with 26.5%.
What is the Percentage of Population Employed in Architecture & Engineering in the State of Connecticut?
Percentage of Population Employed in Architecture & Engineering in Connecticut is 2.6%.
What is the Percentage of Population Employed in Architecture & Engineering in the United States?
Percentage of Population Employed in Architecture & Engineering in the United States is 2.1%.