Zip Codes with the Highest Percentage of Population Employed in Architecture & Engineering in San Francisco, CA
RELATED REPORTS & OPTIONS
Architecture & Engineering
San Francisco
Compare Zip Codes
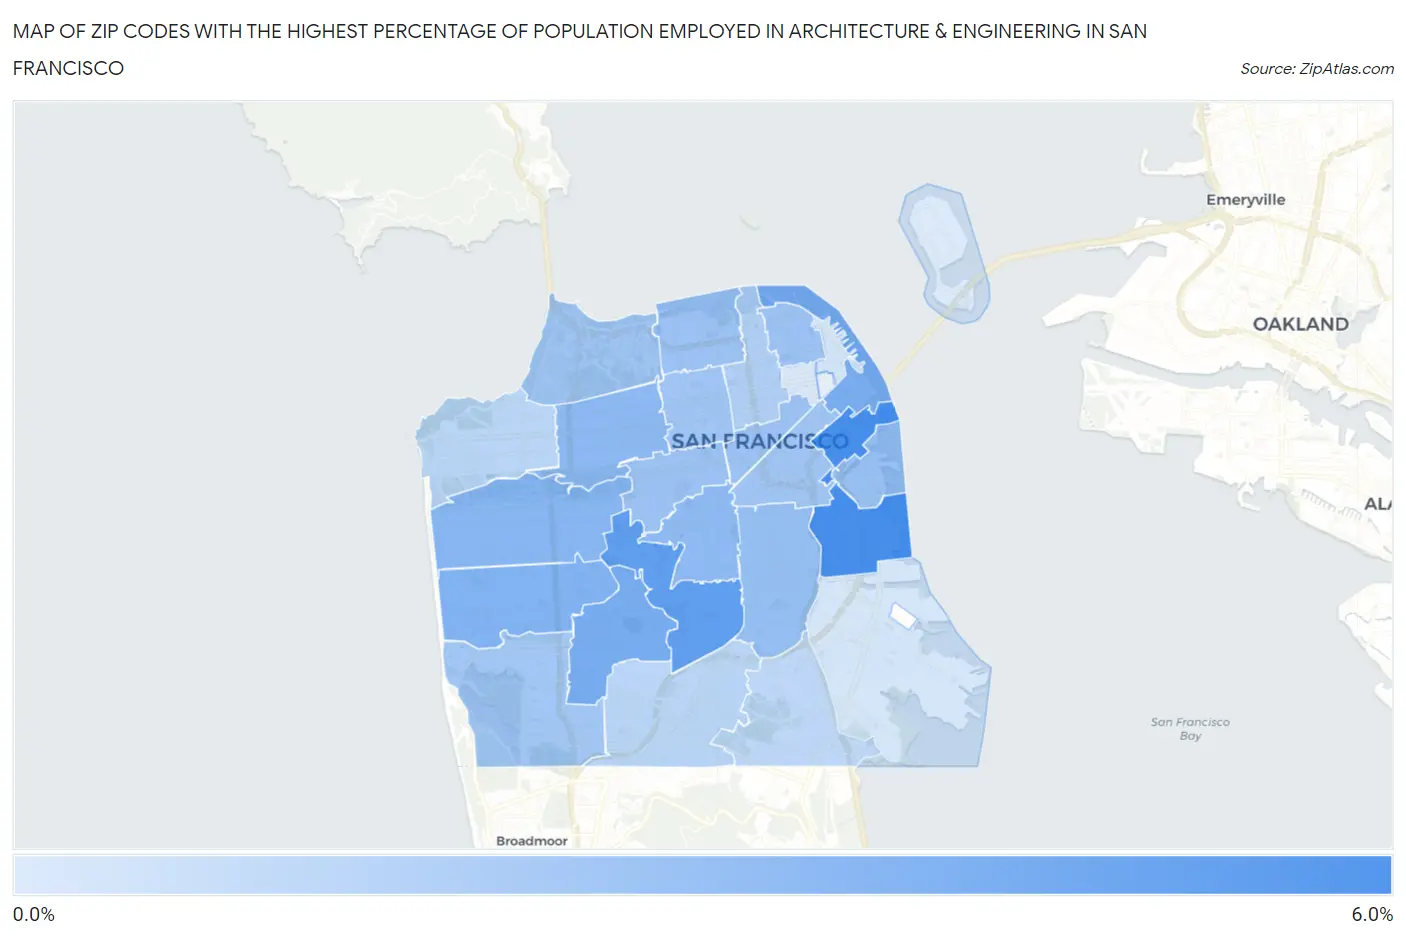
Map of Zip Codes with the Highest Percentage of Population Employed in Architecture & Engineering in San Francisco
0.98%
5.3%
Zip Codes with the Highest Percentage of Population Employed in Architecture & Engineering in San Francisco, CA
| Zip Code | % Employed | vs State | vs National | |
| 1. | 94107 | 5.3% | 2.6%(+2.73)#143 | 2.1%(+3.13)#1,460 |
| 2. | 94131 | 4.6% | 2.6%(+2.01)#194 | 2.1%(+2.42)#2,047 |
| 3. | 94127 | 3.8% | 2.6%(+1.29)#254 | 2.1%(+1.70)#3,010 |
| 4. | 94105 | 3.8% | 2.6%(+1.23)#267 | 2.1%(+1.63)#3,135 |
| 5. | 94116 | 3.6% | 2.6%(+1.06)#302 | 2.1%(+1.46)#3,485 |
| 6. | 94122 | 3.4% | 2.6%(+0.873)#322 | 2.1%(+1.28)#3,910 |
| 7. | 94118 | 3.3% | 2.6%(+0.728)#346 | 2.1%(+1.13)#4,247 |
| 8. | 94114 | 3.2% | 2.6%(+0.678)#354 | 2.1%(+1.08)#4,378 |
| 9. | 94110 | 3.0% | 2.6%(+0.459)#390 | 2.1%(+0.864)#5,015 |
| 10. | 94158 | 3.0% | 2.6%(+0.408)#398 | 2.1%(+0.813)#5,189 |
| 11. | 94102 | 2.8% | 2.6%(+0.276)#433 | 2.1%(+0.681)#5,665 |
| 12. | 94133 | 2.8% | 2.6%(+0.250)#442 | 2.1%(+0.654)#5,780 |
| 13. | 94117 | 2.8% | 2.6%(+0.242)#445 | 2.1%(+0.647)#5,805 |
| 14. | 94123 | 2.8% | 2.6%(+0.226)#449 | 2.1%(+0.631)#5,860 |
| 15. | 94115 | 2.7% | 2.6%(+0.130)#473 | 2.1%(+0.535)#6,231 |
| 16. | 94129 | 2.7% | 2.6%(+0.125)#475 | 2.1%(+0.529)#6,247 |
| 17. | 94103 | 2.7% | 2.6%(+0.115)#478 | 2.1%(+0.520)#6,288 |
| 18. | 94132 | 2.6% | 2.6%(+0.034)#504 | 2.1%(+0.439)#6,629 |
| 19. | 94109 | 2.2% | 2.6%(-0.337)#621 | 2.1%(+0.068)#8,395 |
| 20. | 94112 | 2.0% | 2.6%(-0.570)#695 | 2.1%(-0.166)#9,723 |
| 21. | 94121 | 2.0% | 2.6%(-0.594)#700 | 2.1%(-0.189)#9,854 |
| 22. | 94134 | 1.8% | 2.6%(-0.742)#754 | 2.1%(-0.337)#10,764 |
| 23. | 94111 | 1.2% | 2.6%(-1.32)#949 | 2.1%(-0.911)#14,768 |
| 24. | 94124 | 1.1% | 2.6%(-1.41)#981 | 2.1%(-1.00)#15,517 |
| 25. | 94108 | 1.0% | 2.6%(-1.51)#1,024 | 2.1%(-1.11)#16,288 |
| 26. | 94130 | 0.98% | 2.6%(-1.58)#1,048 | 2.1%(-1.17)#16,797 |
1
Common Questions
What are the Top 10 Zip Codes with the Highest Percentage of Population Employed in Architecture & Engineering in San Francisco, CA?
Top 10 Zip Codes with the Highest Percentage of Population Employed in Architecture & Engineering in San Francisco, CA are:
What zip code has the Highest Percentage of Population Employed in Architecture & Engineering in San Francisco, CA?
94107 has the Highest Percentage of Population Employed in Architecture & Engineering in San Francisco, CA with 5.3%.
What is the Percentage of Population Employed in Architecture & Engineering in San Francisco, CA?
Percentage of Population Employed in Architecture & Engineering in San Francisco is 2.8%.
What is the Percentage of Population Employed in Architecture & Engineering in California?
Percentage of Population Employed in Architecture & Engineering in California is 2.6%.
What is the Percentage of Population Employed in Architecture & Engineering in the United States?
Percentage of Population Employed in Architecture & Engineering in the United States is 2.1%.