Cities with the Highest Percentage of Population Employed in Architecture & Engineering in Ohio
RELATED REPORTS & OPTIONS
Architecture & Engineering
Ohio
Compare Cities
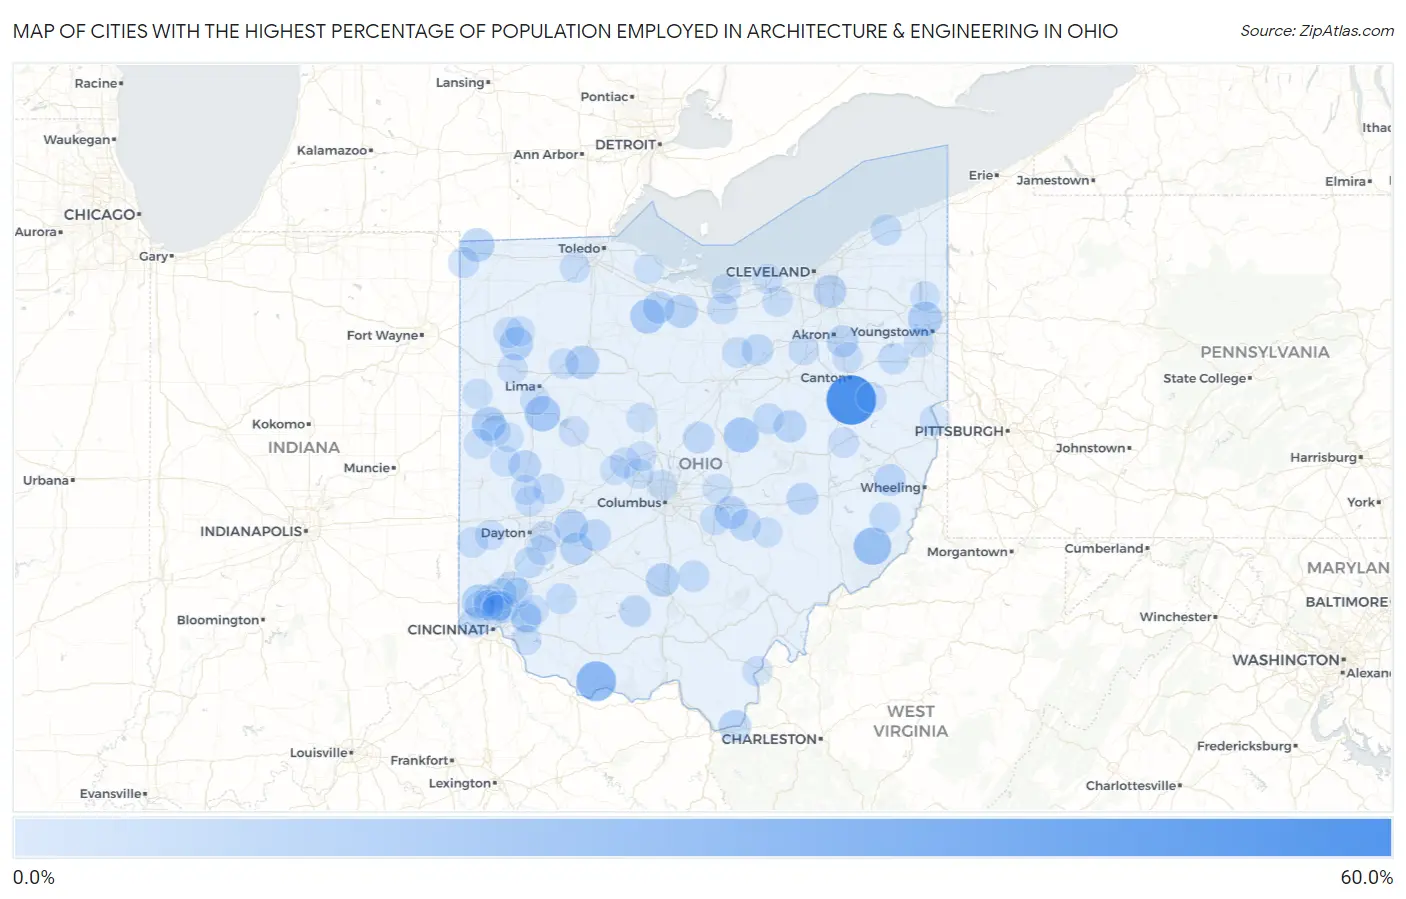
Map of Cities with the Highest Percentage of Population Employed in Architecture & Engineering in Ohio
0.0%
60.0%
Cities with the Highest Percentage of Population Employed in Architecture & Engineering in Ohio
| City | % Employed | vs State | vs National | |
| 1. | Sandyville | 51.3% | 2.1%(+49.1)#1 | 2.1%(+49.1)#26 |
| 2. | Bentonville | 27.4% | 2.1%(+25.2)#2 | 2.1%(+25.2)#69 |
| 3. | Graysville | 21.7% | 2.1%(+19.6)#3 | 2.1%(+19.6)#114 |
| 4. | New Haven Cdp Hamilton County | 21.3% | 2.1%(+19.1)#4 | 2.1%(+19.1)#118 |
| 5. | St Johns | 17.2% | 2.1%(+15.0)#5 | 2.1%(+15.0)#172 |
| 6. | Howard | 16.2% | 2.1%(+14.0)#6 | 2.1%(+14.0)#199 |
| 7. | Fort Seneca | 15.0% | 2.1%(+12.9)#7 | 2.1%(+12.9)#230 |
| 8. | Mckinley Heights | 14.3% | 2.1%(+12.2)#8 | 2.1%(+12.1)#249 |
| 9. | Montezuma | 13.6% | 2.1%(+11.5)#9 | 2.1%(+11.5)#282 |
| 10. | Lake Seneca | 12.7% | 2.1%(+10.6)#10 | 2.1%(+10.6)#318 |
| 11. | Dunlap | 12.7% | 2.1%(+10.6)#11 | 2.1%(+10.6)#321 |
| 12. | Jenera | 12.6% | 2.1%(+10.5)#12 | 2.1%(+10.5)#324 |
| 13. | Clifton | 12.6% | 2.1%(+10.5)#13 | 2.1%(+10.5)#326 |
| 14. | Cloverdale | 12.5% | 2.1%(+10.4)#14 | 2.1%(+10.4)#331 |
| 15. | Andersonville | 12.4% | 2.1%(+10.3)#15 | 2.1%(+10.3)#335 |
| 16. | Flat Rock | 11.9% | 2.1%(+9.74)#16 | 2.1%(+9.73)#361 |
| 17. | Thornville | 11.3% | 2.1%(+9.16)#17 | 2.1%(+9.14)#400 |
| 18. | Walton Hills | 11.0% | 2.1%(+8.86)#18 | 2.1%(+8.84)#423 |
| 19. | Shawnee Hills | 10.1% | 2.1%(+7.93)#19 | 2.1%(+7.92)#488 |
| 20. | Lake Buckhorn | 10.0% | 2.1%(+7.87)#20 | 2.1%(+7.85)#492 |
| 21. | Proctorville | 10.0% | 2.1%(+7.87)#21 | 2.1%(+7.85)#493 |
| 22. | Green Springs | 9.5% | 2.1%(+7.34)#22 | 2.1%(+7.33)#542 |
| 23. | Lockington | 9.3% | 2.1%(+7.17)#23 | 2.1%(+7.15)#551 |
| 24. | Lafferty | 9.0% | 2.1%(+6.84)#24 | 2.1%(+6.83)#580 |
| 25. | Sawyerwood | 8.9% | 2.1%(+6.77)#25 | 2.1%(+6.75)#590 |
| 26. | Norwich | 8.9% | 2.1%(+6.76)#26 | 2.1%(+6.74)#595 |
| 27. | Four Bridges | 8.9% | 2.1%(+6.74)#27 | 2.1%(+6.73)#598 |
| 28. | South Solon | 8.7% | 2.1%(+6.54)#28 | 2.1%(+6.52)#620 |
| 29. | Somerset | 8.5% | 2.1%(+6.40)#29 | 2.1%(+6.39)#636 |
| 30. | Bainbridge | 8.5% | 2.1%(+6.38)#30 | 2.1%(+6.36)#639 |
| 31. | Cinnamon Lake | 8.4% | 2.1%(+6.29)#31 | 2.1%(+6.27)#649 |
| 32. | Sparta | 8.2% | 2.1%(+6.09)#32 | 2.1%(+6.07)#683 |
| 33. | Adelphi | 8.1% | 2.1%(+5.92)#33 | 2.1%(+5.90)#714 |
| 34. | Evendale | 8.0% | 2.1%(+5.89)#34 | 2.1%(+5.87)#722 |
| 35. | Beckett Ridge | 7.6% | 2.1%(+5.45)#35 | 2.1%(+5.43)#796 |
| 36. | Beloit | 7.1% | 2.1%(+5.00)#36 | 2.1%(+4.98)#902 |
| 37. | Five Points | 7.1% | 2.1%(+4.98)#37 | 2.1%(+4.96)#905 |
| 38. | Madison | 7.1% | 2.1%(+4.95)#38 | 2.1%(+4.94)#910 |
| 39. | Glenmont | 7.0% | 2.1%(+4.86)#39 | 2.1%(+4.84)#930 |
| 40. | Roseland | 6.9% | 2.1%(+4.75)#40 | 2.1%(+4.74)#963 |
| 41. | Edon | 6.9% | 2.1%(+4.73)#41 | 2.1%(+4.72)#968 |
| 42. | Suffield | 6.8% | 2.1%(+4.70)#42 | 2.1%(+4.69)#974 |
| 43. | Wilson | 6.8% | 2.1%(+4.68)#43 | 2.1%(+4.67)#979 |
| 44. | Midland | 6.8% | 2.1%(+4.65)#44 | 2.1%(+4.63)#986 |
| 45. | Mount Repose | 6.6% | 2.1%(+4.50)#45 | 2.1%(+4.48)#1,008 |
| 46. | Dry Ridge | 6.5% | 2.1%(+4.39)#46 | 2.1%(+4.37)#1,041 |
| 47. | Rittman | 6.4% | 2.1%(+4.26)#47 | 2.1%(+4.25)#1,085 |
| 48. | Pleasant Run Farm | 6.4% | 2.1%(+4.23)#48 | 2.1%(+4.21)#1,098 |
| 49. | Beavercreek | 6.3% | 2.1%(+4.14)#49 | 2.1%(+4.12)#1,130 |
| 50. | Empire | 6.2% | 2.1%(+4.12)#50 | 2.1%(+4.10)#1,138 |
| 51. | Savannah | 6.2% | 2.1%(+4.08)#51 | 2.1%(+4.06)#1,158 |
| 52. | Oakwood | 6.2% | 2.1%(+4.08)#52 | 2.1%(+4.06)#1,159 |
| 53. | Lake Lakengren | 6.1% | 2.1%(+3.94)#53 | 2.1%(+3.92)#1,202 |
| 54. | Eaton Estates | 6.0% | 2.1%(+3.87)#54 | 2.1%(+3.85)#1,239 |
| 55. | Mack | 6.0% | 2.1%(+3.83)#55 | 2.1%(+3.81)#1,257 |
| 56. | Collins | 6.0% | 2.1%(+3.82)#56 | 2.1%(+3.81)#1,261 |
| 57. | Christiansburg | 5.9% | 2.1%(+3.79)#57 | 2.1%(+3.77)#1,278 |
| 58. | North Lima | 5.9% | 2.1%(+3.76)#58 | 2.1%(+3.75)#1,291 |
| 59. | Whitehouse | 5.9% | 2.1%(+3.72)#59 | 2.1%(+3.70)#1,313 |
| 60. | Thurston | 5.9% | 2.1%(+3.72)#60 | 2.1%(+3.70)#1,316 |
| 61. | Russia | 5.8% | 2.1%(+3.71)#61 | 2.1%(+3.70)#1,318 |
| 62. | Marysville | 5.8% | 2.1%(+3.63)#62 | 2.1%(+3.62)#1,356 |
| 63. | Woodworth | 5.7% | 2.1%(+3.61)#63 | 2.1%(+3.60)#1,364 |
| 64. | Glendale | 5.7% | 2.1%(+3.59)#64 | 2.1%(+3.58)#1,377 |
| 65. | Chickasaw | 5.7% | 2.1%(+3.54)#65 | 2.1%(+3.52)#1,408 |
| 66. | Woodlawn | 5.6% | 2.1%(+3.51)#66 | 2.1%(+3.49)#1,422 |
| 67. | Riverlea | 5.6% | 2.1%(+3.46)#67 | 2.1%(+3.45)#1,449 |
| 68. | Mitiwanga | 5.6% | 2.1%(+3.42)#68 | 2.1%(+3.41)#1,473 |
| 69. | Delphos | 5.6% | 2.1%(+3.42)#69 | 2.1%(+3.40)#1,480 |
| 70. | Bluffton | 5.4% | 2.1%(+3.25)#70 | 2.1%(+3.24)#1,572 |
| 71. | Greentown | 5.4% | 2.1%(+3.23)#71 | 2.1%(+3.22)#1,579 |
| 72. | Huntsville | 5.4% | 2.1%(+3.22)#72 | 2.1%(+3.21)#1,588 |
| 73. | West Alexandria | 5.4% | 2.1%(+3.22)#73 | 2.1%(+3.21)#1,593 |
| 74. | Bellbrook | 5.3% | 2.1%(+3.15)#74 | 2.1%(+3.13)#1,636 |
| 75. | Gallipolis | 5.3% | 2.1%(+3.14)#75 | 2.1%(+3.12)#1,640 |
| 76. | New Burlington | 5.3% | 2.1%(+3.12)#76 | 2.1%(+3.11)#1,662 |
| 77. | Cridersville | 5.2% | 2.1%(+3.10)#77 | 2.1%(+3.08)#1,679 |
| 78. | Gnadenhutten | 5.2% | 2.1%(+3.06)#78 | 2.1%(+3.04)#1,699 |
| 79. | Tipp City | 5.1% | 2.1%(+2.99)#79 | 2.1%(+2.97)#1,750 |
| 80. | Lake Mohawk | 5.1% | 2.1%(+2.96)#80 | 2.1%(+2.95)#1,769 |
| 81. | Canfield | 5.1% | 2.1%(+2.95)#81 | 2.1%(+2.93)#1,777 |
| 82. | Day Heights | 5.1% | 2.1%(+2.94)#82 | 2.1%(+2.93)#1,779 |
| 83. | Troy | 5.1% | 2.1%(+2.93)#83 | 2.1%(+2.92)#1,786 |
| 84. | Rockford | 5.0% | 2.1%(+2.90)#84 | 2.1%(+2.89)#1,811 |
| 85. | New California | 5.0% | 2.1%(+2.87)#85 | 2.1%(+2.85)#1,829 |
| 86. | Mason | 5.0% | 2.1%(+2.85)#86 | 2.1%(+2.83)#1,854 |
| 87. | Oak Harbor | 5.0% | 2.1%(+2.82)#87 | 2.1%(+2.81)#1,863 |
| 88. | Burkettsville | 4.9% | 2.1%(+2.77)#88 | 2.1%(+2.76)#1,894 |
| 89. | Continental | 4.9% | 2.1%(+2.76)#89 | 2.1%(+2.75)#1,904 |
| 90. | Sheffield | 4.9% | 2.1%(+2.72)#90 | 2.1%(+2.70)#1,941 |
| 91. | Green Camp | 4.8% | 2.1%(+2.71)#91 | 2.1%(+2.70)#1,947 |
| 92. | Wyoming | 4.8% | 2.1%(+2.70)#92 | 2.1%(+2.69)#1,957 |
| 93. | Crooksville | 4.8% | 2.1%(+2.69)#93 | 2.1%(+2.68)#1,965 |
| 94. | Milford Center | 4.8% | 2.1%(+2.68)#94 | 2.1%(+2.67)#1,971 |
| 95. | Amelia | 4.8% | 2.1%(+2.66)#95 | 2.1%(+2.65)#1,982 |
| 96. | Granville South | 4.8% | 2.1%(+2.65)#96 | 2.1%(+2.63)#1,996 |
| 97. | Minster | 4.7% | 2.1%(+2.60)#97 | 2.1%(+2.59)#2,023 |
| 98. | Goshen | 4.7% | 2.1%(+2.57)#98 | 2.1%(+2.56)#2,047 |
| 99. | Cortland | 4.7% | 2.1%(+2.56)#99 | 2.1%(+2.55)#2,054 |
| 100. | Ostrander | 4.6% | 2.1%(+2.48)#100 | 2.1%(+2.46)#2,130 |
Common Questions
What are the Top 10 Cities with the Highest Percentage of Population Employed in Architecture & Engineering in Ohio?
Top 10 Cities with the Highest Percentage of Population Employed in Architecture & Engineering in Ohio are:
#1
51.3%
#2
27.4%
#3
21.7%
#4
17.2%
#5
16.2%
#6
15.0%
#7
14.3%
#8
13.6%
#9
12.7%
#10
12.7%
What city has the Highest Percentage of Population Employed in Architecture & Engineering in Ohio?
Sandyville has the Highest Percentage of Population Employed in Architecture & Engineering in Ohio with 51.3%.
What is the Percentage of Population Employed in Architecture & Engineering in the State of Ohio?
Percentage of Population Employed in Architecture & Engineering in Ohio is 2.1%.
What is the Percentage of Population Employed in Architecture & Engineering in the United States?
Percentage of Population Employed in Architecture & Engineering in the United States is 2.1%.