Cities with the Highest Percentage of Population Employed in Food Preparation & Serving in New Jersey
RELATED REPORTS & OPTIONS
Food Preparation & Serving
New Jersey
Compare Cities
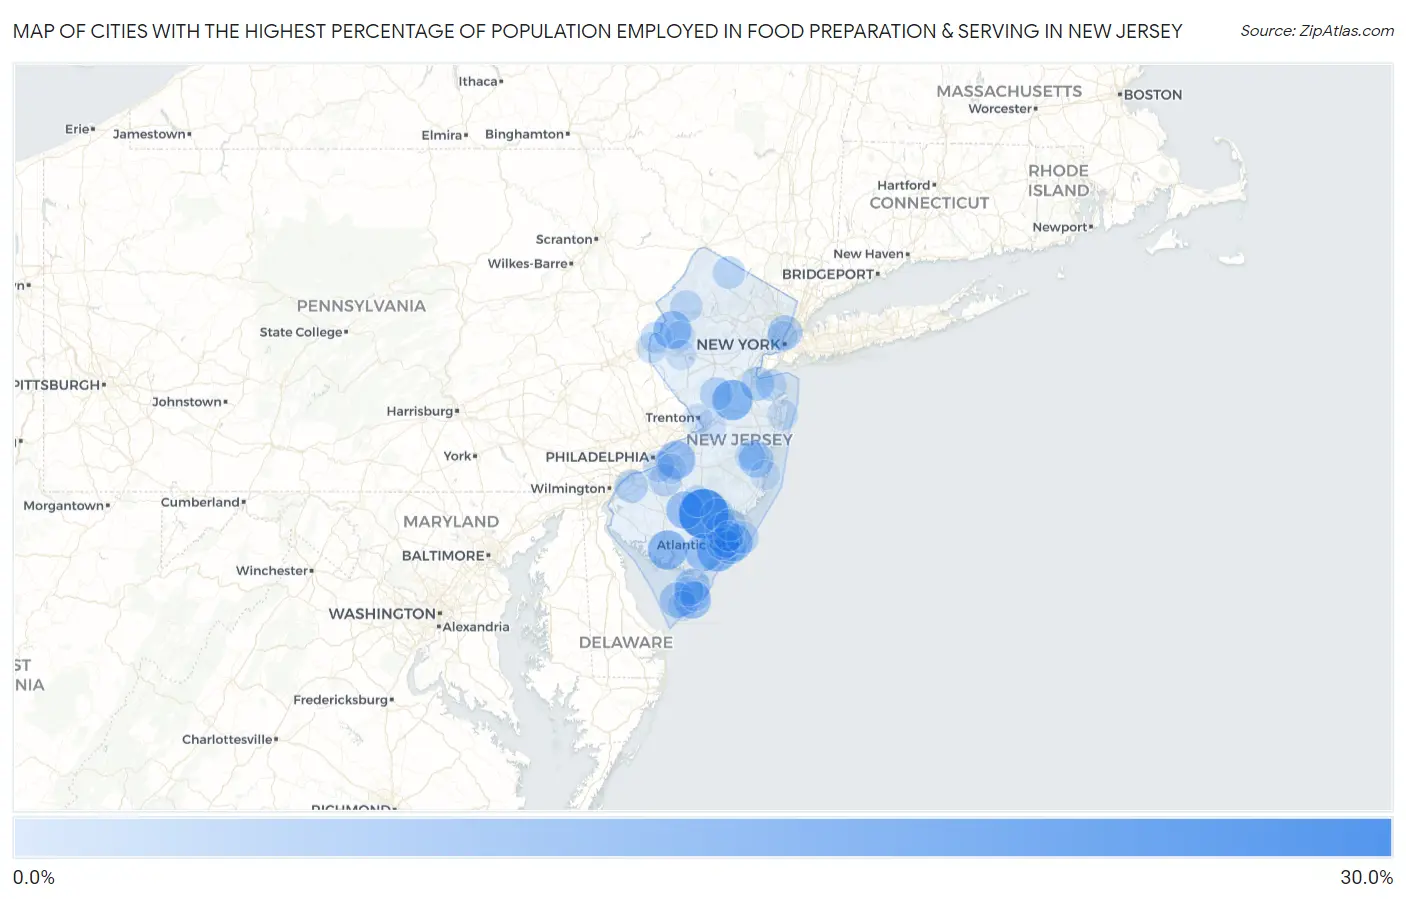
Map of Cities with the Highest Percentage of Population Employed in Food Preparation & Serving in New Jersey
0.0%
30.0%
Cities with the Highest Percentage of Population Employed in Food Preparation & Serving in New Jersey
| City | % Employed | vs State | vs National | |
| 1. | Elwood | 28.3% | 4.0%(+24.4)#1 | 5.3%(+23.0)#390 |
| 2. | Montclair State University | 19.4% | 4.0%(+15.4)#2 | 5.3%(+14.1)#910 |
| 3. | Seaside Heights Borough | 18.3% | 4.0%(+14.3)#3 | 5.3%(+13.0)#1,029 |
| 4. | Somers Point | 18.0% | 4.0%(+14.1)#4 | 5.3%(+12.7)#1,061 |
| 5. | Rossmoor | 17.8% | 4.0%(+13.9)#5 | 5.3%(+12.5)#1,091 |
| 6. | Wrightstown Borough | 17.6% | 4.0%(+13.7)#6 | 5.3%(+12.3)#1,115 |
| 7. | Laurel Lake | 16.8% | 4.0%(+12.8)#7 | 5.3%(+11.5)#1,234 |
| 8. | Mauricetown | 16.2% | 4.0%(+12.3)#8 | 5.3%(+10.9)#1,348 |
| 9. | Deal Borough | 15.8% | 4.0%(+11.8)#9 | 5.3%(+10.5)#1,442 |
| 10. | West Cape May Borough | 15.8% | 4.0%(+11.8)#10 | 5.3%(+10.5)#1,444 |
| 11. | Ramblewood | 15.5% | 4.0%(+11.5)#11 | 5.3%(+10.2)#1,510 |
| 12. | Oxford | 15.1% | 4.0%(+11.2)#12 | 5.3%(+9.85)#1,591 |
| 13. | Atlantic City | 15.1% | 4.0%(+11.1)#13 | 5.3%(+9.81)#1,602 |
| 14. | Netcong Borough | 14.9% | 4.0%(+11.0)#14 | 5.3%(+9.64)#1,659 |
| 15. | Collings Lakes | 14.8% | 4.0%(+10.9)#15 | 5.3%(+9.53)#1,681 |
| 16. | Corbin City | 14.8% | 4.0%(+10.8)#16 | 5.3%(+9.52)#1,688 |
| 17. | The College Of New Jersey | 14.7% | 4.0%(+10.7)#17 | 5.3%(+9.42)#1,714 |
| 18. | Carlls Corner | 14.5% | 4.0%(+10.6)#18 | 5.3%(+9.23)#1,764 |
| 19. | Wildwood | 14.5% | 4.0%(+10.5)#19 | 5.3%(+9.17)#1,780 |
| 20. | Silver Lake Cdp Essex County | 14.2% | 4.0%(+10.3)#20 | 5.3%(+8.95)#1,847 |
| 21. | Washington Crossing | 13.9% | 4.0%(+9.98)#21 | 5.3%(+8.65)#1,930 |
| 22. | William Paterson University Of New Jersey | 13.9% | 4.0%(+9.95)#22 | 5.3%(+8.62)#1,935 |
| 23. | West Berlin | 13.8% | 4.0%(+9.84)#23 | 5.3%(+8.51)#1,969 |
| 24. | Stockton University | 13.2% | 4.0%(+9.24)#24 | 5.3%(+7.92)#2,176 |
| 25. | Newfoundland | 13.0% | 4.0%(+9.09)#25 | 5.3%(+7.76)#2,232 |
| 26. | Ramapo College Of New Jersey | 12.9% | 4.0%(+8.90)#26 | 5.3%(+7.57)#2,317 |
| 27. | Cape May Court House | 12.7% | 4.0%(+8.78)#27 | 5.3%(+7.46)#2,375 |
| 28. | North Cape May | 12.7% | 4.0%(+8.78)#28 | 5.3%(+7.45)#2,377 |
| 29. | Cedar Knolls | 12.2% | 4.0%(+8.27)#29 | 5.3%(+6.94)#2,635 |
| 30. | Holiday Heights | 12.0% | 4.0%(+8.00)#30 | 5.3%(+6.68)#2,782 |
| 31. | Connecticut Farms | 11.7% | 4.0%(+7.76)#31 | 5.3%(+6.44)#2,929 |
| 32. | Lawnside Borough | 11.6% | 4.0%(+7.69)#32 | 5.3%(+6.36)#2,974 |
| 33. | Guttenberg | 11.6% | 4.0%(+7.63)#33 | 5.3%(+6.30)#3,012 |
| 34. | Penns Grove Borough | 11.6% | 4.0%(+7.63)#34 | 5.3%(+6.30)#3,016 |
| 35. | Highlands Borough | 11.4% | 4.0%(+7.45)#35 | 5.3%(+6.12)#3,119 |
| 36. | Milmay | 11.4% | 4.0%(+7.39)#36 | 5.3%(+6.07)#3,162 |
| 37. | Pomona | 11.3% | 4.0%(+7.30)#37 | 5.3%(+5.98)#3,220 |
| 38. | Laurence Harbor | 10.9% | 4.0%(+6.96)#38 | 5.3%(+5.63)#3,431 |
| 39. | Belmar Borough | 10.9% | 4.0%(+6.91)#39 | 5.3%(+5.58)#3,459 |
| 40. | Dividing Creek | 10.7% | 4.0%(+6.73)#40 | 5.3%(+5.41)#3,588 |
| 41. | Far Hills Borough | 10.5% | 4.0%(+6.58)#41 | 5.3%(+5.26)#3,682 |
| 42. | Ventnor City | 10.5% | 4.0%(+6.56)#42 | 5.3%(+5.24)#3,709 |
| 43. | Beckett | 10.5% | 4.0%(+6.55)#43 | 5.3%(+5.23)#3,718 |
| 44. | Sussex Borough | 10.5% | 4.0%(+6.54)#44 | 5.3%(+5.22)#3,722 |
| 45. | Rutgers University-Livingston Campus | 10.5% | 4.0%(+6.54)#45 | 5.3%(+5.22)#3,725 |
| 46. | Egg Harbor City | 10.5% | 4.0%(+6.49)#46 | 5.3%(+5.17)#3,758 |
| 47. | Ocean View | 10.2% | 4.0%(+6.21)#47 | 5.3%(+4.89)#3,964 |
| 48. | Kingston | 10.0% | 4.0%(+6.05)#48 | 5.3%(+4.73)#4,086 |
| 49. | Raritan Borough | 9.9% | 4.0%(+5.90)#49 | 5.3%(+4.58)#4,214 |
| 50. | Pleasantville | 9.8% | 4.0%(+5.84)#50 | 5.3%(+4.51)#4,263 |
| 51. | Marlboro | 9.7% | 4.0%(+5.71)#51 | 5.3%(+4.39)#4,377 |
| 52. | Blackwood | 9.6% | 4.0%(+5.60)#52 | 5.3%(+4.27)#4,482 |
| 53. | Northfield | 9.4% | 4.0%(+5.44)#53 | 5.3%(+4.12)#4,629 |
| 54. | Vernon Center | 9.4% | 4.0%(+5.39)#54 | 5.3%(+4.07)#4,684 |
| 55. | Brigantine | 9.3% | 4.0%(+5.36)#55 | 5.3%(+4.04)#4,717 |
| 56. | Swedesboro Borough | 9.3% | 4.0%(+5.31)#56 | 5.3%(+3.98)#4,776 |
| 57. | Moonachie Borough | 9.1% | 4.0%(+5.14)#57 | 5.3%(+3.82)#4,930 |
| 58. | Freehold Borough | 9.1% | 4.0%(+5.11)#58 | 5.3%(+3.78)#4,986 |
| 59. | Gillette | 9.0% | 4.0%(+5.02)#59 | 5.3%(+3.70)#5,078 |
| 60. | Avalon Borough | 8.9% | 4.0%(+4.92)#60 | 5.3%(+3.60)#5,221 |
| 61. | Smithville | 8.9% | 4.0%(+4.91)#61 | 5.3%(+3.59)#5,229 |
| 62. | Johnsonburg | 8.9% | 4.0%(+4.90)#62 | 5.3%(+3.58)#5,235 |
| 63. | Victory Gardens Borough | 8.9% | 4.0%(+4.90)#63 | 5.3%(+3.58)#5,239 |
| 64. | Harmony | 8.7% | 4.0%(+4.73)#64 | 5.3%(+3.41)#5,430 |
| 65. | Glassboro Borough | 8.6% | 4.0%(+4.65)#65 | 5.3%(+3.32)#5,539 |
| 66. | Gloucester City | 8.5% | 4.0%(+4.50)#66 | 5.3%(+3.18)#5,704 |
| 67. | Hammonton | 8.4% | 4.0%(+4.48)#67 | 5.3%(+3.16)#5,728 |
| 68. | North Middletown | 8.3% | 4.0%(+4.37)#68 | 5.3%(+3.04)#5,906 |
| 69. | Keasbey | 8.2% | 4.0%(+4.22)#69 | 5.3%(+2.90)#6,082 |
| 70. | Kean University | 8.0% | 4.0%(+4.07)#70 | 5.3%(+2.75)#6,282 |
| 71. | Absecon Highlands | 8.0% | 4.0%(+4.01)#71 | 5.3%(+2.69)#6,372 |
| 72. | Phillipsburg | 7.9% | 4.0%(+3.98)#72 | 5.3%(+2.66)#6,416 |
| 73. | Point Pleasant Beach Borough | 7.9% | 4.0%(+3.97)#73 | 5.3%(+2.65)#6,446 |
| 74. | Lebanon Borough | 7.7% | 4.0%(+3.79)#74 | 5.3%(+2.46)#6,749 |
| 75. | Holiday City Berkeley | 7.7% | 4.0%(+3.77)#75 | 5.3%(+2.45)#6,762 |
| 76. | Lakehurst Borough | 7.7% | 4.0%(+3.74)#76 | 5.3%(+2.41)#6,818 |
| 77. | Wanamassa | 7.6% | 4.0%(+3.66)#77 | 5.3%(+2.34)#6,958 |
| 78. | Anderson | 7.6% | 4.0%(+3.61)#78 | 5.3%(+2.28)#7,037 |
| 79. | Berlin Borough | 7.4% | 4.0%(+3.48)#79 | 5.3%(+2.16)#7,218 |
| 80. | Union City | 7.3% | 4.0%(+3.37)#80 | 5.3%(+2.05)#7,393 |
| 81. | Wildwood Crest Borough | 7.2% | 4.0%(+3.27)#81 | 5.3%(+1.95)#7,559 |
| 82. | Andover Borough | 7.2% | 4.0%(+3.26)#82 | 5.3%(+1.94)#7,576 |
| 83. | Pine Ridge At Crestwood | 7.2% | 4.0%(+3.24)#83 | 5.3%(+1.92)#7,610 |
| 84. | Groveville | 7.1% | 4.0%(+3.18)#84 | 5.3%(+1.85)#7,755 |
| 85. | Sewell | 7.1% | 4.0%(+3.17)#85 | 5.3%(+1.84)#7,768 |
| 86. | Bound Brook Borough | 7.1% | 4.0%(+3.16)#86 | 5.3%(+1.84)#7,772 |
| 87. | Clinton | 7.1% | 4.0%(+3.15)#87 | 5.3%(+1.83)#7,787 |
| 88. | Cape May | 7.1% | 4.0%(+3.14)#88 | 5.3%(+1.82)#7,809 |
| 89. | Bellmawr Borough | 7.1% | 4.0%(+3.13)#89 | 5.3%(+1.81)#7,819 |
| 90. | Point Pleasant Borough | 7.1% | 4.0%(+3.11)#90 | 5.3%(+1.79)#7,871 |
| 91. | Absecon | 7.1% | 4.0%(+3.10)#91 | 5.3%(+1.78)#7,896 |
| 92. | Trenton | 7.0% | 4.0%(+3.04)#92 | 5.3%(+1.71)#8,002 |
| 93. | Alpha Borough | 7.0% | 4.0%(+3.03)#93 | 5.3%(+1.71)#8,024 |
| 94. | Ashland | 7.0% | 4.0%(+3.03)#94 | 5.3%(+1.70)#8,031 |
| 95. | Menlo Park Terrace | 7.0% | 4.0%(+3.02)#95 | 5.3%(+1.70)#8,038 |
| 96. | North Wildwood | 7.0% | 4.0%(+3.02)#96 | 5.3%(+1.69)#8,046 |
| 97. | Milford Borough | 7.0% | 4.0%(+3.01)#97 | 5.3%(+1.69)#8,051 |
| 98. | Bloomsbury Borough | 7.0% | 4.0%(+2.99)#98 | 5.3%(+1.67)#8,088 |
| 99. | Burleigh | 6.9% | 4.0%(+2.93)#99 | 5.3%(+1.61)#8,195 |
| 100. | Forked River | 6.8% | 4.0%(+2.88)#100 | 5.3%(+1.56)#8,300 |
Common Questions
What are the Top 10 Cities with the Highest Percentage of Population Employed in Food Preparation & Serving in New Jersey?
Top 10 Cities with the Highest Percentage of Population Employed in Food Preparation & Serving in New Jersey are:
#1
28.3%
#2
18.0%
#3
17.8%
#4
16.8%
#5
15.5%
#6
15.1%
#7
15.1%
#8
14.8%
#9
14.8%
#10
14.5%
What city has the Highest Percentage of Population Employed in Food Preparation & Serving in New Jersey?
Elwood has the Highest Percentage of Population Employed in Food Preparation & Serving in New Jersey with 28.3%.
What is the Percentage of Population Employed in Food Preparation & Serving in the State of New Jersey?
Percentage of Population Employed in Food Preparation & Serving in New Jersey is 4.0%.
What is the Percentage of Population Employed in Food Preparation & Serving in the United States?
Percentage of Population Employed in Food Preparation & Serving in the United States is 5.3%.