North San Juan, CA Map & Demographics
North San Juan Map
North San Juan Overview
$20,472
PER CAPITA INCOME
0.38
INEQUALITY / GINI INDEX
109
TOTAL POPULATION
25
MALE POPULATION
84
FEMALE POPULATION
29.76
MALES / 100 FEMALES
336.00
FEMALES / 100 MALES
68.6
MEDIAN AGE
1.2
AVG HOUSEHOLD SIZE
2
LABOR FORCE [ PEOPLE ]
1.8%
PERCENT IN LABOR FORCE
North San Juan Zip Codes
North San Juan Area Codes
Income in North San Juan
Income Overview in North San Juan
| Characteristic | Number | Measure |
| Per Capita Income | 109 | $20,472 |
| Median Family Income | 0 | $0 |
| Mean Family Income | 0 | $0 |
| Median Household Income | 90 | $0 |
| Mean Household Income | 90 | $24,794 |
| Income Deficit | 0 | $0 |
| Wage / Income Gap (%) | 109 | 0.00% |
| Wage / Income Gap ($) | 109 | 100.00¢ per $1 |
| Gini / Inequality Index | 109 | 0.38 |
Earnings by Sex in North San Juan
| Sex | Number | Average Earnings |
| Male | 0 (0.0%) | $0 |
| Female | 2 (100.0%) | $0 |
| Total | 2 (100.0%) | $0 |
Earnings by Sex by Income Bracket in North San Juan
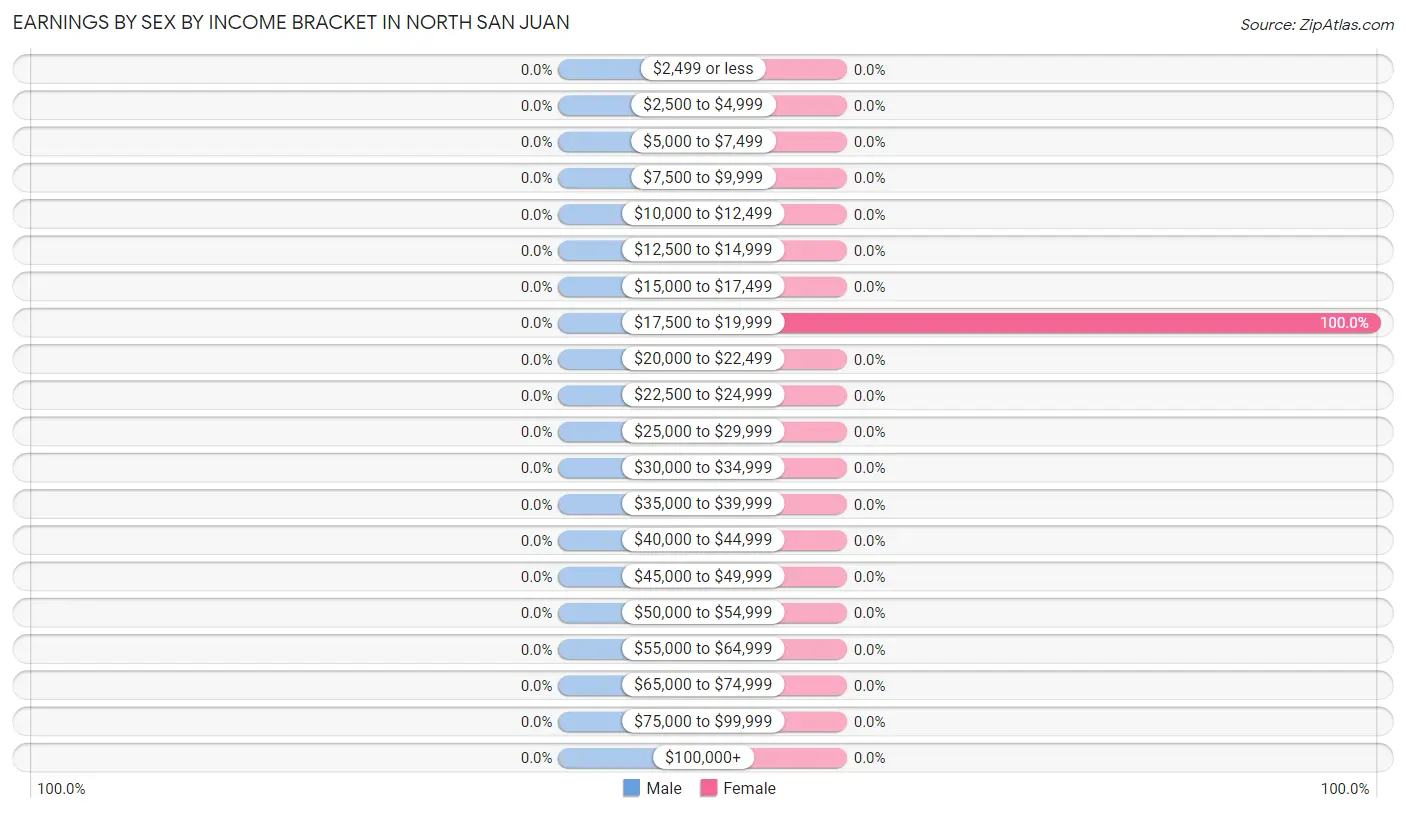
| Income | Male | Female |
| $2,499 or less | 0 (0.0%) | 0 (0.0%) |
| $2,500 to $4,999 | 0 (0.0%) | 0 (0.0%) |
| $5,000 to $7,499 | 0 (0.0%) | 0 (0.0%) |
| $7,500 to $9,999 | 0 (0.0%) | 0 (0.0%) |
| $10,000 to $12,499 | 0 (0.0%) | 0 (0.0%) |
| $12,500 to $14,999 | 0 (0.0%) | 0 (0.0%) |
| $15,000 to $17,499 | 0 (0.0%) | 0 (0.0%) |
| $17,500 to $19,999 | 0 (0.0%) | 2 (100.0%) |
| $20,000 to $22,499 | 0 (0.0%) | 0 (0.0%) |
| $22,500 to $24,999 | 0 (0.0%) | 0 (0.0%) |
| $25,000 to $29,999 | 0 (0.0%) | 0 (0.0%) |
| $30,000 to $34,999 | 0 (0.0%) | 0 (0.0%) |
| $35,000 to $39,999 | 0 (0.0%) | 0 (0.0%) |
| $40,000 to $44,999 | 0 (0.0%) | 0 (0.0%) |
| $45,000 to $49,999 | 0 (0.0%) | 0 (0.0%) |
| $50,000 to $54,999 | 0 (0.0%) | 0 (0.0%) |
| $55,000 to $64,999 | 0 (0.0%) | 0 (0.0%) |
| $65,000 to $74,999 | 0 (0.0%) | 0 (0.0%) |
| $75,000 to $99,999 | 0 (0.0%) | 0 (0.0%) |
| $100,000+ | 0 (0.0%) | 0 (0.0%) |
| Total | 0 (0.0%) | 2 (100.0%) |
Earnings by Sex by Educational Attainment in North San Juan
| Educational Attainment | Male Income | Female Income |
| Less than High School | - | - |
| High School Diploma | - | - |
| College or Associate's Degree | - | - |
| Bachelor's Degree | - | - |
| Graduate Degree | - | - |
| Total | - | - |
Family Income in North San Juan
Family Income Brackets in North San Juan
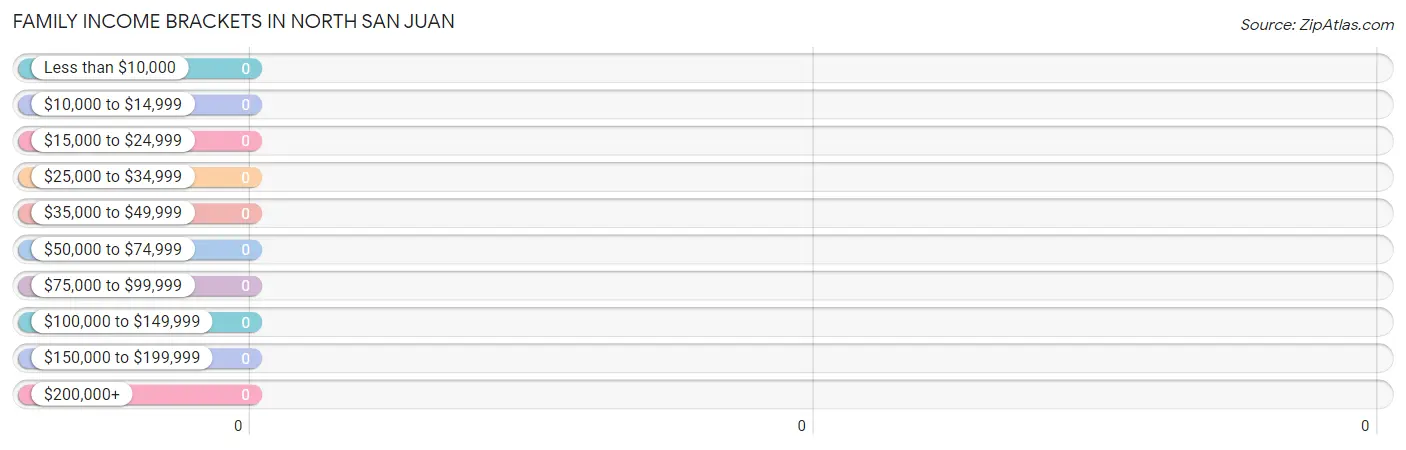
| Income Bracket | # Families | % Families |
| Less than $10,000 | 0 | 0.0% |
| $10,000 to $14,999 | 0 | 0.0% |
| $15,000 to $24,999 | 0 | 0.0% |
| $25,000 to $34,999 | 0 | 0.0% |
| $35,000 to $49,999 | 0 | 0.0% |
| $50,000 to $74,999 | 0 | 0.0% |
| $75,000 to $99,999 | 0 | 0.0% |
| $100,000 to $149,999 | 0 | 0.0% |
| $150,000 to $199,999 | 0 | 0.0% |
| $200,000+ | 0 | 0.0% |
Family Income by Famaliy Size in North San Juan
| Income Bracket | # Families | Median Income |
| 2-Person Families | 0 (0.0%) | $0 |
| 3-Person Families | 0 (0.0%) | $0 |
| 4-Person Families | 0 (0.0%) | $0 |
| 5-Person Families | 0 (0.0%) | $0 |
| 6-Person Families | 0 (0.0%) | $0 |
| 7+ Person Families | 0 (0.0%) | $0 |
| Total | 0 (0.0%) | $0 |
Family Income by Number of Earners in North San Juan
| Number of Earners | # Families | Median Income |
| No Earners | 0 (0.0%) | $0 |
| 1 Earner | 0 (0.0%) | $0 |
| 2 Earners | 0 (0.0%) | $0 |
| 3+ Earners | 0 (0.0%) | $0 |
| Total | 0 (0.0%) | $0 |
Household Income in North San Juan
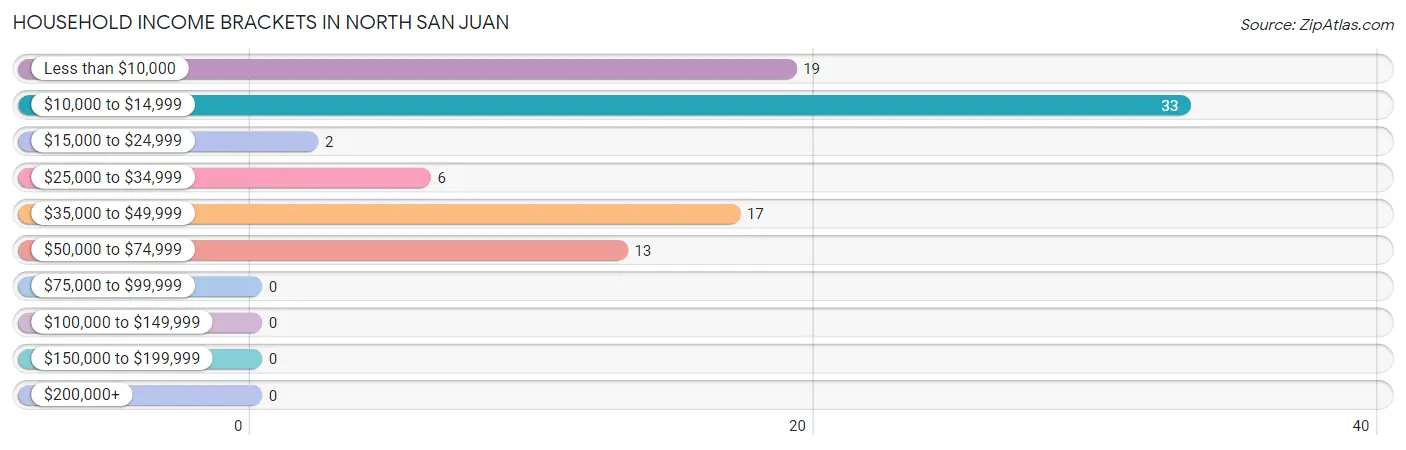
Household Income Brackets in North San Juan
With 33 households falling in the category, the $10,000 to $14,999 income range is the most frequent in North San Juan, accounting for 36.7% of all households.
| Income Bracket | # Households | % Households |
| Less than $10,000 | 19 | 21.1% |
| $10,000 to $14,999 | 33 | 36.7% |
| $15,000 to $24,999 | 2 | 2.2% |
| $25,000 to $34,999 | 6 | 6.7% |
| $35,000 to $49,999 | 17 | 18.9% |
| $50,000 to $74,999 | 13 | 14.4% |
| $75,000 to $99,999 | 0 | 0.0% |
| $100,000 to $149,999 | 0 | 0.0% |
| $150,000 to $199,999 | 0 | 0.0% |
| $200,000+ | 0 | 0.0% |
Household Income by Householder Age in North San Juan
| Income Bracket | # Households | Median Income |
| 15 to 24 Years | 0 (0.0%) | $0 |
| 25 to 44 Years | 0 (0.0%) | $0 |
| 45 to 64 Years | 44 (48.9%) | $0 |
| 65+ Years | 46 (51.1%) | $0 |
| Total | 90 (100.0%) | $0 |
Poverty in North San Juan
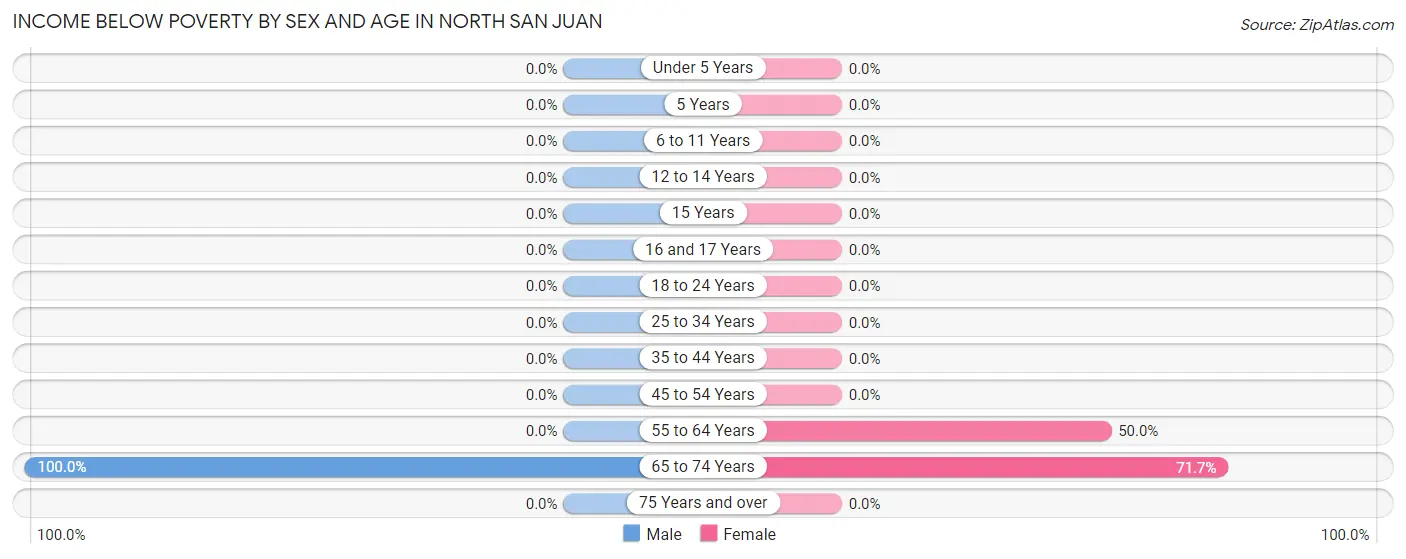
Income Below Poverty by Sex and Age in North San Juan
With 76.0% poverty level for males and 61.9% for females among the residents of North San Juan, 65 to 74 year old males and 65 to 74 year old females are the most vulnerable to poverty, with 19 males (100.0%) and 33 females (71.7%) in their respective age groups living below the poverty level.
| Age Bracket | Male | Female |
| Under 5 Years | 0 (0.0%) | 0 (0.0%) |
| 5 Years | 0 (0.0%) | 0 (0.0%) |
| 6 to 11 Years | 0 (0.0%) | 0 (0.0%) |
| 12 to 14 Years | 0 (0.0%) | 0 (0.0%) |
| 15 Years | 0 (0.0%) | 0 (0.0%) |
| 16 and 17 Years | 0 (0.0%) | 0 (0.0%) |
| 18 to 24 Years | 0 (0.0%) | 0 (0.0%) |
| 25 to 34 Years | 0 (0.0%) | 0 (0.0%) |
| 35 to 44 Years | 0 (0.0%) | 0 (0.0%) |
| 45 to 54 Years | 0 (0.0%) | 0 (0.0%) |
| 55 to 64 Years | 0 (0.0%) | 19 (50.0%) |
| 65 to 74 Years | 19 (100.0%) | 33 (71.7%) |
| 75 Years and over | 0 (0.0%) | 0 (0.0%) |
| Total | 19 (76.0%) | 52 (61.9%) |
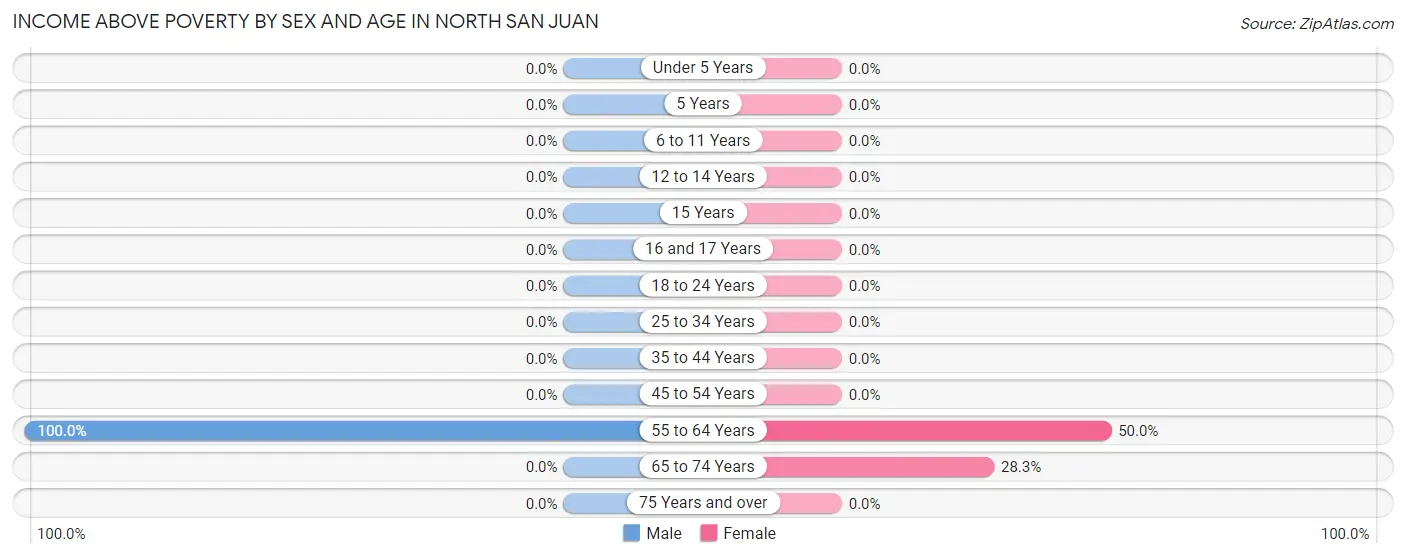
Income Above Poverty by Sex and Age in North San Juan
According to the poverty statistics in North San Juan, males aged 55 to 64 years and females aged 55 to 64 years are the age groups that are most secure financially, with 100.0% of males and 50.0% of females in these age groups living above the poverty line.
| Age Bracket | Male | Female |
| Under 5 Years | 0 (0.0%) | 0 (0.0%) |
| 5 Years | 0 (0.0%) | 0 (0.0%) |
| 6 to 11 Years | 0 (0.0%) | 0 (0.0%) |
| 12 to 14 Years | 0 (0.0%) | 0 (0.0%) |
| 15 Years | 0 (0.0%) | 0 (0.0%) |
| 16 and 17 Years | 0 (0.0%) | 0 (0.0%) |
| 18 to 24 Years | 0 (0.0%) | 0 (0.0%) |
| 25 to 34 Years | 0 (0.0%) | 0 (0.0%) |
| 35 to 44 Years | 0 (0.0%) | 0 (0.0%) |
| 45 to 54 Years | 0 (0.0%) | 0 (0.0%) |
| 55 to 64 Years | 6 (100.0%) | 19 (50.0%) |
| 65 to 74 Years | 0 (0.0%) | 13 (28.3%) |
| 75 Years and over | 0 (0.0%) | 0 (0.0%) |
| Total | 6 (24.0%) | 32 (38.1%) |
Income Below Poverty Among Married-Couple Families in North San Juan
| Children | Above Poverty | Below Poverty |
| No Children | 0 (0.0%) | 0 (0.0%) |
| 1 or 2 Children | 0 (0.0%) | 0 (0.0%) |
| 3 or 4 Children | 0 (0.0%) | 0 (0.0%) |
| 5 or more Children | 0 (0.0%) | 0 (0.0%) |
| Total | 0 (0.0%) | 0 (0.0%) |
Income Below Poverty Among Single-Parent Households in North San Juan
| Children | Single Father | Single Mother |
| No Children | 0 (0.0%) | 0 (0.0%) |
| 1 or 2 Children | 0 (0.0%) | 0 (0.0%) |
| 3 or 4 Children | 0 (0.0%) | 0 (0.0%) |
| 5 or more Children | 0 (0.0%) | 0 (0.0%) |
| Total | 0 (0.0%) | 0 (0.0%) |
Income Below Poverty Among Married-Couple vs Single-Parent Households in North San Juan
| Children | Married-Couple Families | Single-Parent Households |
| No Children | 0 (0.0%) | 0 (0.0%) |
| 1 or 2 Children | 0 (0.0%) | 0 (0.0%) |
| 3 or 4 Children | 0 (0.0%) | 0 (0.0%) |
| 5 or more Children | 0 (0.0%) | 0 (0.0%) |
| Total | 0 (0.0%) | 0 (0.0%) |
Race in North San Juan
The most populous races in North San Juan are White / Caucasian (109 | 100.0%), and Hispanic or Latino (13 | 11.9%).
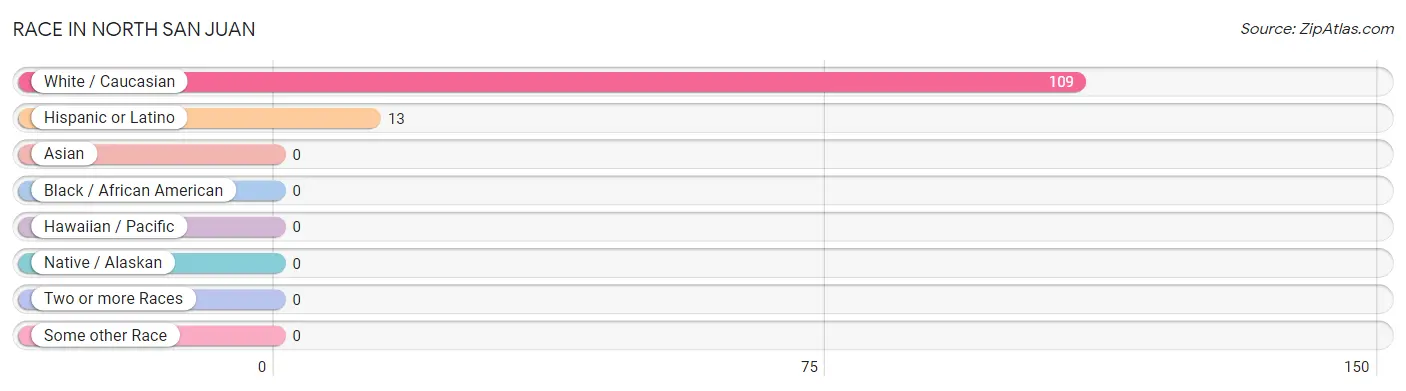
| Race | # Population | % Population |
| Asian | 0 | 0.0% |
| Black / African American | 0 | 0.0% |
| Hawaiian / Pacific | 0 | 0.0% |
| Hispanic or Latino | 13 | 11.9% |
| Native / Alaskan | 0 | 0.0% |
| White / Caucasian | 109 | 100.0% |
| Two or more Races | 0 | 0.0% |
| Some other Race | 0 | 0.0% |
| Total | 109 | 100.0% |
Ancestry in North San Juan
The most populous ancestries reported in North San Juan are English (23 | 21.1%), European (13 | 11.9%), Polish (13 | 11.9%), Russian (13 | 11.9%), and Spanish (13 | 11.9%), together accounting for 68.8% of all North San Juan residents.
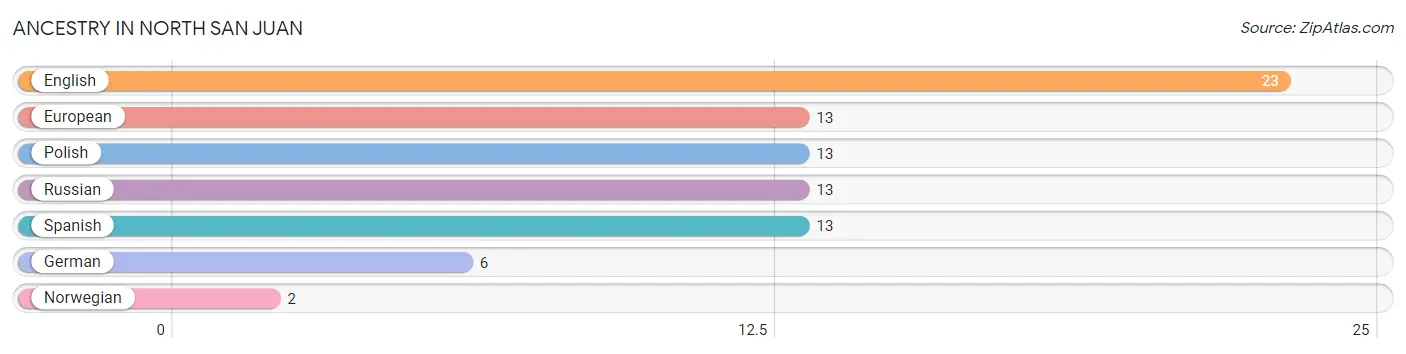
| Ancestry | # Population | % Population |
| English | 23 | 21.1% |
| European | 13 | 11.9% |
| German | 6 | 5.5% |
| Norwegian | 2 | 1.8% |
| Polish | 13 | 11.9% |
| Russian | 13 | 11.9% |
| Spanish | 13 | 11.9% | View All 7 Rows |
Immigrants in North San Juan

| Immigration Origin | # Population | % Population | View All 0 Rows |
Sex and Age in North San Juan
Sex and Age in North San Juan
The most populous age groups in North San Juan are 65 to 69 Years (19 | 76.0%) for men and 70 to 74 Years (46 | 54.8%) for women.
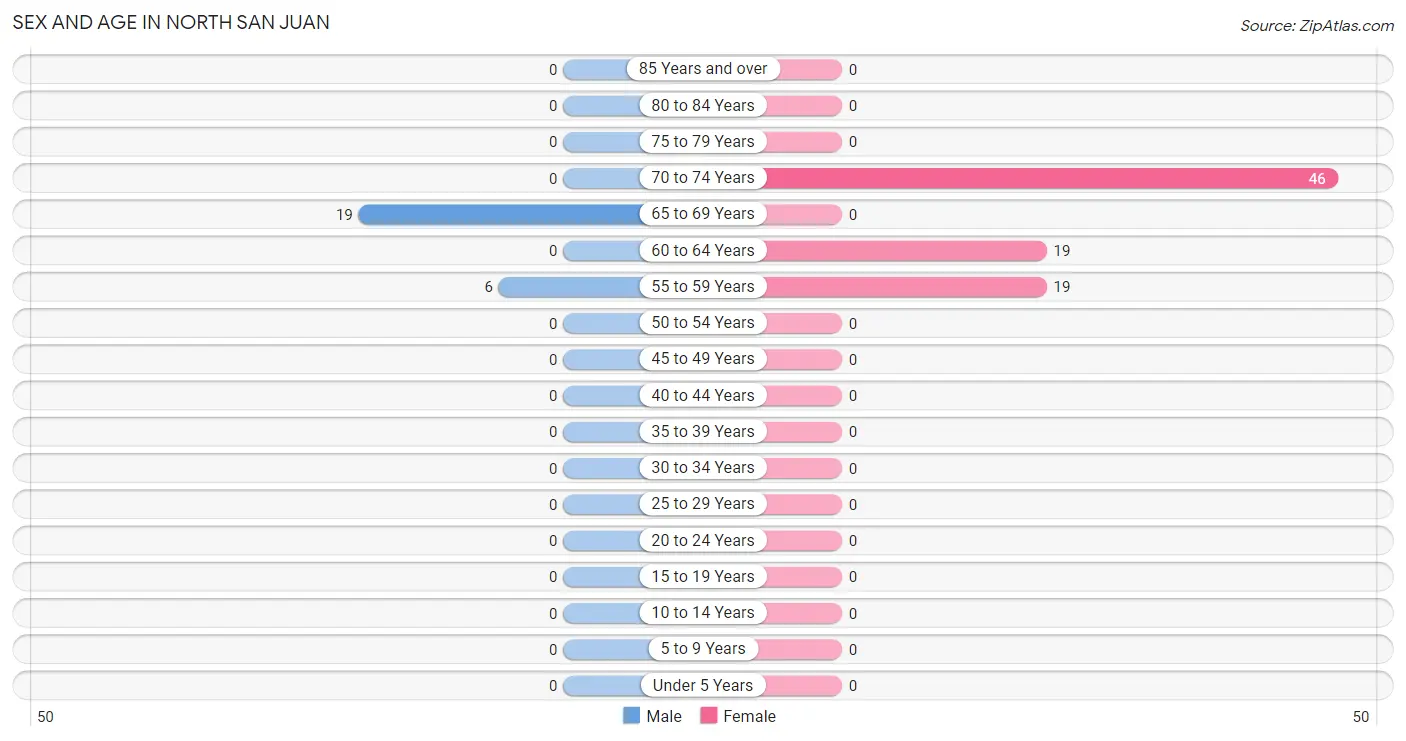
| Age Bracket | Male | Female |
| Under 5 Years | 0 (0.0%) | 0 (0.0%) |
| 5 to 9 Years | 0 (0.0%) | 0 (0.0%) |
| 10 to 14 Years | 0 (0.0%) | 0 (0.0%) |
| 15 to 19 Years | 0 (0.0%) | 0 (0.0%) |
| 20 to 24 Years | 0 (0.0%) | 0 (0.0%) |
| 25 to 29 Years | 0 (0.0%) | 0 (0.0%) |
| 30 to 34 Years | 0 (0.0%) | 0 (0.0%) |
| 35 to 39 Years | 0 (0.0%) | 0 (0.0%) |
| 40 to 44 Years | 0 (0.0%) | 0 (0.0%) |
| 45 to 49 Years | 0 (0.0%) | 0 (0.0%) |
| 50 to 54 Years | 0 (0.0%) | 0 (0.0%) |
| 55 to 59 Years | 6 (24.0%) | 19 (22.6%) |
| 60 to 64 Years | 0 (0.0%) | 19 (22.6%) |
| 65 to 69 Years | 19 (76.0%) | 0 (0.0%) |
| 70 to 74 Years | 0 (0.0%) | 46 (54.8%) |
| 75 to 79 Years | 0 (0.0%) | 0 (0.0%) |
| 80 to 84 Years | 0 (0.0%) | 0 (0.0%) |
| 85 Years and over | 0 (0.0%) | 0 (0.0%) |
| Total | 25 (100.0%) | 84 (100.0%) |
Families and Households in North San Juan
Median Family Size in North San Juan
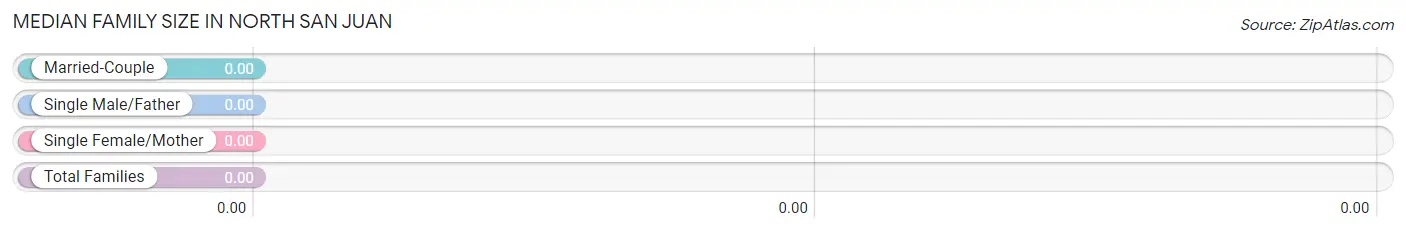
| Family Type | # Families | Family Size |
| Married-Couple | 0 (0.0%) | - |
| Single Male/Father | 0 (0.0%) | - |
| Single Female/Mother | 0 (0.0%) | - |
| Total Families | 0 (0.0%) | - |
Median Household Size in North San Juan
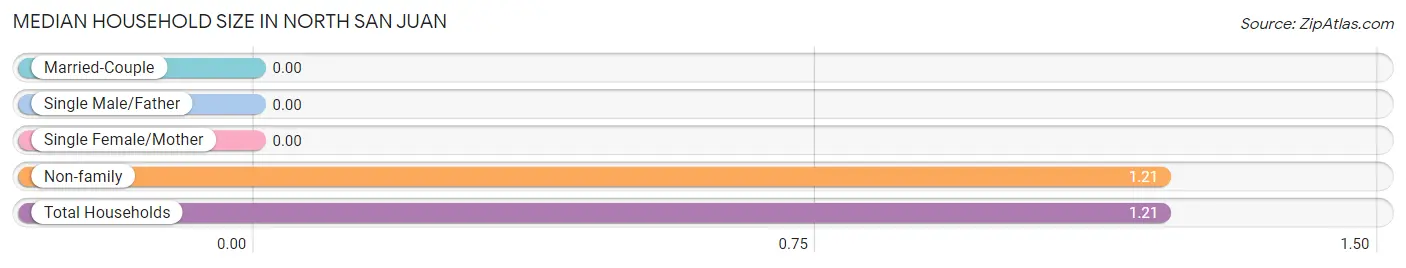
| Household Type | # Households | Household Size |
| Married-Couple | 0 (0.0%) | - |
| Single Male/Father | 0 (0.0%) | - |
| Single Female/Mother | 0 (0.0%) | - |
| Non-family | 90 (100.0%) | 1.21 |
| Total Households | 90 (100.0%) | 1.21 |
Household Size by Marriage Status in North San Juan
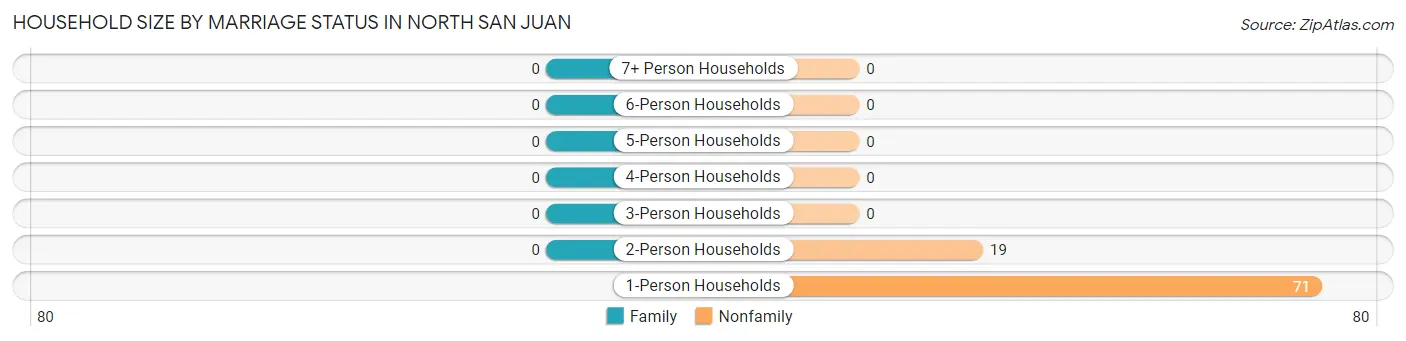
| Household Size | Family Households | Nonfamily Households |
| 1-Person Households | - | 71 (78.9%) |
| 2-Person Households | 0 (0.0%) | 19 (21.1%) |
| 3-Person Households | 0 (0.0%) | 0 (0.0%) |
| 4-Person Households | 0 (0.0%) | 0 (0.0%) |
| 5-Person Households | 0 (0.0%) | 0 (0.0%) |
| 6-Person Households | 0 (0.0%) | 0 (0.0%) |
| 7+ Person Households | 0 (0.0%) | 0 (0.0%) |
| Total | 0 (0.0%) | 90 (100.0%) |
Female Fertility in North San Juan
Fertility by Age in North San Juan
| Age Bracket | Women with Births | Births / 1,000 Women |
| 15 to 19 years | 0 (0.0%) | 0.0 |
| 20 to 34 years | 0 (0.0%) | 0.0 |
| 35 to 50 years | 0 (0.0%) | 0.0 |
| Total | 0 (0.0%) | 0.0 |
Fertility by Age by Marriage Status in North San Juan
| Age Bracket | Married | Unmarried |
| 15 to 19 years | 0 (0.0%) | 0 (0.0%) |
| 20 to 34 years | 0 (0.0%) | 0 (0.0%) |
| 35 to 50 years | 0 (0.0%) | 0 (0.0%) |
| Total | 0 (0.0%) | 0 (0.0%) |
Fertility by Education in North San Juan
| Educational Attainment | Women with Births | Births / 1,000 Women |
| Less than High School | 0 (0.0%) | 0.0 |
| High School Diploma | 0 (0.0%) | 0.0 |
| College or Associate's Degree | 0 (0.0%) | 0.0 |
| Bachelor's Degree | 0 (0.0%) | 0.0 |
| Graduate Degree | 0 (0.0%) | 0.0 |
| Total | 0 (0.0%) | 0.0 |
Fertility by Education by Marriage Status in North San Juan
| Educational Attainment | Married | Unmarried |
| Less than High School | 0 (0.0%) | 0 (0.0%) |
| High School Diploma | 0 (0.0%) | 0 (0.0%) |
| College or Associate's Degree | 0 (0.0%) | 0 (0.0%) |
| Bachelor's Degree | 0 (0.0%) | 0 (0.0%) |
| Graduate Degree | 0 (0.0%) | 0 (0.0%) |
| Total | 0 (0.0%) | 0 (0.0%) |
Employment Characteristics in North San Juan
Employment by Class of Employer in North San Juan
Among the 2 employed individuals in North San Juan, , and private company employees (2 | 100.0%) make up the most common classes of employment.
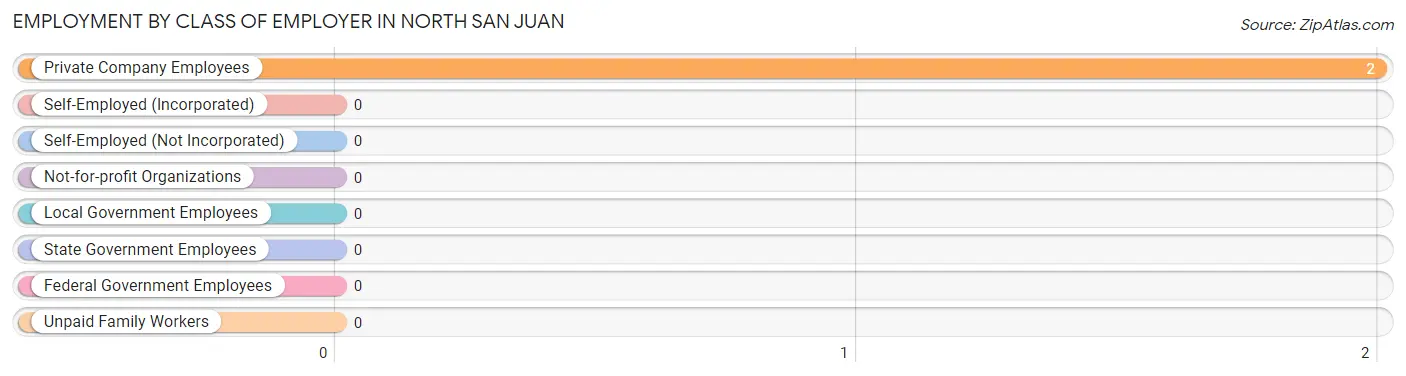
| Employer Class | # Employees | % Employees |
| Private Company Employees | 2 | 100.0% |
| Self-Employed (Incorporated) | 0 | 0.0% |
| Self-Employed (Not Incorporated) | 0 | 0.0% |
| Not-for-profit Organizations | 0 | 0.0% |
| Local Government Employees | 0 | 0.0% |
| State Government Employees | 0 | 0.0% |
| Federal Government Employees | 0 | 0.0% |
| Unpaid Family Workers | 0 | 0.0% |
| Total | 2 | 100.0% |
Employment Status by Age in North San Juan
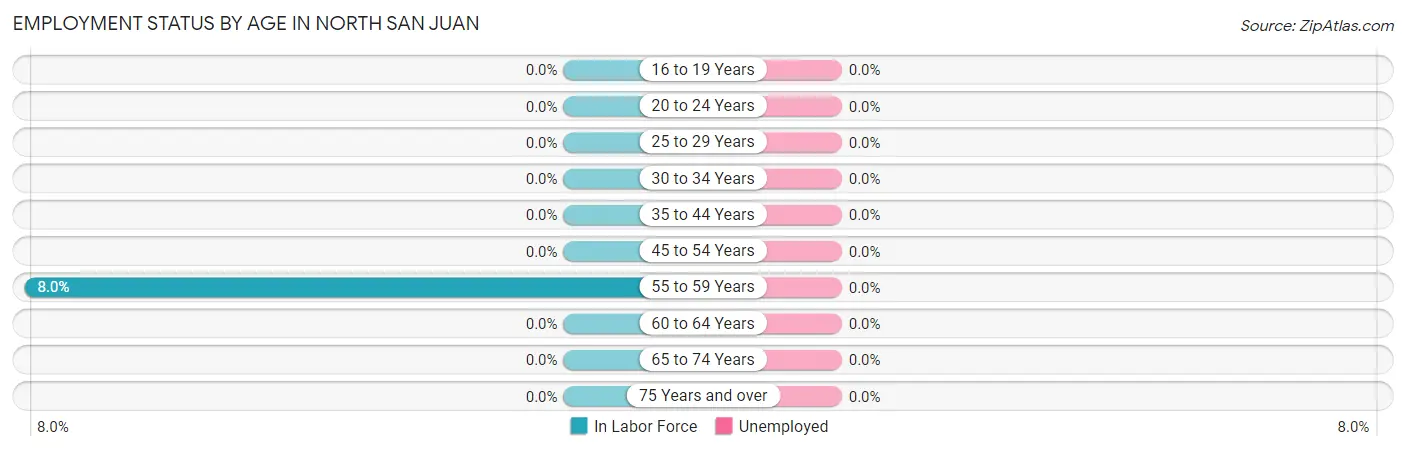
| Age Bracket | In Labor Force | Unemployed |
| 16 to 19 Years | 0 (0.0%) | 0 (0.0%) |
| 20 to 24 Years | 0 (0.0%) | 0 (0.0%) |
| 25 to 29 Years | 0 (0.0%) | 0 (0.0%) |
| 30 to 34 Years | 0 (0.0%) | 0 (0.0%) |
| 35 to 44 Years | 0 (0.0%) | 0 (0.0%) |
| 45 to 54 Years | 0 (0.0%) | 0 (0.0%) |
| 55 to 59 Years | 2 (8.0%) | 0 (0.0%) |
| 60 to 64 Years | 0 (0.0%) | 0 (0.0%) |
| 65 to 74 Years | 0 (0.0%) | 0 (0.0%) |
| 75 Years and over | 0 (0.0%) | 0 (0.0%) |
| Total | 2 (1.8%) | 0 (0.0%) |
Employment Status by Educational Attainment in North San Juan
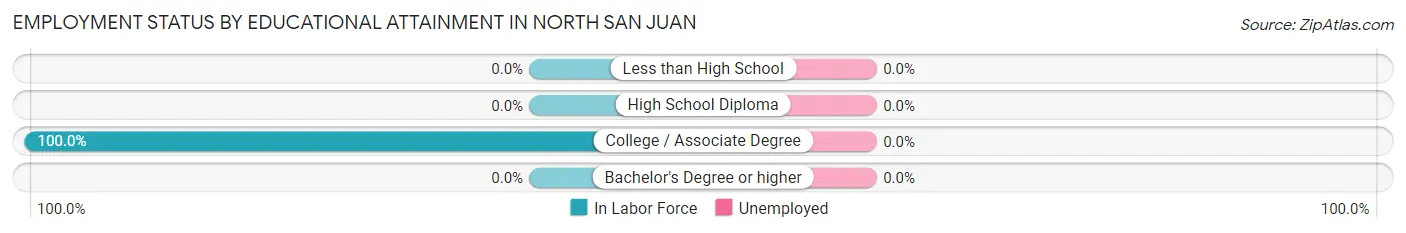
| Educational Attainment | In Labor Force | Unemployed |
| Less than High School | 0 (0.0%) | 0 (0.0%) |
| High School Diploma | 0 (0.0%) | 0 (0.0%) |
| College / Associate Degree | 2 (100.0%) | 0 (0.0%) |
| Bachelor's Degree or higher | 0 (0.0%) | 0 (0.0%) |
| Total | 2 (4.5%) | 0 (0.0%) |
Employment Occupations by Sex in North San Juan
Management, Business, Science and Arts Occupations
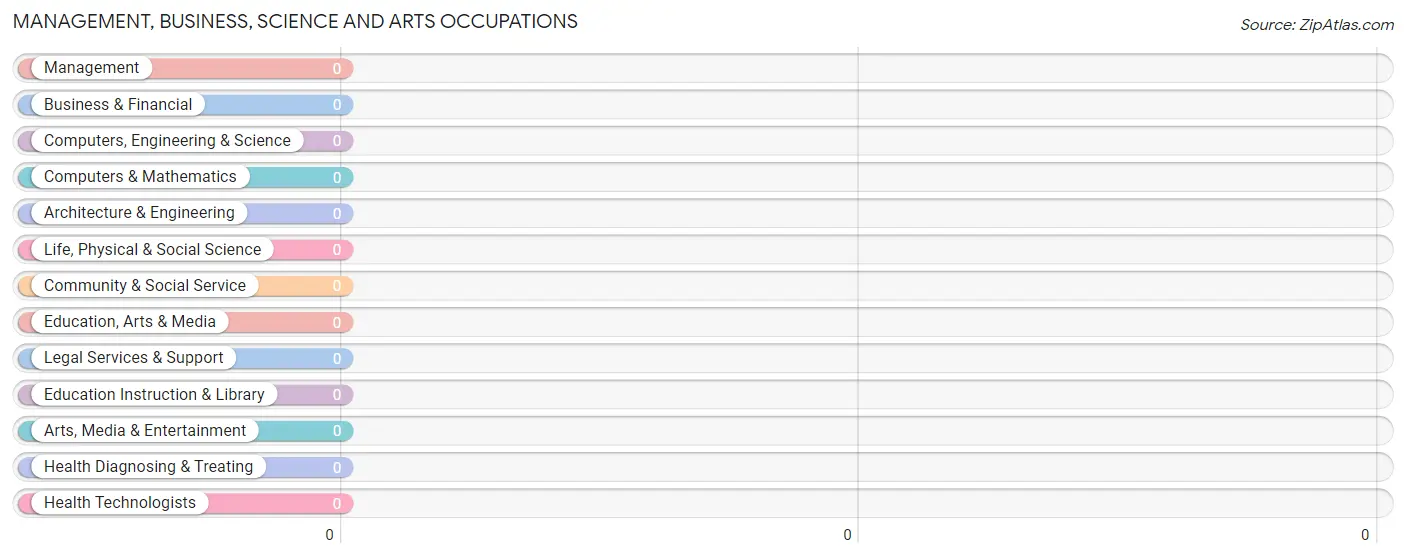
Management, Business, Science and Arts Occupations by Sex
| Occupation | Male | Female |
| Management | 0 (0.0%) | 0 (0.0%) |
| Business & Financial | 0 (0.0%) | 0 (0.0%) |
| Computers, Engineering & Science | 0 (0.0%) | 0 (0.0%) |
| Computers & Mathematics | 0 (0.0%) | 0 (0.0%) |
| Architecture & Engineering | 0 (0.0%) | 0 (0.0%) |
| Life, Physical & Social Science | 0 (0.0%) | 0 (0.0%) |
| Community & Social Service | 0 (0.0%) | 0 (0.0%) |
| Education, Arts & Media | 0 (0.0%) | 0 (0.0%) |
| Legal Services & Support | 0 (0.0%) | 0 (0.0%) |
| Education Instruction & Library | 0 (0.0%) | 0 (0.0%) |
| Arts, Media & Entertainment | 0 (0.0%) | 0 (0.0%) |
| Health Diagnosing & Treating | 0 (0.0%) | 0 (0.0%) |
| Health Technologists | 0 (0.0%) | 0 (0.0%) |
| Total (Category) | 0 (0.0%) | 0 (0.0%) |
| Total (Overall) | 0 (0.0%) | 2 (100.0%) |
Services Occupations
The most common Services occupations in North San Juan are , and Food Preparation & Serving (2 | 100.0%).
Services Occupations by Sex
| Occupation | Male | Female |
| Healthcare Support | 0 (0.0%) | 0 (0.0%) |
| Security & Protection | 0 (0.0%) | 0 (0.0%) |
| Firefighting & Prevention | 0 (0.0%) | 0 (0.0%) |
| Law Enforcement | 0 (0.0%) | 0 (0.0%) |
| Food Preparation & Serving | 0 (0.0%) | 2 (100.0%) |
| Cleaning & Maintenance | 0 (0.0%) | 0 (0.0%) |
| Personal Care & Service | 0 (0.0%) | 0 (0.0%) |
| Total (Category) | 0 (0.0%) | 2 (100.0%) |
| Total (Overall) | 0 (0.0%) | 2 (100.0%) |
Sales and Office Occupations
Sales and Office Occupations by Sex
| Occupation | Male | Female |
| Sales & Related | 0 (0.0%) | 0 (0.0%) |
| Office & Administration | 0 (0.0%) | 0 (0.0%) |
| Total (Category) | 0 (0.0%) | 0 (0.0%) |
| Total (Overall) | 0 (0.0%) | 2 (100.0%) |
Natural Resources, Construction and Maintenance Occupations
Natural Resources, Construction and Maintenance Occupations by Sex
| Occupation | Male | Female |
| Farming, Fishing & Forestry | 0 (0.0%) | 0 (0.0%) |
| Construction & Extraction | 0 (0.0%) | 0 (0.0%) |
| Installation, Maintenance & Repair | 0 (0.0%) | 0 (0.0%) |
| Total (Category) | 0 (0.0%) | 0 (0.0%) |
| Total (Overall) | 0 (0.0%) | 2 (100.0%) |
Production, Transportation and Moving Occupations
Production, Transportation and Moving Occupations by Sex
| Occupation | Male | Female |
| Production | 0 (0.0%) | 0 (0.0%) |
| Transportation | 0 (0.0%) | 0 (0.0%) |
| Material Moving | 0 (0.0%) | 0 (0.0%) |
| Total (Category) | 0 (0.0%) | 0 (0.0%) |
| Total (Overall) | 0 (0.0%) | 2 (100.0%) |
Employment Industries by Sex in North San Juan
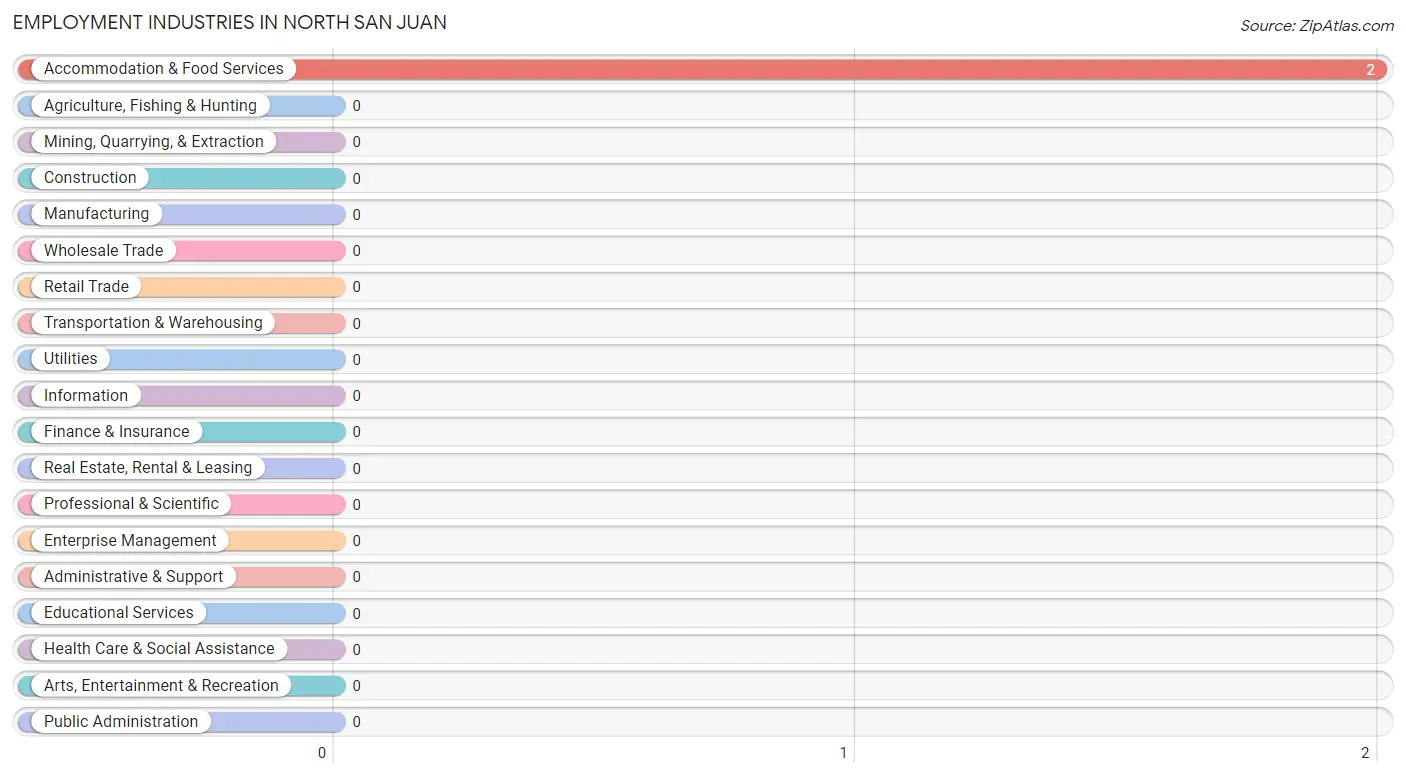
Employment Industries in North San Juan
The major employment industries in North San Juan include , and Accommodation & Food Services (2 | 100.0%).
Employment Industries by Sex in North San Juan
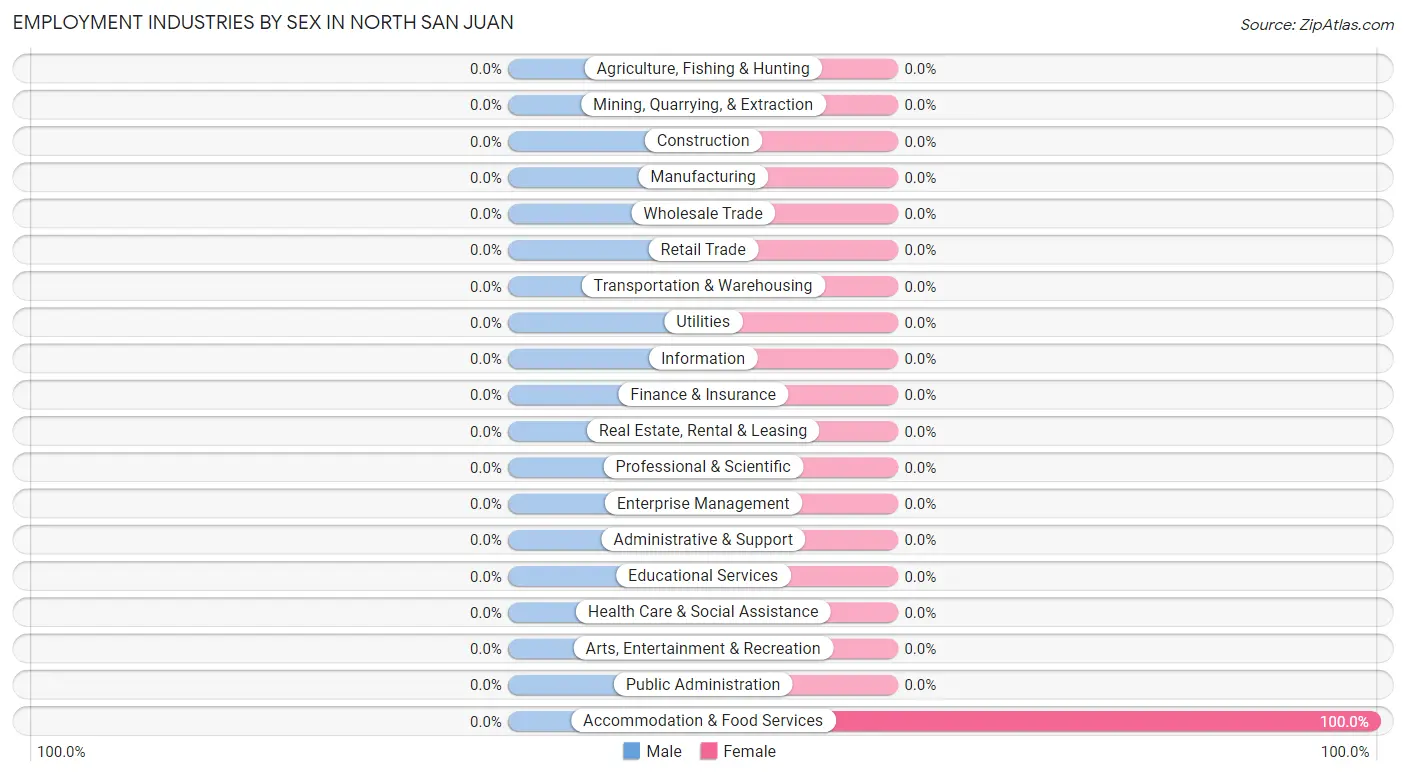
| Industry | Male | Female |
| Agriculture, Fishing & Hunting | 0 (0.0%) | 0 (0.0%) |
| Mining, Quarrying, & Extraction | 0 (0.0%) | 0 (0.0%) |
| Construction | 0 (0.0%) | 0 (0.0%) |
| Manufacturing | 0 (0.0%) | 0 (0.0%) |
| Wholesale Trade | 0 (0.0%) | 0 (0.0%) |
| Retail Trade | 0 (0.0%) | 0 (0.0%) |
| Transportation & Warehousing | 0 (0.0%) | 0 (0.0%) |
| Utilities | 0 (0.0%) | 0 (0.0%) |
| Information | 0 (0.0%) | 0 (0.0%) |
| Finance & Insurance | 0 (0.0%) | 0 (0.0%) |
| Real Estate, Rental & Leasing | 0 (0.0%) | 0 (0.0%) |
| Professional & Scientific | 0 (0.0%) | 0 (0.0%) |
| Enterprise Management | 0 (0.0%) | 0 (0.0%) |
| Administrative & Support | 0 (0.0%) | 0 (0.0%) |
| Educational Services | 0 (0.0%) | 0 (0.0%) |
| Health Care & Social Assistance | 0 (0.0%) | 0 (0.0%) |
| Arts, Entertainment & Recreation | 0 (0.0%) | 0 (0.0%) |
| Accommodation & Food Services | 0 (0.0%) | 2 (100.0%) |
| Public Administration | 0 (0.0%) | 0 (0.0%) |
| Total | 0 (0.0%) | 2 (100.0%) |
Education in North San Juan
School Enrollment in North San Juan
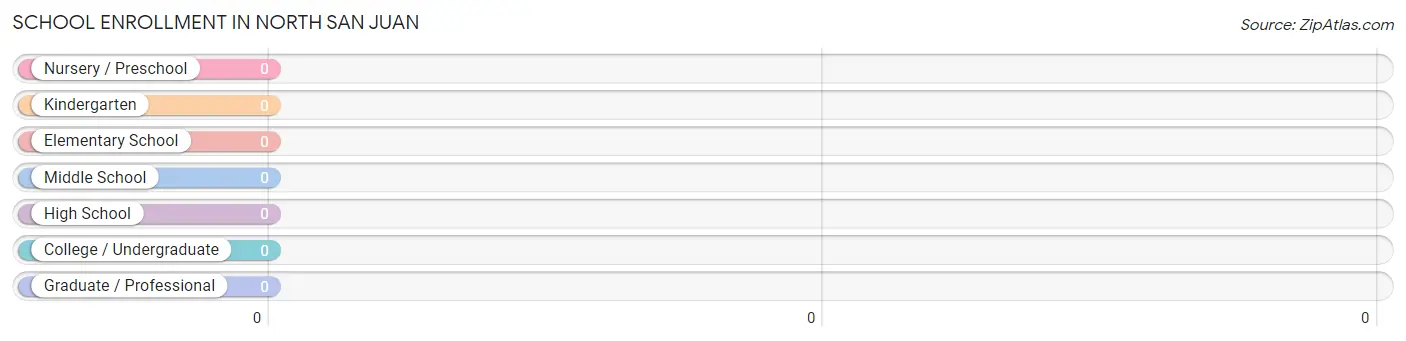
| School Level | # Students | % Students |
| Nursery / Preschool | 0 | 0.0% |
| Kindergarten | 0 | 0.0% |
| Elementary School | 0 | 0.0% |
| Middle School | 0 | 0.0% |
| High School | 0 | 0.0% |
| College / Undergraduate | 0 | 0.0% |
| Graduate / Professional | 0 | 0.0% |
| Total | 0 | 0.0% |
School Enrollment by Age by Funding Source in North San Juan
| Age Bracket | Public School | Private School |
| 3 to 4 Year Olds | 0 (0.0%) | 0 (0.0%) |
| 5 to 9 Year Old | 0 (0.0%) | 0 (0.0%) |
| 10 to 14 Year Olds | 0 (0.0%) | 0 (0.0%) |
| 15 to 17 Year Olds | 0 (0.0%) | 0 (0.0%) |
| 18 to 19 Year Olds | 0 (0.0%) | 0 (0.0%) |
| 20 to 24 Year Olds | 0 (0.0%) | 0 (0.0%) |
| 25 to 34 Year Olds | 0 (0.0%) | 0 (0.0%) |
| 35 Years and over | 0 (0.0%) | 0 (0.0%) |
| Total | 0 (0.0%) | 0 (0.0%) |
Educational Attainment by Field of Study in North San Juan
Arts & humanities (17 | 56.7%), and social sciences (13 | 43.3%) are the most common fields of study among 30 individuals in North San Juan who have obtained a bachelor's degree or higher.
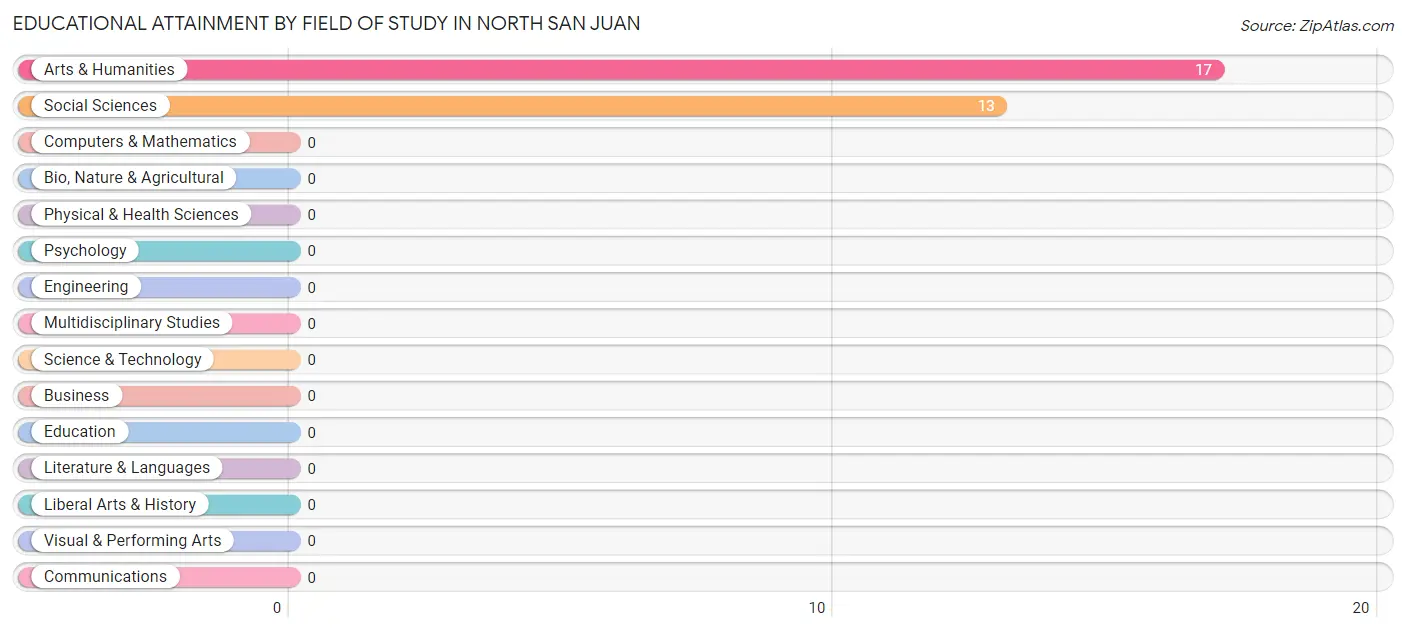
| Field of Study | # Graduates | % Graduates |
| Computers & Mathematics | 0 | 0.0% |
| Bio, Nature & Agricultural | 0 | 0.0% |
| Physical & Health Sciences | 0 | 0.0% |
| Psychology | 0 | 0.0% |
| Social Sciences | 13 | 43.3% |
| Engineering | 0 | 0.0% |
| Multidisciplinary Studies | 0 | 0.0% |
| Science & Technology | 0 | 0.0% |
| Business | 0 | 0.0% |
| Education | 0 | 0.0% |
| Literature & Languages | 0 | 0.0% |
| Liberal Arts & History | 0 | 0.0% |
| Visual & Performing Arts | 0 | 0.0% |
| Communications | 0 | 0.0% |
| Arts & Humanities | 17 | 56.7% |
| Total | 30 | 100.0% |
Transportation & Commute in North San Juan
Vehicle Availability by Sex in North San Juan
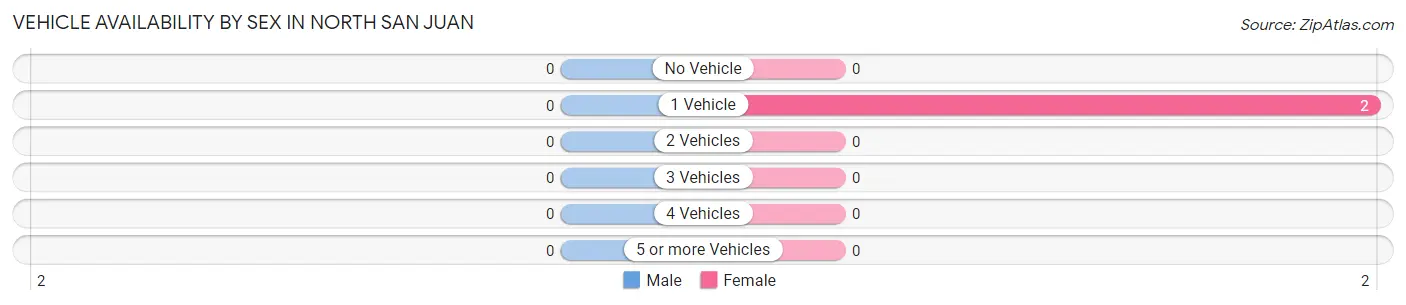
| Vehicles Available | Male | Female |
| No Vehicle | 0 (0.0%) | 0 (0.0%) |
| 1 Vehicle | 0 (0.0%) | 2 (100.0%) |
| 2 Vehicles | 0 (0.0%) | 0 (0.0%) |
| 3 Vehicles | 0 (0.0%) | 0 (0.0%) |
| 4 Vehicles | 0 (0.0%) | 0 (0.0%) |
| 5 or more Vehicles | 0 (0.0%) | 0 (0.0%) |
| Total | 0 (0.0%) | 2 (100.0%) |
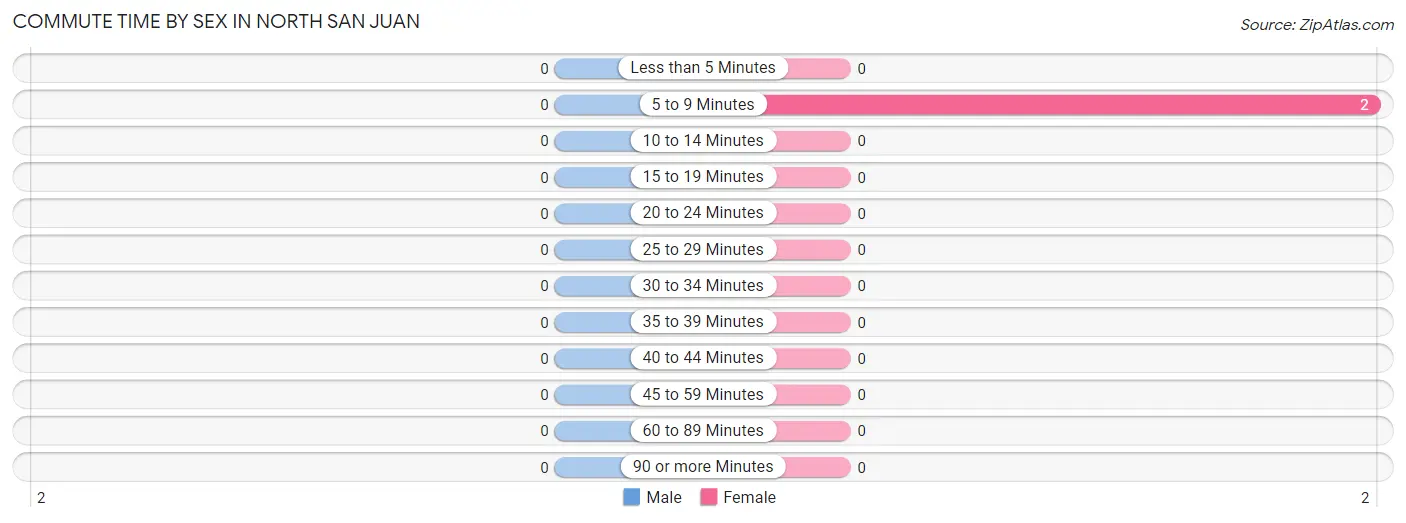
Commute Time in North San Juan
The most frequently occuring commute durations in North San Juan are 5 to 9 minutes (2 commuters, 100.0%), less than 5 minutes (0 commuters, 0.0%), and 10 to 14 minutes (0 commuters, 0.0%).
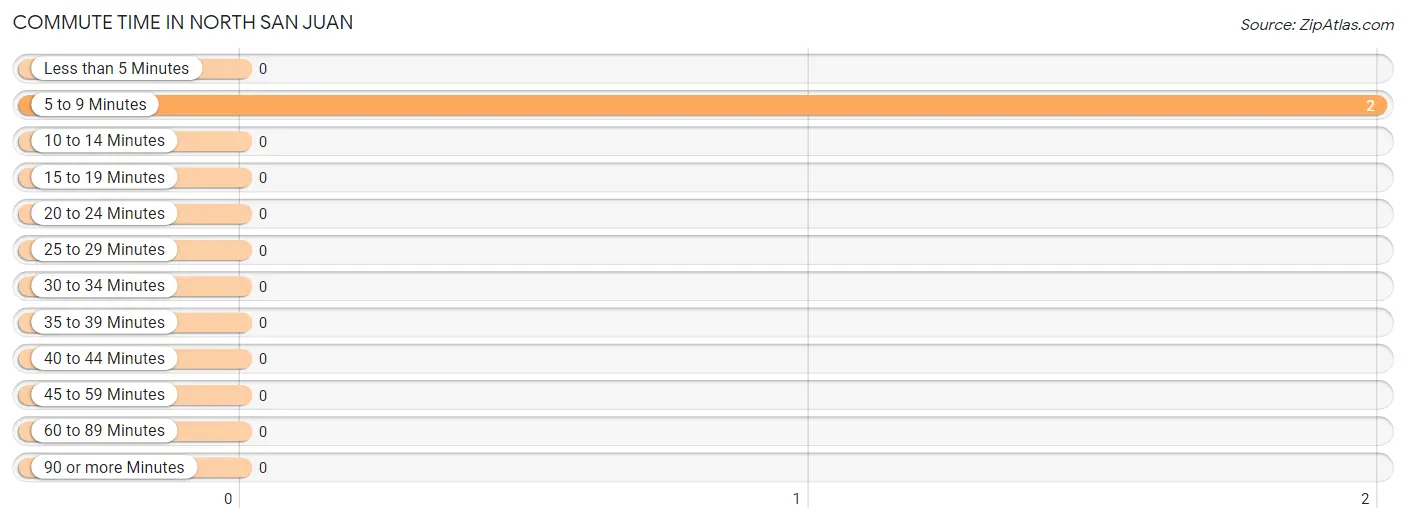
| Commute Time | # Commuters | % Commuters |
| Less than 5 Minutes | 0 | 0.0% |
| 5 to 9 Minutes | 2 | 100.0% |
| 10 to 14 Minutes | 0 | 0.0% |
| 15 to 19 Minutes | 0 | 0.0% |
| 20 to 24 Minutes | 0 | 0.0% |
| 25 to 29 Minutes | 0 | 0.0% |
| 30 to 34 Minutes | 0 | 0.0% |
| 35 to 39 Minutes | 0 | 0.0% |
| 40 to 44 Minutes | 0 | 0.0% |
| 45 to 59 Minutes | 0 | 0.0% |
| 60 to 89 Minutes | 0 | 0.0% |
| 90 or more Minutes | 0 | 0.0% |
Commute Time by Sex in North San Juan
| Commute Time | Male | Female |
| Less than 5 Minutes | 0 (0.0%) | 0 (0.0%) |
| 5 to 9 Minutes | 0 (0.0%) | 2 (100.0%) |
| 10 to 14 Minutes | 0 (0.0%) | 0 (0.0%) |
| 15 to 19 Minutes | 0 (0.0%) | 0 (0.0%) |
| 20 to 24 Minutes | 0 (0.0%) | 0 (0.0%) |
| 25 to 29 Minutes | 0 (0.0%) | 0 (0.0%) |
| 30 to 34 Minutes | 0 (0.0%) | 0 (0.0%) |
| 35 to 39 Minutes | 0 (0.0%) | 0 (0.0%) |
| 40 to 44 Minutes | 0 (0.0%) | 0 (0.0%) |
| 45 to 59 Minutes | 0 (0.0%) | 0 (0.0%) |
| 60 to 89 Minutes | 0 (0.0%) | 0 (0.0%) |
| 90 or more Minutes | 0 (0.0%) | 0 (0.0%) |
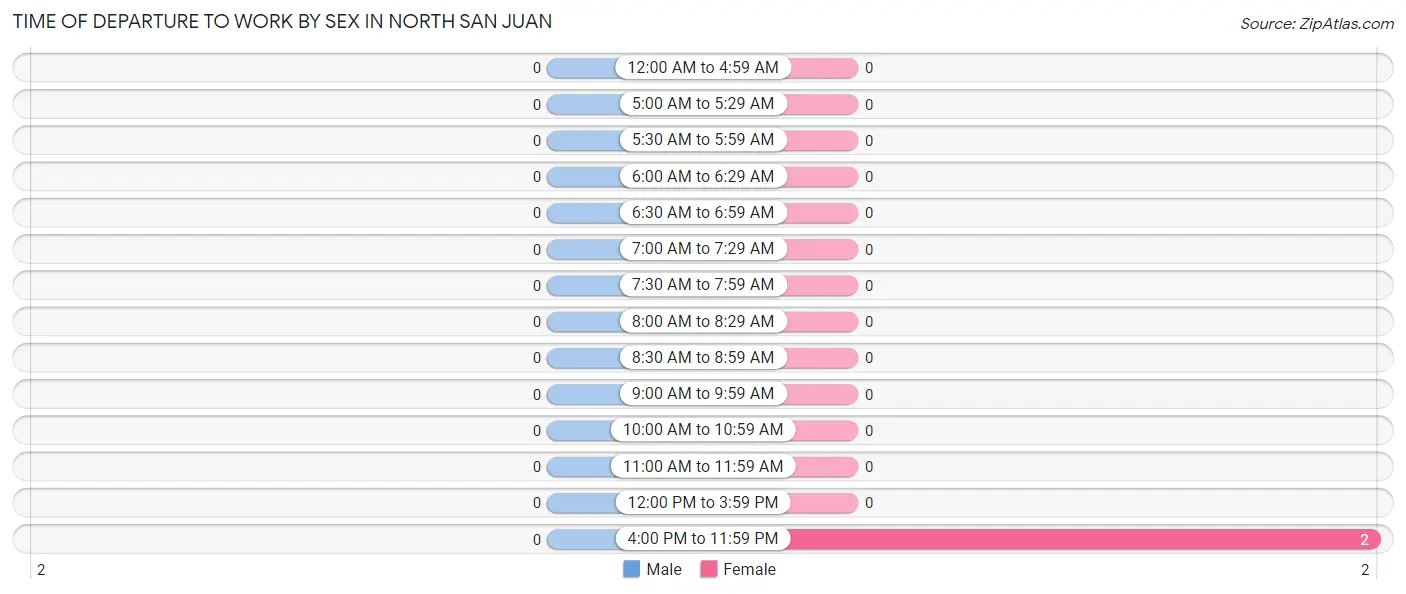
Time of Departure to Work by Sex in North San Juan
| Time of Departure | Male | Female |
| 12:00 AM to 4:59 AM | 0 (0.0%) | 0 (0.0%) |
| 5:00 AM to 5:29 AM | 0 (0.0%) | 0 (0.0%) |
| 5:30 AM to 5:59 AM | 0 (0.0%) | 0 (0.0%) |
| 6:00 AM to 6:29 AM | 0 (0.0%) | 0 (0.0%) |
| 6:30 AM to 6:59 AM | 0 (0.0%) | 0 (0.0%) |
| 7:00 AM to 7:29 AM | 0 (0.0%) | 0 (0.0%) |
| 7:30 AM to 7:59 AM | 0 (0.0%) | 0 (0.0%) |
| 8:00 AM to 8:29 AM | 0 (0.0%) | 0 (0.0%) |
| 8:30 AM to 8:59 AM | 0 (0.0%) | 0 (0.0%) |
| 9:00 AM to 9:59 AM | 0 (0.0%) | 0 (0.0%) |
| 10:00 AM to 10:59 AM | 0 (0.0%) | 0 (0.0%) |
| 11:00 AM to 11:59 AM | 0 (0.0%) | 0 (0.0%) |
| 12:00 PM to 3:59 PM | 0 (0.0%) | 0 (0.0%) |
| 4:00 PM to 11:59 PM | 0 (0.0%) | 2 (100.0%) |
| Total | 0 (0.0%) | 2 (100.0%) |
Housing Occupancy in North San Juan
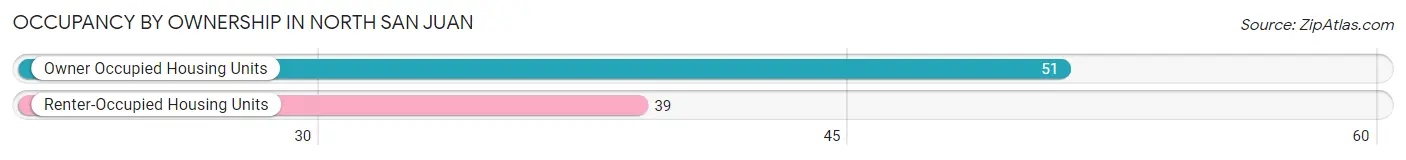
Occupancy by Ownership in North San Juan
Of the total 90 dwellings in North San Juan, owner-occupied units account for 51 (56.7%), while renter-occupied units make up 39 (43.3%).
| Occupancy | # Housing Units | % Housing Units |
| Owner Occupied Housing Units | 51 | 56.7% |
| Renter-Occupied Housing Units | 39 | 43.3% |
| Total Occupied Housing Units | 90 | 100.0% |
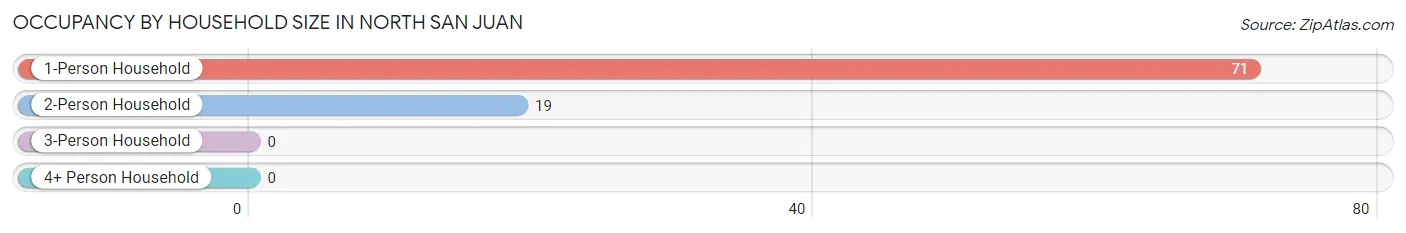
Occupancy by Household Size in North San Juan
| Household Size | # Housing Units | % Housing Units |
| 1-Person Household | 71 | 78.9% |
| 2-Person Household | 19 | 21.1% |
| 3-Person Household | 0 | 0.0% |
| 4+ Person Household | 0 | 0.0% |
| Total Housing Units | 90 | 100.0% |
Occupancy by Ownership by Household Size in North San Juan
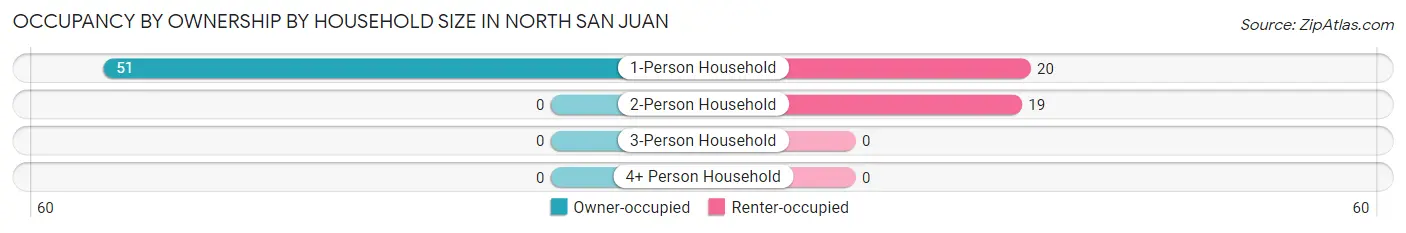
| Household Size | Owner-occupied | Renter-occupied |
| 1-Person Household | 51 (71.8%) | 20 (28.2%) |
| 2-Person Household | 0 (0.0%) | 19 (100.0%) |
| 3-Person Household | 0 (0.0%) | 0 (0.0%) |
| 4+ Person Household | 0 (0.0%) | 0 (0.0%) |
| Total Housing Units | 51 (56.7%) | 39 (43.3%) |
Occupancy by Educational Attainment in North San Juan
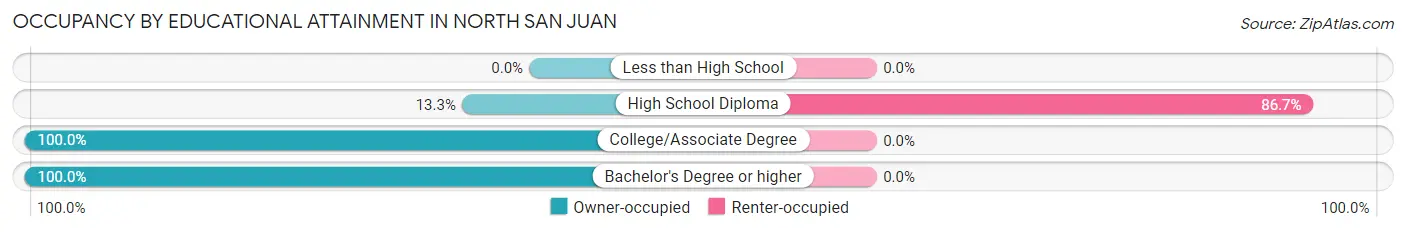
| Household Size | Owner-occupied | Renter-occupied |
| Less than High School | 0 (0.0%) | 0 (0.0%) |
| High School Diploma | 6 (13.3%) | 39 (86.7%) |
| College/Associate Degree | 15 (100.0%) | 0 (0.0%) |
| Bachelor's Degree or higher | 30 (100.0%) | 0 (0.0%) |
Occupancy by Age of Householder in North San Juan
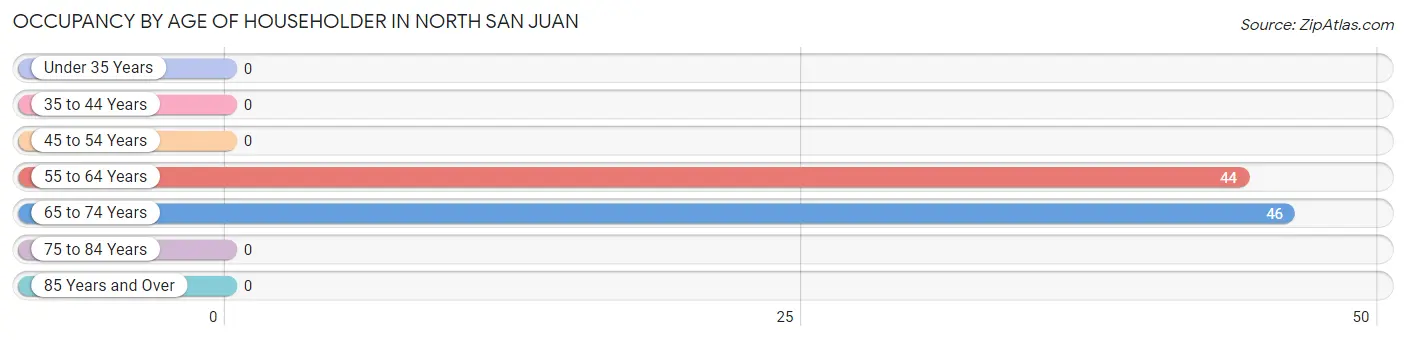
| Age Bracket | # Households | % Households |
| Under 35 Years | 0 | 0.0% |
| 35 to 44 Years | 0 | 0.0% |
| 45 to 54 Years | 0 | 0.0% |
| 55 to 64 Years | 44 | 48.9% |
| 65 to 74 Years | 46 | 51.1% |
| 75 to 84 Years | 0 | 0.0% |
| 85 Years and Over | 0 | 0.0% |
| Total | 90 | 100.0% |
Housing Finances in North San Juan
Median Income by Occupancy in North San Juan
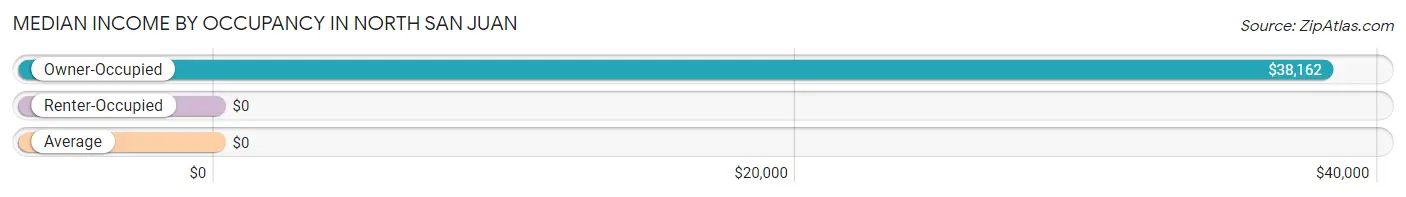
| Occupancy Type | # Households | Median Income |
| Owner-Occupied | 51 (56.7%) | $38,162 |
| Renter-Occupied | 39 (43.3%) | $0 |
| Average | 90 (100.0%) | $0 |
Occupancy by Householder Income Bracket in North San Juan
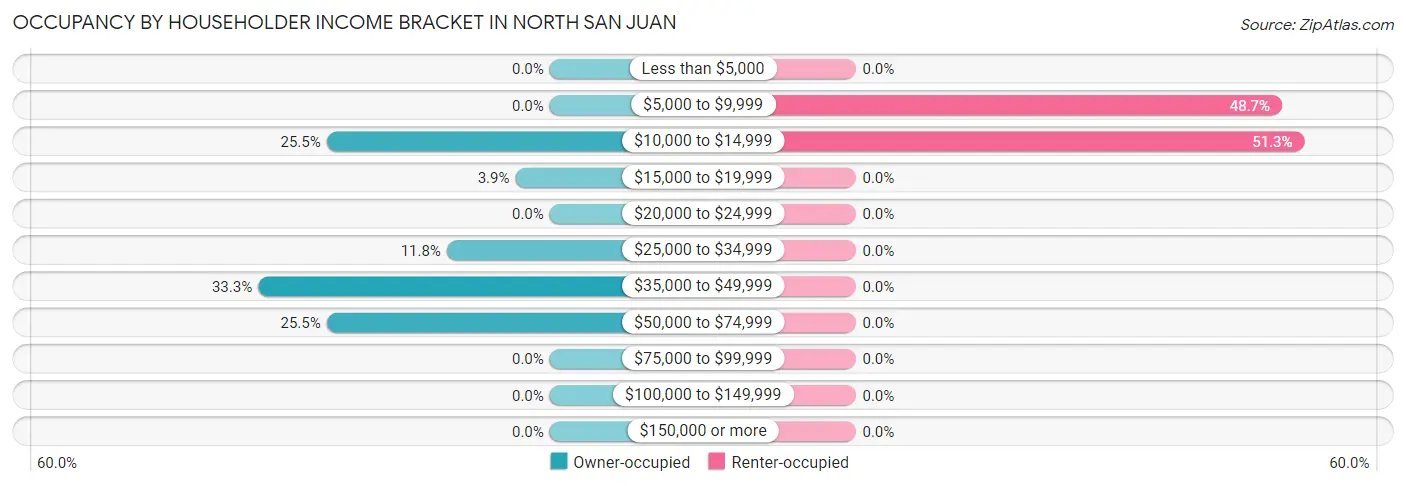
| Income Bracket | Owner-occupied | Renter-occupied |
| Less than $5,000 | 0 (0.0%) | 0 (0.0%) |
| $5,000 to $9,999 | 0 (0.0%) | 19 (48.7%) |
| $10,000 to $14,999 | 13 (25.5%) | 20 (51.3%) |
| $15,000 to $19,999 | 2 (3.9%) | 0 (0.0%) |
| $20,000 to $24,999 | 0 (0.0%) | 0 (0.0%) |
| $25,000 to $34,999 | 6 (11.8%) | 0 (0.0%) |
| $35,000 to $49,999 | 17 (33.3%) | 0 (0.0%) |
| $50,000 to $74,999 | 13 (25.5%) | 0 (0.0%) |
| $75,000 to $99,999 | 0 (0.0%) | 0 (0.0%) |
| $100,000 to $149,999 | 0 (0.0%) | 0 (0.0%) |
| $150,000 or more | 0 (0.0%) | 0 (0.0%) |
| Total | 51 (100.0%) | 39 (100.0%) |
Monthly Housing Cost Tiers in North San Juan
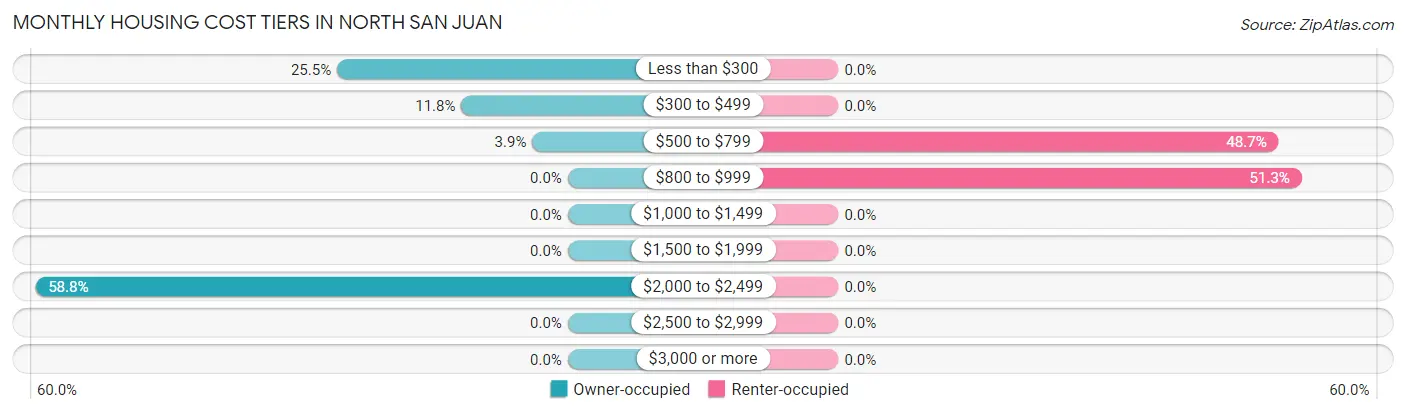
| Monthly Cost | Owner-occupied | Renter-occupied |
| Less than $300 | 13 (25.5%) | 0 (0.0%) |
| $300 to $499 | 6 (11.8%) | 0 (0.0%) |
| $500 to $799 | 2 (3.9%) | 19 (48.7%) |
| $800 to $999 | 0 (0.0%) | 20 (51.3%) |
| $1,000 to $1,499 | 0 (0.0%) | 0 (0.0%) |
| $1,500 to $1,999 | 0 (0.0%) | 0 (0.0%) |
| $2,000 to $2,499 | 30 (58.8%) | 0 (0.0%) |
| $2,500 to $2,999 | 0 (0.0%) | 0 (0.0%) |
| $3,000 or more | 0 (0.0%) | 0 (0.0%) |
| Total | 51 (100.0%) | 39 (100.0%) |
Physical Housing Characteristics in North San Juan
Housing Structures in North San Juan
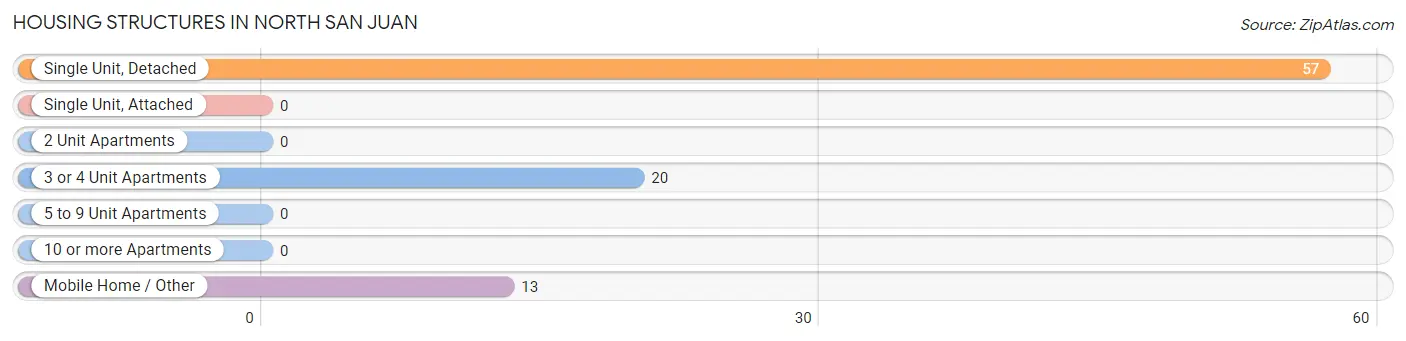
| Structure Type | # Housing Units | % Housing Units |
| Single Unit, Detached | 57 | 63.3% |
| Single Unit, Attached | 0 | 0.0% |
| 2 Unit Apartments | 0 | 0.0% |
| 3 or 4 Unit Apartments | 20 | 22.2% |
| 5 to 9 Unit Apartments | 0 | 0.0% |
| 10 or more Apartments | 0 | 0.0% |
| Mobile Home / Other | 13 | 14.4% |
| Total | 90 | 100.0% |
Housing Structures by Occupancy in North San Juan
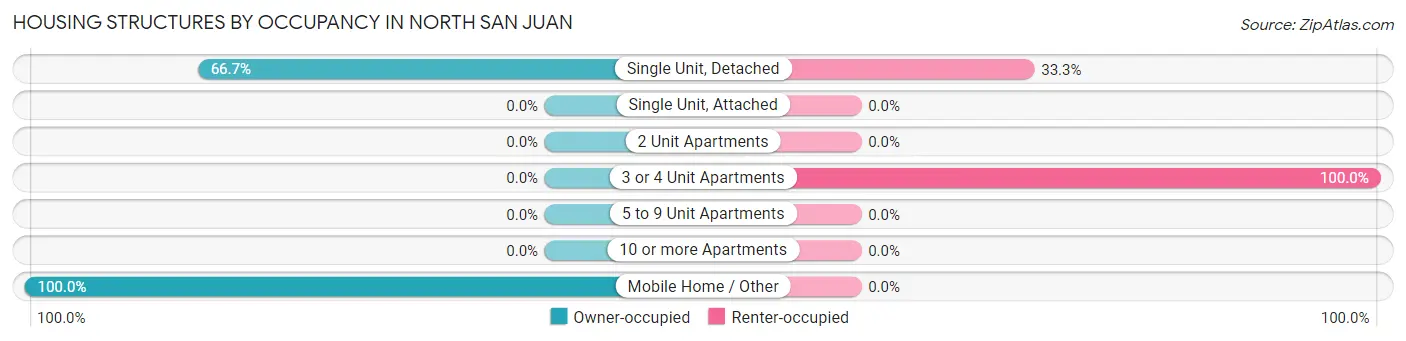
| Structure Type | Owner-occupied | Renter-occupied |
| Single Unit, Detached | 38 (66.7%) | 19 (33.3%) |
| Single Unit, Attached | 0 (0.0%) | 0 (0.0%) |
| 2 Unit Apartments | 0 (0.0%) | 0 (0.0%) |
| 3 or 4 Unit Apartments | 0 (0.0%) | 20 (100.0%) |
| 5 to 9 Unit Apartments | 0 (0.0%) | 0 (0.0%) |
| 10 or more Apartments | 0 (0.0%) | 0 (0.0%) |
| Mobile Home / Other | 13 (100.0%) | 0 (0.0%) |
| Total | 51 (56.7%) | 39 (43.3%) |
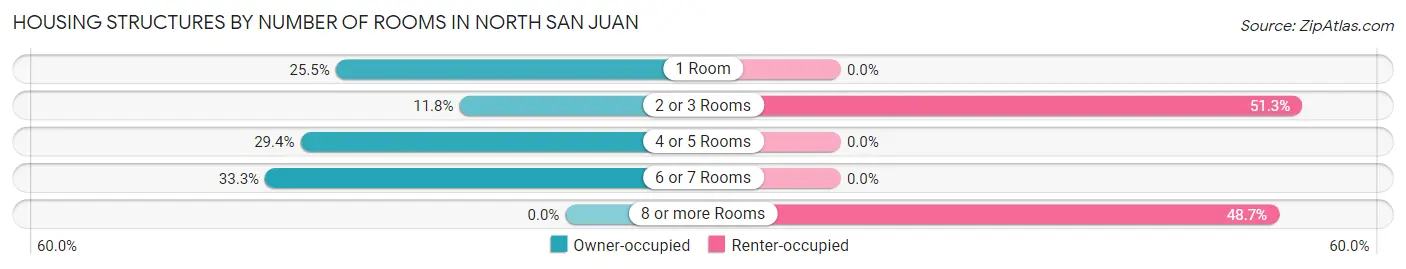
Housing Structures by Number of Rooms in North San Juan
| Number of Rooms | Owner-occupied | Renter-occupied |
| 1 Room | 13 (25.5%) | 0 (0.0%) |
| 2 or 3 Rooms | 6 (11.8%) | 20 (51.3%) |
| 4 or 5 Rooms | 15 (29.4%) | 0 (0.0%) |
| 6 or 7 Rooms | 17 (33.3%) | 0 (0.0%) |
| 8 or more Rooms | 0 (0.0%) | 19 (48.7%) |
| Total | 51 (100.0%) | 39 (100.0%) |
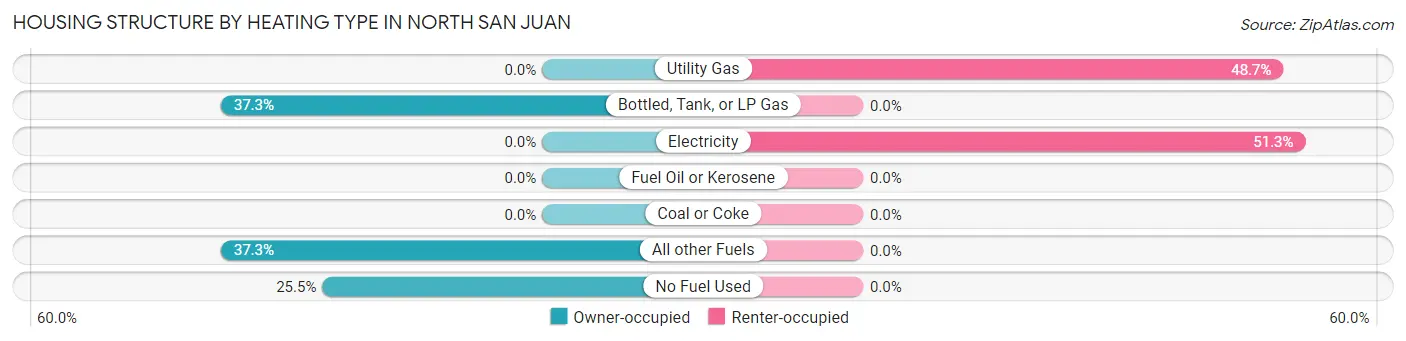
Housing Structure by Heating Type in North San Juan
| Heating Type | Owner-occupied | Renter-occupied |
| Utility Gas | 0 (0.0%) | 19 (48.7%) |
| Bottled, Tank, or LP Gas | 19 (37.2%) | 0 (0.0%) |
| Electricity | 0 (0.0%) | 20 (51.3%) |
| Fuel Oil or Kerosene | 0 (0.0%) | 0 (0.0%) |
| Coal or Coke | 0 (0.0%) | 0 (0.0%) |
| All other Fuels | 19 (37.2%) | 0 (0.0%) |
| No Fuel Used | 13 (25.5%) | 0 (0.0%) |
| Total | 51 (100.0%) | 39 (100.0%) |
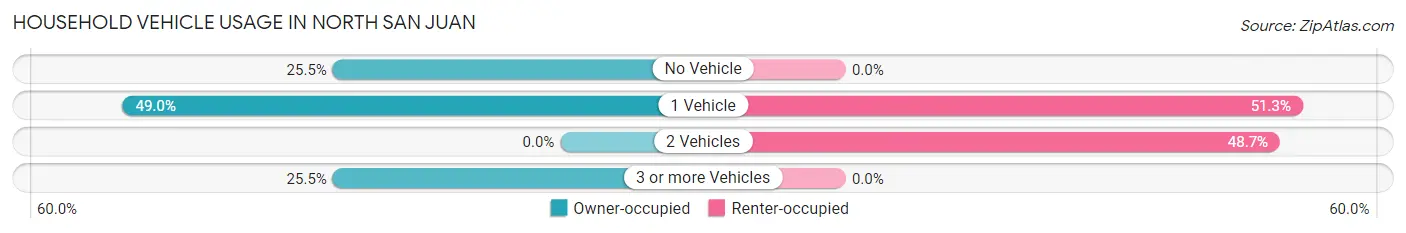
Household Vehicle Usage in North San Juan
| Vehicles per Household | Owner-occupied | Renter-occupied |
| No Vehicle | 13 (25.5%) | 0 (0.0%) |
| 1 Vehicle | 25 (49.0%) | 20 (51.3%) |
| 2 Vehicles | 0 (0.0%) | 19 (48.7%) |
| 3 or more Vehicles | 13 (25.5%) | 0 (0.0%) |
| Total | 51 (100.0%) | 39 (100.0%) |
Real Estate & Mortgages in North San Juan
Real Estate and Mortgage Overview in North San Juan
| Characteristic | Without Mortgage | With Mortgage |
| Housing Units | 21 | 30 |
| Median Property Value | - | - |
| Median Household Income | - | - |
| Monthly Housing Costs | $99 | $0 |
| Real Estate Taxes | - | - |
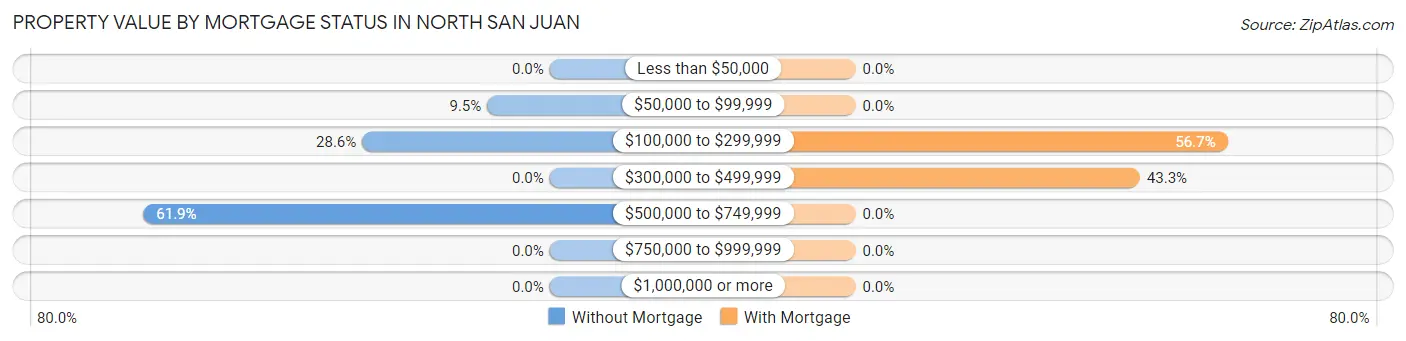
Property Value by Mortgage Status in North San Juan
| Property Value | Without Mortgage | With Mortgage |
| Less than $50,000 | 0 (0.0%) | 0 (0.0%) |
| $50,000 to $99,999 | 2 (9.5%) | 0 (0.0%) |
| $100,000 to $299,999 | 6 (28.6%) | 17 (56.7%) |
| $300,000 to $499,999 | 0 (0.0%) | 13 (43.3%) |
| $500,000 to $749,999 | 13 (61.9%) | 0 (0.0%) |
| $750,000 to $999,999 | 0 (0.0%) | 0 (0.0%) |
| $1,000,000 or more | 0 (0.0%) | 0 (0.0%) |
| Total | 21 (100.0%) | 30 (100.0%) |
Household Income by Mortgage Status in North San Juan
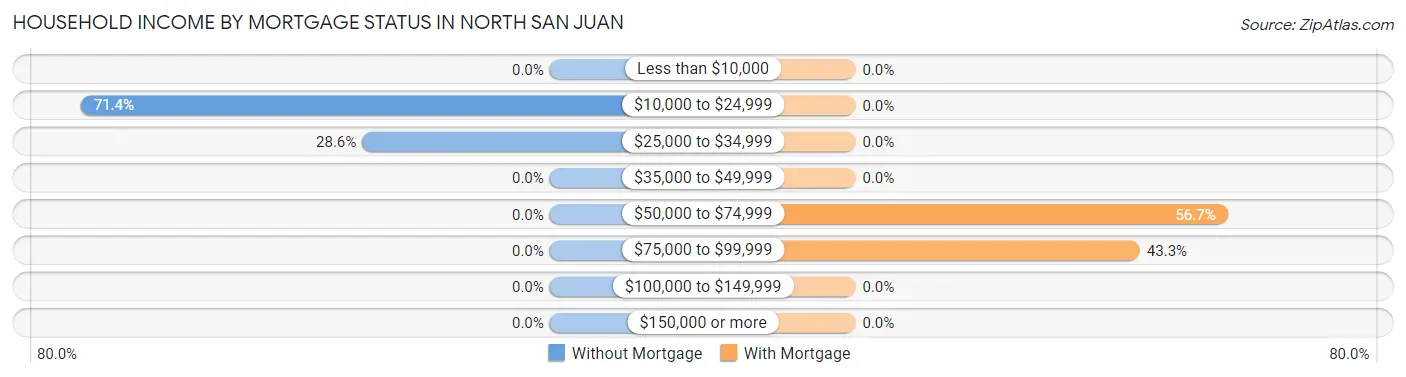
| Household Income | Without Mortgage | With Mortgage |
| Less than $10,000 | 0 (0.0%) | 0 (0.0%) |
| $10,000 to $24,999 | 15 (71.4%) | 0 (0.0%) |
| $25,000 to $34,999 | 6 (28.6%) | 0 (0.0%) |
| $35,000 to $49,999 | 0 (0.0%) | 0 (0.0%) |
| $50,000 to $74,999 | 0 (0.0%) | 17 (56.7%) |
| $75,000 to $99,999 | 0 (0.0%) | 13 (43.3%) |
| $100,000 to $149,999 | 0 (0.0%) | 0 (0.0%) |
| $150,000 or more | 0 (0.0%) | 0 (0.0%) |
| Total | 21 (100.0%) | 30 (100.0%) |
Property Value to Household Income Ratio in North San Juan
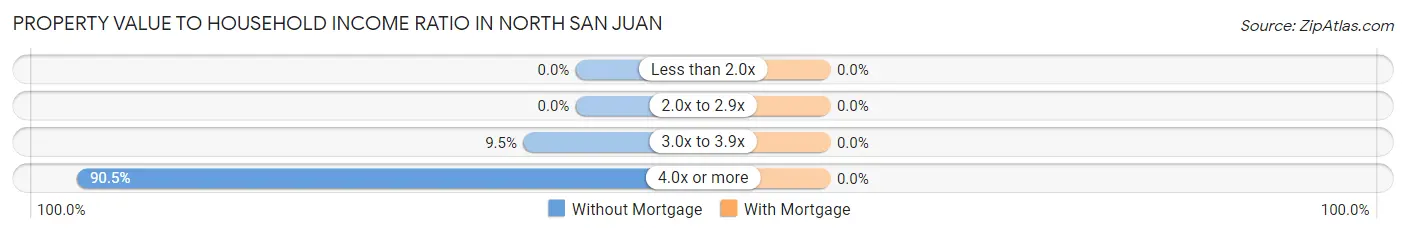
| Value-to-Income Ratio | Without Mortgage | With Mortgage |
| Less than 2.0x | 0 (0.0%) | 0 (0.0%) |
| 2.0x to 2.9x | 0 (0.0%) | 0 (0.0%) |
| 3.0x to 3.9x | 2 (9.5%) | 0 (0.0%) |
| 4.0x or more | 19 (90.5%) | 0 (0.0%) |
| Total | 21 (100.0%) | 30 (100.0%) |
Real Estate Taxes by Mortgage Status in North San Juan
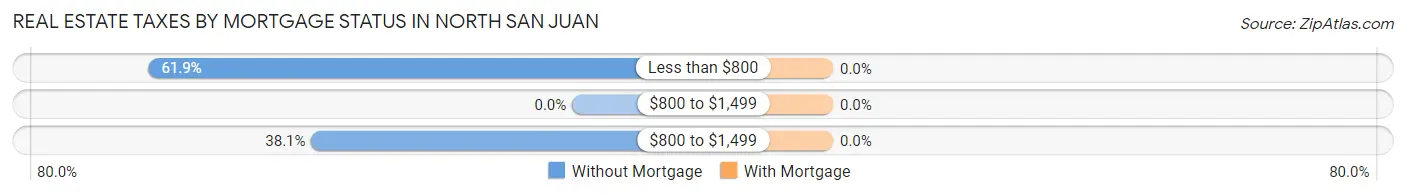
| Property Taxes | Without Mortgage | With Mortgage |
| Less than $800 | 13 (61.9%) | 0 (0.0%) |
| $800 to $1,499 | 0 (0.0%) | 0 (0.0%) |
| $800 to $1,499 | 8 (38.1%) | 0 (0.0%) |
| Total | 21 (100.0%) | 30 (100.0%) |
Health & Disability in North San Juan
Health Insurance Coverage by Age in North San Juan
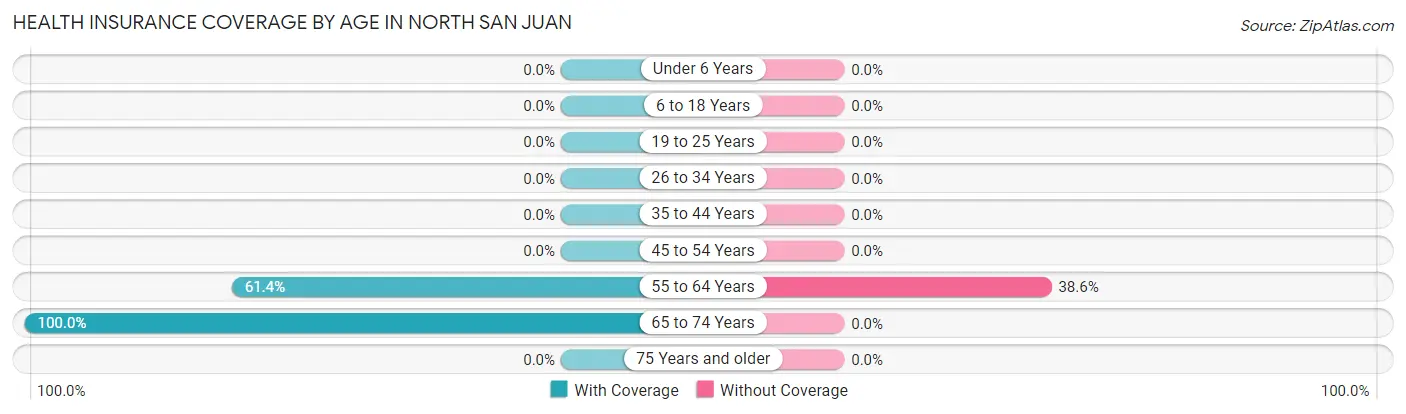
| Age Bracket | With Coverage | Without Coverage |
| Under 6 Years | 0 (0.0%) | 0 (0.0%) |
| 6 to 18 Years | 0 (0.0%) | 0 (0.0%) |
| 19 to 25 Years | 0 (0.0%) | 0 (0.0%) |
| 26 to 34 Years | 0 (0.0%) | 0 (0.0%) |
| 35 to 44 Years | 0 (0.0%) | 0 (0.0%) |
| 45 to 54 Years | 0 (0.0%) | 0 (0.0%) |
| 55 to 64 Years | 27 (61.4%) | 17 (38.6%) |
| 65 to 74 Years | 65 (100.0%) | 0 (0.0%) |
| 75 Years and older | 0 (0.0%) | 0 (0.0%) |
| Total | 92 (84.4%) | 17 (15.6%) |
Health Insurance Coverage by Citizenship Status in North San Juan
| Citizenship Status | With Coverage | Without Coverage |
| Native Born | 0 (0.0%) | 0 (0.0%) |
| Foreign Born, Citizen | 0 (0.0%) | 0 (0.0%) |
| Foreign Born, not a Citizen | 0 (0.0%) | 0 (0.0%) |
Health Insurance Coverage by Household Income in North San Juan
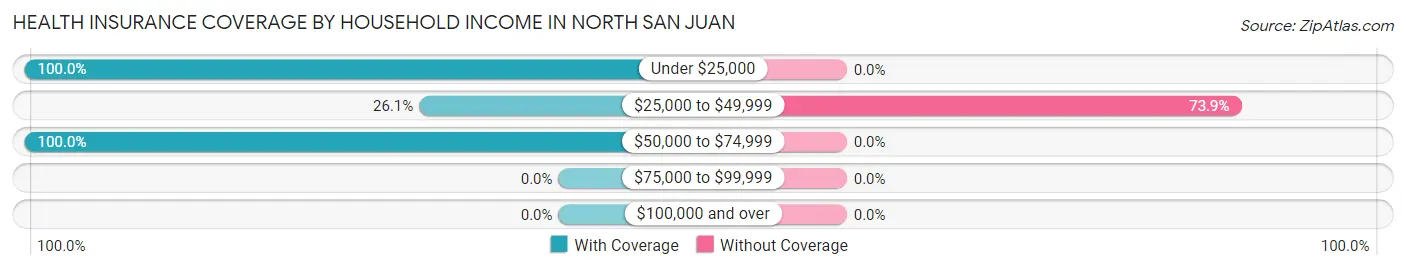
| Household Income | With Coverage | Without Coverage |
| Under $25,000 | 73 (100.0%) | 0 (0.0%) |
| $25,000 to $49,999 | 6 (26.1%) | 17 (73.9%) |
| $50,000 to $74,999 | 13 (100.0%) | 0 (0.0%) |
| $75,000 to $99,999 | 0 (0.0%) | 0 (0.0%) |
| $100,000 and over | 0 (0.0%) | 0 (0.0%) |
Public vs Private Health Insurance Coverage by Age in North San Juan
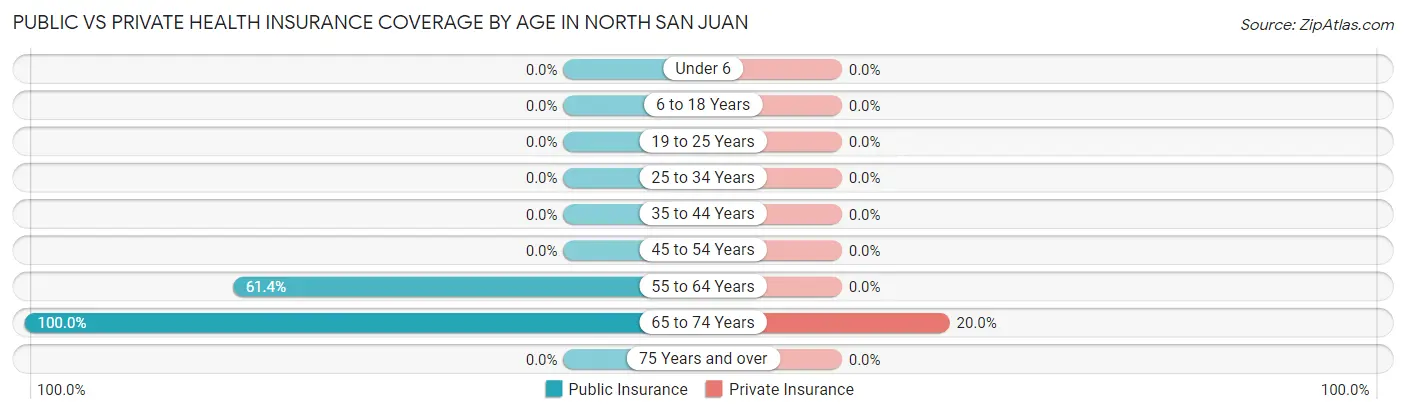
| Age Bracket | Public Insurance | Private Insurance |
| Under 6 | 0 (0.0%) | 0 (0.0%) |
| 6 to 18 Years | 0 (0.0%) | 0 (0.0%) |
| 19 to 25 Years | 0 (0.0%) | 0 (0.0%) |
| 25 to 34 Years | 0 (0.0%) | 0 (0.0%) |
| 35 to 44 Years | 0 (0.0%) | 0 (0.0%) |
| 45 to 54 Years | 0 (0.0%) | 0 (0.0%) |
| 55 to 64 Years | 27 (61.4%) | 0 (0.0%) |
| 65 to 74 Years | 65 (100.0%) | 13 (20.0%) |
| 75 Years and over | 0 (0.0%) | 0 (0.0%) |
| Total | 92 (84.4%) | 13 (11.9%) |
Disability Status by Sex by Age in North San Juan
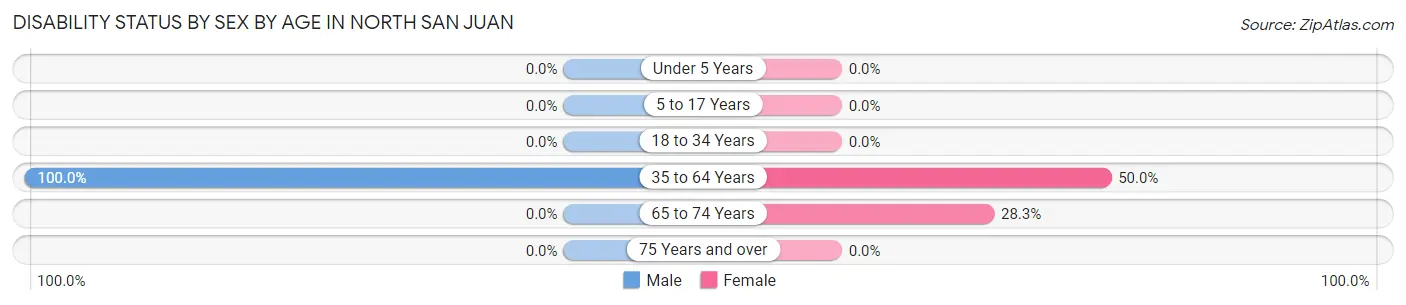
| Age Bracket | Male | Female |
| Under 5 Years | 0 (0.0%) | 0 (0.0%) |
| 5 to 17 Years | 0 (0.0%) | 0 (0.0%) |
| 18 to 34 Years | 0 (0.0%) | 0 (0.0%) |
| 35 to 64 Years | 6 (100.0%) | 19 (50.0%) |
| 65 to 74 Years | 0 (0.0%) | 13 (28.3%) |
| 75 Years and over | 0 (0.0%) | 0 (0.0%) |
Disability Class by Sex by Age in North San Juan
Disability Class: Hearing Difficulty
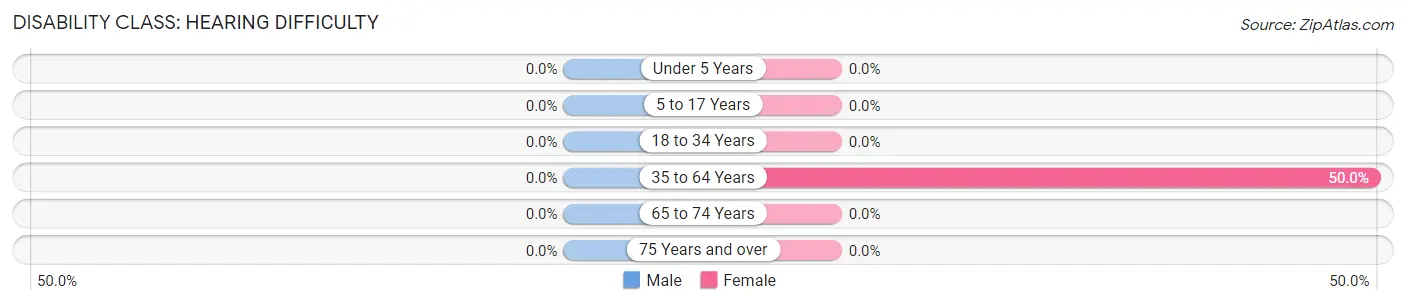
| Age Bracket | Male | Female |
| Under 5 Years | 0 (0.0%) | 0 (0.0%) |
| 5 to 17 Years | 0 (0.0%) | 0 (0.0%) |
| 18 to 34 Years | 0 (0.0%) | 0 (0.0%) |
| 35 to 64 Years | 0 (0.0%) | 19 (50.0%) |
| 65 to 74 Years | 0 (0.0%) | 0 (0.0%) |
| 75 Years and over | 0 (0.0%) | 0 (0.0%) |
Disability Class: Vision Difficulty
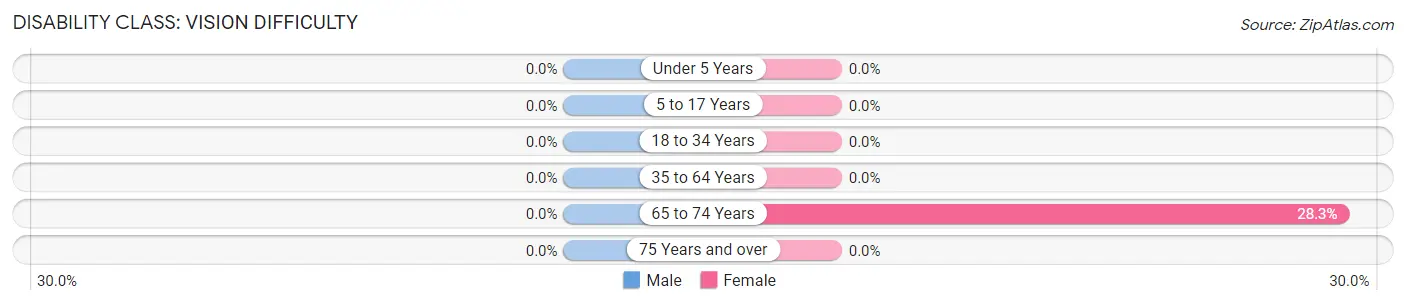
| Age Bracket | Male | Female |
| Under 5 Years | 0 (0.0%) | 0 (0.0%) |
| 5 to 17 Years | 0 (0.0%) | 0 (0.0%) |
| 18 to 34 Years | 0 (0.0%) | 0 (0.0%) |
| 35 to 64 Years | 0 (0.0%) | 0 (0.0%) |
| 65 to 74 Years | 0 (0.0%) | 13 (28.3%) |
| 75 Years and over | 0 (0.0%) | 0 (0.0%) |
Disability Class: Cognitive Difficulty
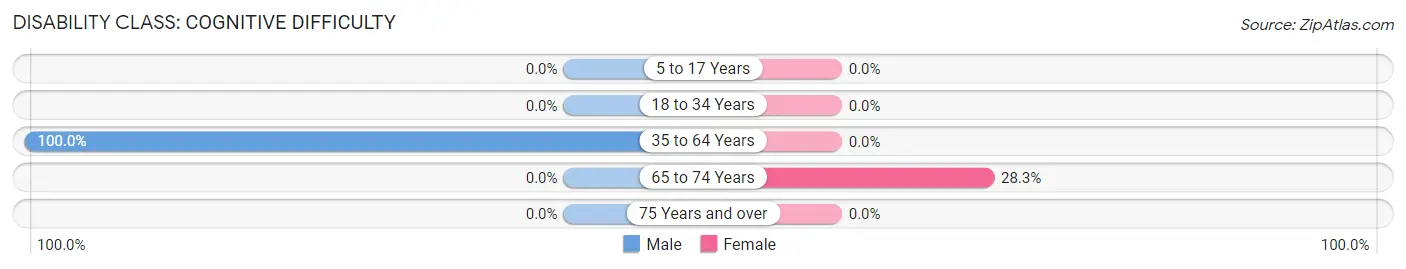
| Age Bracket | Male | Female |
| 5 to 17 Years | 0 (0.0%) | 0 (0.0%) |
| 18 to 34 Years | 0 (0.0%) | 0 (0.0%) |
| 35 to 64 Years | 6 (100.0%) | 0 (0.0%) |
| 65 to 74 Years | 0 (0.0%) | 13 (28.3%) |
| 75 Years and over | 0 (0.0%) | 0 (0.0%) |
Disability Class: Ambulatory Difficulty
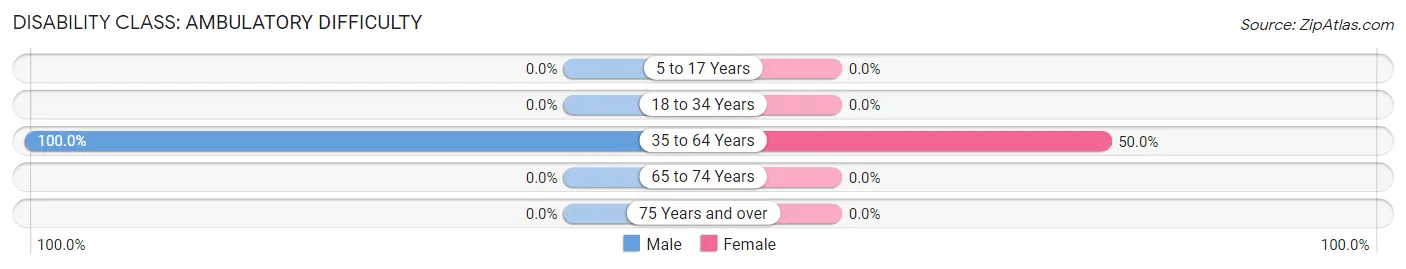
| Age Bracket | Male | Female |
| 5 to 17 Years | 0 (0.0%) | 0 (0.0%) |
| 18 to 34 Years | 0 (0.0%) | 0 (0.0%) |
| 35 to 64 Years | 6 (100.0%) | 19 (50.0%) |
| 65 to 74 Years | 0 (0.0%) | 0 (0.0%) |
| 75 Years and over | 0 (0.0%) | 0 (0.0%) |
Disability Class: Self-Care Difficulty
| Age Bracket | Male | Female |
| 5 to 17 Years | 0 (0.0%) | 0 (0.0%) |
| 18 to 34 Years | 0 (0.0%) | 0 (0.0%) |
| 35 to 64 Years | 0 (0.0%) | 0 (0.0%) |
| 65 to 74 Years | 0 (0.0%) | 0 (0.0%) |
| 75 Years and over | 0 (0.0%) | 0 (0.0%) |
Technology Access in North San Juan
Computing Device Access in North San Juan
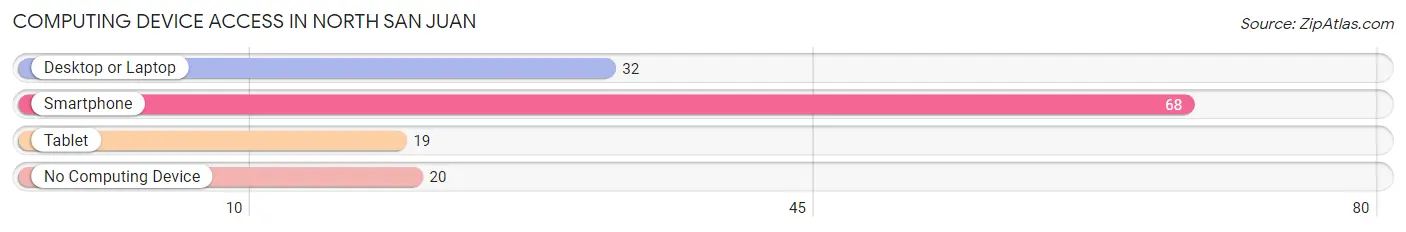
| Device Type | # Households | % Households |
| Desktop or Laptop | 32 | 35.6% |
| Smartphone | 68 | 75.6% |
| Tablet | 19 | 21.1% |
| No Computing Device | 20 | 22.2% |
| Total | 90 | 100.0% |
Internet Access in North San Juan
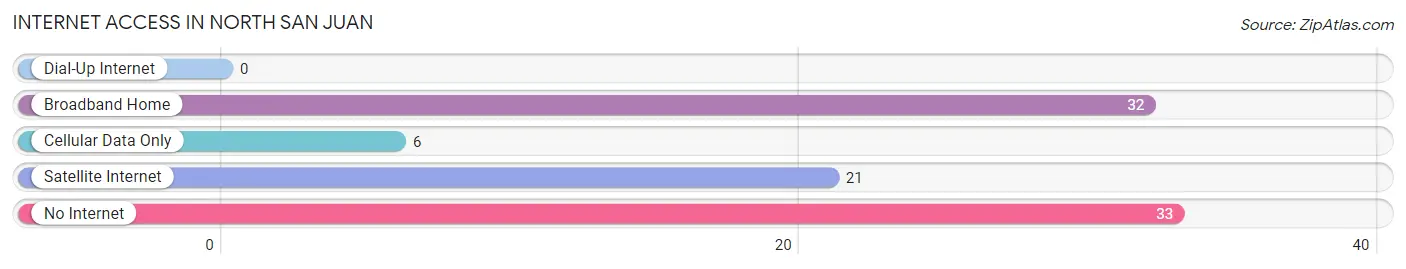
| Internet Type | # Households | % Households |
| Dial-Up Internet | 0 | 0.0% |
| Broadband Home | 32 | 35.6% |
| Cellular Data Only | 6 | 6.7% |
| Satellite Internet | 21 | 23.3% |
| No Internet | 33 | 36.7% |
| Total | 90 | 100.0% |
North San Juan Summary
San Juan is a small unincorporated community located in Nevada County, California. It is situated in the Sierra Nevada foothills, approximately 20 miles north of Nevada City and 40 miles northeast of Sacramento. The town is located along State Route 49, which is a major thoroughfare connecting the Sierra Nevada foothills to the Central Valley. San Juan is a rural community with a population of approximately 1,000 people.
History
San Juan was originally inhabited by the Nisenan Native Americans, who were part of the Maidu tribe. The area was first settled by European-Americans in the mid-1800s, when gold was discovered in the area. The town was named after San Juan Bautista, a Spanish mission located in the area. The town was officially established in 1854, and the first post office was established in 1856.
In the late 1800s, San Juan was a bustling mining town, with several gold mines in the area. The town was also home to several saloons, hotels, and stores. The town was also home to a stagecoach stop, which connected the town to other nearby towns.
In the early 1900s, the gold mines in the area began to decline, and the town began to decline as well. The population of the town decreased, and many of the businesses closed. The town was also affected by the Great Depression, and many of the residents left in search of work.
Geography
San Juan is located in the Sierra Nevada foothills, at an elevation of 2,000 feet. The town is situated along State Route 49, which is a major thoroughfare connecting the Sierra Nevada foothills to the Central Valley. The town is surrounded by rolling hills and is located near several rivers, including the Yuba River and the Bear River.
The climate in San Juan is mild, with hot summers and cool winters. The average high temperature in the summer is around 90 degrees Fahrenheit, and the average low temperature in the winter is around 40 degrees Fahrenheit.
Economy
San Juan is a rural community with a population of approximately 1,000 people. The town is home to several small businesses, including a grocery store, a hardware store, and a few restaurants. The town is also home to several wineries, which produce a variety of wines.
The town is also home to several small farms, which produce a variety of fruits and vegetables. The town is also home to several small manufacturing businesses, which produce a variety of products, including furniture and clothing.
Demographics
As of the 2010 census, the population of San Juan was 1,000 people. The racial makeup of the town was 94.2% White, 0.7% African American, 0.7% Native American, 0.7% Asian, 0.7% Pacific Islander, and 2.7% from other races. The median household income in the town was $45,000, and the median age was 44 years.
Conclusion
San Juan is a small unincorporated community located in Nevada County, California. It is situated in the Sierra Nevada foothills, approximately 20 miles north of Nevada City and 40 miles northeast of Sacramento. The town is located along State Route 49, which is a major thoroughfare connecting the Sierra Nevada foothills to the Central Valley. San Juan is a rural community with a population of approximately 1,000 people. The town is home to several small businesses, including a grocery store, a hardware store, and a few restaurants. The town is also home to several wineries, which produce a variety of wines. The town is also home to several small farms, which produce a variety of fruits and vegetables. The town is also home to several small manufacturing businesses, which produce a variety of products, including furniture and clothing. As of the 2010 census, the population of San Juan was 1,000 people. The racial makeup of the town was 94.2% White, 0.7% African American, 0.7% Native American, 0.7% Asian, 0.7% Pacific Islander, and 2.7% from other races. The median household income in the town was $45,000, and the median age was 44 years.
Common Questions
What is Per Capita Income in North San Juan?
Per Capita income in North San Juan is $20,472.
What is Inequality or Gini Index in North San Juan?
Inequality or Gini Index in North San Juan is 0.38.
What is the Total Population of North San Juan?
Total Population of North San Juan is 109.
What is the Total Male Population of North San Juan?
Total Male Population of North San Juan is 25.
What is the Total Female Population of North San Juan?
Total Female Population of North San Juan is 84.
What is the Ratio of Males per 100 Females in North San Juan?
There are 29.76 Males per 100 Females in North San Juan.
What is the Ratio of Females per 100 Males in North San Juan?
There are 336.00 Females per 100 Males in North San Juan.
What is the Median Population Age in North San Juan?
Median Population Age in North San Juan is 68.6 Years.
What is the Average Household Size in North San Juan
Average Household Size in North San Juan is 1.2 People.
How Large is the Labor Force in North San Juan?
There are 2 People in the Labor Forcein in North San Juan.
What is the Percentage of People in the Labor Force in North San Juan?
1.8% of People are in the Labor Force in North San Juan.