Cities with the Highest Percentage of Population Employed in Food Preparation & Serving in Texas
RELATED REPORTS & OPTIONS
Food Preparation & Serving
Texas
Compare Cities
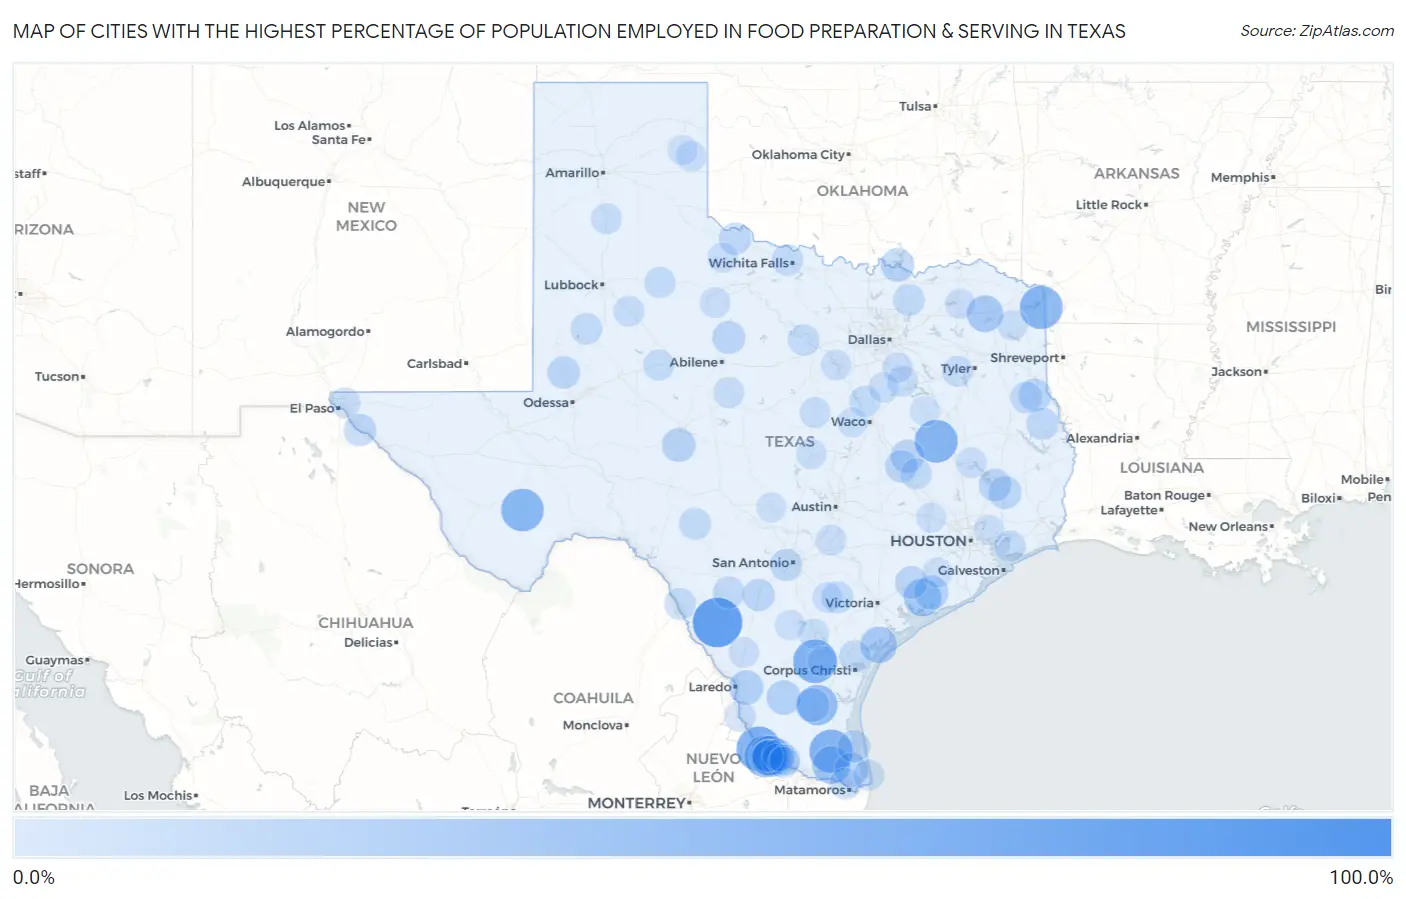
Map of Cities with the Highest Percentage of Population Employed in Food Preparation & Serving in Texas
0.0%
100.0%
Cities with the Highest Percentage of Population Employed in Food Preparation & Serving in Texas
| City | % Employed | vs State | vs National | |
| 1. | La Moca Ranch | 100.0% | 5.4%(+94.6)#1 | 5.3%(+94.7)#18 |
| 2. | Carrizo Hill | 84.0% | 5.4%(+78.7)#2 | 5.3%(+78.8)#39 |
| 3. | La Loma De Falcon | 65.4% | 5.4%(+60.0)#3 | 5.3%(+60.1)#59 |
| 4. | Amargosa | 62.0% | 5.4%(+56.6)#4 | 5.3%(+56.7)#66 |
| 5. | Ranchette Estates | 61.7% | 5.4%(+56.4)#5 | 5.3%(+56.4)#67 |
| 6. | Domino | 60.0% | 5.4%(+54.6)#6 | 5.3%(+54.7)#72 |
| 7. | Centerville | 59.5% | 5.4%(+54.2)#7 | 5.3%(+54.2)#75 |
| 8. | Marathon | 58.4% | 5.4%(+53.1)#8 | 5.3%(+53.2)#79 |
| 9. | Loma Vista | 54.7% | 5.4%(+49.4)#9 | 5.3%(+49.5)#88 |
| 10. | May | 53.0% | 5.4%(+47.7)#10 | 5.3%(+47.7)#98 |
| 11. | Benjamin Perez | 52.9% | 5.4%(+47.5)#11 | 5.3%(+47.6)#99 |
| 12. | Flowella | 50.0% | 5.4%(+44.6)#12 | 5.3%(+44.7)#115 |
| 13. | Mcleod | 42.5% | 5.4%(+37.1)#13 | 5.3%(+37.2)#163 |
| 14. | Tierra Bonita | 40.6% | 5.4%(+35.3)#14 | 5.3%(+35.3)#182 |
| 15. | Blessing | 40.0% | 5.4%(+34.6)#15 | 5.3%(+34.7)#189 |
| 16. | Miller S Cove | 36.7% | 5.4%(+31.3)#16 | 5.3%(+31.4)#228 |
| 17. | Campo Verde | 36.5% | 5.4%(+31.1)#17 | 5.3%(+31.2)#230 |
| 18. | Lamar | 36.2% | 5.4%(+30.8)#18 | 5.3%(+30.9)#232 |
| 19. | El Quiote | 33.3% | 5.4%(+28.0)#19 | 5.3%(+28.0)#274 |
| 20. | Sunrise Shores | 30.6% | 5.4%(+25.3)#20 | 5.3%(+25.3)#330 |
| 21. | Petty | 29.8% | 5.4%(+24.5)#21 | 5.3%(+24.5)#353 |
| 22. | Pueblo Nuevo | 29.6% | 5.4%(+24.2)#22 | 5.3%(+24.3)#359 |
| 23. | Myra | 29.1% | 5.4%(+23.8)#23 | 5.3%(+23.8)#368 |
| 24. | Las Lomitas | 29.0% | 5.4%(+23.7)#24 | 5.3%(+23.7)#372 |
| 25. | Salineno North | 28.6% | 5.4%(+23.2)#25 | 5.3%(+23.3)#383 |
| 26. | Markham | 28.5% | 5.4%(+23.1)#26 | 5.3%(+23.2)#387 |
| 27. | La Tina Ranch | 27.4% | 5.4%(+22.0)#27 | 5.3%(+22.1)#417 |
| 28. | Falfurrias | 27.1% | 5.4%(+21.8)#28 | 5.3%(+21.8)#424 |
| 29. | Christoval | 26.7% | 5.4%(+21.4)#29 | 5.3%(+21.4)#443 |
| 30. | Preston | 26.0% | 5.4%(+20.7)#30 | 5.3%(+20.7)#469 |
| 31. | Valera | 25.0% | 5.4%(+19.6)#31 | 5.3%(+19.7)#509 |
| 32. | Franklin | 24.8% | 5.4%(+19.4)#32 | 5.3%(+19.5)#516 |
| 33. | Lueders | 24.3% | 5.4%(+19.0)#33 | 5.3%(+19.0)#536 |
| 34. | Big Thicket Lake Estates | 23.7% | 5.4%(+18.4)#34 | 5.3%(+18.4)#567 |
| 35. | Tenaha | 23.5% | 5.4%(+18.1)#35 | 5.3%(+18.2)#585 |
| 36. | Mckinney Acres | 23.0% | 5.4%(+17.6)#36 | 5.3%(+17.7)#617 |
| 37. | Goodrich | 22.9% | 5.4%(+17.6)#37 | 5.3%(+17.6)#621 |
| 38. | Louise | 22.7% | 5.4%(+17.4)#38 | 5.3%(+17.4)#637 |
| 39. | Hearne | 22.3% | 5.4%(+16.9)#39 | 5.3%(+17.0)#656 |
| 40. | Port Mansfield | 22.2% | 5.4%(+16.9)#40 | 5.3%(+16.9)#665 |
| 41. | Garza Salinas Ii | 22.1% | 5.4%(+16.8)#41 | 5.3%(+16.9)#676 |
| 42. | Tornillo | 22.0% | 5.4%(+16.6)#42 | 5.3%(+16.7)#679 |
| 43. | North Pearsall | 21.8% | 5.4%(+16.4)#43 | 5.3%(+16.5)#690 |
| 44. | San Augustine | 21.7% | 5.4%(+16.3)#44 | 5.3%(+16.4)#699 |
| 45. | Chillicothe | 21.4% | 5.4%(+16.0)#45 | 5.3%(+16.1)#717 |
| 46. | Lackland Afb | 21.3% | 5.4%(+16.0)#46 | 5.3%(+16.0)#720 |
| 47. | Sammy Martinez | 20.9% | 5.4%(+15.6)#47 | 5.3%(+15.6)#743 |
| 48. | Batesville | 20.6% | 5.4%(+15.2)#48 | 5.3%(+15.3)#778 |
| 49. | Rocksprings | 20.2% | 5.4%(+14.8)#49 | 5.3%(+14.9)#822 |
| 50. | Timpson | 20.1% | 5.4%(+14.7)#50 | 5.3%(+14.8)#829 |
| 51. | Westminster | 20.1% | 5.4%(+14.7)#51 | 5.3%(+14.8)#831 |
| 52. | Elm Creek | 19.8% | 5.4%(+14.5)#52 | 5.3%(+14.6)#862 |
| 53. | Runge | 19.8% | 5.4%(+14.5)#53 | 5.3%(+14.5)#864 |
| 54. | Taft Southwest | 19.8% | 5.4%(+14.4)#54 | 5.3%(+14.5)#865 |
| 55. | Welch | 18.8% | 5.4%(+13.5)#55 | 5.3%(+13.6)#964 |
| 56. | Pleasant Valley | 18.7% | 5.4%(+13.4)#56 | 5.3%(+13.4)#980 |
| 57. | San Pedro | 18.3% | 5.4%(+12.9)#57 | 5.3%(+13.0)#1,030 |
| 58. | Aquilla | 18.2% | 5.4%(+12.8)#58 | 5.3%(+12.9)#1,043 |
| 59. | Palo Pinto | 18.0% | 5.4%(+12.6)#59 | 5.3%(+12.7)#1,066 |
| 60. | Wadsworth | 17.7% | 5.4%(+12.3)#60 | 5.3%(+12.4)#1,101 |
| 61. | Dickens | 17.6% | 5.4%(+12.3)#61 | 5.3%(+12.4)#1,108 |
| 62. | Wixon Valley | 17.5% | 5.4%(+12.2)#62 | 5.3%(+12.3)#1,121 |
| 63. | Valle Vista | 17.5% | 5.4%(+12.2)#63 | 5.3%(+12.2)#1,123 |
| 64. | Colorado City | 17.5% | 5.4%(+12.2)#64 | 5.3%(+12.2)#1,125 |
| 65. | Oak Island | 17.5% | 5.4%(+12.1)#65 | 5.3%(+12.2)#1,133 |
| 66. | San Juan | 17.4% | 5.4%(+12.0)#66 | 5.3%(+12.1)#1,152 |
| 67. | San Ygnacio | 17.3% | 5.4%(+11.9)#67 | 5.3%(+12.0)#1,170 |
| 68. | Novice | 17.2% | 5.4%(+11.9)#68 | 5.3%(+12.0)#1,173 |
| 69. | Post | 16.8% | 5.4%(+11.4)#69 | 5.3%(+11.5)#1,227 |
| 70. | Tulia | 16.7% | 5.4%(+11.3)#70 | 5.3%(+11.4)#1,244 |
| 71. | South Padre Island | 16.7% | 5.4%(+11.3)#71 | 5.3%(+11.4)#1,246 |
| 72. | Emhouse | 16.7% | 5.4%(+11.3)#72 | 5.3%(+11.4)#1,257 |
| 73. | Rochelle | 16.6% | 5.4%(+11.2)#73 | 5.3%(+11.3)#1,285 |
| 74. | Hamilton | 16.5% | 5.4%(+11.1)#74 | 5.3%(+11.2)#1,301 |
| 75. | Brownsboro | 16.3% | 5.4%(+11.0)#75 | 5.3%(+11.0)#1,325 |
| 76. | La Victoria | 15.9% | 5.4%(+10.6)#76 | 5.3%(+10.6)#1,424 |
| 77. | Trinity | 15.8% | 5.4%(+10.4)#77 | 5.3%(+10.5)#1,456 |
| 78. | Staples | 15.8% | 5.4%(+10.4)#78 | 5.3%(+10.5)#1,459 |
| 79. | Rochester | 15.4% | 5.4%(+10.0)#79 | 5.3%(+10.1)#1,529 |
| 80. | Canyon Creek | 15.4% | 5.4%(+10.0)#80 | 5.3%(+10.1)#1,541 |
| 81. | Wheeler | 15.3% | 5.4%(+9.97)#81 | 5.3%(+10.0)#1,552 |
| 82. | Fort Bliss | 15.0% | 5.4%(+9.61)#82 | 5.3%(+9.68)#1,647 |
| 83. | Encinal | 14.9% | 5.4%(+9.56)#83 | 5.3%(+9.63)#1,662 |
| 84. | Tira | 14.9% | 5.4%(+9.50)#84 | 5.3%(+9.57)#1,674 |
| 85. | Crowell | 14.8% | 5.4%(+9.41)#85 | 5.3%(+9.47)#1,696 |
| 86. | Hughes Springs | 14.7% | 5.4%(+9.32)#86 | 5.3%(+9.39)#1,716 |
| 87. | Lampasas | 14.6% | 5.4%(+9.27)#87 | 5.3%(+9.34)#1,725 |
| 88. | George West | 14.6% | 5.4%(+9.25)#88 | 5.3%(+9.31)#1,735 |
| 89. | Garrett | 14.5% | 5.4%(+9.20)#89 | 5.3%(+9.26)#1,753 |
| 90. | Karnes City | 14.5% | 5.4%(+9.19)#90 | 5.3%(+9.26)#1,757 |
| 91. | South La Paloma | 14.5% | 5.4%(+9.14)#91 | 5.3%(+9.21)#1,772 |
| 92. | Tilden | 14.3% | 5.4%(+8.93)#92 | 5.3%(+9.00)#1,817 |
| 93. | Mertens | 14.3% | 5.4%(+8.93)#93 | 5.3%(+9.00)#1,828 |
| 94. | Crosby | 14.3% | 5.4%(+8.91)#94 | 5.3%(+8.97)#1,842 |
| 95. | Boling | 14.1% | 5.4%(+8.72)#95 | 5.3%(+8.79)#1,894 |
| 96. | Fredericksburg | 14.0% | 5.4%(+8.62)#96 | 5.3%(+8.69)#1,926 |
| 97. | Hempstead | 13.9% | 5.4%(+8.52)#97 | 5.3%(+8.58)#1,950 |
| 98. | Crawford | 13.9% | 5.4%(+8.51)#98 | 5.3%(+8.57)#1,953 |
| 99. | Mobeetie | 13.8% | 5.4%(+8.44)#99 | 5.3%(+8.51)#1,972 |
| 100. | Fairfield | 13.8% | 5.4%(+8.44)#100 | 5.3%(+8.50)#1,974 |
Common Questions
What are the Top 10 Cities with the Highest Percentage of Population Employed in Food Preparation & Serving in Texas?
Top 10 Cities with the Highest Percentage of Population Employed in Food Preparation & Serving in Texas are:
#1
84.0%
#2
65.4%
#3
62.0%
#4
61.7%
#5
60.0%
#6
59.5%
#7
58.4%
#8
54.7%
#9
52.9%
#10
50.0%
What city has the Highest Percentage of Population Employed in Food Preparation & Serving in Texas?
Carrizo Hill has the Highest Percentage of Population Employed in Food Preparation & Serving in Texas with 84.0%.
What is the Percentage of Population Employed in Food Preparation & Serving in the State of Texas?
Percentage of Population Employed in Food Preparation & Serving in Texas is 5.4%.
What is the Percentage of Population Employed in Food Preparation & Serving in the United States?
Percentage of Population Employed in Food Preparation & Serving in the United States is 5.3%.