Cities with the Highest Percentage of Population Employed in Food Preparation & Serving in Indiana
RELATED REPORTS & OPTIONS
Food Preparation & Serving
Indiana
Compare Cities
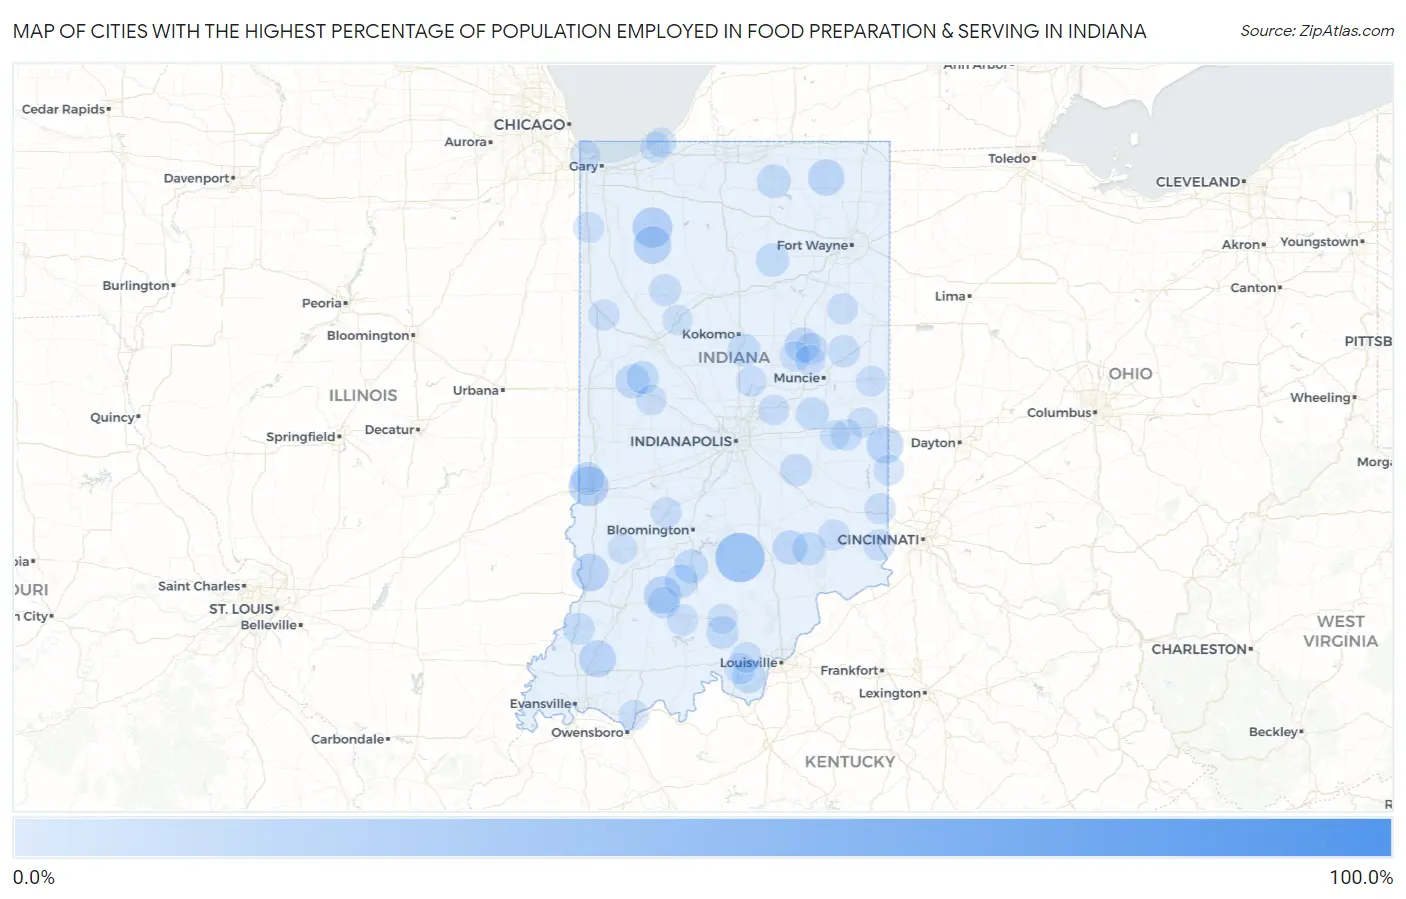
Map of Cities with the Highest Percentage of Population Employed in Food Preparation & Serving in Indiana
0.0%
100.0%
Cities with the Highest Percentage of Population Employed in Food Preparation & Serving in Indiana
| City | % Employed | vs State | vs National | |
| 1. | Hemlock | 100.0% | 5.3%(+94.7)#1 | 5.3%(+94.7)#15 |
| 2. | Patricksburg | 49.4% | 5.3%(+44.1)#2 | 5.3%(+44.1)#122 |
| 3. | Eminence | 49.0% | 5.3%(+43.7)#3 | 5.3%(+43.7)#123 |
| 4. | Amity | 47.3% | 5.3%(+42.0)#4 | 5.3%(+42.1)#129 |
| 5. | Maxwell | 44.7% | 5.3%(+39.4)#5 | 5.3%(+39.5)#138 |
| 6. | Foster | 42.0% | 5.3%(+36.7)#6 | 5.3%(+36.8)#167 |
| 7. | Freetown | 40.5% | 5.3%(+35.2)#7 | 5.3%(+35.2)#184 |
| 8. | Keystone | 39.5% | 5.3%(+34.2)#8 | 5.3%(+34.2)#192 |
| 9. | Stone Bluff | 36.2% | 5.3%(+30.9)#9 | 5.3%(+30.9)#234 |
| 10. | Waynesville | 35.5% | 5.3%(+30.2)#10 | 5.3%(+30.2)#243 |
| 11. | Pittsburg | 31.0% | 5.3%(+25.7)#11 | 5.3%(+25.7)#321 |
| 12. | Arthur | 30.5% | 5.3%(+25.2)#12 | 5.3%(+25.2)#334 |
| 13. | Azalia | 28.6% | 5.3%(+23.3)#13 | 5.3%(+23.3)#382 |
| 14. | Cross Plains | 27.0% | 5.3%(+21.7)#14 | 5.3%(+21.7)#427 |
| 15. | San Pierre | 26.1% | 5.3%(+20.8)#15 | 5.3%(+20.8)#468 |
| 16. | Holiday Woods | 25.9% | 5.3%(+20.6)#16 | 5.3%(+20.6)#475 |
| 17. | West Terre Haute | 25.7% | 5.3%(+20.4)#17 | 5.3%(+20.4)#480 |
| 18. | Scott | 25.3% | 5.3%(+19.9)#18 | 5.3%(+20.0)#491 |
| 19. | Saugany Lake | 23.4% | 5.3%(+18.1)#19 | 5.3%(+18.1)#593 |
| 20. | Billtown | 23.0% | 5.3%(+17.6)#20 | 5.3%(+17.7)#620 |
| 21. | Oaktown | 22.3% | 5.3%(+17.0)#21 | 5.3%(+17.0)#651 |
| 22. | Philadelphia | 22.3% | 5.3%(+17.0)#22 | 5.3%(+17.0)#652 |
| 23. | Medaryville | 22.3% | 5.3%(+17.0)#23 | 5.3%(+17.0)#655 |
| 24. | Stendal | 22.2% | 5.3%(+16.9)#24 | 5.3%(+16.9)#664 |
| 25. | Dover Hill | 22.0% | 5.3%(+16.6)#25 | 5.3%(+16.7)#682 |
| 26. | Canton | 21.7% | 5.3%(+16.4)#26 | 5.3%(+16.5)#695 |
| 27. | Somerville | 21.6% | 5.3%(+16.3)#27 | 5.3%(+16.4)#702 |
| 28. | Mays | 21.4% | 5.3%(+16.1)#28 | 5.3%(+16.1)#713 |
| 29. | Libertyville | 21.3% | 5.3%(+16.0)#29 | 5.3%(+16.0)#719 |
| 30. | Boston | 21.2% | 5.3%(+15.8)#30 | 5.3%(+15.9)#724 |
| 31. | Wolcottville | 20.7% | 5.3%(+15.3)#31 | 5.3%(+15.4)#769 |
| 32. | Helmsburg | 20.6% | 5.3%(+15.3)#32 | 5.3%(+15.3)#774 |
| 33. | Perkinsville | 19.7% | 5.3%(+14.4)#33 | 5.3%(+14.5)#872 |
| 34. | Centerton | 19.6% | 5.3%(+14.3)#34 | 5.3%(+14.3)#886 |
| 35. | Lake Of The Woods | 19.4% | 5.3%(+14.1)#35 | 5.3%(+14.1)#908 |
| 36. | Anoka | 19.2% | 5.3%(+13.9)#36 | 5.3%(+13.9)#926 |
| 37. | Fowlerton | 18.5% | 5.3%(+13.2)#37 | 5.3%(+13.2)#1,005 |
| 38. | Marietta | 18.3% | 5.3%(+12.9)#38 | 5.3%(+13.0)#1,035 |
| 39. | Lake Holiday Hideaway | 18.2% | 5.3%(+12.9)#39 | 5.3%(+12.9)#1,040 |
| 40. | Country Squire Lakes | 17.9% | 5.3%(+12.6)#40 | 5.3%(+12.6)#1,079 |
| 41. | Wingate | 17.5% | 5.3%(+12.2)#41 | 5.3%(+12.2)#1,138 |
| 42. | Avoca | 17.0% | 5.3%(+11.6)#42 | 5.3%(+11.7)#1,212 |
| 43. | New Middletown | 16.7% | 5.3%(+11.4)#43 | 5.3%(+11.4)#1,266 |
| 44. | New Paris | 16.6% | 5.3%(+11.3)#44 | 5.3%(+11.3)#1,281 |
| 45. | Williams | 16.2% | 5.3%(+10.9)#45 | 5.3%(+10.9)#1,366 |
| 46. | Laketon | 16.2% | 5.3%(+10.9)#46 | 5.3%(+10.9)#1,368 |
| 47. | Tyner | 16.1% | 5.3%(+10.8)#47 | 5.3%(+10.8)#1,384 |
| 48. | Butlerville | 16.0% | 5.3%(+10.7)#48 | 5.3%(+10.8)#1,397 |
| 49. | St Mary Of The Woods | 15.9% | 5.3%(+10.6)#49 | 5.3%(+10.7)#1,414 |
| 50. | Servia | 15.5% | 5.3%(+10.2)#50 | 5.3%(+10.3)#1,500 |
| 51. | Raub | 15.5% | 5.3%(+10.2)#51 | 5.3%(+10.2)#1,512 |
| 52. | Sharpsville | 15.5% | 5.3%(+10.2)#52 | 5.3%(+10.2)#1,515 |
| 53. | Cadiz | 15.5% | 5.3%(+10.1)#53 | 5.3%(+10.2)#1,516 |
| 54. | Bretzville | 15.2% | 5.3%(+9.84)#54 | 5.3%(+9.87)#1,587 |
| 55. | Lake Everett | 15.2% | 5.3%(+9.84)#55 | 5.3%(+9.87)#1,588 |
| 56. | New Richmond | 15.0% | 5.3%(+9.66)#56 | 5.3%(+9.68)#1,645 |
| 57. | Hardinsburg | 14.9% | 5.3%(+9.58)#57 | 5.3%(+9.61)#1,664 |
| 58. | Manilla | 14.6% | 5.3%(+9.32)#58 | 5.3%(+9.35)#1,724 |
| 59. | Dunkirk | 14.5% | 5.3%(+9.22)#59 | 5.3%(+9.25)#1,760 |
| 60. | Matthews | 14.1% | 5.3%(+8.76)#60 | 5.3%(+8.79)#1,892 |
| 61. | Norway | 14.0% | 5.3%(+8.69)#61 | 5.3%(+8.71)#1,921 |
| 62. | Shoals | 13.8% | 5.3%(+8.45)#62 | 5.3%(+8.48)#1,981 |
| 63. | Prairieton | 13.7% | 5.3%(+8.43)#63 | 5.3%(+8.46)#1,987 |
| 64. | Hazleton | 13.6% | 5.3%(+8.32)#64 | 5.3%(+8.35)#2,025 |
| 65. | Lake Eliza | 13.4% | 5.3%(+8.08)#65 | 5.3%(+8.11)#2,106 |
| 66. | New Trenton | 13.0% | 5.3%(+7.73)#66 | 5.3%(+7.76)#2,238 |
| 67. | Aurora | 13.0% | 5.3%(+7.69)#67 | 5.3%(+7.72)#2,257 |
| 68. | Poland | 13.0% | 5.3%(+7.67)#68 | 5.3%(+7.70)#2,264 |
| 69. | Osgood | 12.9% | 5.3%(+7.60)#69 | 5.3%(+7.63)#2,287 |
| 70. | Poneto | 12.8% | 5.3%(+7.48)#70 | 5.3%(+7.50)#2,351 |
| 71. | French Lick | 12.8% | 5.3%(+7.46)#71 | 5.3%(+7.49)#2,357 |
| 72. | Mount Auburn | 12.8% | 5.3%(+7.45)#72 | 5.3%(+7.48)#2,367 |
| 73. | Fowler | 12.7% | 5.3%(+7.38)#73 | 5.3%(+7.40)#2,408 |
| 74. | Corydon | 12.6% | 5.3%(+7.24)#74 | 5.3%(+7.27)#2,463 |
| 75. | Crandall | 12.5% | 5.3%(+7.19)#75 | 5.3%(+7.21)#2,499 |
| 76. | Spencer | 12.4% | 5.3%(+7.06)#76 | 5.3%(+7.09)#2,575 |
| 77. | Winchester | 12.3% | 5.3%(+7.01)#77 | 5.3%(+7.04)#2,593 |
| 78. | Bethel | 12.3% | 5.3%(+6.99)#78 | 5.3%(+7.02)#2,601 |
| 79. | Arcadia | 12.2% | 5.3%(+6.91)#79 | 5.3%(+6.94)#2,637 |
| 80. | Schneider | 12.1% | 5.3%(+6.77)#80 | 5.3%(+6.80)#2,709 |
| 81. | West College Corner | 12.0% | 5.3%(+6.73)#81 | 5.3%(+6.75)#2,733 |
| 82. | Ingalls | 12.0% | 5.3%(+6.66)#82 | 5.3%(+6.68)#2,779 |
| 83. | Summitville | 11.9% | 5.3%(+6.59)#83 | 5.3%(+6.61)#2,829 |
| 84. | Rockford | 11.9% | 5.3%(+6.54)#84 | 5.3%(+6.57)#2,848 |
| 85. | Crawfordsville | 11.9% | 5.3%(+6.54)#85 | 5.3%(+6.57)#2,852 |
| 86. | Grandview Lake | 11.8% | 5.3%(+6.48)#86 | 5.3%(+6.50)#2,883 |
| 87. | Cory | 11.6% | 5.3%(+6.31)#87 | 5.3%(+6.34)#2,991 |
| 88. | Whiting | 11.6% | 5.3%(+6.27)#88 | 5.3%(+6.30)#3,015 |
| 89. | Greens Fork | 11.6% | 5.3%(+6.26)#89 | 5.3%(+6.29)#3,022 |
| 90. | Eugene | 11.5% | 5.3%(+6.22)#90 | 5.3%(+6.25)#3,050 |
| 91. | Straughn | 11.4% | 5.3%(+6.07)#91 | 5.3%(+6.10)#3,143 |
| 92. | Pottawattamie Park | 11.4% | 5.3%(+6.04)#92 | 5.3%(+6.07)#3,163 |
| 93. | Gaston | 11.3% | 5.3%(+5.97)#93 | 5.3%(+5.99)#3,207 |
| 94. | Maples | 11.3% | 5.3%(+5.94)#94 | 5.3%(+5.96)#3,231 |
| 95. | Bowling Green | 11.2% | 5.3%(+5.92)#95 | 5.3%(+5.95)#3,241 |
| 96. | Rockport | 11.2% | 5.3%(+5.86)#96 | 5.3%(+5.89)#3,282 |
| 97. | Delphi | 11.1% | 5.3%(+5.81)#97 | 5.3%(+5.84)#3,300 |
| 98. | Livonia | 11.1% | 5.3%(+5.80)#98 | 5.3%(+5.83)#3,324 |
| 99. | Linton | 11.1% | 5.3%(+5.78)#99 | 5.3%(+5.81)#3,336 |
| 100. | Michiana Shores | 11.0% | 5.3%(+5.74)#100 | 5.3%(+5.76)#3,360 |
Common Questions
What are the Top 10 Cities with the Highest Percentage of Population Employed in Food Preparation & Serving in Indiana?
Top 10 Cities with the Highest Percentage of Population Employed in Food Preparation & Serving in Indiana are:
#1
40.5%
#2
26.1%
#3
25.7%
#4
22.3%
#5
22.3%
#6
22.0%
#7
21.6%
#8
21.2%
#9
20.7%
#10
18.5%
What city has the Highest Percentage of Population Employed in Food Preparation & Serving in Indiana?
Freetown has the Highest Percentage of Population Employed in Food Preparation & Serving in Indiana with 40.5%.
What is the Percentage of Population Employed in Food Preparation & Serving in the State of Indiana?
Percentage of Population Employed in Food Preparation & Serving in Indiana is 5.3%.
What is the Percentage of Population Employed in Food Preparation & Serving in the United States?
Percentage of Population Employed in Food Preparation & Serving in the United States is 5.3%.