Cities with the Highest Percentage of Population Employed in Food Preparation & Serving in Alaska
RELATED REPORTS & OPTIONS
Food Preparation & Serving
Alaska
Compare Cities
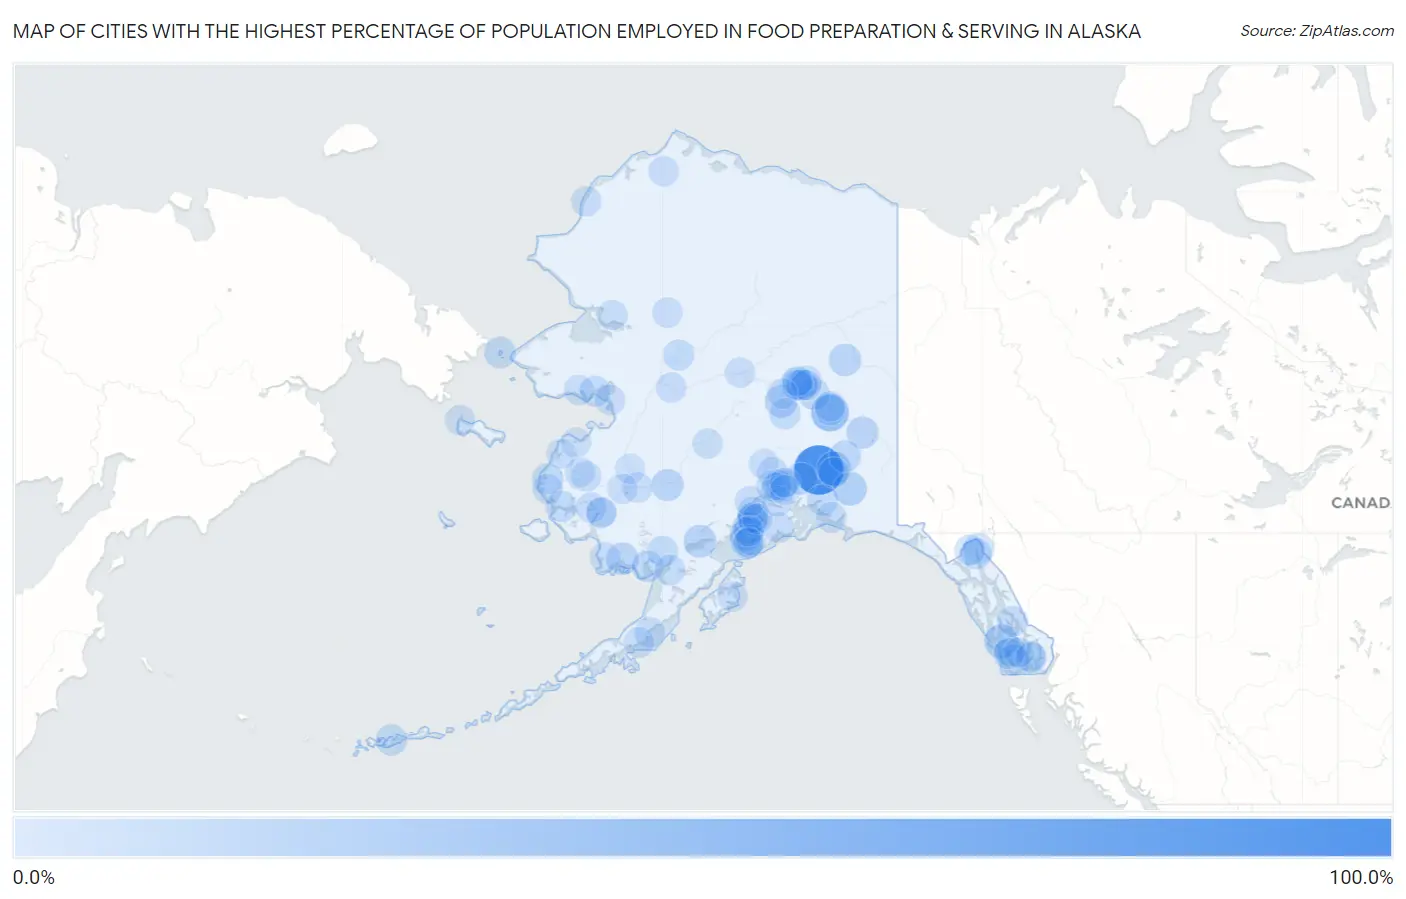
Map of Cities with the Highest Percentage of Population Employed in Food Preparation & Serving in Alaska
0.0%
100.0%
Cities with the Highest Percentage of Population Employed in Food Preparation & Serving in Alaska
| City | % Employed | vs State | vs National | |
| 1. | Mendeltna | 100.0% | 5.1%(+94.9)#1 | 5.3%(+94.7)#11 |
| 2. | Fort Greely | 40.5% | 5.1%(+35.4)#2 | 5.3%(+35.3)#183 |
| 3. | Gulkana | 24.2% | 5.1%(+19.1)#3 | 5.3%(+19.0)#542 |
| 4. | Edna Bay | 23.8% | 5.1%(+18.7)#4 | 5.3%(+18.5)#561 |
| 5. | Chitina | 21.1% | 5.1%(+15.9)#5 | 5.3%(+15.8)#731 |
| 6. | Anderson | 17.0% | 5.1%(+11.9)#6 | 5.3%(+11.7)#1,200 |
| 7. | Newhalen | 16.7% | 5.1%(+11.5)#7 | 5.3%(+11.4)#1,263 |
| 8. | Happy Valley | 16.1% | 5.1%(+10.9)#8 | 5.3%(+10.8)#1,393 |
| 9. | Central | 15.2% | 5.1%(+10.0)#9 | 5.3%(+9.87)#1,589 |
| 10. | Twin Hills | 15.0% | 5.1%(+9.85)#10 | 5.3%(+9.71)#1,633 |
| 11. | Clam Gulch | 15.0% | 5.1%(+9.81)#11 | 5.3%(+9.67)#1,648 |
| 12. | Tanacross | 14.3% | 5.1%(+9.14)#12 | 5.3%(+9.00)#1,823 |
| 13. | Sleetmute | 13.3% | 5.1%(+8.19)#13 | 5.3%(+8.05)#2,133 |
| 14. | Glacier View | 13.1% | 5.1%(+7.98)#14 | 5.3%(+7.85)#2,207 |
| 15. | Salcha | 12.8% | 5.1%(+7.70)#15 | 5.3%(+7.56)#2,323 |
| 16. | Hydaburg | 12.6% | 5.1%(+7.45)#16 | 5.3%(+7.31)#2,446 |
| 17. | Diomede | 12.5% | 5.1%(+7.35)#17 | 5.3%(+7.21)#2,516 |
| 18. | Chistochina | 12.5% | 5.1%(+7.35)#18 | 5.3%(+7.21)#2,517 |
| 19. | Ester | 11.7% | 5.1%(+6.60)#19 | 5.3%(+6.46)#2,911 |
| 20. | Clark S Point | 11.1% | 5.1%(+5.96)#20 | 5.3%(+5.83)#3,331 |
| 21. | Adak | 10.9% | 5.1%(+5.73)#21 | 5.3%(+5.59)#3,454 |
| 22. | Newtok | 10.3% | 5.1%(+5.20)#22 | 5.3%(+5.06)#3,843 |
| 23. | South Van Horn | 10.1% | 5.1%(+4.95)#23 | 5.3%(+4.81)#4,022 |
| 24. | Valdez | 10.1% | 5.1%(+4.94)#24 | 5.3%(+4.80)#4,031 |
| 25. | Scammon Bay | 9.9% | 5.1%(+4.77)#25 | 5.3%(+4.63)#4,179 |
| 26. | Skagway | 9.4% | 5.1%(+4.27)#26 | 5.3%(+4.13)#4,620 |
| 27. | Soldotna | 9.2% | 5.1%(+4.10)#27 | 5.3%(+3.96)#4,796 |
| 28. | Steele Creek | 9.1% | 5.1%(+3.92)#28 | 5.3%(+3.78)#4,988 |
| 29. | Haines | 8.9% | 5.1%(+3.76)#29 | 5.3%(+3.62)#5,189 |
| 30. | Nikiski | 8.8% | 5.1%(+3.69)#30 | 5.3%(+3.55)#5,266 |
| 31. | Healy | 8.8% | 5.1%(+3.64)#31 | 5.3%(+3.50)#5,327 |
| 32. | Huslia | 8.6% | 5.1%(+3.47)#32 | 5.3%(+3.33)#5,528 |
| 33. | Ketchikan | 8.6% | 5.1%(+3.44)#33 | 5.3%(+3.30)#5,567 |
| 34. | Palmer | 8.4% | 5.1%(+3.21)#34 | 5.3%(+3.07)#5,832 |
| 35. | Anchor Point | 8.3% | 5.1%(+3.19)#35 | 5.3%(+3.05)#5,856 |
| 36. | Elim | 8.3% | 5.1%(+3.19)#36 | 5.3%(+3.05)#5,875 |
| 37. | Ekwok | 8.3% | 5.1%(+3.19)#37 | 5.3%(+3.05)#5,901 |
| 38. | Klawock | 8.3% | 5.1%(+3.16)#38 | 5.3%(+3.02)#5,924 |
| 39. | Craig | 8.2% | 5.1%(+3.01)#39 | 5.3%(+2.87)#6,126 |
| 40. | Kalifornsky | 8.1% | 5.1%(+2.96)#40 | 5.3%(+2.82)#6,193 |
| 41. | Cordova | 8.1% | 5.1%(+2.92)#41 | 5.3%(+2.78)#6,240 |
| 42. | Chignik | 8.0% | 5.1%(+2.85)#42 | 5.3%(+2.71)#6,345 |
| 43. | Fairbanks | 7.9% | 5.1%(+2.73)#43 | 5.3%(+2.60)#6,514 |
| 44. | Petersburg | 7.5% | 5.1%(+2.40)#44 | 5.3%(+2.26)#7,073 |
| 45. | Delta Junction | 7.5% | 5.1%(+2.39)#45 | 5.3%(+2.25)#7,083 |
| 46. | Eareckson Station | 7.5% | 5.1%(+2.34)#46 | 5.3%(+2.20)#7,155 |
| 47. | Klukwan | 7.4% | 5.1%(+2.26)#47 | 5.3%(+2.12)#7,288 |
| 48. | Susitna North | 7.3% | 5.1%(+2.14)#48 | 5.3%(+2.00)#7,464 |
| 49. | Homer | 7.2% | 5.1%(+2.08)#49 | 5.3%(+1.94)#7,574 |
| 50. | Napaskiak | 7.2% | 5.1%(+2.06)#50 | 5.3%(+1.92)#7,604 |
| 51. | South Naknek | 7.1% | 5.1%(+2.00)#51 | 5.3%(+1.86)#7,748 |
| 52. | Fritz Creek | 6.9% | 5.1%(+1.80)#52 | 5.3%(+1.66)#8,100 |
| 53. | Perryville | 6.9% | 5.1%(+1.75)#53 | 5.3%(+1.61)#8,205 |
| 54. | Saxman | 6.7% | 5.1%(+1.58)#54 | 5.3%(+1.44)#8,541 |
| 55. | Bear Creek | 6.7% | 5.1%(+1.54)#55 | 5.3%(+1.40)#8,632 |
| 56. | Buffalo Soapstone | 6.6% | 5.1%(+1.43)#56 | 5.3%(+1.29)#8,923 |
| 57. | Atqasuk | 6.5% | 5.1%(+1.38)#57 | 5.3%(+1.24)#9,036 |
| 58. | Goodnews Bay | 6.5% | 5.1%(+1.38)#58 | 5.3%(+1.24)#9,037 |
| 59. | Chena Ridge | 6.5% | 5.1%(+1.35)#59 | 5.3%(+1.21)#9,088 |
| 60. | Gambell | 6.5% | 5.1%(+1.31)#60 | 5.3%(+1.17)#9,211 |
| 61. | Point Lay | 6.5% | 5.1%(+1.31)#61 | 5.3%(+1.17)#9,219 |
| 62. | Kenai | 6.4% | 5.1%(+1.26)#62 | 5.3%(+1.12)#9,319 |
| 63. | Tyonek | 6.3% | 5.1%(+1.20)#63 | 5.3%(+1.06)#9,439 |
| 64. | Shungnak | 6.3% | 5.1%(+1.18)#64 | 5.3%(+1.04)#9,492 |
| 65. | Womens Bay | 6.3% | 5.1%(+1.16)#65 | 5.3%(+1.02)#9,547 |
| 66. | Shaktoolik | 6.2% | 5.1%(+1.10)#66 | 5.3%(+0.964)#9,673 |
| 67. | Badger | 5.9% | 5.1%(+0.725)#67 | 5.3%(+0.585)#10,633 |
| 68. | Funny River | 5.8% | 5.1%(+0.654)#68 | 5.3%(+0.514)#10,811 |
| 69. | Anchorage | 5.8% | 5.1%(+0.617)#69 | 5.3%(+0.478)#10,903 |
| 70. | Ninilchik | 5.7% | 5.1%(+0.594)#70 | 5.3%(+0.454)#10,965 |
| 71. | Pilot Station | 5.7% | 5.1%(+0.568)#71 | 5.3%(+0.428)#11,043 |
| 72. | White Mountain | 5.7% | 5.1%(+0.568)#72 | 5.3%(+0.428)#11,055 |
| 73. | Chuathbaluk | 5.7% | 5.1%(+0.568)#73 | 5.3%(+0.428)#11,060 |
| 74. | Galena | 5.7% | 5.1%(+0.508)#74 | 5.3%(+0.369)#11,217 |
| 75. | Noorvik | 5.6% | 5.1%(+0.409)#75 | 5.3%(+0.270)#11,482 |
| 76. | Kasigluk | 5.6% | 5.1%(+0.409)#76 | 5.3%(+0.270)#11,488 |
| 77. | Houston | 5.5% | 5.1%(+0.329)#77 | 5.3%(+0.189)#11,693 |
| 78. | Tazlina | 5.5% | 5.1%(+0.326)#78 | 5.3%(+0.187)#11,700 |
| 79. | Big Delta | 5.5% | 5.1%(+0.318)#79 | 5.3%(+0.178)#11,714 |
| 80. | Tanana | 5.4% | 5.1%(+0.230)#80 | 5.3%(+0.090)#11,944 |
| 81. | Nenana | 5.3% | 5.1%(+0.187)#81 | 5.3%(+0.047)#12,069 |
| 82. | North Lakes | 5.3% | 5.1%(+0.129)#82 | 5.3%(-0.010)#12,221 |
| 83. | Nikolai | 5.3% | 5.1%(+0.117)#83 | 5.3%(-0.023)#12,279 |
| 84. | Chevak | 5.2% | 5.1%(+0.042)#84 | 5.3%(-0.097)#12,470 |
| 85. | Goldstream | 4.7% | 5.1%(-0.433)#85 | 5.3%(-0.573)#13,857 |
| 86. | Kotlik | 4.7% | 5.1%(-0.488)#86 | 5.3%(-0.628)#14,027 |
| 87. | Tanaina | 4.7% | 5.1%(-0.494)#87 | 5.3%(-0.633)#14,036 |
| 88. | Holy Cross | 4.6% | 5.1%(-0.517)#88 | 5.3%(-0.656)#14,097 |
| 89. | Trapper Creek | 4.6% | 5.1%(-0.531)#89 | 5.3%(-0.671)#14,137 |
| 90. | Oscarville | 4.5% | 5.1%(-0.601)#90 | 5.3%(-0.741)#14,354 |
| 91. | Kasaan | 4.5% | 5.1%(-0.601)#91 | 5.3%(-0.741)#14,356 |
| 92. | Kachemak | 4.5% | 5.1%(-0.630)#92 | 5.3%(-0.770)#14,417 |
| 93. | Sitka City And Borough | 4.4% | 5.1%(-0.702)#93 | 5.3%(-0.841)#14,600 |
| 94. | Alakanuk | 4.4% | 5.1%(-0.711)#94 | 5.3%(-0.851)#14,641 |
| 95. | Juneau City And Borough | 4.4% | 5.1%(-0.717)#95 | 5.3%(-0.857)#14,663 |
| 96. | Wasilla | 4.4% | 5.1%(-0.729)#96 | 5.3%(-0.869)#14,697 |
| 97. | Knik River | 4.3% | 5.1%(-0.809)#97 | 5.3%(-0.949)#14,930 |
| 98. | Sutton Alpine | 4.3% | 5.1%(-0.849)#98 | 5.3%(-0.988)#15,060 |
| 99. | Upper Kalskag | 4.3% | 5.1%(-0.861)#99 | 5.3%(-1.00)#15,104 |
| 100. | St Mary S | 4.2% | 5.1%(-0.904)#100 | 5.3%(-1.04)#15,233 |
Common Questions
What are the Top 10 Cities with the Highest Percentage of Population Employed in Food Preparation & Serving in Alaska?
Top 10 Cities with the Highest Percentage of Population Employed in Food Preparation & Serving in Alaska are:
#1
100.0%
#2
40.5%
#3
24.2%
#4
23.8%
#5
21.1%
#6
17.0%
#7
16.7%
#8
16.1%
#9
15.2%
#10
15.0%
What city has the Highest Percentage of Population Employed in Food Preparation & Serving in Alaska?
Mendeltna has the Highest Percentage of Population Employed in Food Preparation & Serving in Alaska with 100.0%.
What is the Percentage of Population Employed in Food Preparation & Serving in the State of Alaska?
Percentage of Population Employed in Food Preparation & Serving in Alaska is 5.1%.
What is the Percentage of Population Employed in Food Preparation & Serving in the United States?
Percentage of Population Employed in Food Preparation & Serving in the United States is 5.3%.