Montalvin Manor, CA Map & Demographics
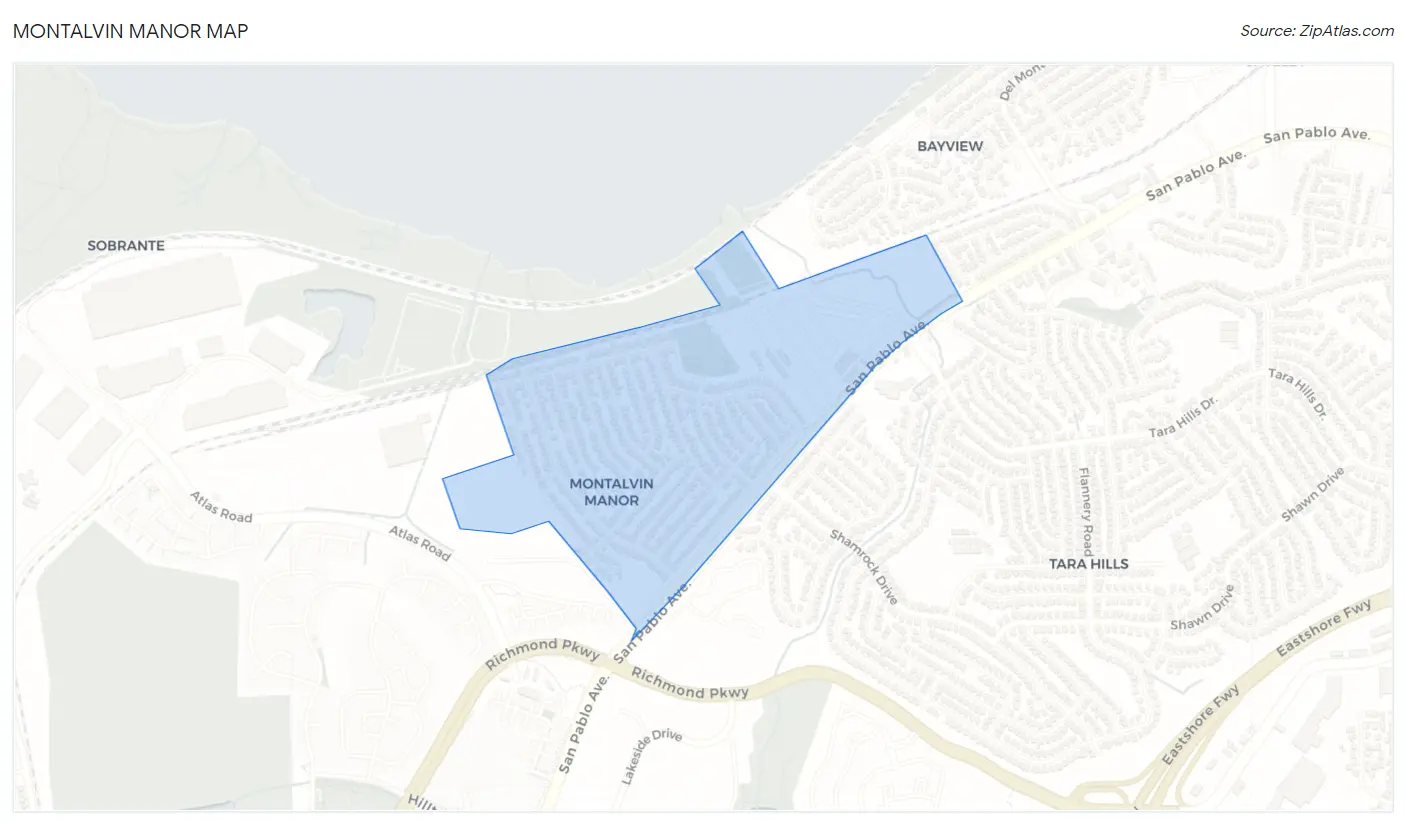
Montalvin Manor Map
Montalvin Manor Overview
$30,426
PER CAPITA INCOME
$77,391
AVG FAMILY INCOME
$77,083
AVG HOUSEHOLD INCOME
40.1%
WAGE / INCOME GAP [ % ]
59.9¢/ $1
WAGE / INCOME GAP [ $ ]
0.34
INEQUALITY / GINI INDEX
2,195
TOTAL POPULATION
1,244
MALE POPULATION
951
FEMALE POPULATION
130.81
MALES / 100 FEMALES
76.45
FEMALES / 100 MALES
40.5
MEDIAN AGE
3.7
AVG FAMILY SIZE
3.4
AVG HOUSEHOLD SIZE
1,124
LABOR FORCE [ PEOPLE ]
62.4%
PERCENT IN LABOR FORCE
3.5%
UNEMPLOYMENT RATE
Income in Montalvin Manor
Income Overview in Montalvin Manor
Per Capita Income in Montalvin Manor is $30,426, while median incomes of families and households are $77,391 and $77,083 respectively.
| Characteristic | Number | Measure |
| Per Capita Income | 2,195 | $30,426 |
| Median Family Income | 506 | $77,391 |
| Mean Family Income | 506 | $98,240 |
| Median Household Income | 649 | $77,083 |
| Mean Household Income | 649 | $95,677 |
| Income Deficit | 506 | $0 |
| Wage / Income Gap (%) | 2,195 | 40.09% |
| Wage / Income Gap ($) | 2,195 | 59.91¢ per $1 |
| Gini / Inequality Index | 2,195 | 0.34 |
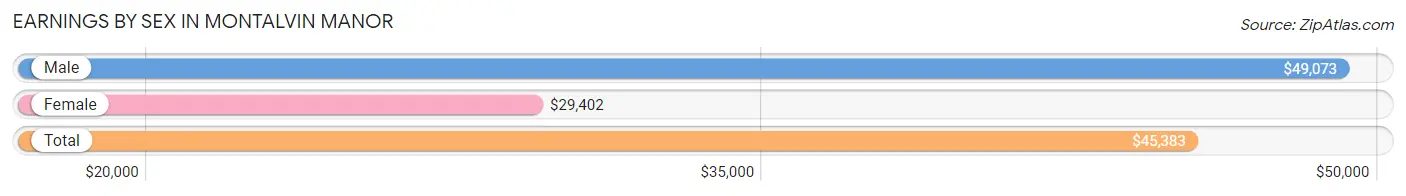
Earnings by Sex in Montalvin Manor
Average Earnings in Montalvin Manor are $45,383, $49,073 for men and $29,402 for women, a difference of 40.1%.
| Sex | Number | Average Earnings |
| Male | 745 (63.7%) | $49,073 |
| Female | 425 (36.3%) | $29,402 |
| Total | 1,170 (100.0%) | $45,383 |
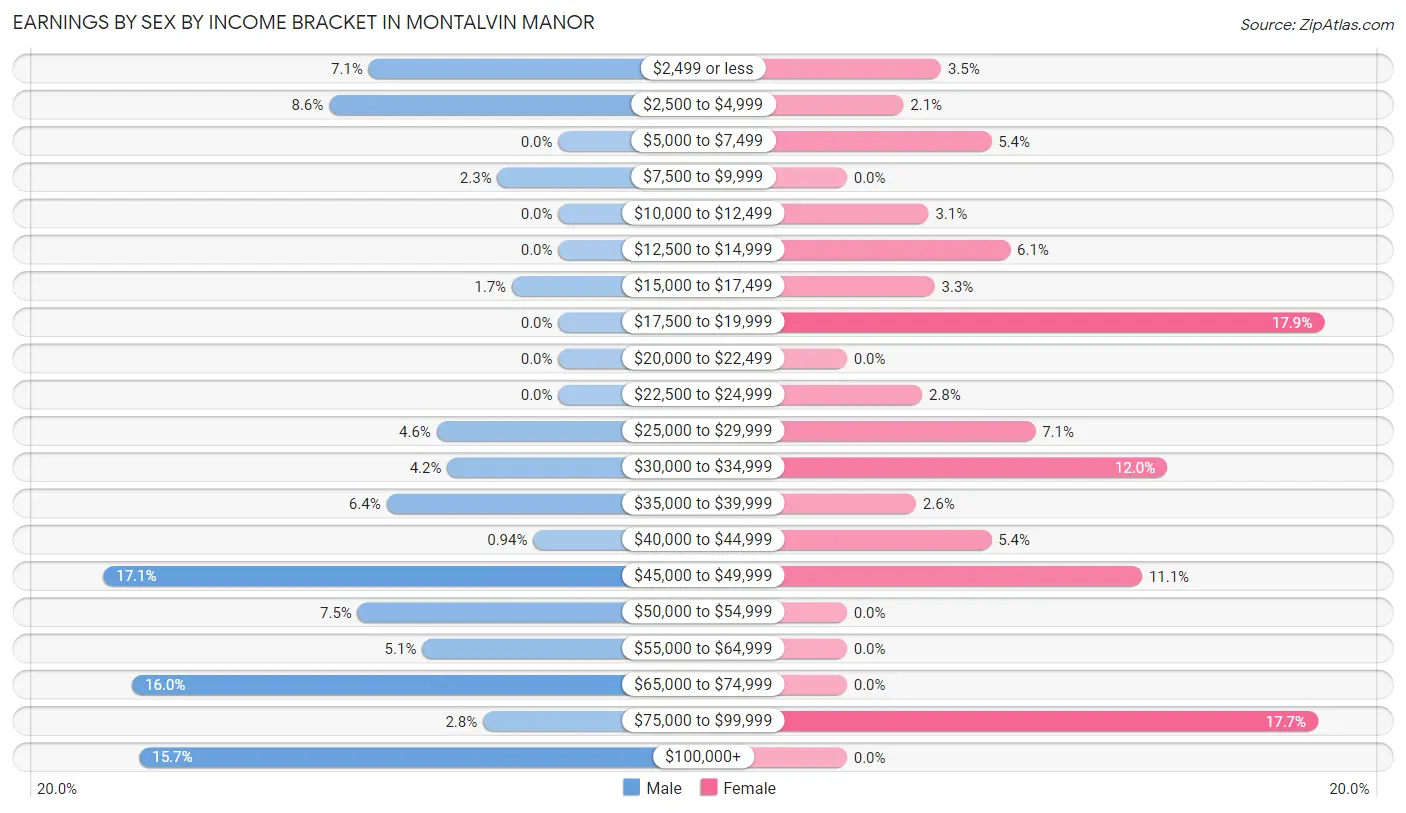
Earnings by Sex by Income Bracket in Montalvin Manor
The most common earnings brackets in Montalvin Manor are $45,000 to $49,999 for men (127 | 17.1%) and $17,500 to $19,999 for women (76 | 17.9%).
| Income | Male | Female |
| $2,499 or less | 53 (7.1%) | 15 (3.5%) |
| $2,500 to $4,999 | 64 (8.6%) | 9 (2.1%) |
| $5,000 to $7,499 | 0 (0.0%) | 23 (5.4%) |
| $7,500 to $9,999 | 17 (2.3%) | 0 (0.0%) |
| $10,000 to $12,499 | 0 (0.0%) | 13 (3.1%) |
| $12,500 to $14,999 | 0 (0.0%) | 26 (6.1%) |
| $15,000 to $17,499 | 13 (1.7%) | 14 (3.3%) |
| $17,500 to $19,999 | 0 (0.0%) | 76 (17.9%) |
| $20,000 to $22,499 | 0 (0.0%) | 0 (0.0%) |
| $22,500 to $24,999 | 0 (0.0%) | 12 (2.8%) |
| $25,000 to $29,999 | 34 (4.6%) | 30 (7.1%) |
| $30,000 to $34,999 | 31 (4.2%) | 51 (12.0%) |
| $35,000 to $39,999 | 48 (6.4%) | 11 (2.6%) |
| $40,000 to $44,999 | 7 (0.9%) | 23 (5.4%) |
| $45,000 to $49,999 | 127 (17.1%) | 47 (11.1%) |
| $50,000 to $54,999 | 56 (7.5%) | 0 (0.0%) |
| $55,000 to $64,999 | 38 (5.1%) | 0 (0.0%) |
| $65,000 to $74,999 | 119 (16.0%) | 0 (0.0%) |
| $75,000 to $99,999 | 21 (2.8%) | 75 (17.6%) |
| $100,000+ | 117 (15.7%) | 0 (0.0%) |
| Total | 745 (100.0%) | 425 (100.0%) |
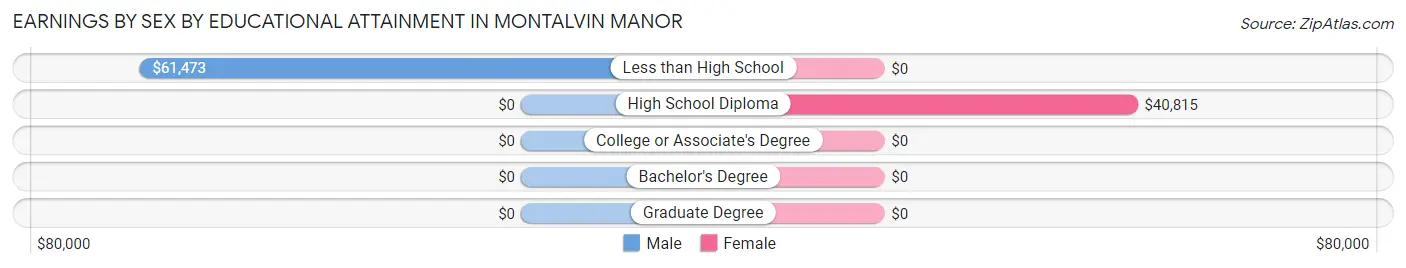
Earnings by Sex by Educational Attainment in Montalvin Manor
Average earnings in Montalvin Manor are $56,375 for men and $30,571 for women, a difference of 45.8%. Men with an educational attainment of less than high school enjoy the highest average annual earnings of $61,473, while those with less than high school education earn the least with $61,473. Women with an educational attainment of high school diploma earn the most with the average annual earnings of $40,815, while those with high school diploma education have the smallest earnings of $40,815.
| Educational Attainment | Male Income | Female Income |
| Less than High School | $61,473 | $0 |
| High School Diploma | - | - |
| College or Associate's Degree | - | - |
| Bachelor's Degree | - | - |
| Graduate Degree | - | - |
| Total | $56,375 | $30,571 |
Family Income in Montalvin Manor
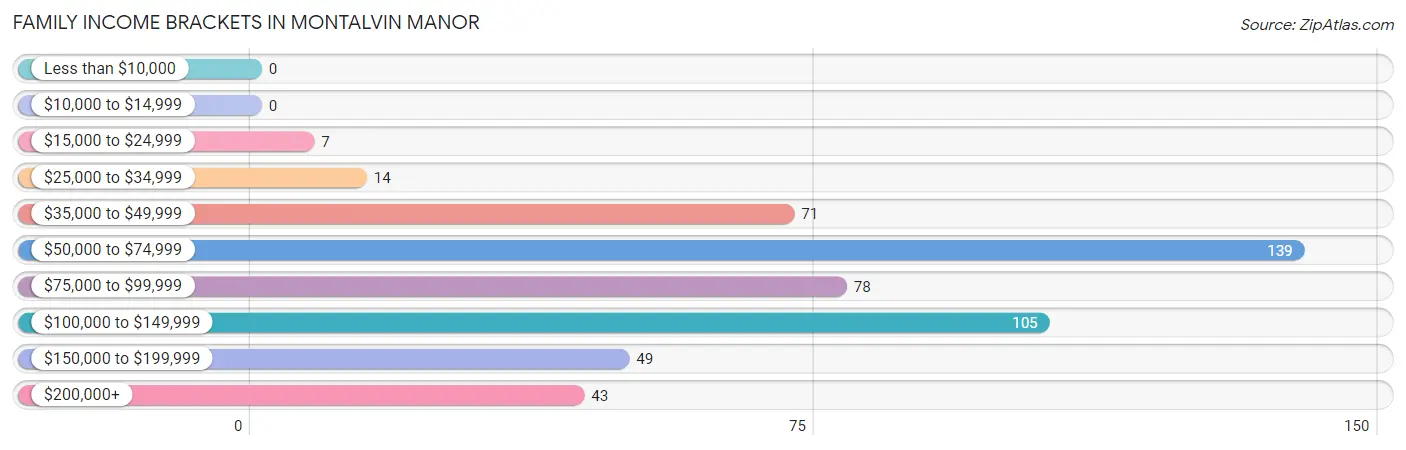
Family Income Brackets in Montalvin Manor
According to the Montalvin Manor family income data, there are 139 families falling into the $50,000 to $74,999 income range, which is the most common income bracket and makes up 27.5% of all families.
| Income Bracket | # Families | % Families |
| Less than $10,000 | 0 | 0.0% |
| $10,000 to $14,999 | 0 | 0.0% |
| $15,000 to $24,999 | 7 | 1.4% |
| $25,000 to $34,999 | 14 | 2.8% |
| $35,000 to $49,999 | 71 | 14.0% |
| $50,000 to $74,999 | 139 | 27.5% |
| $75,000 to $99,999 | 78 | 15.4% |
| $100,000 to $149,999 | 105 | 20.8% |
| $150,000 to $199,999 | 49 | 9.7% |
| $200,000+ | 43 | 8.5% |
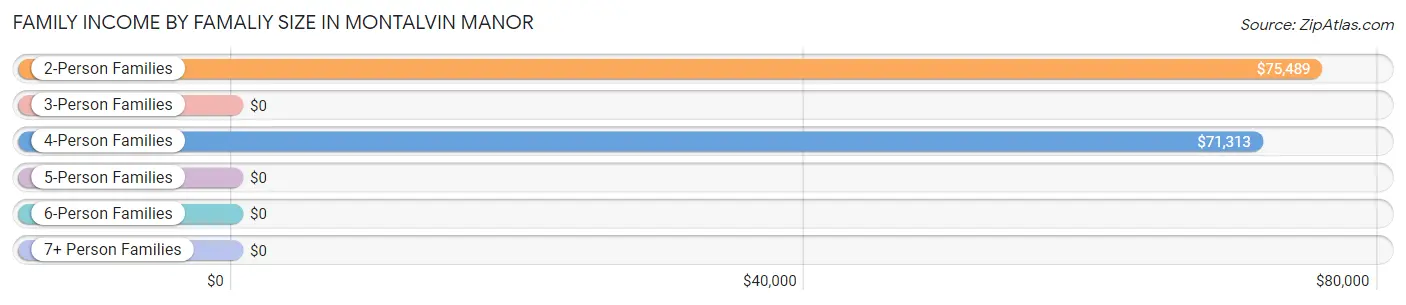
Family Income by Famaliy Size in Montalvin Manor
2-person families (165 | 32.6%) account for the highest median family income in Montalvin Manor with $75,489 per family, while 2-person families (165 | 32.6%) have the highest median income of $37,744 per family member.
| Income Bracket | # Families | Median Income |
| 2-Person Families | 165 (32.6%) | $75,489 |
| 3-Person Families | 105 (20.7%) | $0 |
| 4-Person Families | 101 (20.0%) | $71,313 |
| 5-Person Families | 75 (14.8%) | $0 |
| 6-Person Families | 8 (1.6%) | $0 |
| 7+ Person Families | 52 (10.3%) | $0 |
| Total | 506 (100.0%) | $77,391 |
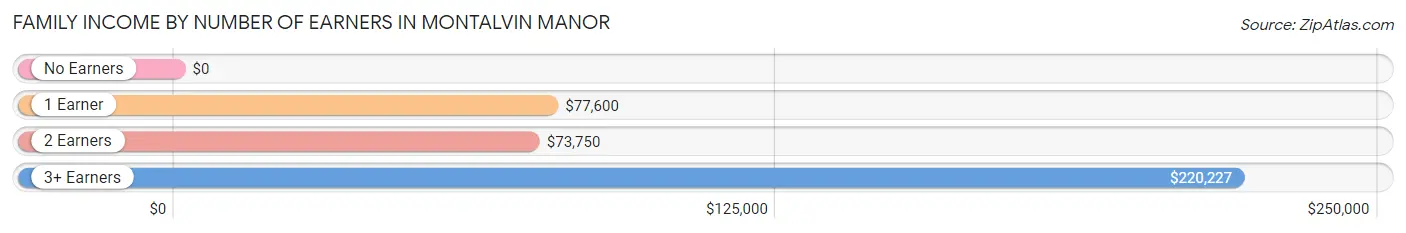
Family Income by Number of Earners in Montalvin Manor
| Number of Earners | # Families | Median Income |
| No Earners | 11 (2.2%) | $0 |
| 1 Earner | 230 (45.5%) | $77,600 |
| 2 Earners | 189 (37.3%) | $73,750 |
| 3+ Earners | 76 (15.0%) | $220,227 |
| Total | 506 (100.0%) | $77,391 |
Household Income in Montalvin Manor
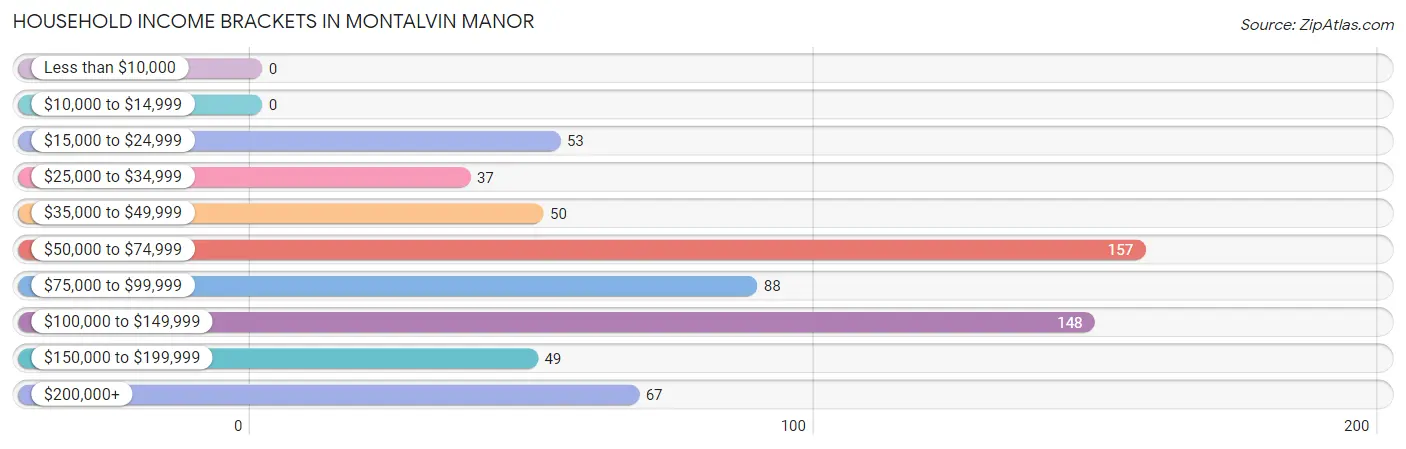
Household Income Brackets in Montalvin Manor
With 157 households falling in the category, the $50,000 to $74,999 income range is the most frequent in Montalvin Manor, accounting for 24.2% of all households.
| Income Bracket | # Households | % Households |
| Less than $10,000 | 0 | 0.0% |
| $10,000 to $14,999 | 0 | 0.0% |
| $15,000 to $24,999 | 53 | 8.2% |
| $25,000 to $34,999 | 37 | 5.7% |
| $35,000 to $49,999 | 50 | 7.7% |
| $50,000 to $74,999 | 157 | 24.2% |
| $75,000 to $99,999 | 88 | 13.6% |
| $100,000 to $149,999 | 148 | 22.8% |
| $150,000 to $199,999 | 49 | 7.6% |
| $200,000+ | 67 | 10.3% |
Household Income by Householder Age in Montalvin Manor
The median household income in Montalvin Manor is $77,083, with the highest median household income of $80,950 found in the 25 to 44 years age bracket for the primary householder. A total of 153 households (23.6%) fall into this category.
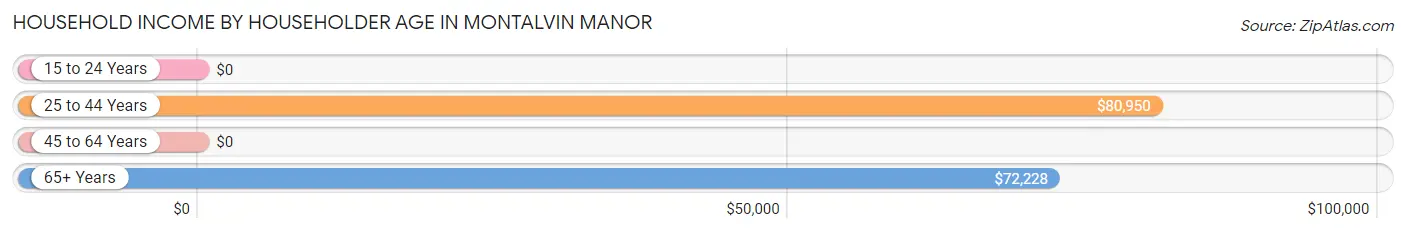
| Income Bracket | # Households | Median Income |
| 15 to 24 Years | 0 (0.0%) | $0 |
| 25 to 44 Years | 153 (23.6%) | $80,950 |
| 45 to 64 Years | 233 (35.9%) | $0 |
| 65+ Years | 263 (40.5%) | $72,228 |
| Total | 649 (100.0%) | $77,083 |
Poverty in Montalvin Manor
Income Below Poverty by Sex and Age in Montalvin Manor
With 3.9% poverty level for males and 11.0% for females among the residents of Montalvin Manor, 16 and 17 year old males and under 5 year old females are the most vulnerable to poverty, with 16 males (23.2%) and 16 females (35.6%) in their respective age groups living below the poverty level.
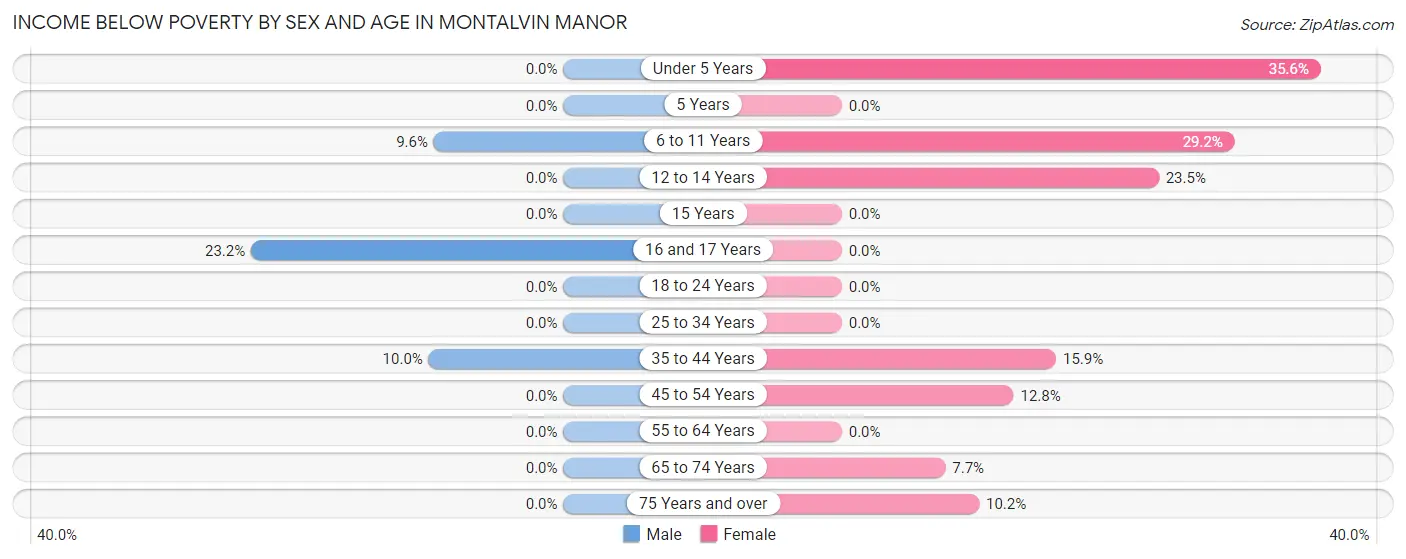
| Age Bracket | Male | Female |
| Under 5 Years | 0 (0.0%) | 16 (35.6%) |
| 5 Years | 0 (0.0%) | 0 (0.0%) |
| 6 to 11 Years | 15 (9.6%) | 7 (29.2%) |
| 12 to 14 Years | 0 (0.0%) | 16 (23.5%) |
| 15 Years | 0 (0.0%) | 0 (0.0%) |
| 16 and 17 Years | 16 (23.2%) | 0 (0.0%) |
| 18 to 24 Years | 0 (0.0%) | 0 (0.0%) |
| 25 to 34 Years | 0 (0.0%) | 0 (0.0%) |
| 35 to 44 Years | 18 (10.0%) | 21 (15.9%) |
| 45 to 54 Years | 0 (0.0%) | 19 (12.8%) |
| 55 to 64 Years | 0 (0.0%) | 0 (0.0%) |
| 65 to 74 Years | 0 (0.0%) | 5 (7.7%) |
| 75 Years and over | 0 (0.0%) | 21 (10.2%) |
| Total | 49 (3.9%) | 105 (11.0%) |
Income Above Poverty by Sex and Age in Montalvin Manor
According to the poverty statistics in Montalvin Manor, males aged 5 years and females aged 16 and 17 years are the age groups that are most secure financially, with 100.0% of males and 100.0% of females in these age groups living above the poverty line.
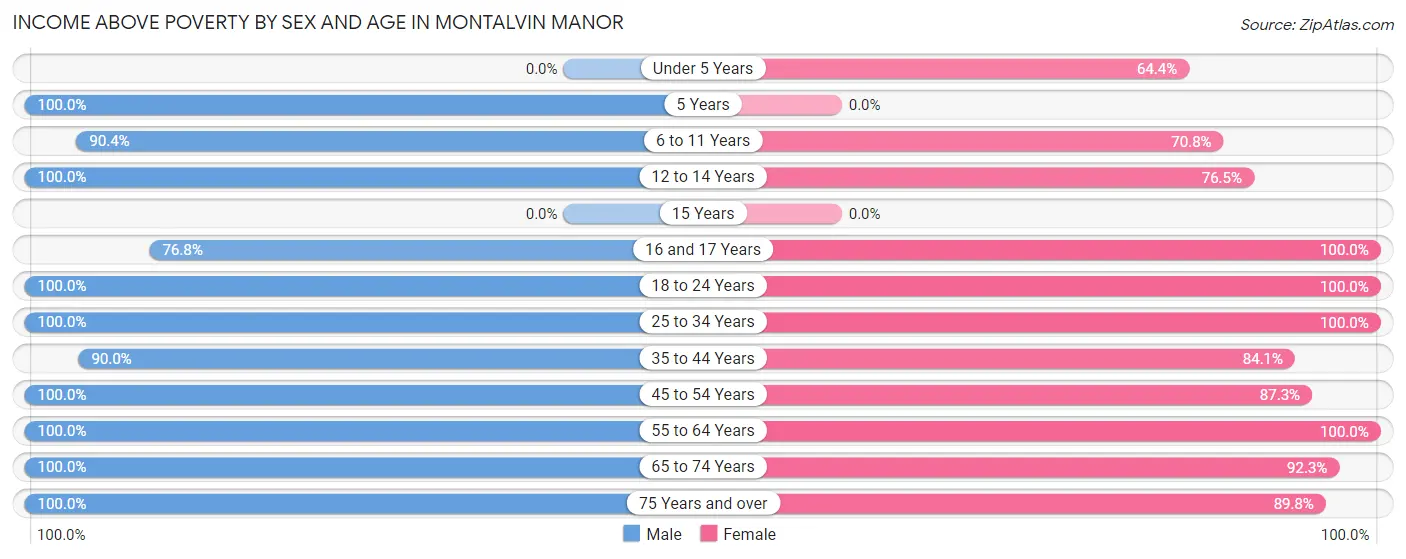
| Age Bracket | Male | Female |
| Under 5 Years | 0 (0.0%) | 29 (64.4%) |
| 5 Years | 74 (100.0%) | 0 (0.0%) |
| 6 to 11 Years | 141 (90.4%) | 17 (70.8%) |
| 12 to 14 Years | 26 (100.0%) | 52 (76.5%) |
| 15 Years | 0 (0.0%) | 0 (0.0%) |
| 16 and 17 Years | 53 (76.8%) | 15 (100.0%) |
| 18 to 24 Years | 115 (100.0%) | 17 (100.0%) |
| 25 to 34 Years | 220 (100.0%) | 116 (100.0%) |
| 35 to 44 Years | 162 (90.0%) | 111 (84.1%) |
| 45 to 54 Years | 77 (100.0%) | 130 (87.3%) |
| 55 to 64 Years | 141 (100.0%) | 114 (100.0%) |
| 65 to 74 Years | 97 (100.0%) | 60 (92.3%) |
| 75 Years and over | 89 (100.0%) | 185 (89.8%) |
| Total | 1,195 (96.1%) | 846 (89.0%) |
Income Below Poverty Among Married-Couple Families in Montalvin Manor
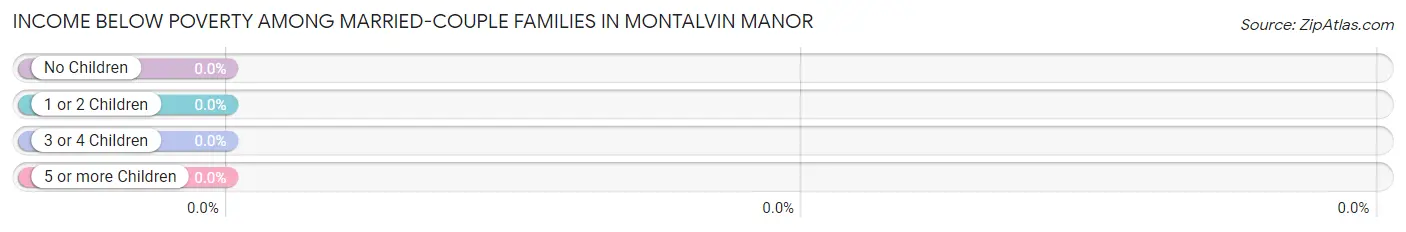
| Children | Above Poverty | Below Poverty |
| No Children | 174 (100.0%) | 0 (0.0%) |
| 1 or 2 Children | 99 (100.0%) | 0 (0.0%) |
| 3 or 4 Children | 52 (100.0%) | 0 (0.0%) |
| 5 or more Children | 0 (0.0%) | 0 (0.0%) |
| Total | 325 (100.0%) | 0 (0.0%) |
Income Below Poverty Among Single-Parent Households in Montalvin Manor
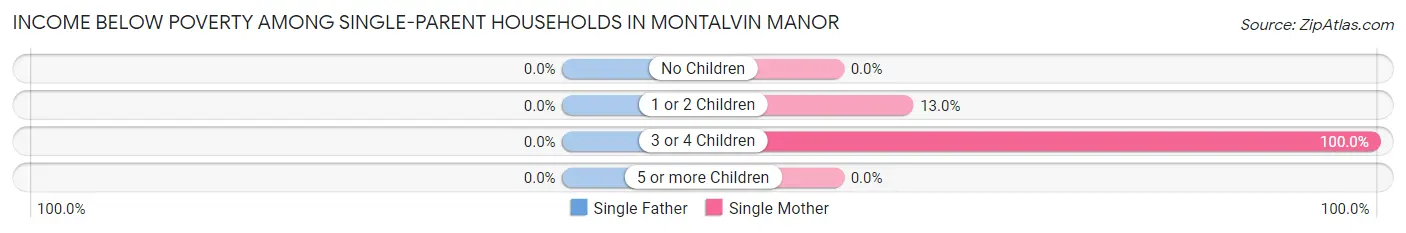
| Children | Single Father | Single Mother |
| No Children | 0 (0.0%) | 0 (0.0%) |
| 1 or 2 Children | 0 (0.0%) | 7 (13.0%) |
| 3 or 4 Children | 0 (0.0%) | 14 (100.0%) |
| 5 or more Children | 0 (0.0%) | 0 (0.0%) |
| Total | 0 (0.0%) | 21 (15.9%) |
Income Below Poverty Among Married-Couple vs Single-Parent Households in Montalvin Manor
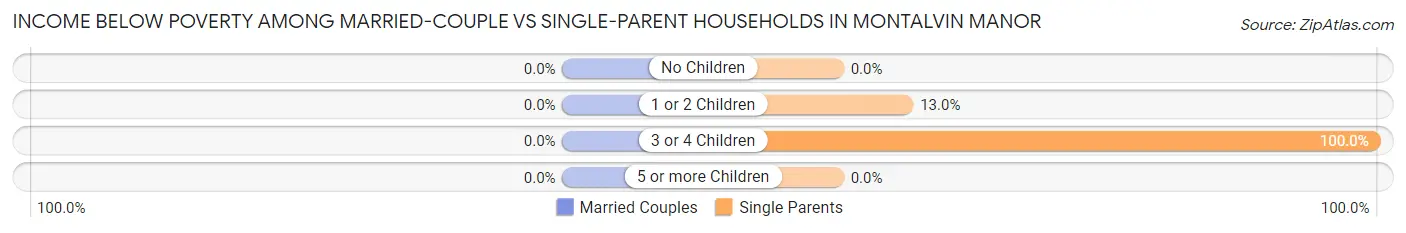
| Children | Married-Couple Families | Single-Parent Households |
| No Children | 0 (0.0%) | 0 (0.0%) |
| 1 or 2 Children | 0 (0.0%) | 7 (13.0%) |
| 3 or 4 Children | 0 (0.0%) | 14 (100.0%) |
| 5 or more Children | 0 (0.0%) | 0 (0.0%) |
| Total | 0 (0.0%) | 21 (11.6%) |
Race in Montalvin Manor
The most populous races in Montalvin Manor are Hispanic or Latino (1,545 | 70.4%), Some other Race (1,031 | 47.0%), and White / Caucasian (563 | 25.7%).
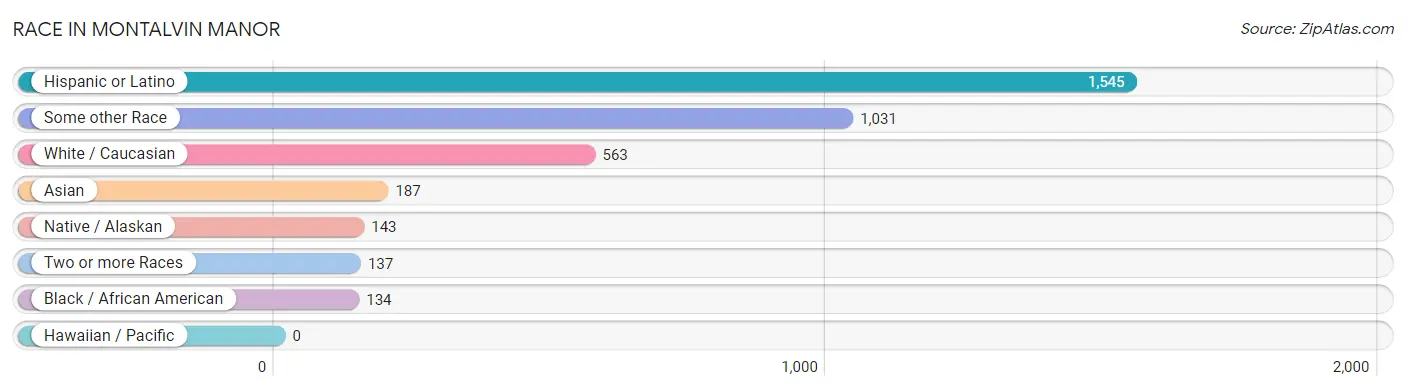
| Race | # Population | % Population |
| Asian | 187 | 8.5% |
| Black / African American | 134 | 6.1% |
| Hawaiian / Pacific | 0 | 0.0% |
| Hispanic or Latino | 1,545 | 70.4% |
| Native / Alaskan | 143 | 6.5% |
| White / Caucasian | 563 | 25.7% |
| Two or more Races | 137 | 6.2% |
| Some other Race | 1,031 | 47.0% |
| Total | 2,195 | 100.0% |
Ancestry in Montalvin Manor
The most populous ancestries reported in Montalvin Manor are Mexican (991 | 45.2%), Central American (446 | 20.3%), Salvadoran (436 | 19.9%), Mexican American Indian (177 | 8.1%), and American (105 | 4.8%), together accounting for 98.2% of all Montalvin Manor residents.
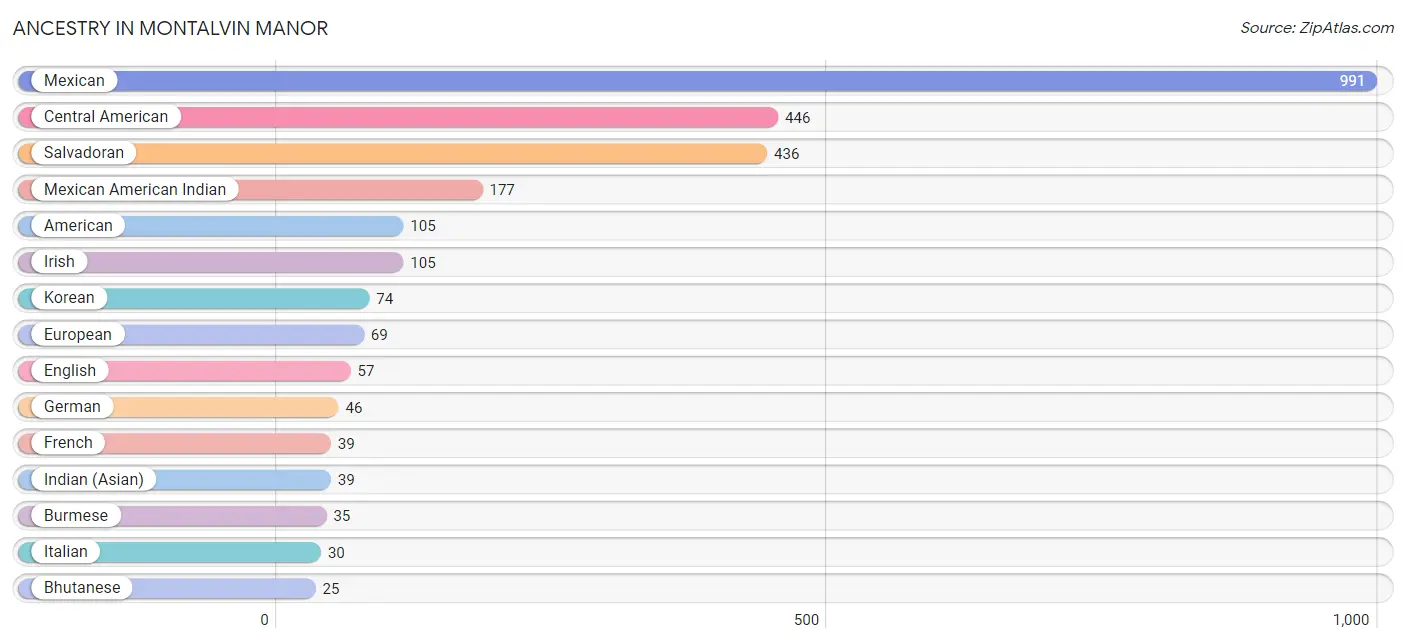
| Ancestry | # Population | % Population |
| American | 105 | 4.8% |
| Arab | 13 | 0.6% |
| Bhutanese | 25 | 1.1% |
| Burmese | 35 | 1.6% |
| Central American | 446 | 20.3% |
| Central American Indian | 10 | 0.5% |
| Creek | 6 | 0.3% |
| Cuban | 17 | 0.8% |
| English | 57 | 2.6% |
| European | 69 | 3.1% |
| French | 39 | 1.8% |
| German | 46 | 2.1% |
| Honduran | 10 | 0.5% |
| Indian (Asian) | 39 | 1.8% |
| Irish | 105 | 4.8% |
| Italian | 30 | 1.4% |
| Korean | 74 | 3.4% |
| Malaysian | 24 | 1.1% |
| Mexican | 991 | 45.2% |
| Mexican American Indian | 177 | 8.1% |
| Nigerian | 9 | 0.4% |
| Polish | 8 | 0.4% |
| Salvadoran | 436 | 19.9% |
| Sri Lankan | 22 | 1.0% |
| Subsaharan African | 9 | 0.4% | View All 25 Rows |
Immigrants in Montalvin Manor
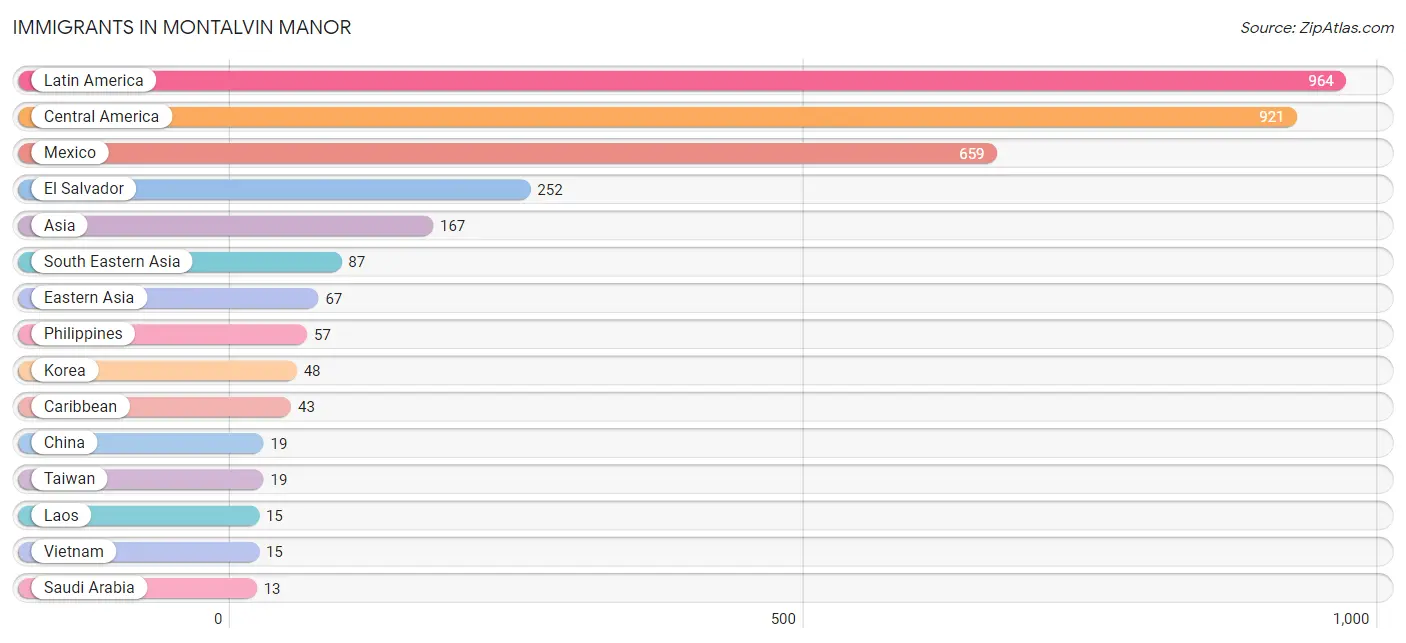
The most numerous immigrant groups reported in Montalvin Manor came from Latin America (964 | 43.9%), Central America (921 | 42.0%), Mexico (659 | 30.0%), El Salvador (252 | 11.5%), and Asia (167 | 7.6%), together accounting for 135.0% of all Montalvin Manor residents.
| Immigration Origin | # Population | % Population |
| Asia | 167 | 7.6% |
| Caribbean | 43 | 2.0% |
| Central America | 921 | 42.0% |
| China | 19 | 0.9% |
| Eastern Asia | 67 | 3.0% |
| Eastern Europe | 8 | 0.4% |
| El Salvador | 252 | 11.5% |
| Europe | 8 | 0.4% |
| Honduras | 10 | 0.5% |
| Korea | 48 | 2.2% |
| Laos | 15 | 0.7% |
| Latin America | 964 | 43.9% |
| Mexico | 659 | 30.0% |
| Philippines | 57 | 2.6% |
| Poland | 8 | 0.4% |
| Saudi Arabia | 13 | 0.6% |
| South Eastern Asia | 87 | 4.0% |
| Taiwan | 19 | 0.9% |
| Vietnam | 15 | 0.7% |
| Western Asia | 13 | 0.6% | View All 20 Rows |
Sex and Age in Montalvin Manor
Sex and Age in Montalvin Manor
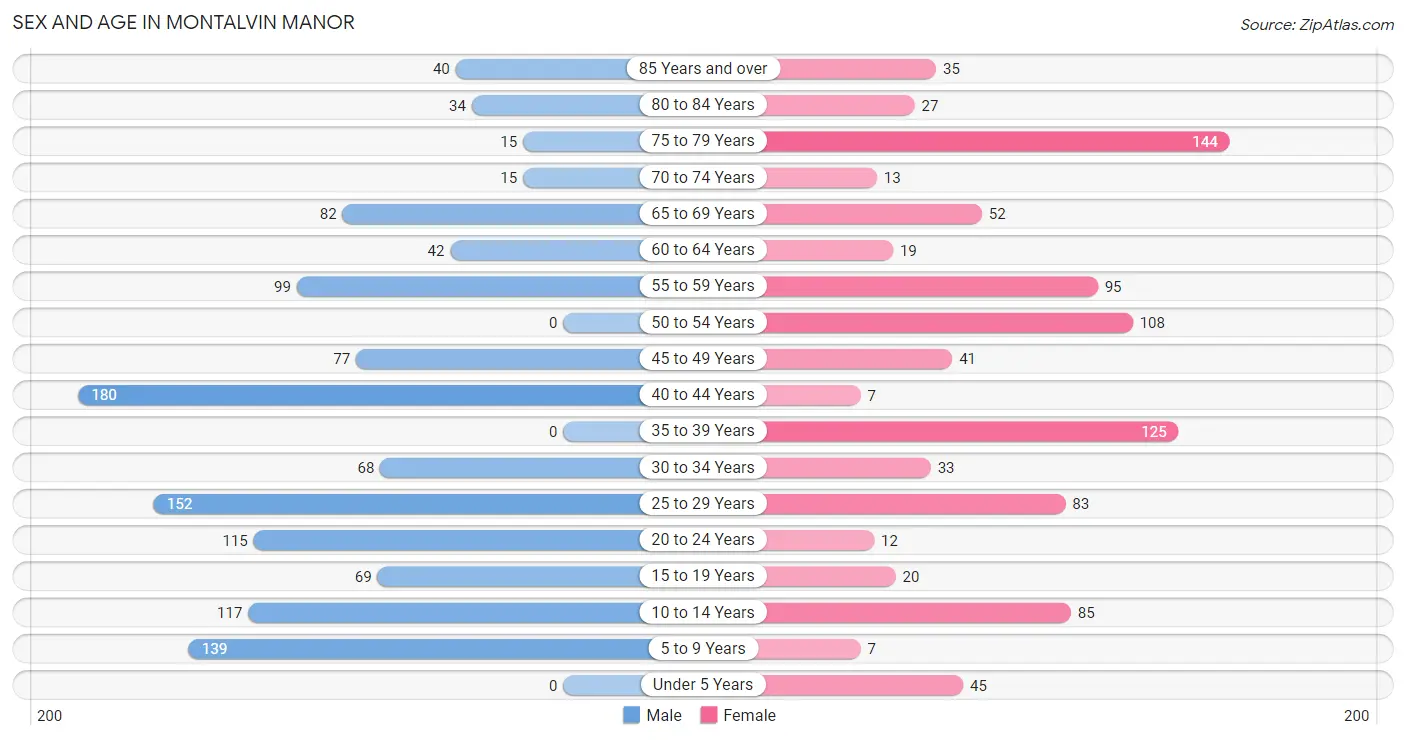
The most populous age groups in Montalvin Manor are 40 to 44 Years (180 | 14.5%) for men and 75 to 79 Years (144 | 15.1%) for women.
| Age Bracket | Male | Female |
| Under 5 Years | 0 (0.0%) | 45 (4.7%) |
| 5 to 9 Years | 139 (11.2%) | 7 (0.7%) |
| 10 to 14 Years | 117 (9.4%) | 85 (8.9%) |
| 15 to 19 Years | 69 (5.6%) | 20 (2.1%) |
| 20 to 24 Years | 115 (9.2%) | 12 (1.3%) |
| 25 to 29 Years | 152 (12.2%) | 83 (8.7%) |
| 30 to 34 Years | 68 (5.5%) | 33 (3.5%) |
| 35 to 39 Years | 0 (0.0%) | 125 (13.1%) |
| 40 to 44 Years | 180 (14.5%) | 7 (0.7%) |
| 45 to 49 Years | 77 (6.2%) | 41 (4.3%) |
| 50 to 54 Years | 0 (0.0%) | 108 (11.4%) |
| 55 to 59 Years | 99 (8.0%) | 95 (10.0%) |
| 60 to 64 Years | 42 (3.4%) | 19 (2.0%) |
| 65 to 69 Years | 82 (6.6%) | 52 (5.5%) |
| 70 to 74 Years | 15 (1.2%) | 13 (1.4%) |
| 75 to 79 Years | 15 (1.2%) | 144 (15.1%) |
| 80 to 84 Years | 34 (2.7%) | 27 (2.8%) |
| 85 Years and over | 40 (3.2%) | 35 (3.7%) |
| Total | 1,244 (100.0%) | 951 (100.0%) |
Families and Households in Montalvin Manor
Median Family Size in Montalvin Manor
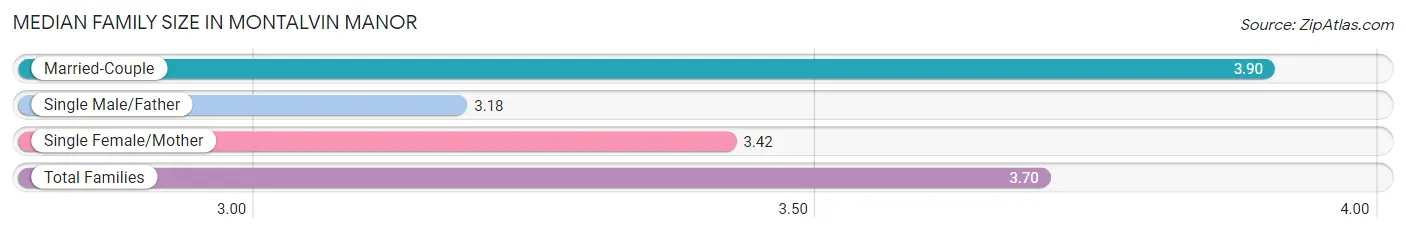
The median family size in Montalvin Manor is 3.70 persons per family, with married-couple families (325 | 64.2%) accounting for the largest median family size of 3.9 persons per family. On the other hand, single male/father families (49 | 9.7%) represent the smallest median family size with 3.18 persons per family.
| Family Type | # Families | Family Size |
| Married-Couple | 325 (64.2%) | 3.90 |
| Single Male/Father | 49 (9.7%) | 3.18 |
| Single Female/Mother | 132 (26.1%) | 3.42 |
| Total Families | 506 (100.0%) | 3.70 |
Median Household Size in Montalvin Manor
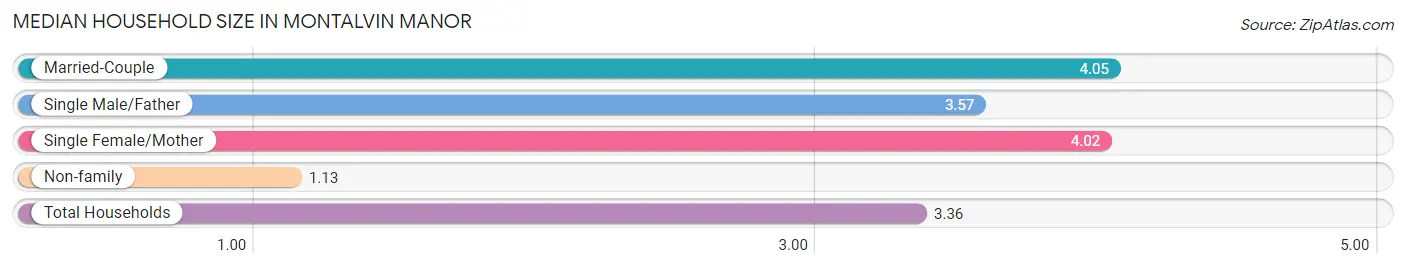
The median household size in Montalvin Manor is 3.36 persons per household, with married-couple households (325 | 50.1%) accounting for the largest median household size of 4.05 persons per household. non-family households (143 | 22.0%) represent the smallest median household size with 1.13 persons per household.
| Household Type | # Households | Household Size |
| Married-Couple | 325 (50.1%) | 4.05 |
| Single Male/Father | 49 (7.5%) | 3.57 |
| Single Female/Mother | 132 (20.3%) | 4.02 |
| Non-family | 143 (22.0%) | 1.13 |
| Total Households | 649 (100.0%) | 3.36 |
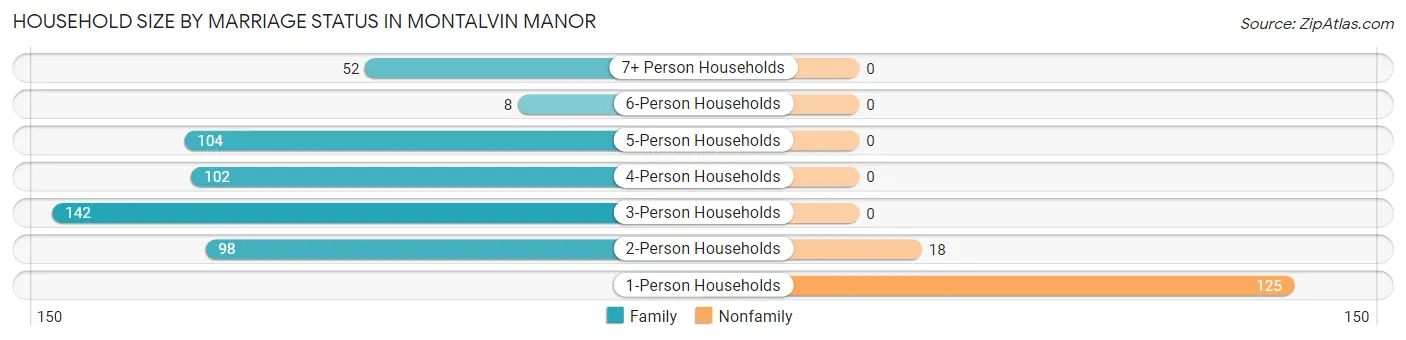
Household Size by Marriage Status in Montalvin Manor
Out of a total of 649 households in Montalvin Manor, 506 (78.0%) are family households, while 143 (22.0%) are nonfamily households. The most numerous type of family households are 3-person households, comprising 142, and the most common type of nonfamily households are 1-person households, comprising 125.
| Household Size | Family Households | Nonfamily Households |
| 1-Person Households | - | 125 (19.3%) |
| 2-Person Households | 98 (15.1%) | 18 (2.8%) |
| 3-Person Households | 142 (21.9%) | 0 (0.0%) |
| 4-Person Households | 102 (15.7%) | 0 (0.0%) |
| 5-Person Households | 104 (16.0%) | 0 (0.0%) |
| 6-Person Households | 8 (1.2%) | 0 (0.0%) |
| 7+ Person Households | 52 (8.0%) | 0 (0.0%) |
| Total | 506 (78.0%) | 143 (22.0%) |
Female Fertility in Montalvin Manor
Fertility by Age in Montalvin Manor
| Age Bracket | Women with Births | Births / 1,000 Women |
| 15 to 19 years | 0 (0.0%) | 0.0 |
| 20 to 34 years | 0 (0.0%) | 0.0 |
| 35 to 50 years | 0 (0.0%) | 0.0 |
| Total | 0 (0.0%) | 0.0 |
Fertility by Age by Marriage Status in Montalvin Manor
| Age Bracket | Married | Unmarried |
| 15 to 19 years | 0 (0.0%) | 0 (0.0%) |
| 20 to 34 years | 0 (0.0%) | 0 (0.0%) |
| 35 to 50 years | 0 (0.0%) | 0 (0.0%) |
| Total | 0 (0.0%) | 0 (0.0%) |
Fertility by Education in Montalvin Manor
| Educational Attainment | Women with Births | Births / 1,000 Women |
| Less than High School | 0 (0.0%) | 0.0 |
| High School Diploma | 0 (0.0%) | 0.0 |
| College or Associate's Degree | 0 (0.0%) | 0.0 |
| Bachelor's Degree | 0 (0.0%) | 0.0 |
| Graduate Degree | 0 (0.0%) | 0.0 |
| Total | 0 (0.0%) | 0.0 |
Fertility by Education by Marriage Status in Montalvin Manor
| Educational Attainment | Married | Unmarried |
| Less than High School | 0 (0.0%) | 0 (0.0%) |
| High School Diploma | 0 (0.0%) | 0 (0.0%) |
| College or Associate's Degree | 0 (0.0%) | 0 (0.0%) |
| Bachelor's Degree | 0 (0.0%) | 0 (0.0%) |
| Graduate Degree | 0 (0.0%) | 0 (0.0%) |
| Total | 0 (0.0%) | 0 (0.0%) |
Employment Characteristics in Montalvin Manor
Employment by Class of Employer in Montalvin Manor
Among the 1,085 employed individuals in Montalvin Manor, private company employees (810 | 74.7%), not-for-profit organizations (147 | 13.6%), and self-employed (not incorporated) (48 | 4.4%) make up the most common classes of employment.
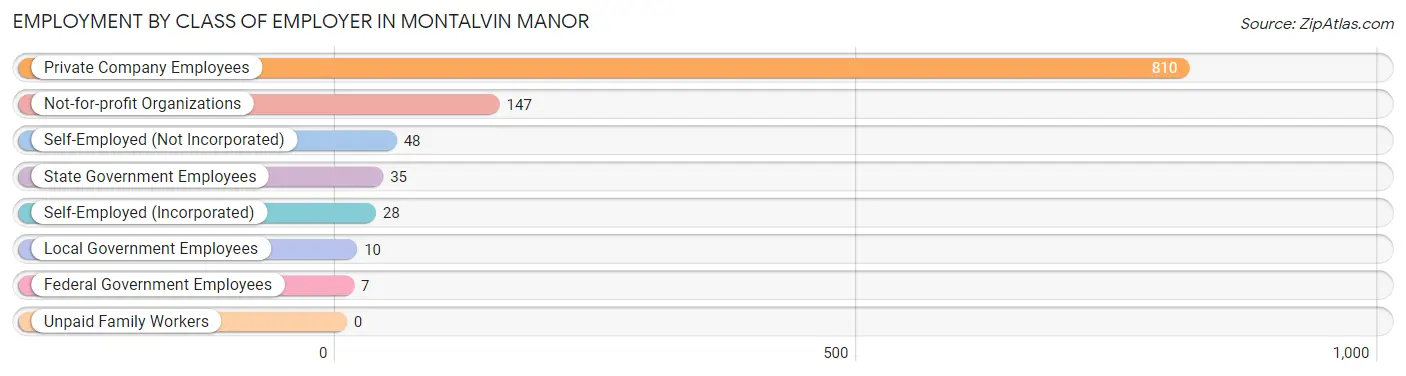
| Employer Class | # Employees | % Employees |
| Private Company Employees | 810 | 74.7% |
| Self-Employed (Incorporated) | 28 | 2.6% |
| Self-Employed (Not Incorporated) | 48 | 4.4% |
| Not-for-profit Organizations | 147 | 13.6% |
| Local Government Employees | 10 | 0.9% |
| State Government Employees | 35 | 3.2% |
| Federal Government Employees | 7 | 0.6% |
| Unpaid Family Workers | 0 | 0.0% |
| Total | 1,085 | 100.0% |
Employment Status by Age in Montalvin Manor
According to the labor force statistics for Montalvin Manor, out of the total population over 16 years of age (1,802), 62.4% or 1,124 individuals are in the labor force, with 3.5% or 39 of them unemployed. The age group with the highest labor force participation rate is 20 to 24 years, with 100.0% or 127 individuals in the labor force. Within the labor force, the 25 to 29 years age range has the highest percentage of unemployed individuals, with 16.6% or 39 of them being unemployed.
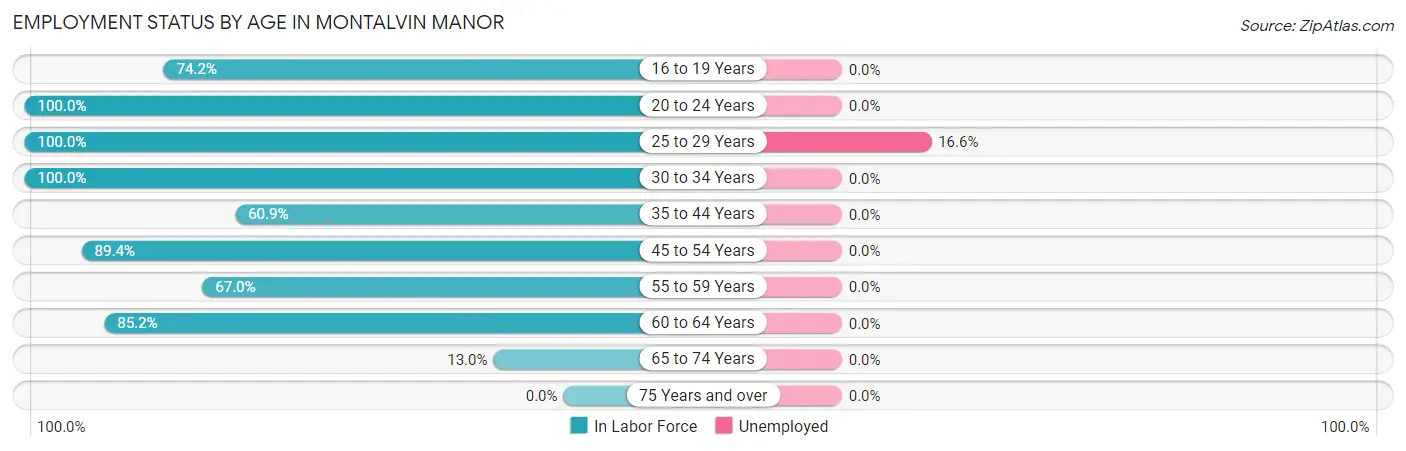
| Age Bracket | In Labor Force | Unemployed |
| 16 to 19 Years | 66 (74.2%) | 0 (0.0%) |
| 20 to 24 Years | 127 (100.0%) | 0 (0.0%) |
| 25 to 29 Years | 235 (100.0%) | 39 (16.6%) |
| 30 to 34 Years | 101 (100.0%) | 0 (0.0%) |
| 35 to 44 Years | 190 (60.9%) | 0 (0.0%) |
| 45 to 54 Years | 202 (89.4%) | 0 (0.0%) |
| 55 to 59 Years | 130 (67.0%) | 0 (0.0%) |
| 60 to 64 Years | 52 (85.2%) | 0 (0.0%) |
| 65 to 74 Years | 21 (13.0%) | 0 (0.0%) |
| 75 Years and over | 0 (0.0%) | 0 (0.0%) |
| Total | 1,124 (62.4%) | 39 (3.5%) |
Employment Status by Educational Attainment in Montalvin Manor
According to labor force statistics for Montalvin Manor, 80.6% of individuals (910) out of the total population between 25 and 64 years of age (1,129) are in the labor force, with 4.3% or 39 of them being unemployed. The group with the highest labor force participation rate are those with the educational attainment of college / associate degree, with 87.4% or 277 individuals in the labor force. Within the labor force, individuals with bachelor's degree or higher education have the highest percentage of unemployment, with 18.1% or 39 of them being unemployed.
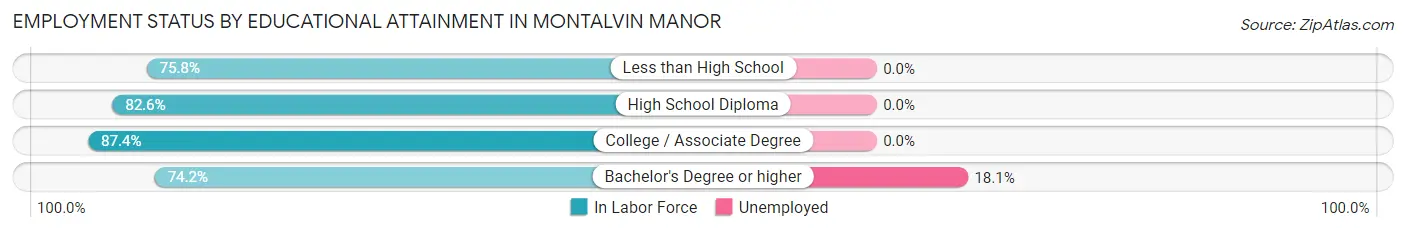
| Educational Attainment | In Labor Force | Unemployed |
| Less than High School | 147 (75.8%) | 0 (0.0%) |
| High School Diploma | 270 (82.6%) | 0 (0.0%) |
| College / Associate Degree | 277 (87.4%) | 0 (0.0%) |
| Bachelor's Degree or higher | 216 (74.2%) | 53 (18.1%) |
| Total | 910 (80.6%) | 49 (4.3%) |
Employment Occupations by Sex in Montalvin Manor
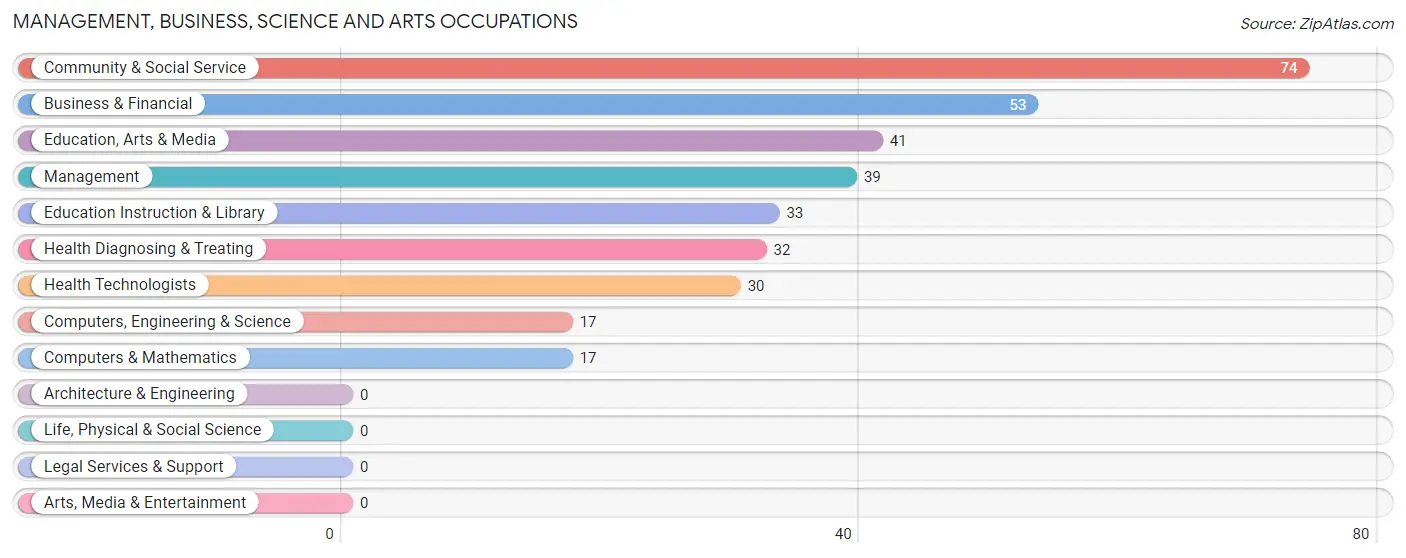
Management, Business, Science and Arts Occupations
The most common Management, Business, Science and Arts occupations in Montalvin Manor are Community & Social Service (74 | 6.8%), Business & Financial (53 | 4.9%), Education, Arts & Media (41 | 3.8%), Management (39 | 3.6%), and Education Instruction & Library (33 | 3.0%).
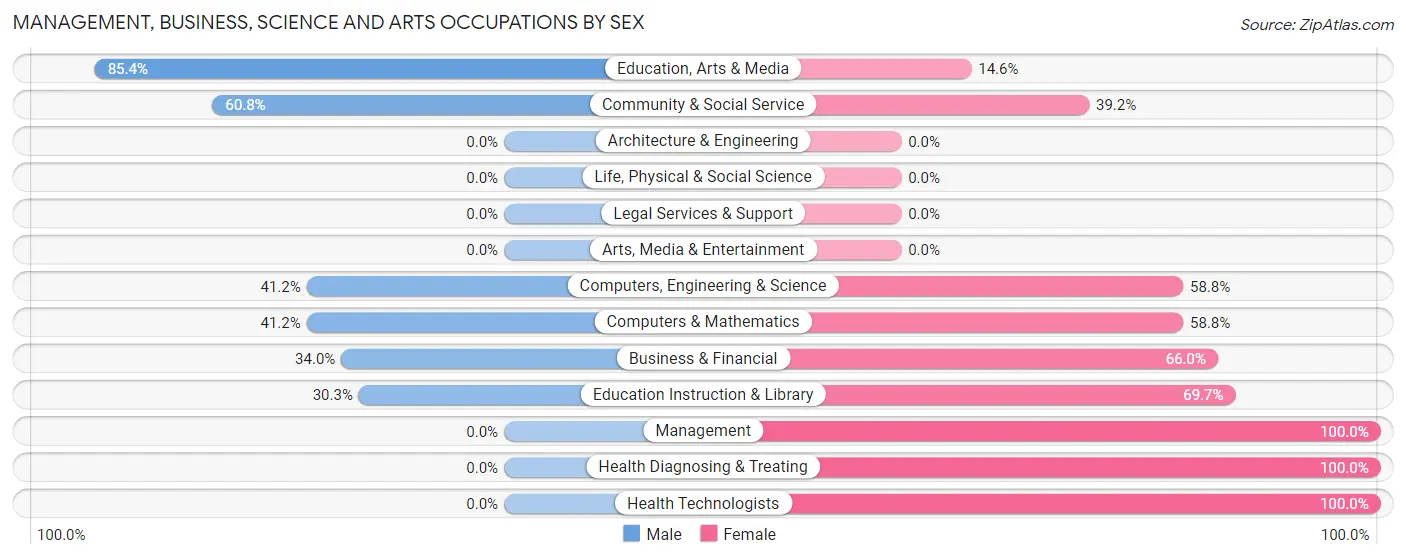
Management, Business, Science and Arts Occupations by Sex
Within the Management, Business, Science and Arts occupations in Montalvin Manor, the most male-oriented occupations are Education, Arts & Media (85.4%), Community & Social Service (60.8%), and Computers, Engineering & Science (41.2%), while the most female-oriented occupations are Management (100.0%), Health Diagnosing & Treating (100.0%), and Health Technologists (100.0%).
| Occupation | Male | Female |
| Management | 0 (0.0%) | 39 (100.0%) |
| Business & Financial | 18 (34.0%) | 35 (66.0%) |
| Computers, Engineering & Science | 7 (41.2%) | 10 (58.8%) |
| Computers & Mathematics | 7 (41.2%) | 10 (58.8%) |
| Architecture & Engineering | 0 (0.0%) | 0 (0.0%) |
| Life, Physical & Social Science | 0 (0.0%) | 0 (0.0%) |
| Community & Social Service | 45 (60.8%) | 29 (39.2%) |
| Education, Arts & Media | 35 (85.4%) | 6 (14.6%) |
| Legal Services & Support | 0 (0.0%) | 0 (0.0%) |
| Education Instruction & Library | 10 (30.3%) | 23 (69.7%) |
| Arts, Media & Entertainment | 0 (0.0%) | 0 (0.0%) |
| Health Diagnosing & Treating | 0 (0.0%) | 32 (100.0%) |
| Health Technologists | 0 (0.0%) | 30 (100.0%) |
| Total (Category) | 70 (32.6%) | 145 (67.4%) |
| Total (Overall) | 660 (60.8%) | 425 (39.2%) |
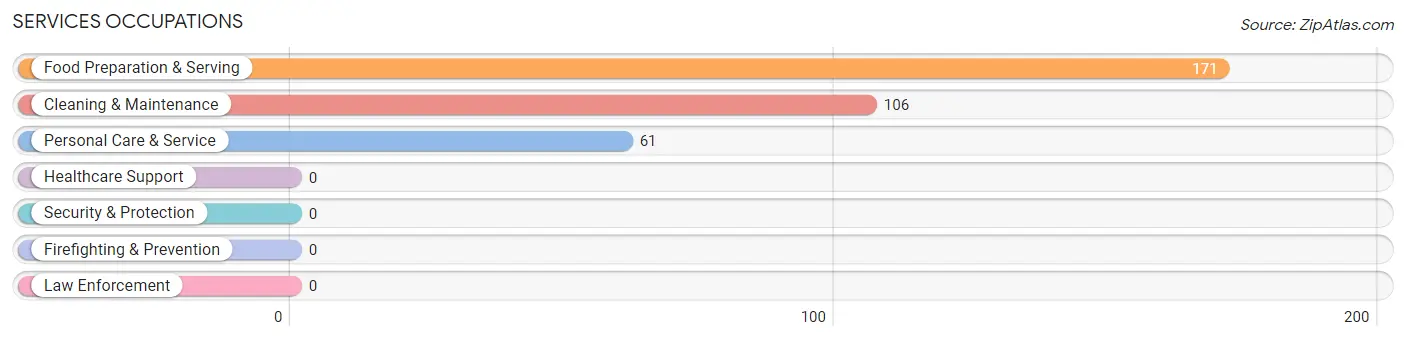
Services Occupations
The most common Services occupations in Montalvin Manor are Food Preparation & Serving (171 | 15.8%), Cleaning & Maintenance (106 | 9.8%), and Personal Care & Service (61 | 5.6%).
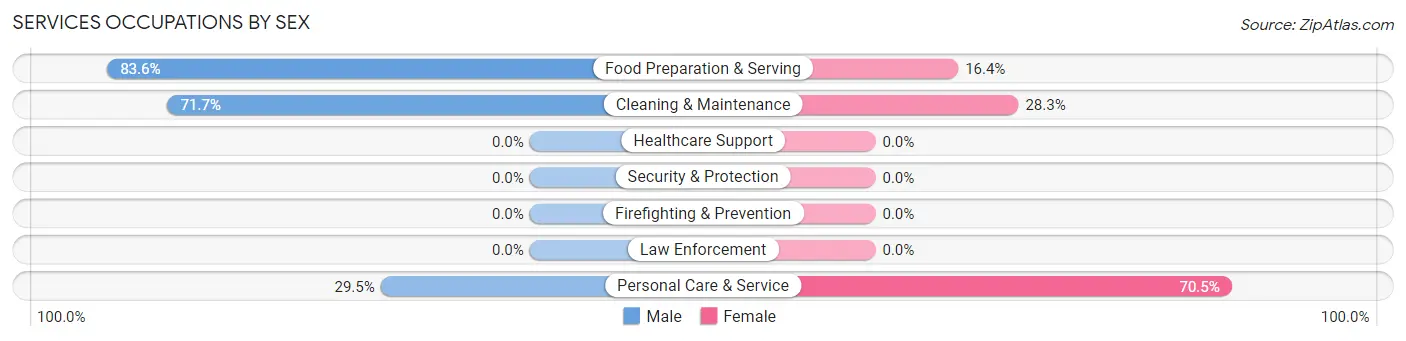
Services Occupations by Sex
Within the Services occupations in Montalvin Manor, the most male-oriented occupations are Food Preparation & Serving (83.6%), Cleaning & Maintenance (71.7%), and Personal Care & Service (29.5%), while the most female-oriented occupations are Personal Care & Service (70.5%), Cleaning & Maintenance (28.3%), and Food Preparation & Serving (16.4%).
| Occupation | Male | Female |
| Healthcare Support | 0 (0.0%) | 0 (0.0%) |
| Security & Protection | 0 (0.0%) | 0 (0.0%) |
| Firefighting & Prevention | 0 (0.0%) | 0 (0.0%) |
| Law Enforcement | 0 (0.0%) | 0 (0.0%) |
| Food Preparation & Serving | 143 (83.6%) | 28 (16.4%) |
| Cleaning & Maintenance | 76 (71.7%) | 30 (28.3%) |
| Personal Care & Service | 18 (29.5%) | 43 (70.5%) |
| Total (Category) | 237 (70.1%) | 101 (29.9%) |
| Total (Overall) | 660 (60.8%) | 425 (39.2%) |
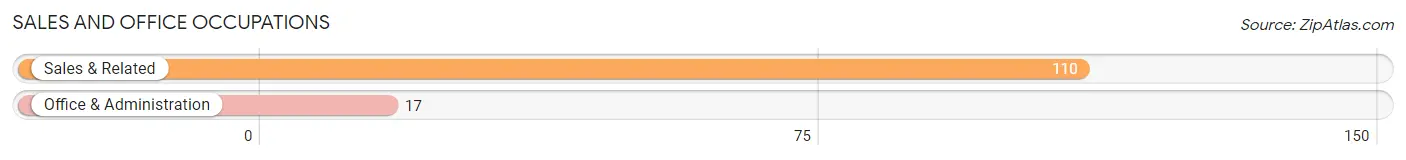
Sales and Office Occupations
The most common Sales and Office occupations in Montalvin Manor are Sales & Related (110 | 10.1%), and Office & Administration (17 | 1.6%).
Sales and Office Occupations by Sex
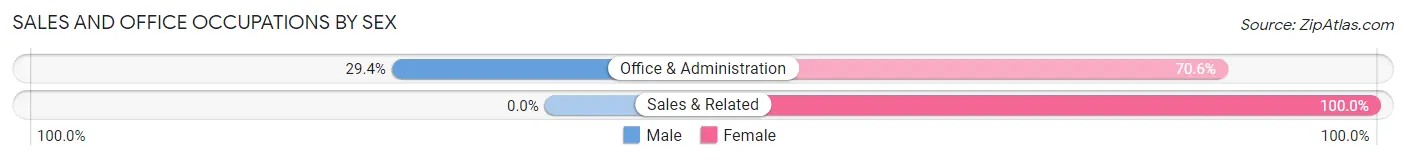
| Occupation | Male | Female |
| Sales & Related | 0 (0.0%) | 110 (100.0%) |
| Office & Administration | 5 (29.4%) | 12 (70.6%) |
| Total (Category) | 5 (3.9%) | 122 (96.1%) |
| Total (Overall) | 660 (60.8%) | 425 (39.2%) |
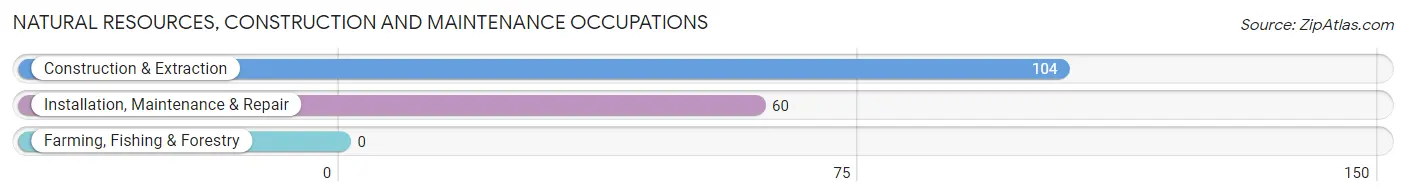
Natural Resources, Construction and Maintenance Occupations
The most common Natural Resources, Construction and Maintenance occupations in Montalvin Manor are Construction & Extraction (104 | 9.6%), and Installation, Maintenance & Repair (60 | 5.5%).
Natural Resources, Construction and Maintenance Occupations by Sex
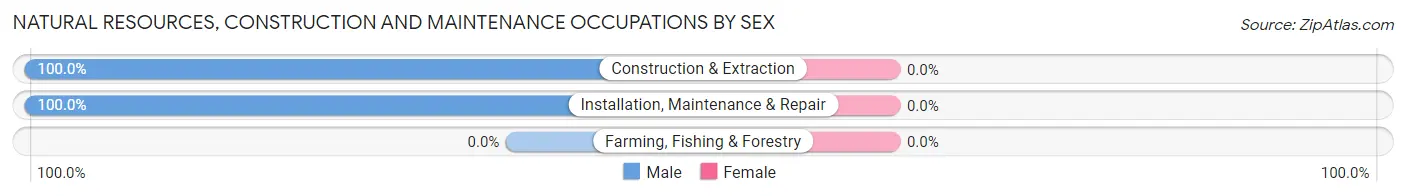
| Occupation | Male | Female |
| Farming, Fishing & Forestry | 0 (0.0%) | 0 (0.0%) |
| Construction & Extraction | 104 (100.0%) | 0 (0.0%) |
| Installation, Maintenance & Repair | 60 (100.0%) | 0 (0.0%) |
| Total (Category) | 164 (100.0%) | 0 (0.0%) |
| Total (Overall) | 660 (60.8%) | 425 (39.2%) |
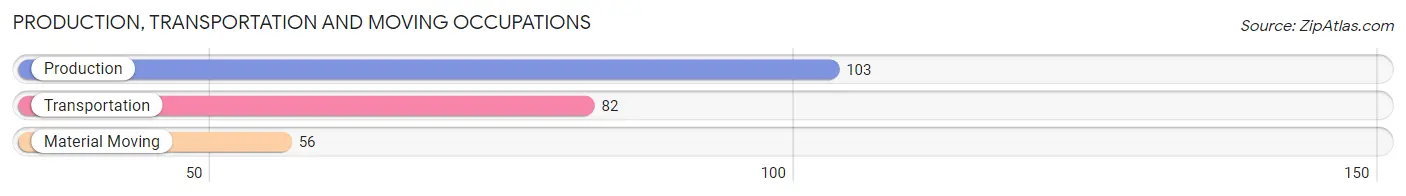
Production, Transportation and Moving Occupations
The most common Production, Transportation and Moving occupations in Montalvin Manor are Production (103 | 9.5%), Transportation (82 | 7.6%), and Material Moving (56 | 5.2%).
Production, Transportation and Moving Occupations by Sex
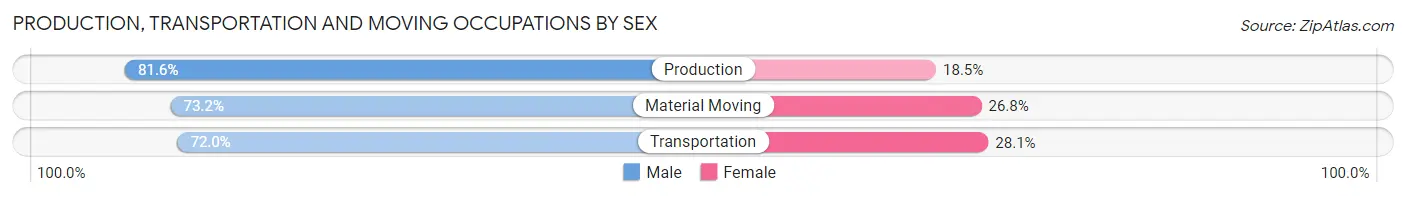
| Occupation | Male | Female |
| Production | 84 (81.6%) | 19 (18.4%) |
| Transportation | 59 (72.0%) | 23 (28.1%) |
| Material Moving | 41 (73.2%) | 15 (26.8%) |
| Total (Category) | 184 (76.3%) | 57 (23.6%) |
| Total (Overall) | 660 (60.8%) | 425 (39.2%) |
Employment Industries by Sex in Montalvin Manor
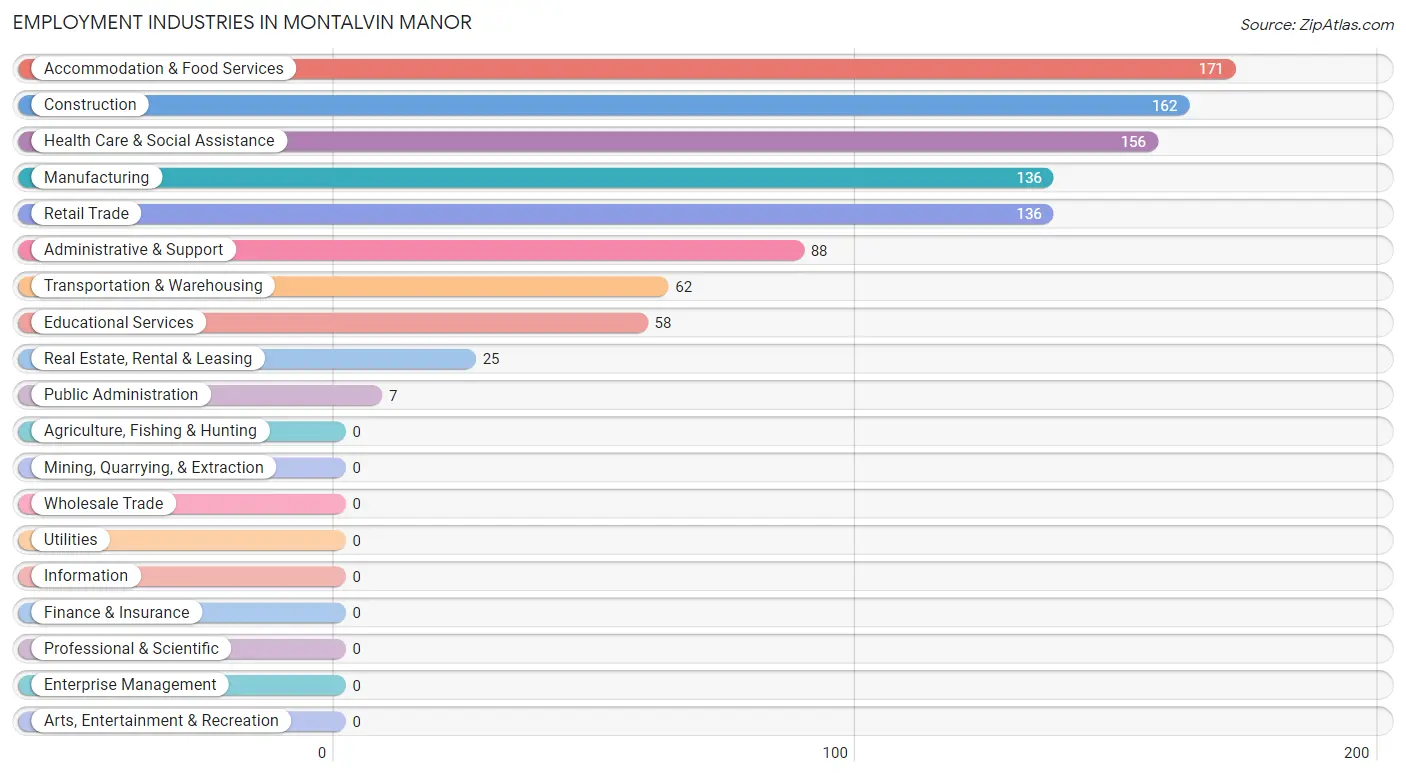
Employment Industries in Montalvin Manor
The major employment industries in Montalvin Manor include Accommodation & Food Services (171 | 15.8%), Construction (162 | 14.9%), Health Care & Social Assistance (156 | 14.4%), Manufacturing (136 | 12.5%), and Retail Trade (136 | 12.5%).
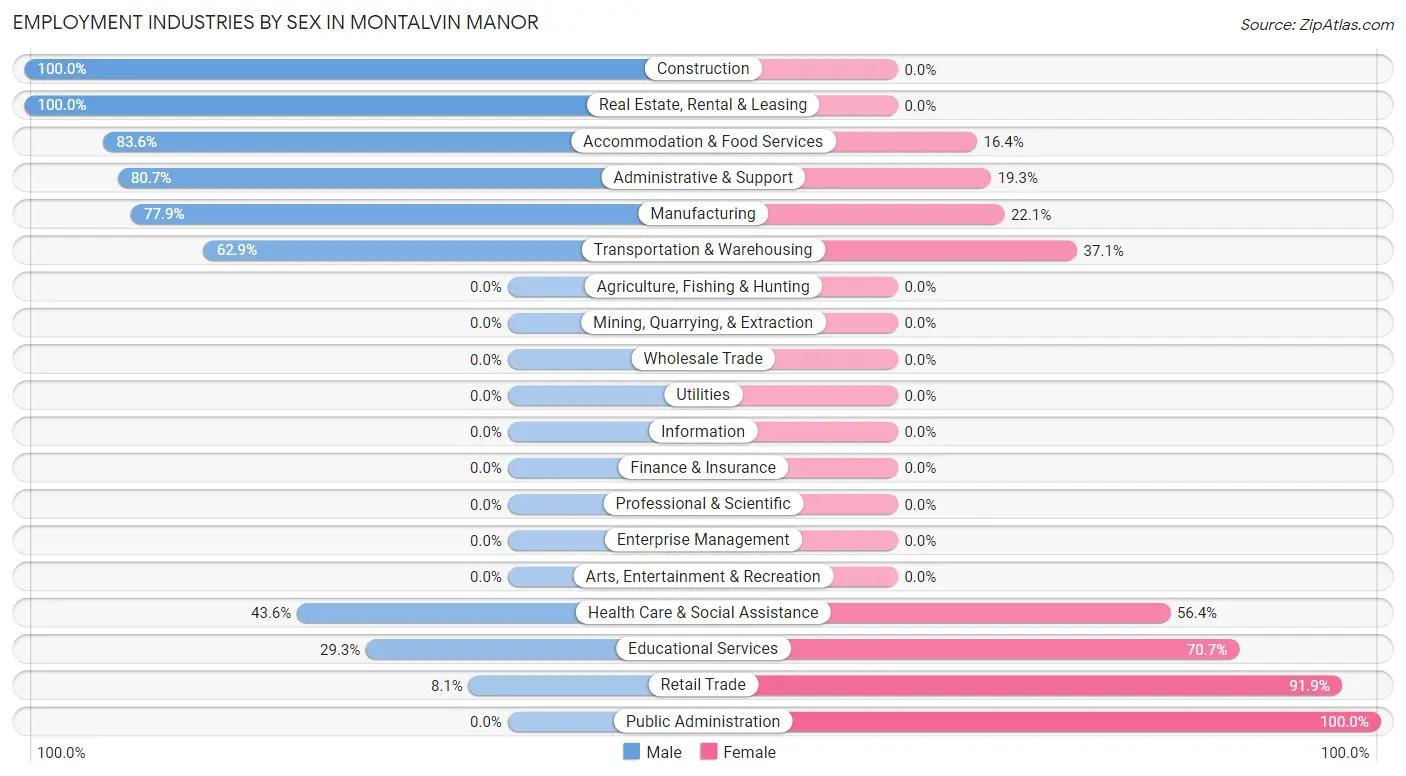
Employment Industries by Sex in Montalvin Manor
The Montalvin Manor industries that see more men than women are Construction (100.0%), Real Estate, Rental & Leasing (100.0%), and Accommodation & Food Services (83.6%), whereas the industries that tend to have a higher number of women are Public Administration (100.0%), Retail Trade (91.9%), and Educational Services (70.7%).
| Industry | Male | Female |
| Agriculture, Fishing & Hunting | 0 (0.0%) | 0 (0.0%) |
| Mining, Quarrying, & Extraction | 0 (0.0%) | 0 (0.0%) |
| Construction | 162 (100.0%) | 0 (0.0%) |
| Manufacturing | 106 (77.9%) | 30 (22.1%) |
| Wholesale Trade | 0 (0.0%) | 0 (0.0%) |
| Retail Trade | 11 (8.1%) | 125 (91.9%) |
| Transportation & Warehousing | 39 (62.9%) | 23 (37.1%) |
| Utilities | 0 (0.0%) | 0 (0.0%) |
| Information | 0 (0.0%) | 0 (0.0%) |
| Finance & Insurance | 0 (0.0%) | 0 (0.0%) |
| Real Estate, Rental & Leasing | 25 (100.0%) | 0 (0.0%) |
| Professional & Scientific | 0 (0.0%) | 0 (0.0%) |
| Enterprise Management | 0 (0.0%) | 0 (0.0%) |
| Administrative & Support | 71 (80.7%) | 17 (19.3%) |
| Educational Services | 17 (29.3%) | 41 (70.7%) |
| Health Care & Social Assistance | 68 (43.6%) | 88 (56.4%) |
| Arts, Entertainment & Recreation | 0 (0.0%) | 0 (0.0%) |
| Accommodation & Food Services | 143 (83.6%) | 28 (16.4%) |
| Public Administration | 0 (0.0%) | 7 (100.0%) |
| Total | 660 (60.8%) | 425 (39.2%) |
Education in Montalvin Manor
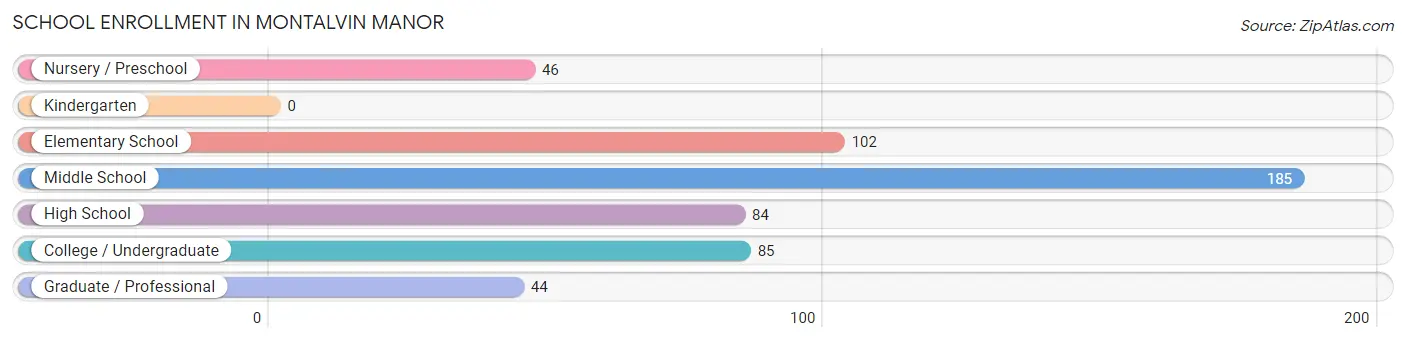
School Enrollment in Montalvin Manor
The most common levels of schooling among the 546 students in Montalvin Manor are middle school (185 | 33.9%), elementary school (102 | 18.7%), and college / undergraduate (85 | 15.6%).
| School Level | # Students | % Students |
| Nursery / Preschool | 46 | 8.4% |
| Kindergarten | 0 | 0.0% |
| Elementary School | 102 | 18.7% |
| Middle School | 185 | 33.9% |
| High School | 84 | 15.4% |
| College / Undergraduate | 85 | 15.6% |
| Graduate / Professional | 44 | 8.1% |
| Total | 546 | 100.0% |
School Enrollment by Age by Funding Source in Montalvin Manor
Out of a total of 546 students who are enrolled in schools in Montalvin Manor, 76 (13.9%) attend a private institution, while the remaining 470 (86.1%) are enrolled in public schools. The age group of 18 to 19 year olds has the highest likelihood of being enrolled in private schools, with 5 (100.0% in the age bracket) enrolled. Conversely, the age group of 5 to 9 year old has the lowest likelihood of being enrolled in a private school, with 131 (100.0% in the age bracket) attending a public institution.
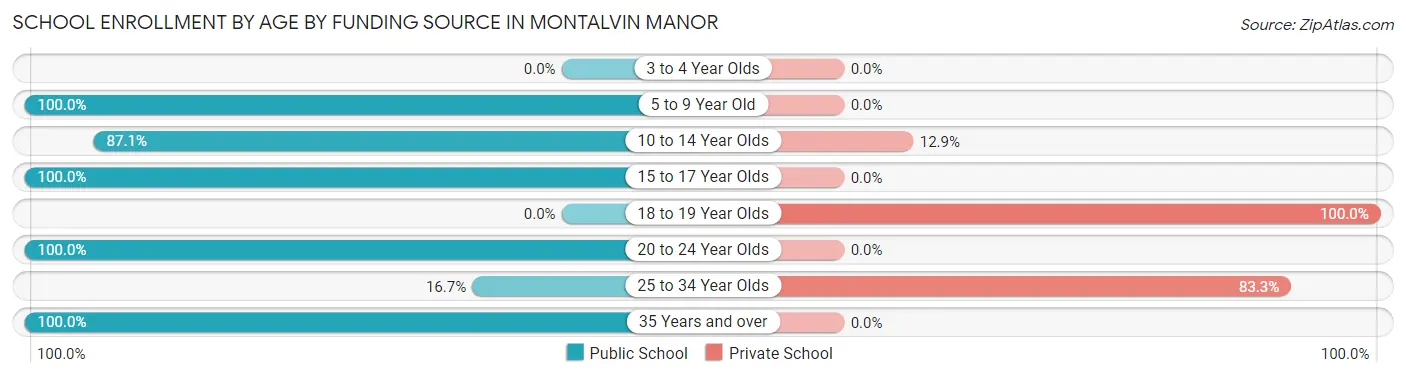
| Age Bracket | Public School | Private School |
| 3 to 4 Year Olds | 0 (0.0%) | 0 (0.0%) |
| 5 to 9 Year Old | 131 (100.0%) | 0 (0.0%) |
| 10 to 14 Year Olds | 176 (87.1%) | 26 (12.9%) |
| 15 to 17 Year Olds | 84 (100.0%) | 0 (0.0%) |
| 18 to 19 Year Olds | 0 (0.0%) | 5 (100.0%) |
| 20 to 24 Year Olds | 47 (100.0%) | 0 (0.0%) |
| 25 to 34 Year Olds | 9 (16.7%) | 45 (83.3%) |
| 35 Years and over | 23 (100.0%) | 0 (0.0%) |
| Total | 470 (86.1%) | 76 (13.9%) |
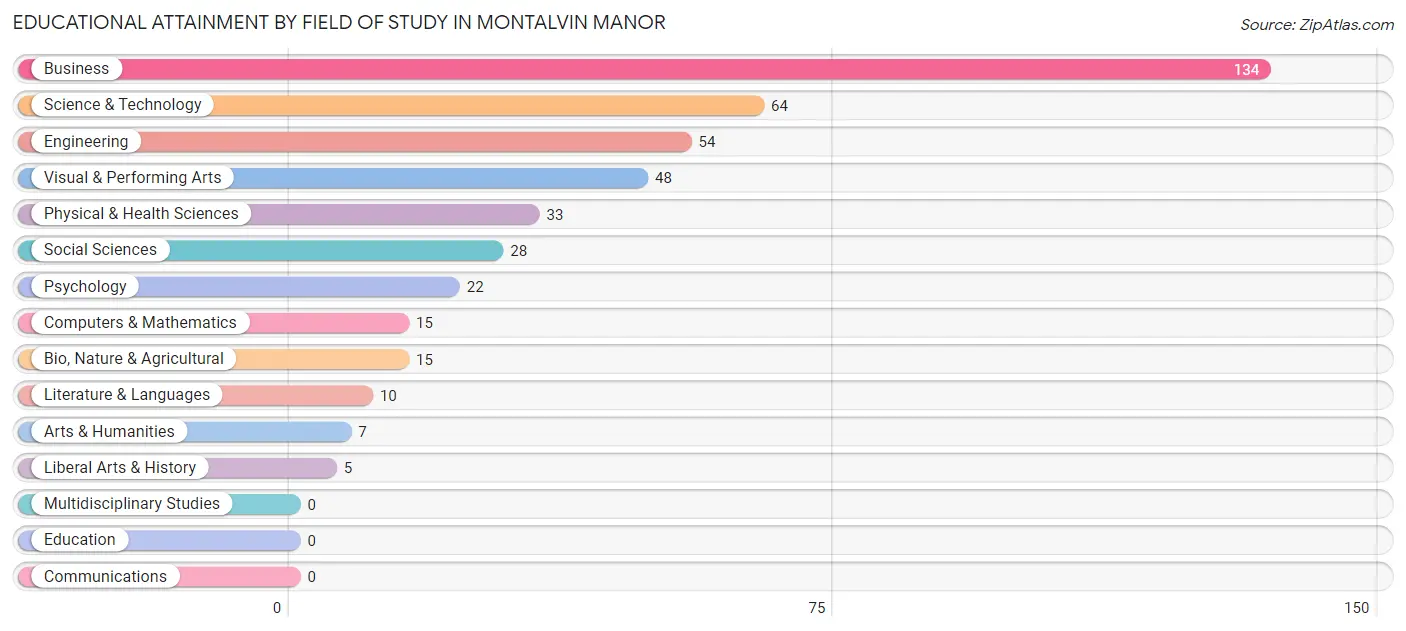
Educational Attainment by Field of Study in Montalvin Manor
Business (134 | 30.8%), science & technology (64 | 14.7%), engineering (54 | 12.4%), visual & performing arts (48 | 11.0%), and physical & health sciences (33 | 7.6%) are the most common fields of study among 435 individuals in Montalvin Manor who have obtained a bachelor's degree or higher.
| Field of Study | # Graduates | % Graduates |
| Computers & Mathematics | 15 | 3.5% |
| Bio, Nature & Agricultural | 15 | 3.5% |
| Physical & Health Sciences | 33 | 7.6% |
| Psychology | 22 | 5.1% |
| Social Sciences | 28 | 6.4% |
| Engineering | 54 | 12.4% |
| Multidisciplinary Studies | 0 | 0.0% |
| Science & Technology | 64 | 14.7% |
| Business | 134 | 30.8% |
| Education | 0 | 0.0% |
| Literature & Languages | 10 | 2.3% |
| Liberal Arts & History | 5 | 1.1% |
| Visual & Performing Arts | 48 | 11.0% |
| Communications | 0 | 0.0% |
| Arts & Humanities | 7 | 1.6% |
| Total | 435 | 100.0% |
Transportation & Commute in Montalvin Manor
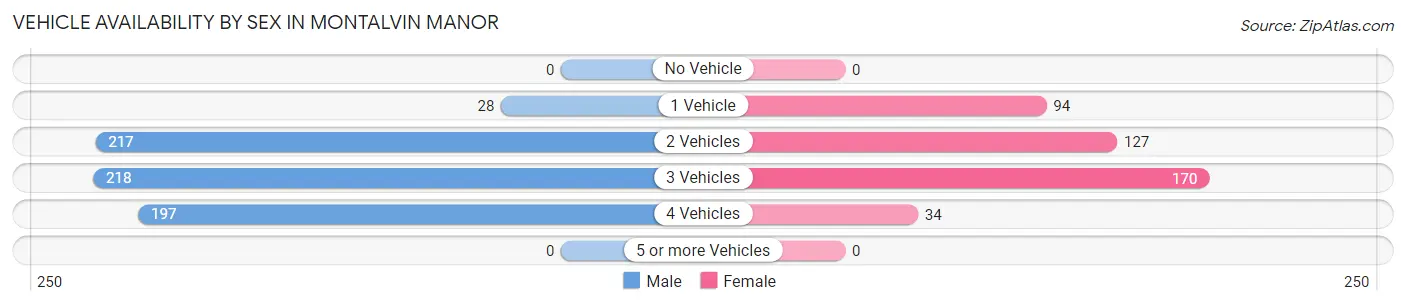
Vehicle Availability by Sex in Montalvin Manor
The most prevalent vehicle ownership categories in Montalvin Manor are males with 3 vehicles (218, accounting for 33.0%) and females with 3 vehicles (170, making up 51.3%).
| Vehicles Available | Male | Female |
| No Vehicle | 0 (0.0%) | 0 (0.0%) |
| 1 Vehicle | 28 (4.2%) | 94 (22.1%) |
| 2 Vehicles | 217 (32.9%) | 127 (29.9%) |
| 3 Vehicles | 218 (33.0%) | 170 (40.0%) |
| 4 Vehicles | 197 (29.8%) | 34 (8.0%) |
| 5 or more Vehicles | 0 (0.0%) | 0 (0.0%) |
| Total | 660 (100.0%) | 425 (100.0%) |
Commute Time in Montalvin Manor
The most frequently occuring commute durations in Montalvin Manor are 30 to 34 minutes (221 commuters, 21.5%), 45 to 59 minutes (171 commuters, 16.7%), and 60 to 89 minutes (155 commuters, 15.1%).
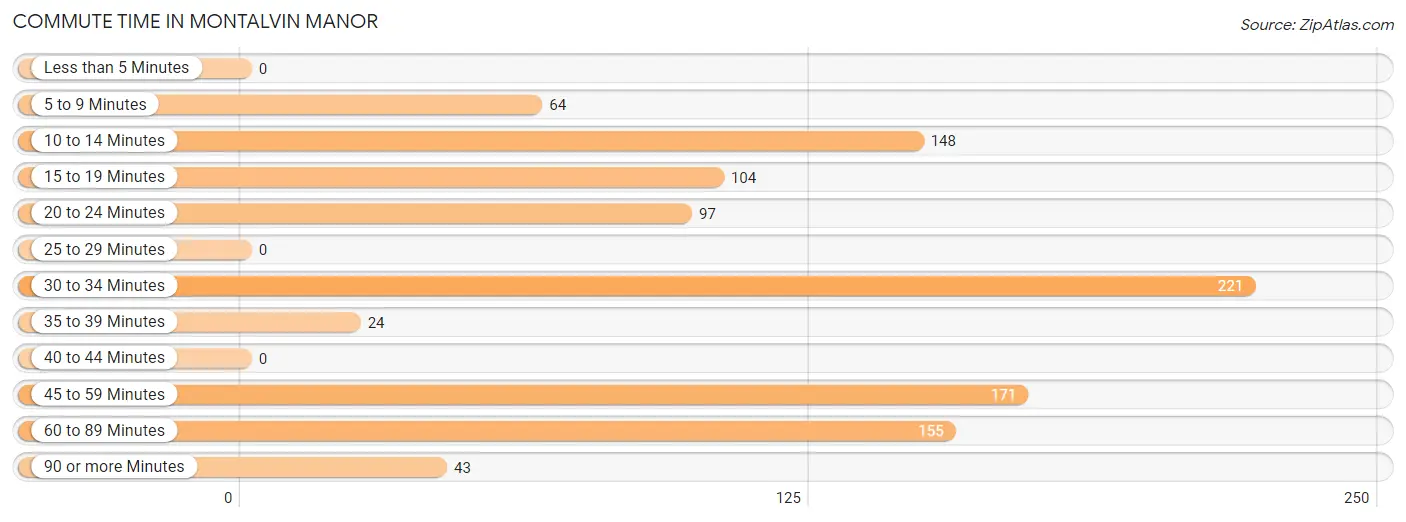
| Commute Time | # Commuters | % Commuters |
| Less than 5 Minutes | 0 | 0.0% |
| 5 to 9 Minutes | 64 | 6.2% |
| 10 to 14 Minutes | 148 | 14.4% |
| 15 to 19 Minutes | 104 | 10.1% |
| 20 to 24 Minutes | 97 | 9.4% |
| 25 to 29 Minutes | 0 | 0.0% |
| 30 to 34 Minutes | 221 | 21.5% |
| 35 to 39 Minutes | 24 | 2.3% |
| 40 to 44 Minutes | 0 | 0.0% |
| 45 to 59 Minutes | 171 | 16.7% |
| 60 to 89 Minutes | 155 | 15.1% |
| 90 or more Minutes | 43 | 4.2% |
Commute Time by Sex in Montalvin Manor
The most common commute times in Montalvin Manor are 30 to 34 minutes (171 commuters, 27.1%) for males and 15 to 19 minutes (79 commuters, 20.0%) for females.
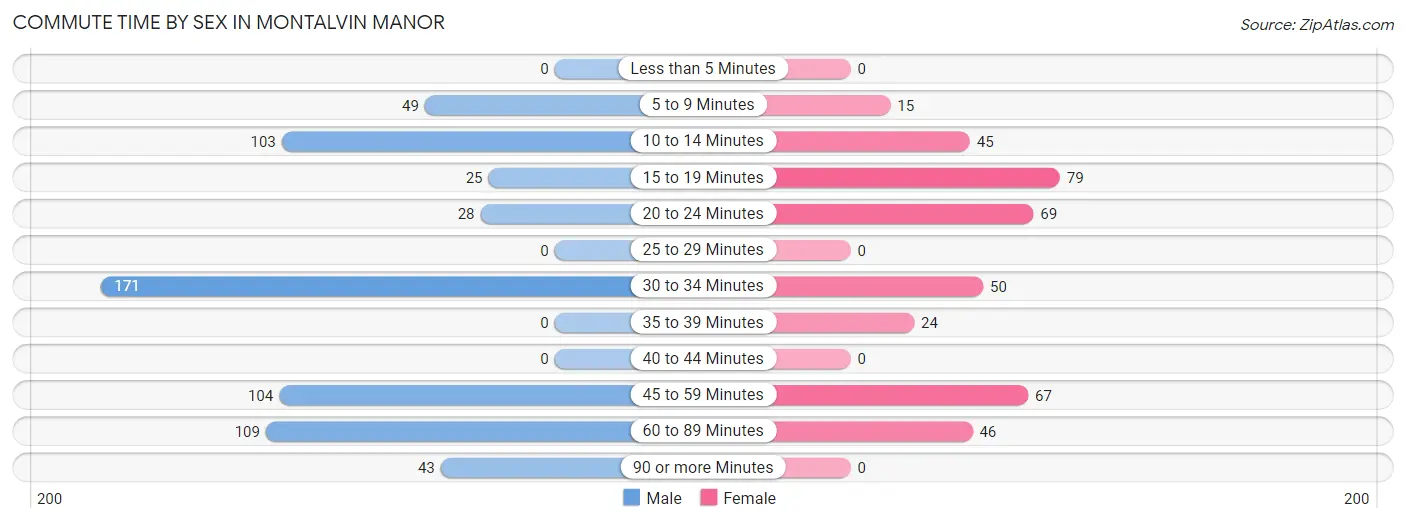
| Commute Time | Male | Female |
| Less than 5 Minutes | 0 (0.0%) | 0 (0.0%) |
| 5 to 9 Minutes | 49 (7.7%) | 15 (3.8%) |
| 10 to 14 Minutes | 103 (16.3%) | 45 (11.4%) |
| 15 to 19 Minutes | 25 (4.0%) | 79 (20.0%) |
| 20 to 24 Minutes | 28 (4.4%) | 69 (17.5%) |
| 25 to 29 Minutes | 0 (0.0%) | 0 (0.0%) |
| 30 to 34 Minutes | 171 (27.1%) | 50 (12.7%) |
| 35 to 39 Minutes | 0 (0.0%) | 24 (6.1%) |
| 40 to 44 Minutes | 0 (0.0%) | 0 (0.0%) |
| 45 to 59 Minutes | 104 (16.5%) | 67 (17.0%) |
| 60 to 89 Minutes | 109 (17.2%) | 46 (11.7%) |
| 90 or more Minutes | 43 (6.8%) | 0 (0.0%) |
Time of Departure to Work by Sex in Montalvin Manor
The most frequent times of departure to work in Montalvin Manor are 12:00 AM to 4:59 AM (155, 24.5%) for males and 8:00 AM to 8:29 AM (76, 19.2%) for females.
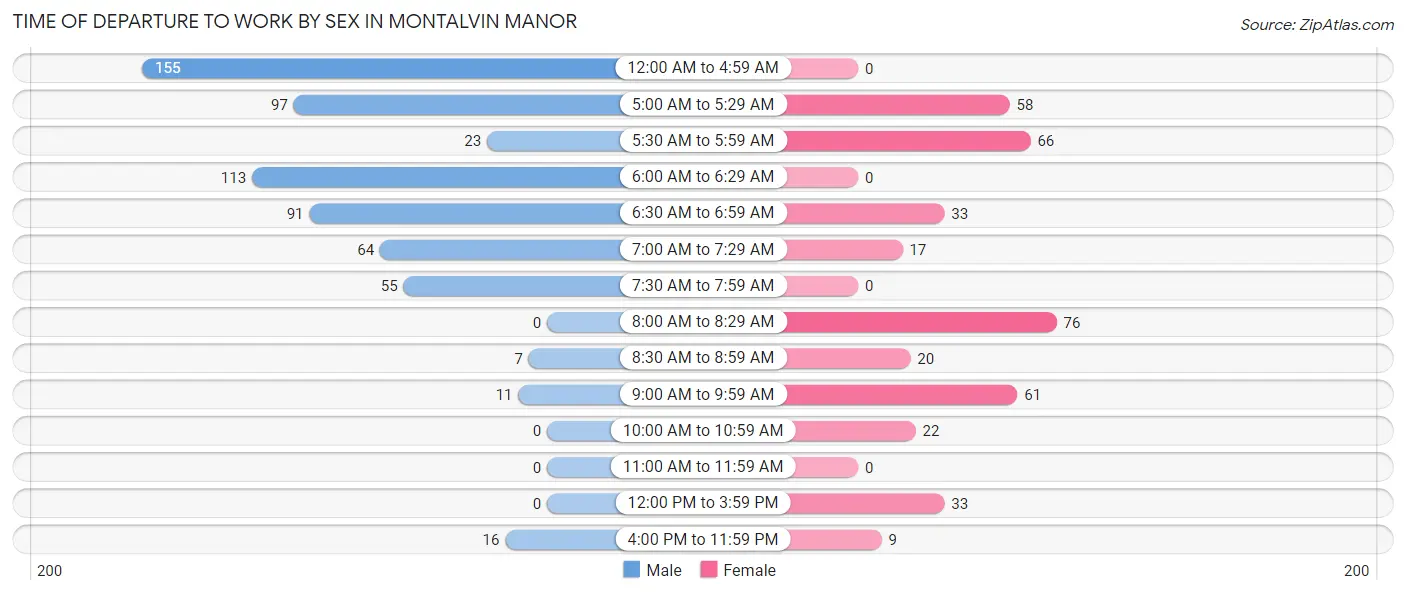
| Time of Departure | Male | Female |
| 12:00 AM to 4:59 AM | 155 (24.5%) | 0 (0.0%) |
| 5:00 AM to 5:29 AM | 97 (15.3%) | 58 (14.7%) |
| 5:30 AM to 5:59 AM | 23 (3.6%) | 66 (16.7%) |
| 6:00 AM to 6:29 AM | 113 (17.9%) | 0 (0.0%) |
| 6:30 AM to 6:59 AM | 91 (14.4%) | 33 (8.4%) |
| 7:00 AM to 7:29 AM | 64 (10.1%) | 17 (4.3%) |
| 7:30 AM to 7:59 AM | 55 (8.7%) | 0 (0.0%) |
| 8:00 AM to 8:29 AM | 0 (0.0%) | 76 (19.2%) |
| 8:30 AM to 8:59 AM | 7 (1.1%) | 20 (5.1%) |
| 9:00 AM to 9:59 AM | 11 (1.7%) | 61 (15.4%) |
| 10:00 AM to 10:59 AM | 0 (0.0%) | 22 (5.6%) |
| 11:00 AM to 11:59 AM | 0 (0.0%) | 0 (0.0%) |
| 12:00 PM to 3:59 PM | 0 (0.0%) | 33 (8.4%) |
| 4:00 PM to 11:59 PM | 16 (2.5%) | 9 (2.3%) |
| Total | 632 (100.0%) | 395 (100.0%) |
Housing Occupancy in Montalvin Manor
Occupancy by Ownership in Montalvin Manor
Of the total 649 dwellings in Montalvin Manor, owner-occupied units account for 524 (80.7%), while renter-occupied units make up 125 (19.3%).
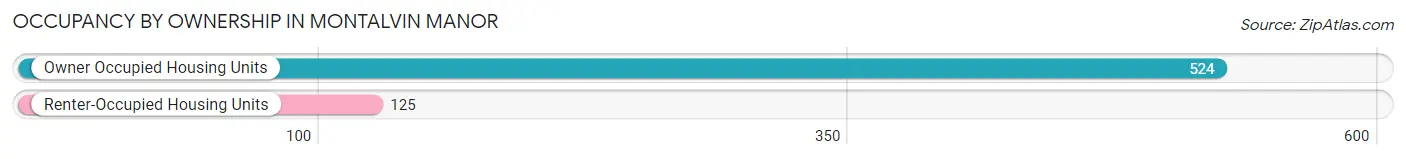
| Occupancy | # Housing Units | % Housing Units |
| Owner Occupied Housing Units | 524 | 80.7% |
| Renter-Occupied Housing Units | 125 | 19.3% |
| Total Occupied Housing Units | 649 | 100.0% |
Occupancy by Household Size in Montalvin Manor
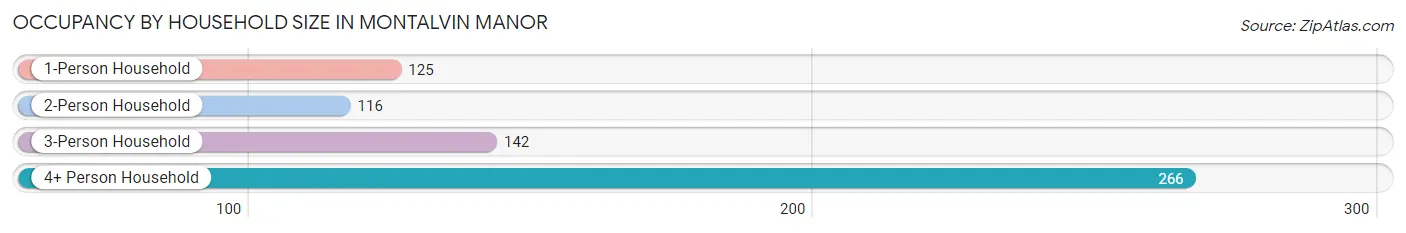
| Household Size | # Housing Units | % Housing Units |
| 1-Person Household | 125 | 19.3% |
| 2-Person Household | 116 | 17.9% |
| 3-Person Household | 142 | 21.9% |
| 4+ Person Household | 266 | 41.0% |
| Total Housing Units | 649 | 100.0% |
Occupancy by Ownership by Household Size in Montalvin Manor
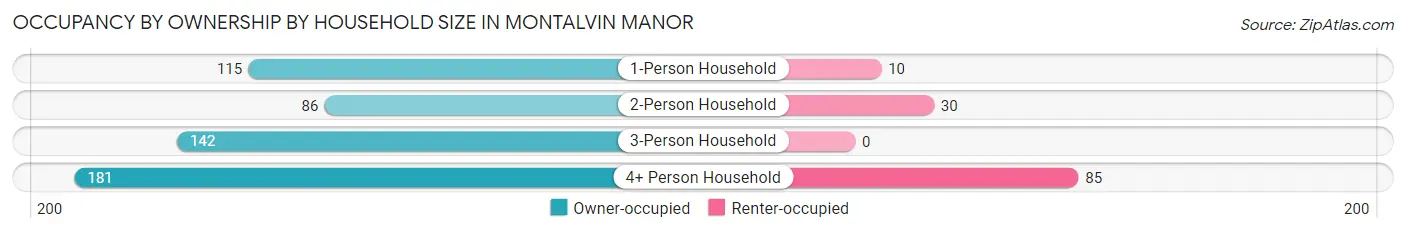
| Household Size | Owner-occupied | Renter-occupied |
| 1-Person Household | 115 (92.0%) | 10 (8.0%) |
| 2-Person Household | 86 (74.1%) | 30 (25.9%) |
| 3-Person Household | 142 (100.0%) | 0 (0.0%) |
| 4+ Person Household | 181 (68.0%) | 85 (32.0%) |
| Total Housing Units | 524 (80.7%) | 125 (19.3%) |
Occupancy by Educational Attainment in Montalvin Manor
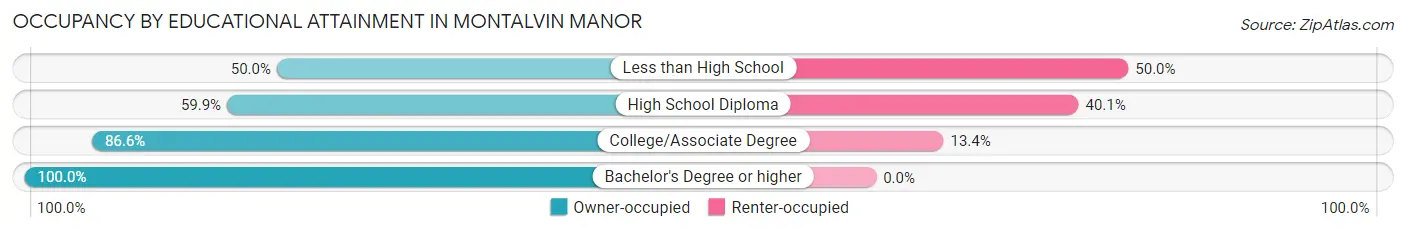
| Household Size | Owner-occupied | Renter-occupied |
| Less than High School | 23 (50.0%) | 23 (50.0%) |
| High School Diploma | 100 (59.9%) | 67 (40.1%) |
| College/Associate Degree | 227 (86.6%) | 35 (13.4%) |
| Bachelor's Degree or higher | 174 (100.0%) | 0 (0.0%) |
Occupancy by Age of Householder in Montalvin Manor
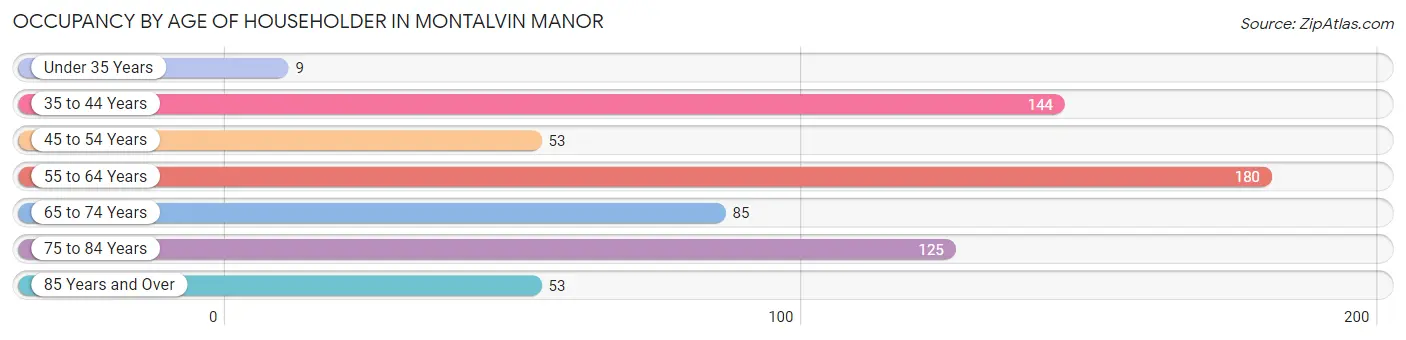
| Age Bracket | # Households | % Households |
| Under 35 Years | 9 | 1.4% |
| 35 to 44 Years | 144 | 22.2% |
| 45 to 54 Years | 53 | 8.2% |
| 55 to 64 Years | 180 | 27.7% |
| 65 to 74 Years | 85 | 13.1% |
| 75 to 84 Years | 125 | 19.3% |
| 85 Years and Over | 53 | 8.2% |
| Total | 649 | 100.0% |
Housing Finances in Montalvin Manor
Median Income by Occupancy in Montalvin Manor
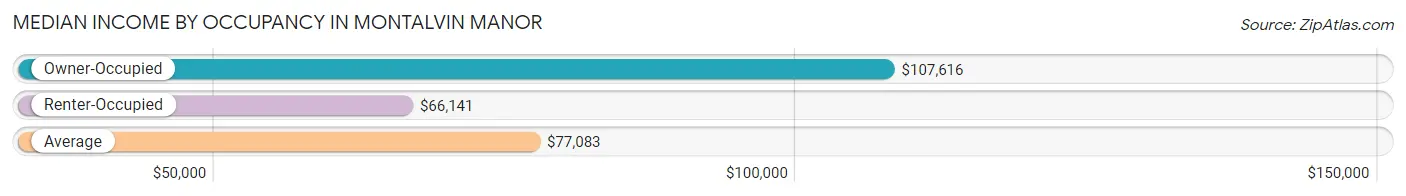
| Occupancy Type | # Households | Median Income |
| Owner-Occupied | 524 (80.7%) | $107,616 |
| Renter-Occupied | 125 (19.3%) | $66,141 |
| Average | 649 (100.0%) | $77,083 |
Occupancy by Householder Income Bracket in Montalvin Manor
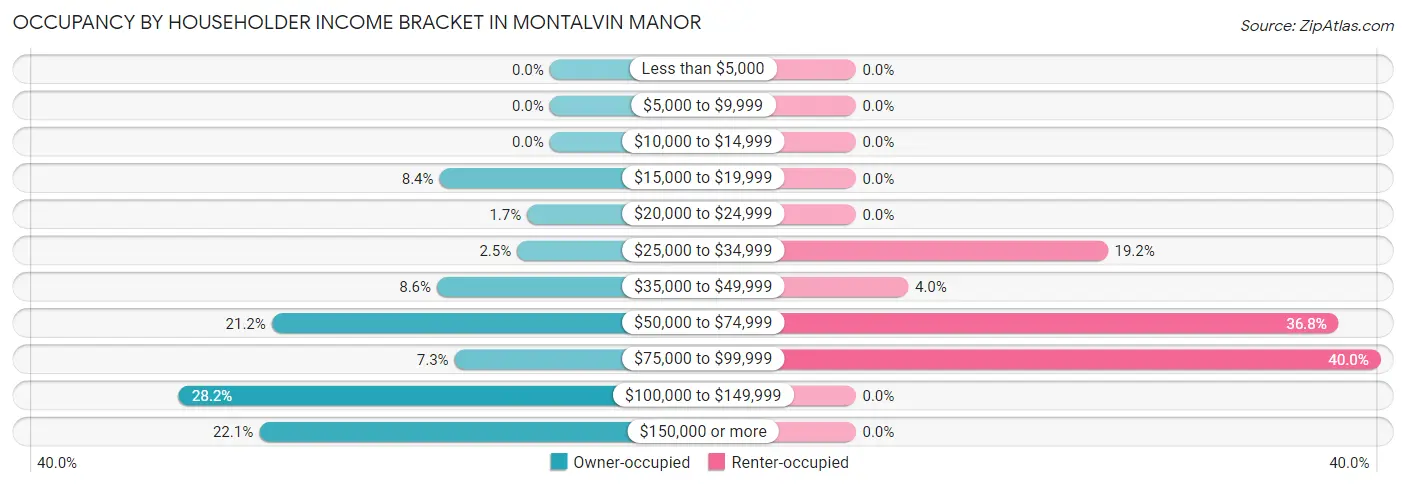
| Income Bracket | Owner-occupied | Renter-occupied |
| Less than $5,000 | 0 (0.0%) | 0 (0.0%) |
| $5,000 to $9,999 | 0 (0.0%) | 0 (0.0%) |
| $10,000 to $14,999 | 0 (0.0%) | 0 (0.0%) |
| $15,000 to $19,999 | 44 (8.4%) | 0 (0.0%) |
| $20,000 to $24,999 | 9 (1.7%) | 0 (0.0%) |
| $25,000 to $34,999 | 13 (2.5%) | 24 (19.2%) |
| $35,000 to $49,999 | 45 (8.6%) | 5 (4.0%) |
| $50,000 to $74,999 | 111 (21.2%) | 46 (36.8%) |
| $75,000 to $99,999 | 38 (7.2%) | 50 (40.0%) |
| $100,000 to $149,999 | 148 (28.2%) | 0 (0.0%) |
| $150,000 or more | 116 (22.1%) | 0 (0.0%) |
| Total | 524 (100.0%) | 125 (100.0%) |
Monthly Housing Cost Tiers in Montalvin Manor
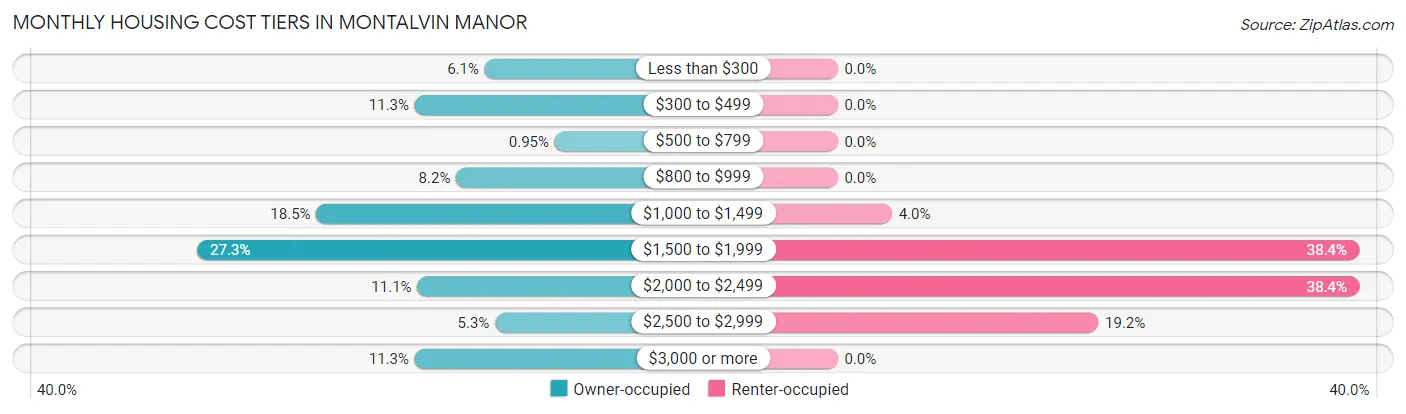
| Monthly Cost | Owner-occupied | Renter-occupied |
| Less than $300 | 32 (6.1%) | 0 (0.0%) |
| $300 to $499 | 59 (11.3%) | 0 (0.0%) |
| $500 to $799 | 5 (0.9%) | 0 (0.0%) |
| $800 to $999 | 43 (8.2%) | 0 (0.0%) |
| $1,000 to $1,499 | 97 (18.5%) | 5 (4.0%) |
| $1,500 to $1,999 | 143 (27.3%) | 48 (38.4%) |
| $2,000 to $2,499 | 58 (11.1%) | 48 (38.4%) |
| $2,500 to $2,999 | 28 (5.3%) | 24 (19.2%) |
| $3,000 or more | 59 (11.3%) | 0 (0.0%) |
| Total | 524 (100.0%) | 125 (100.0%) |
Physical Housing Characteristics in Montalvin Manor
Housing Structures in Montalvin Manor
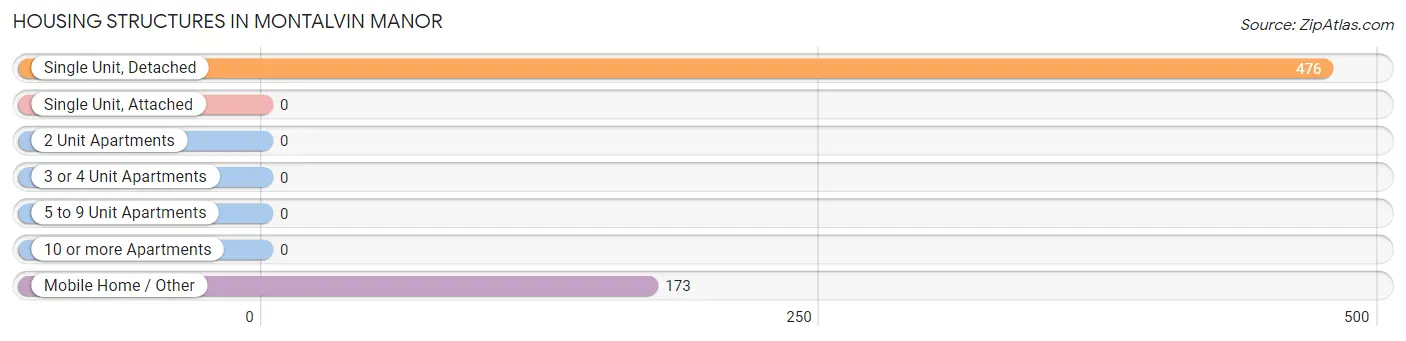
| Structure Type | # Housing Units | % Housing Units |
| Single Unit, Detached | 476 | 73.3% |
| Single Unit, Attached | 0 | 0.0% |
| 2 Unit Apartments | 0 | 0.0% |
| 3 or 4 Unit Apartments | 0 | 0.0% |
| 5 to 9 Unit Apartments | 0 | 0.0% |
| 10 or more Apartments | 0 | 0.0% |
| Mobile Home / Other | 173 | 26.7% |
| Total | 649 | 100.0% |
Housing Structures by Occupancy in Montalvin Manor
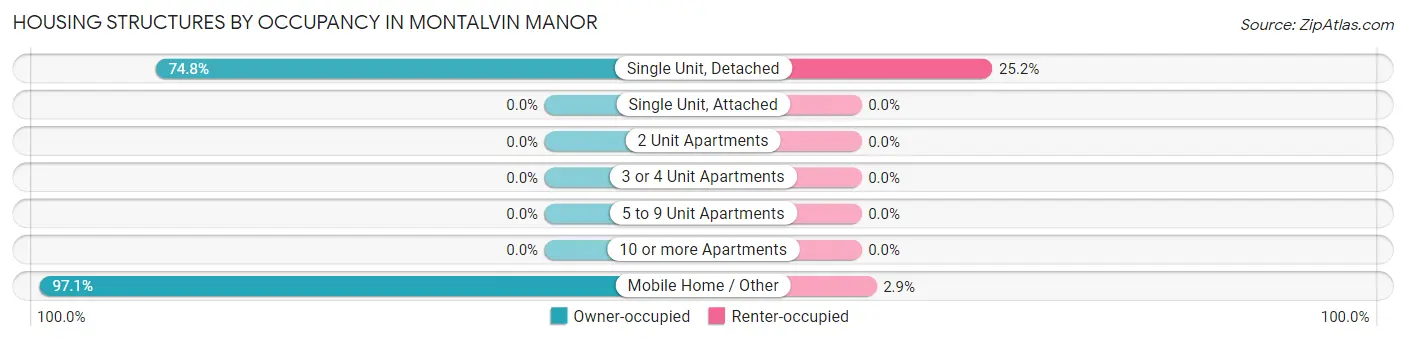
| Structure Type | Owner-occupied | Renter-occupied |
| Single Unit, Detached | 356 (74.8%) | 120 (25.2%) |
| Single Unit, Attached | 0 (0.0%) | 0 (0.0%) |
| 2 Unit Apartments | 0 (0.0%) | 0 (0.0%) |
| 3 or 4 Unit Apartments | 0 (0.0%) | 0 (0.0%) |
| 5 to 9 Unit Apartments | 0 (0.0%) | 0 (0.0%) |
| 10 or more Apartments | 0 (0.0%) | 0 (0.0%) |
| Mobile Home / Other | 168 (97.1%) | 5 (2.9%) |
| Total | 524 (80.7%) | 125 (19.3%) |
Housing Structures by Number of Rooms in Montalvin Manor
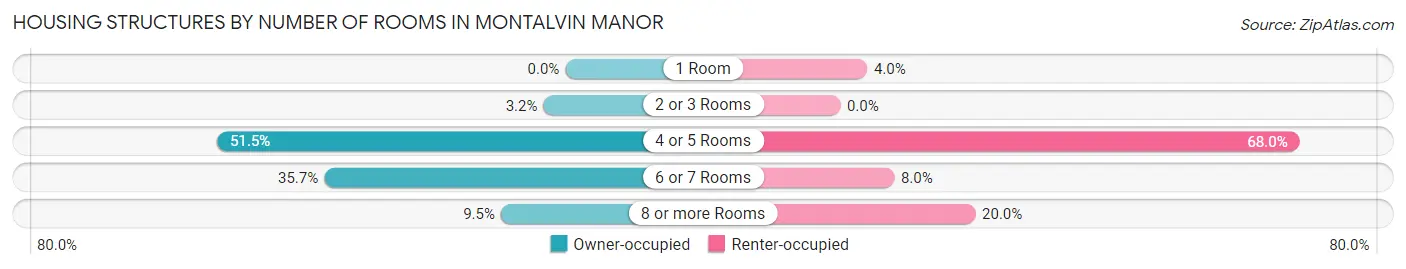
| Number of Rooms | Owner-occupied | Renter-occupied |
| 1 Room | 0 (0.0%) | 5 (4.0%) |
| 2 or 3 Rooms | 17 (3.2%) | 0 (0.0%) |
| 4 or 5 Rooms | 270 (51.5%) | 85 (68.0%) |
| 6 or 7 Rooms | 187 (35.7%) | 10 (8.0%) |
| 8 or more Rooms | 50 (9.5%) | 25 (20.0%) |
| Total | 524 (100.0%) | 125 (100.0%) |
Housing Structure by Heating Type in Montalvin Manor
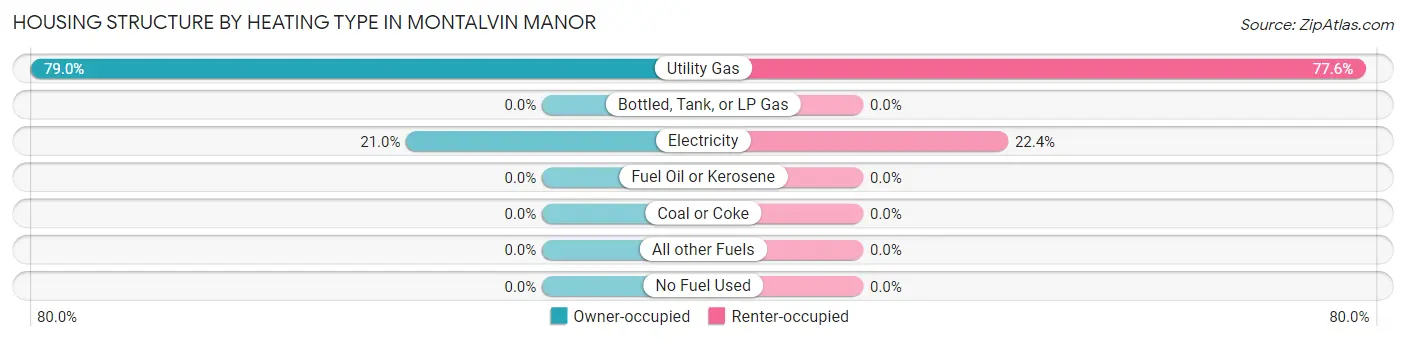
| Heating Type | Owner-occupied | Renter-occupied |
| Utility Gas | 414 (79.0%) | 97 (77.6%) |
| Bottled, Tank, or LP Gas | 0 (0.0%) | 0 (0.0%) |
| Electricity | 110 (21.0%) | 28 (22.4%) |
| Fuel Oil or Kerosene | 0 (0.0%) | 0 (0.0%) |
| Coal or Coke | 0 (0.0%) | 0 (0.0%) |
| All other Fuels | 0 (0.0%) | 0 (0.0%) |
| No Fuel Used | 0 (0.0%) | 0 (0.0%) |
| Total | 524 (100.0%) | 125 (100.0%) |
Household Vehicle Usage in Montalvin Manor
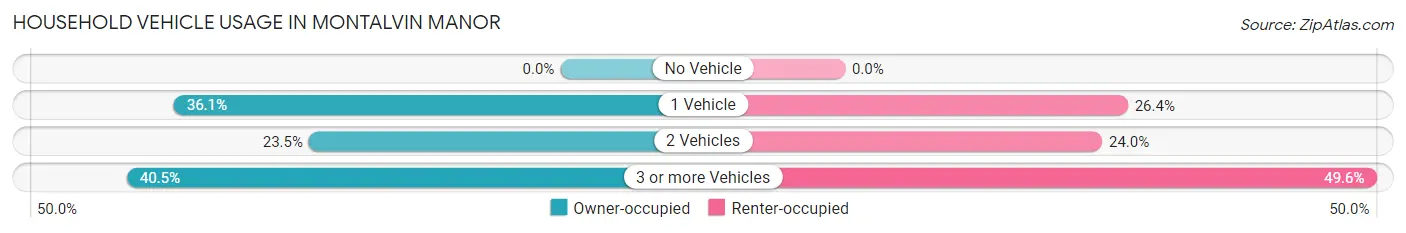
| Vehicles per Household | Owner-occupied | Renter-occupied |
| No Vehicle | 0 (0.0%) | 0 (0.0%) |
| 1 Vehicle | 189 (36.1%) | 33 (26.4%) |
| 2 Vehicles | 123 (23.5%) | 30 (24.0%) |
| 3 or more Vehicles | 212 (40.5%) | 62 (49.6%) |
| Total | 524 (100.0%) | 125 (100.0%) |
Real Estate & Mortgages in Montalvin Manor
Real Estate and Mortgage Overview in Montalvin Manor
| Characteristic | Without Mortgage | With Mortgage |
| Housing Units | 217 | 307 |
| Median Property Value | $71,700 | $498,700 |
| Median Household Income | $73,207 | $116 |
| Monthly Housing Costs | $889 | $59 |
| Real Estate Taxes | $199 | $0 |
Property Value by Mortgage Status in Montalvin Manor
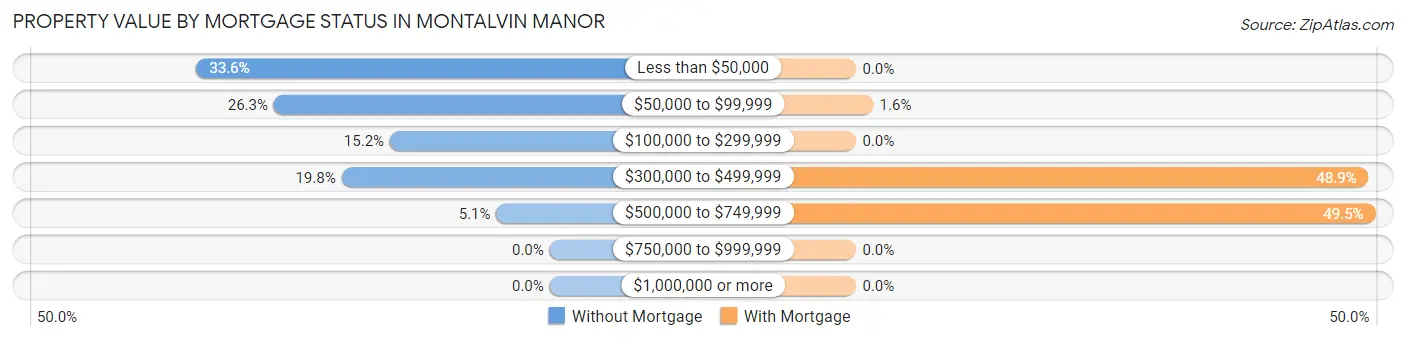
| Property Value | Without Mortgage | With Mortgage |
| Less than $50,000 | 73 (33.6%) | 0 (0.0%) |
| $50,000 to $99,999 | 57 (26.3%) | 5 (1.6%) |
| $100,000 to $299,999 | 33 (15.2%) | 0 (0.0%) |
| $300,000 to $499,999 | 43 (19.8%) | 150 (48.9%) |
| $500,000 to $749,999 | 11 (5.1%) | 152 (49.5%) |
| $750,000 to $999,999 | 0 (0.0%) | 0 (0.0%) |
| $1,000,000 or more | 0 (0.0%) | 0 (0.0%) |
| Total | 217 (100.0%) | 307 (100.0%) |
Household Income by Mortgage Status in Montalvin Manor
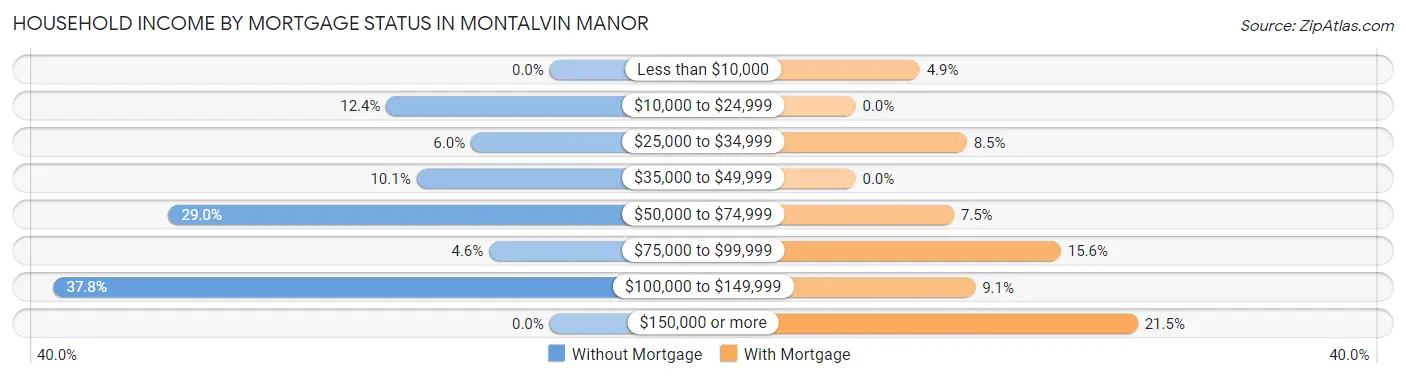
| Household Income | Without Mortgage | With Mortgage |
| Less than $10,000 | 0 (0.0%) | 15 (4.9%) |
| $10,000 to $24,999 | 27 (12.4%) | 0 (0.0%) |
| $25,000 to $34,999 | 13 (6.0%) | 26 (8.5%) |
| $35,000 to $49,999 | 22 (10.1%) | 0 (0.0%) |
| $50,000 to $74,999 | 63 (29.0%) | 23 (7.5%) |
| $75,000 to $99,999 | 10 (4.6%) | 48 (15.6%) |
| $100,000 to $149,999 | 82 (37.8%) | 28 (9.1%) |
| $150,000 or more | 0 (0.0%) | 66 (21.5%) |
| Total | 217 (100.0%) | 307 (100.0%) |
Property Value to Household Income Ratio in Montalvin Manor
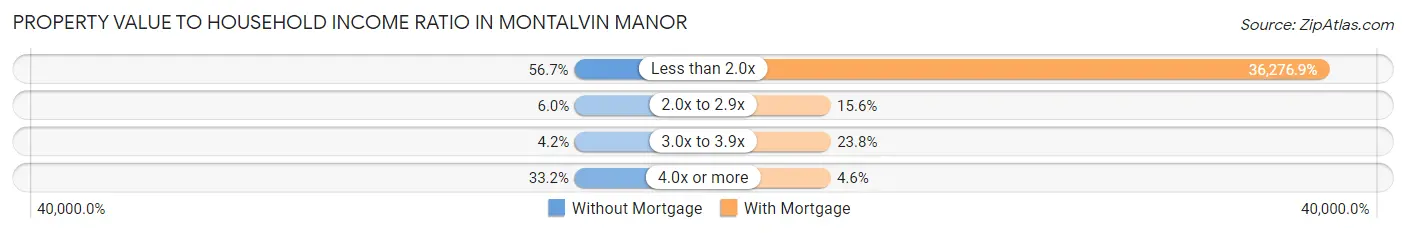
| Value-to-Income Ratio | Without Mortgage | With Mortgage |
| Less than 2.0x | 123 (56.7%) | 111,370 (36,276.9%) |
| 2.0x to 2.9x | 13 (6.0%) | 48 (15.6%) |
| 3.0x to 3.9x | 9 (4.2%) | 73 (23.8%) |
| 4.0x or more | 72 (33.2%) | 14 (4.6%) |
| Total | 217 (100.0%) | 307 (100.0%) |
Real Estate Taxes by Mortgage Status in Montalvin Manor
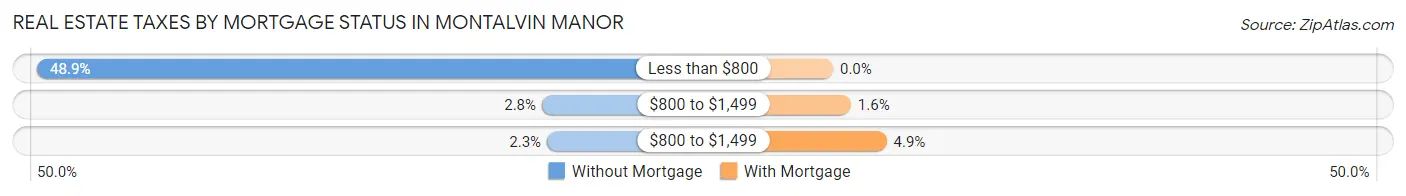
| Property Taxes | Without Mortgage | With Mortgage |
| Less than $800 | 106 (48.8%) | 0 (0.0%) |
| $800 to $1,499 | 6 (2.8%) | 5 (1.6%) |
| $800 to $1,499 | 5 (2.3%) | 15 (4.9%) |
| Total | 217 (100.0%) | 307 (100.0%) |
Health & Disability in Montalvin Manor
Health Insurance Coverage by Age in Montalvin Manor
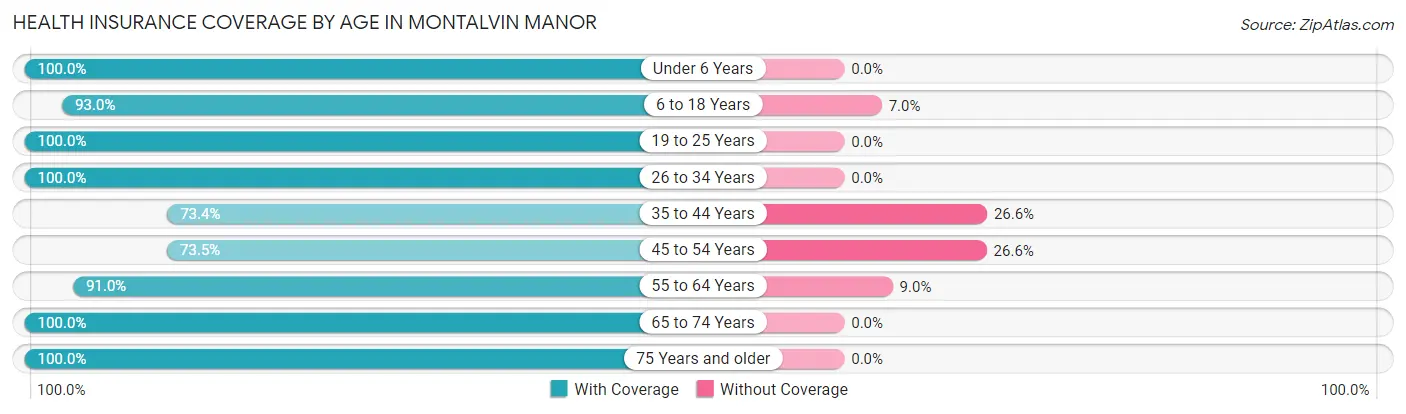
| Age Bracket | With Coverage | Without Coverage |
| Under 6 Years | 119 (100.0%) | 0 (0.0%) |
| 6 to 18 Years | 333 (93.0%) | 25 (7.0%) |
| 19 to 25 Years | 139 (100.0%) | 0 (0.0%) |
| 26 to 34 Years | 329 (100.0%) | 0 (0.0%) |
| 35 to 44 Years | 229 (73.4%) | 83 (26.6%) |
| 45 to 54 Years | 166 (73.5%) | 60 (26.6%) |
| 55 to 64 Years | 232 (91.0%) | 23 (9.0%) |
| 65 to 74 Years | 162 (100.0%) | 0 (0.0%) |
| 75 Years and older | 295 (100.0%) | 0 (0.0%) |
| Total | 2,004 (91.3%) | 191 (8.7%) |
Health Insurance Coverage by Citizenship Status in Montalvin Manor
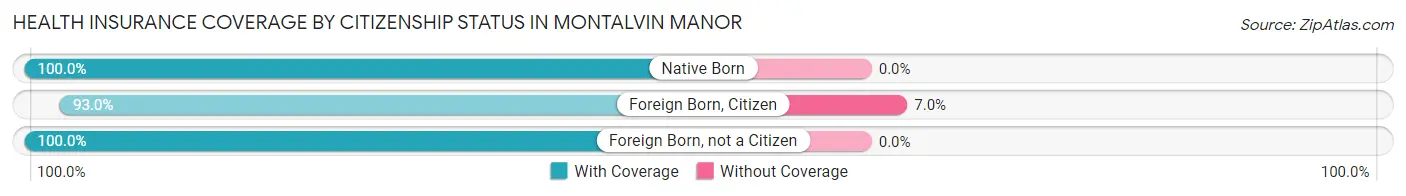
| Citizenship Status | With Coverage | Without Coverage |
| Native Born | 119 (100.0%) | 0 (0.0%) |
| Foreign Born, Citizen | 333 (93.0%) | 25 (7.0%) |
| Foreign Born, not a Citizen | 139 (100.0%) | 0 (0.0%) |
Health Insurance Coverage by Household Income in Montalvin Manor
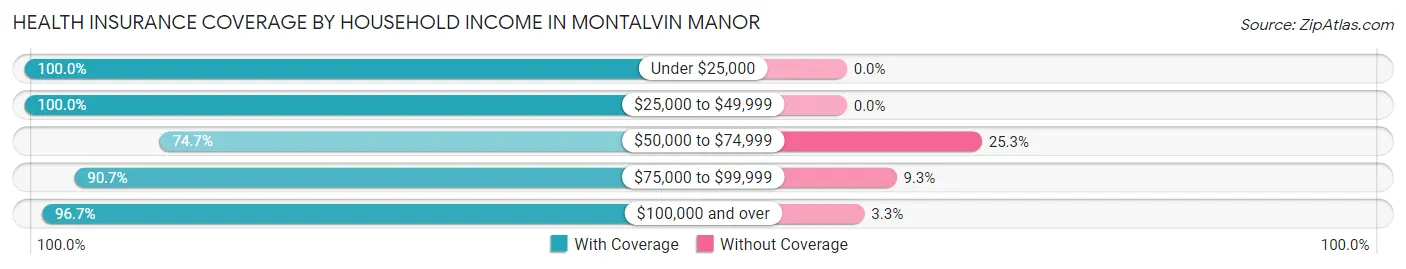
| Household Income | With Coverage | Without Coverage |
| Under $25,000 | 68 (100.0%) | 0 (0.0%) |
| $25,000 to $49,999 | 229 (100.0%) | 0 (0.0%) |
| $50,000 to $74,999 | 387 (74.7%) | 131 (25.3%) |
| $75,000 to $99,999 | 224 (90.7%) | 23 (9.3%) |
| $100,000 and over | 1,083 (96.7%) | 37 (3.3%) |
Public vs Private Health Insurance Coverage by Age in Montalvin Manor
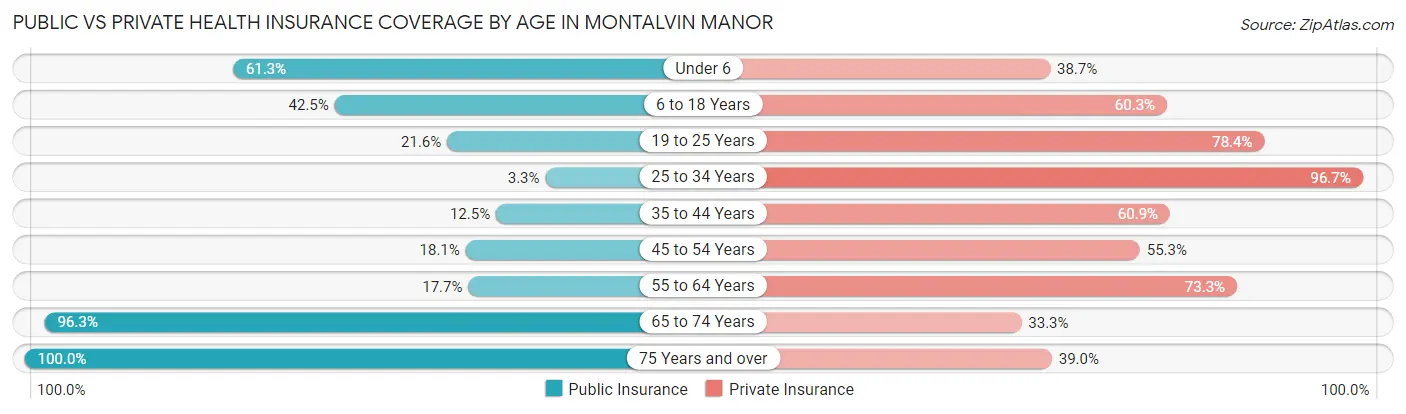
| Age Bracket | Public Insurance | Private Insurance |
| Under 6 | 73 (61.3%) | 46 (38.7%) |
| 6 to 18 Years | 152 (42.5%) | 216 (60.3%) |
| 19 to 25 Years | 30 (21.6%) | 109 (78.4%) |
| 25 to 34 Years | 11 (3.3%) | 318 (96.7%) |
| 35 to 44 Years | 39 (12.5%) | 190 (60.9%) |
| 45 to 54 Years | 41 (18.1%) | 125 (55.3%) |
| 55 to 64 Years | 45 (17.6%) | 187 (73.3%) |
| 65 to 74 Years | 156 (96.3%) | 54 (33.3%) |
| 75 Years and over | 295 (100.0%) | 115 (39.0%) |
| Total | 842 (38.4%) | 1,360 (62.0%) |
Disability Status by Sex by Age in Montalvin Manor
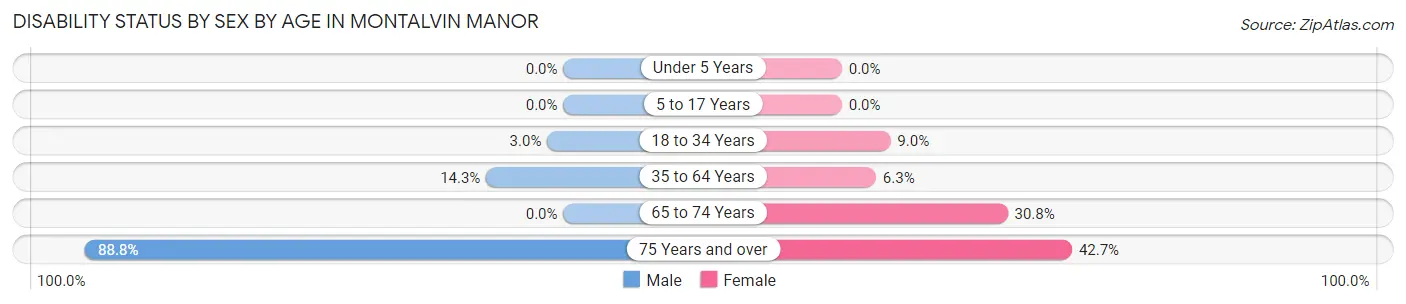
| Age Bracket | Male | Female |
| Under 5 Years | 0 (0.0%) | 0 (0.0%) |
| 5 to 17 Years | 0 (0.0%) | 0 (0.0%) |
| 18 to 34 Years | 10 (3.0%) | 12 (9.0%) |
| 35 to 64 Years | 57 (14.3%) | 25 (6.3%) |
| 65 to 74 Years | 0 (0.0%) | 20 (30.8%) |
| 75 Years and over | 79 (88.8%) | 88 (42.7%) |
Disability Class by Sex by Age in Montalvin Manor
Disability Class: Hearing Difficulty
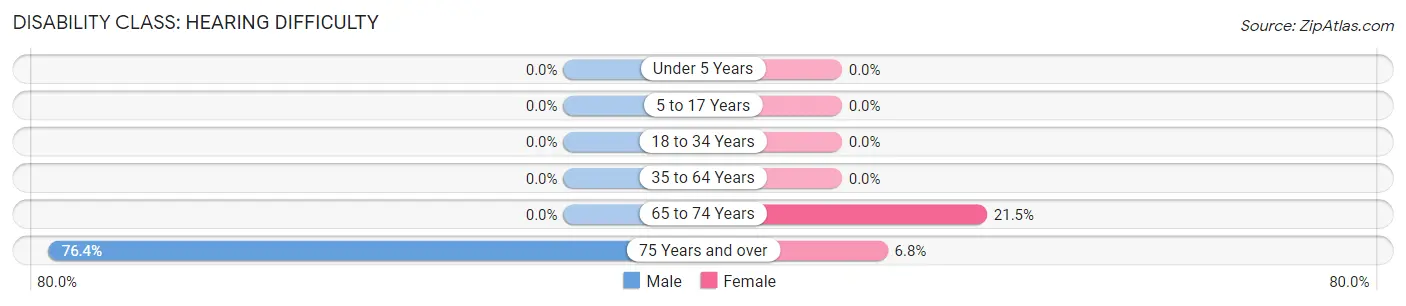
| Age Bracket | Male | Female |
| Under 5 Years | 0 (0.0%) | 0 (0.0%) |
| 5 to 17 Years | 0 (0.0%) | 0 (0.0%) |
| 18 to 34 Years | 0 (0.0%) | 0 (0.0%) |
| 35 to 64 Years | 0 (0.0%) | 0 (0.0%) |
| 65 to 74 Years | 0 (0.0%) | 14 (21.5%) |
| 75 Years and over | 68 (76.4%) | 14 (6.8%) |
Disability Class: Vision Difficulty
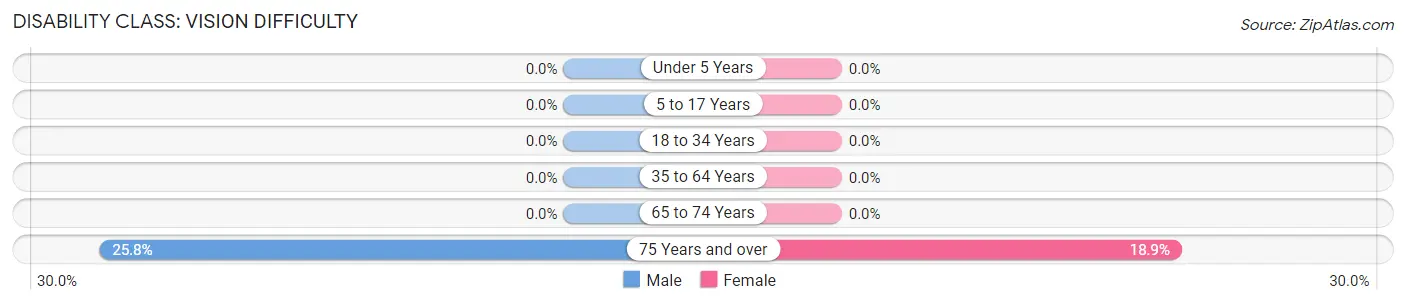
| Age Bracket | Male | Female |
| Under 5 Years | 0 (0.0%) | 0 (0.0%) |
| 5 to 17 Years | 0 (0.0%) | 0 (0.0%) |
| 18 to 34 Years | 0 (0.0%) | 0 (0.0%) |
| 35 to 64 Years | 0 (0.0%) | 0 (0.0%) |
| 65 to 74 Years | 0 (0.0%) | 0 (0.0%) |
| 75 Years and over | 23 (25.8%) | 39 (18.9%) |
Disability Class: Cognitive Difficulty
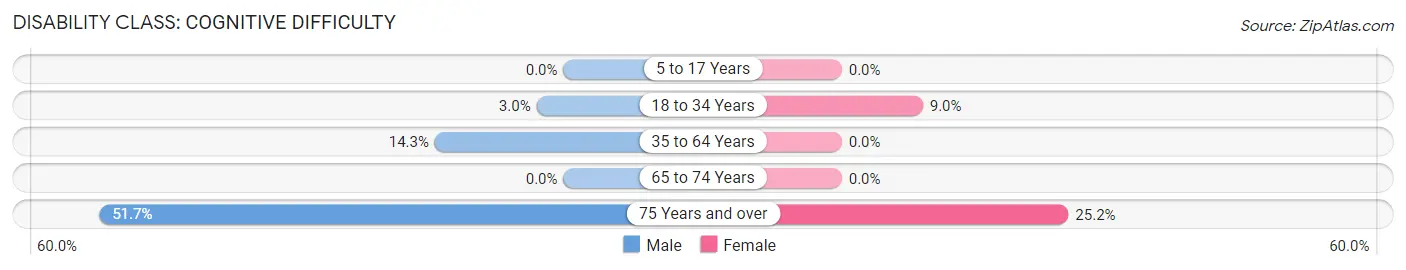
| Age Bracket | Male | Female |
| 5 to 17 Years | 0 (0.0%) | 0 (0.0%) |
| 18 to 34 Years | 10 (3.0%) | 12 (9.0%) |
| 35 to 64 Years | 57 (14.3%) | 0 (0.0%) |
| 65 to 74 Years | 0 (0.0%) | 0 (0.0%) |
| 75 Years and over | 46 (51.7%) | 52 (25.2%) |
Disability Class: Ambulatory Difficulty
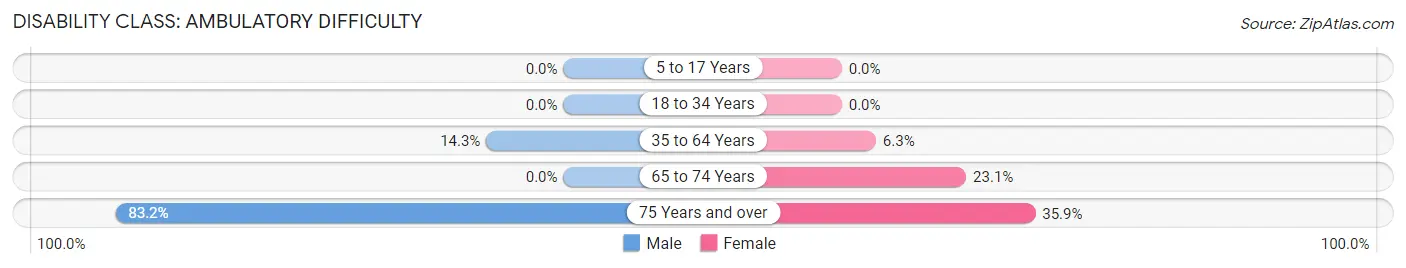
| Age Bracket | Male | Female |
| 5 to 17 Years | 0 (0.0%) | 0 (0.0%) |
| 18 to 34 Years | 0 (0.0%) | 0 (0.0%) |
| 35 to 64 Years | 57 (14.3%) | 25 (6.3%) |
| 65 to 74 Years | 0 (0.0%) | 15 (23.1%) |
| 75 Years and over | 74 (83.2%) | 74 (35.9%) |
Disability Class: Self-Care Difficulty
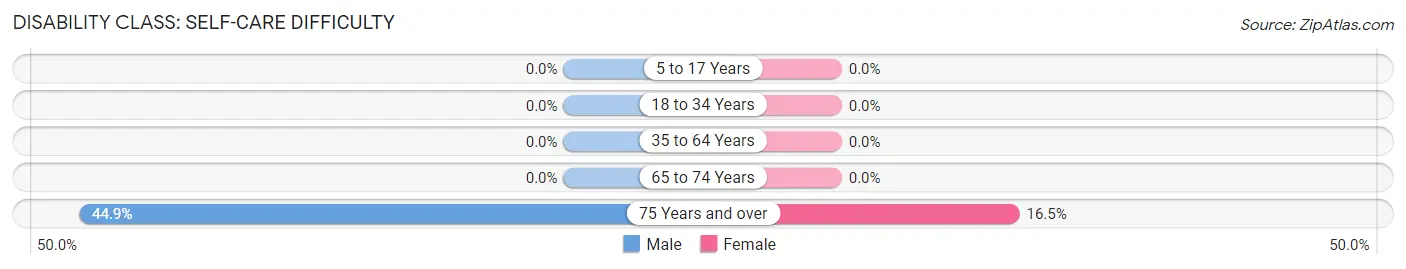
| Age Bracket | Male | Female |
| 5 to 17 Years | 0 (0.0%) | 0 (0.0%) |
| 18 to 34 Years | 0 (0.0%) | 0 (0.0%) |
| 35 to 64 Years | 0 (0.0%) | 0 (0.0%) |
| 65 to 74 Years | 0 (0.0%) | 0 (0.0%) |
| 75 Years and over | 40 (44.9%) | 34 (16.5%) |
Technology Access in Montalvin Manor
Computing Device Access in Montalvin Manor
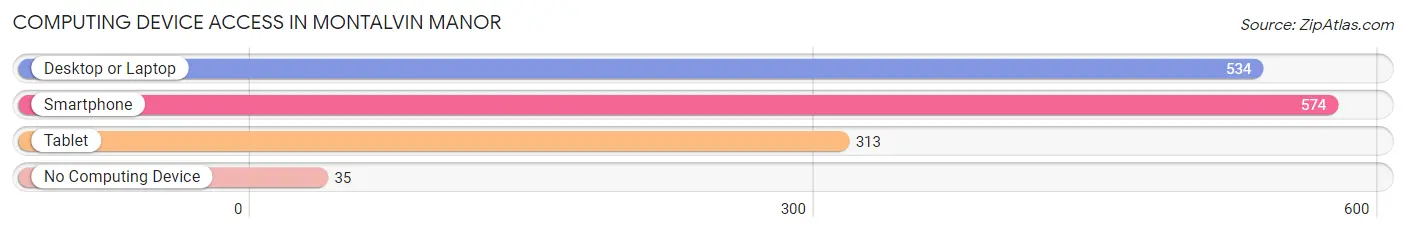
| Device Type | # Households | % Households |
| Desktop or Laptop | 534 | 82.3% |
| Smartphone | 574 | 88.4% |
| Tablet | 313 | 48.2% |
| No Computing Device | 35 | 5.4% |
| Total | 649 | 100.0% |
Internet Access in Montalvin Manor
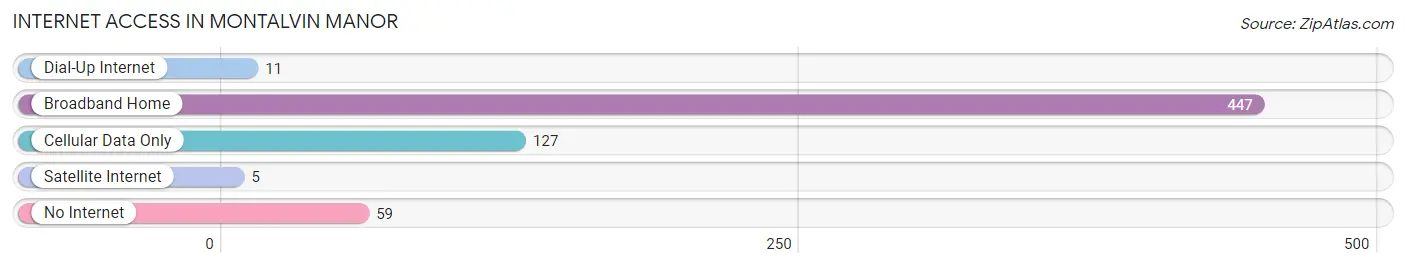
| Internet Type | # Households | % Households |
| Dial-Up Internet | 11 | 1.7% |
| Broadband Home | 447 | 68.9% |
| Cellular Data Only | 127 | 19.6% |
| Satellite Internet | 5 | 0.8% |
| No Internet | 59 | 9.1% |
| Total | 649 | 100.0% |
Montalvin Manor Summary
Montalvin Manor is a census-designated place (CDP) located in Contra Costa County, California. It is situated in the San Francisco Bay Area, approximately 20 miles northeast of Oakland. The population of Montalvin Manor was 4,845 at the 2010 census.
History
Montalvin Manor was originally part of the Rancho San Pablo, a Mexican land grant given to Francisco María Castro in 1823. The area was later acquired by the Miller-Lux ranching company in 1877. The Miller-Lux family owned the land until the 1950s, when it was sold to developers. The area was then subdivided and developed into a residential community.
Geography
Montalvin Manor is located at 37°59'25"N 122°14'17"W (37.990278, -122.238056). It is situated in the San Francisco Bay Area, approximately 20 miles northeast of Oakland. The CDP has a total area of 0.7 square miles, all of which is land.
Economy
The economy of Montalvin Manor is largely based on the service industry. The largest employers in the area are the Contra Costa County Office of Education, the Contra Costa County Sheriff's Office, and the Contra Costa County Fire Protection District. Other major employers include the Contra Costa County Library, the Contra Costa County Health Services Department, and the Contra Costa County Public Works Department.
Demographics
As of the 2010 census, there were 4,845 people, 1,717 households, and 1,269 families residing in Montalvin Manor. The population density was 6,945.3 people per square mile. The racial makeup of the CDP was 44.3% White, 11.2% African American, 0.7% Native American, 15.2% Asian, 0.3% Pacific Islander, 24.2% from other races, and 4.2% from two or more races. Hispanic or Latino of any race were 37.2% of the population.
The median income for a household in Montalvin Manor was $50,945, and the median income for a family was $58,958. About 17.2% of families and 20.3% of the population were below the poverty line, including 28.3% of those under age 18 and 8.2% of those age 65 or over.
Common Questions
What is Per Capita Income in Montalvin Manor?
Per Capita income in Montalvin Manor is $30,426.
What is the Median Family Income in Montalvin Manor?
Median Family Income in Montalvin Manor is $77,391.
What is the Median Household income in Montalvin Manor?
Median Household Income in Montalvin Manor is $77,083.
What is Income or Wage Gap in Montalvin Manor?
Income or Wage Gap in Montalvin Manor is 40.1%.
Women in Montalvin Manor earn 59.9 cents for every dollar earned by a man.
What is Inequality or Gini Index in Montalvin Manor?
Inequality or Gini Index in Montalvin Manor is 0.34.
What is the Total Population of Montalvin Manor?
Total Population of Montalvin Manor is 2,195.
What is the Total Male Population of Montalvin Manor?
Total Male Population of Montalvin Manor is 1,244.
What is the Total Female Population of Montalvin Manor?
Total Female Population of Montalvin Manor is 951.
What is the Ratio of Males per 100 Females in Montalvin Manor?
There are 130.81 Males per 100 Females in Montalvin Manor.
What is the Ratio of Females per 100 Males in Montalvin Manor?
There are 76.45 Females per 100 Males in Montalvin Manor.
What is the Median Population Age in Montalvin Manor?
Median Population Age in Montalvin Manor is 40.5 Years.
What is the Average Family Size in Montalvin Manor
Average Family Size in Montalvin Manor is 3.7 People.
What is the Average Household Size in Montalvin Manor
Average Household Size in Montalvin Manor is 3.4 People.
How Large is the Labor Force in Montalvin Manor?
There are 1,124 People in the Labor Forcein in Montalvin Manor.
What is the Percentage of People in the Labor Force in Montalvin Manor?
62.4% of People are in the Labor Force in Montalvin Manor.
What is the Unemployment Rate in Montalvin Manor?
Unemployment Rate in Montalvin Manor is 3.5%.