Cities with the Highest Percentage of Population Employed in Food Preparation & Serving in Utah
RELATED REPORTS & OPTIONS
Food Preparation & Serving
Utah
Compare Cities
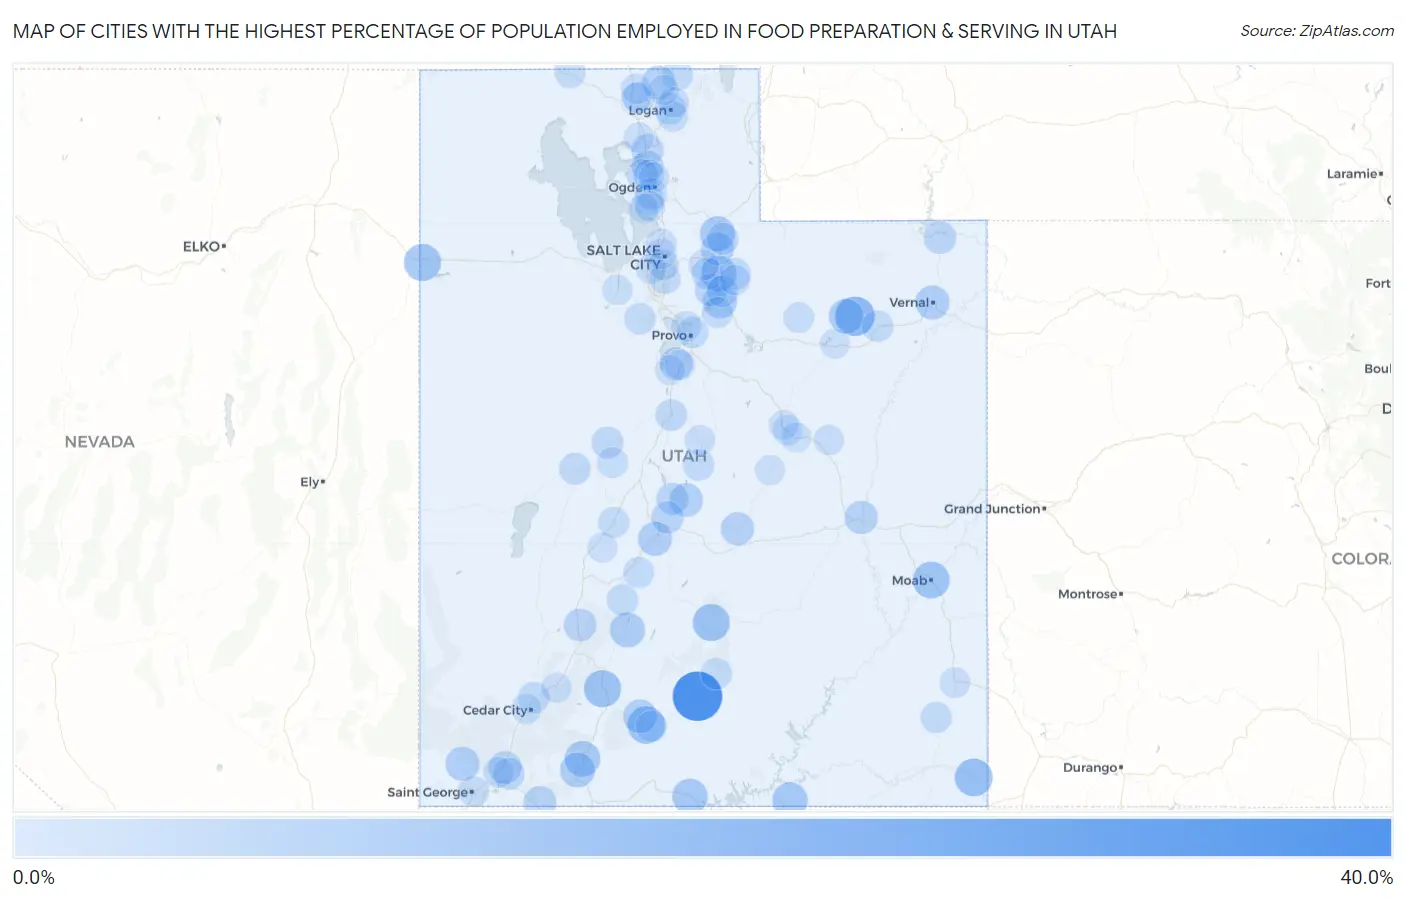
Map of Cities with the Highest Percentage of Population Employed in Food Preparation & Serving in Utah
0.0%
40.0%
Cities with the Highest Percentage of Population Employed in Food Preparation & Serving in Utah
| City | % Employed | vs State | vs National | |
| 1. | Escalante | 38.0% | 4.5%(+33.5)#1 | 5.3%(+32.7)#209 |
| 2. | Bluebell | 20.5% | 4.5%(+15.9)#2 | 5.3%(+15.2)#792 |
| 3. | Aneth | 17.6% | 4.5%(+13.1)#3 | 5.3%(+12.4)#1,107 |
| 4. | Cannonville | 17.3% | 4.5%(+12.7)#4 | 5.3%(+12.0)#1,169 |
| 5. | Panguitch | 16.5% | 4.5%(+12.0)#5 | 5.3%(+11.2)#1,298 |
| 6. | Wendover | 16.3% | 4.5%(+11.8)#6 | 5.3%(+11.1)#1,323 |
| 7. | Teasdale | 16.3% | 4.5%(+11.8)#7 | 5.3%(+11.0)#1,327 |
| 8. | Moab | 15.9% | 4.5%(+11.3)#8 | 5.3%(+10.6)#1,433 |
| 9. | Hideout | 13.9% | 4.5%(+9.39)#9 | 5.3%(+8.64)#1,932 |
| 10. | Glendale | 13.8% | 4.5%(+9.28)#10 | 5.3%(+8.53)#1,966 |
| 11. | Big Water | 13.7% | 4.5%(+9.12)#11 | 5.3%(+8.37)#2,019 |
| 12. | Navajo Mountain | 13.6% | 4.5%(+9.04)#12 | 5.3%(+8.29)#2,042 |
| 13. | Coalville | 13.2% | 4.5%(+8.65)#13 | 5.3%(+7.91)#2,185 |
| 14. | Junction | 13.0% | 4.5%(+8.43)#14 | 5.3%(+7.68)#2,269 |
| 15. | Orderville | 12.9% | 4.5%(+8.34)#15 | 5.3%(+7.59)#2,306 |
| 16. | Altamont | 12.7% | 4.5%(+8.20)#16 | 5.3%(+7.45)#2,380 |
| 17. | Vernal | 11.7% | 4.5%(+7.16)#17 | 5.3%(+6.41)#2,948 |
| 18. | Dammeron Valley | 11.5% | 4.5%(+7.00)#18 | 5.3%(+6.25)#3,044 |
| 19. | Daniel | 11.5% | 4.5%(+6.94)#19 | 5.3%(+6.19)#3,087 |
| 20. | Sigurd | 11.4% | 4.5%(+6.87)#20 | 5.3%(+6.12)#3,123 |
| 21. | Tropic | 11.1% | 4.5%(+6.57)#21 | 5.3%(+5.83)#3,313 |
| 22. | Mayfield | 10.9% | 4.5%(+6.32)#22 | 5.3%(+5.57)#3,479 |
| 23. | Trenton | 10.3% | 4.5%(+5.80)#23 | 5.3%(+5.05)#3,848 |
| 24. | Emery | 10.3% | 4.5%(+5.75)#24 | 5.3%(+5.00)#3,872 |
| 25. | Green River | 10.2% | 4.5%(+5.64)#25 | 5.3%(+4.89)#3,960 |
| 26. | Wanship | 9.9% | 4.5%(+5.36)#26 | 5.3%(+4.61)#4,193 |
| 27. | Hildale | 9.6% | 4.5%(+5.08)#27 | 5.3%(+4.33)#4,422 |
| 28. | West Mountain | 9.4% | 4.5%(+4.91)#28 | 5.3%(+4.16)#4,589 |
| 29. | Toquerville | 9.4% | 4.5%(+4.83)#29 | 5.3%(+4.08)#4,674 |
| 30. | Beaver | 9.2% | 4.5%(+4.62)#30 | 5.3%(+3.88)#4,875 |
| 31. | Interlaken | 9.1% | 4.5%(+4.55)#31 | 5.3%(+3.80)#4,970 |
| 32. | Flaming Gorge | 9.1% | 4.5%(+4.55)#32 | 5.3%(+3.80)#4,973 |
| 33. | Brighton | 9.0% | 4.5%(+4.46)#33 | 5.3%(+3.71)#5,064 |
| 34. | Centerfield | 8.7% | 4.5%(+4.15)#34 | 5.3%(+3.40)#5,457 |
| 35. | Redmond | 8.7% | 4.5%(+4.14)#35 | 5.3%(+3.39)#5,467 |
| 36. | Perry | 8.7% | 4.5%(+4.12)#36 | 5.3%(+3.37)#5,484 |
| 37. | South Willard | 8.2% | 4.5%(+3.65)#37 | 5.3%(+2.90)#6,080 |
| 38. | Lynndyl | 8.0% | 4.5%(+3.46)#38 | 5.3%(+2.71)#6,342 |
| 39. | Park City | 8.0% | 4.5%(+3.45)#39 | 5.3%(+2.70)#6,361 |
| 40. | La Verkin | 7.8% | 4.5%(+3.25)#40 | 5.3%(+2.51)#6,676 |
| 41. | Fielding | 7.8% | 4.5%(+3.21)#41 | 5.3%(+2.47)#6,741 |
| 42. | Hinckley | 7.7% | 4.5%(+3.16)#42 | 5.3%(+2.41)#6,830 |
| 43. | Hoytsville | 7.6% | 4.5%(+3.06)#43 | 5.3%(+2.31)#6,995 |
| 44. | Plain City | 7.6% | 4.5%(+3.05)#44 | 5.3%(+2.30)#7,008 |
| 45. | Nephi | 7.6% | 4.5%(+3.03)#45 | 5.3%(+2.28)#7,042 |
| 46. | Marysvale | 7.4% | 4.5%(+2.89)#46 | 5.3%(+2.14)#7,243 |
| 47. | Kamas | 7.4% | 4.5%(+2.87)#47 | 5.3%(+2.12)#7,263 |
| 48. | Cedar Fort | 7.4% | 4.5%(+2.87)#48 | 5.3%(+2.12)#7,278 |
| 49. | Heber | 7.4% | 4.5%(+2.87)#49 | 5.3%(+2.12)#7,290 |
| 50. | Roosevelt | 7.3% | 4.5%(+2.72)#50 | 5.3%(+1.98)#7,503 |
| 51. | Enoch | 7.3% | 4.5%(+2.72)#51 | 5.3%(+1.97)#7,518 |
| 52. | Cove | 7.2% | 4.5%(+2.69)#52 | 5.3%(+1.94)#7,568 |
| 53. | Riverdale | 7.2% | 4.5%(+2.67)#53 | 5.3%(+1.92)#7,602 |
| 54. | Blanding | 7.1% | 4.5%(+2.56)#54 | 5.3%(+1.81)#7,829 |
| 55. | Boulder | 7.1% | 4.5%(+2.54)#55 | 5.3%(+1.79)#7,859 |
| 56. | Logan | 7.0% | 4.5%(+2.51)#56 | 5.3%(+1.76)#7,919 |
| 57. | Provo | 7.0% | 4.5%(+2.44)#57 | 5.3%(+1.69)#8,060 |
| 58. | Henrieville | 6.9% | 4.5%(+2.36)#58 | 5.3%(+1.61)#8,197 |
| 59. | Snowville | 6.8% | 4.5%(+2.24)#59 | 5.3%(+1.49)#8,442 |
| 60. | Ephraim | 6.7% | 4.5%(+2.20)#60 | 5.3%(+1.45)#8,529 |
| 61. | Monroe | 6.7% | 4.5%(+2.18)#61 | 5.3%(+1.44)#8,564 |
| 62. | Midvale | 6.6% | 4.5%(+2.07)#62 | 5.3%(+1.32)#8,850 |
| 63. | Fillmore | 6.6% | 4.5%(+2.02)#63 | 5.3%(+1.27)#8,946 |
| 64. | Sunset | 6.5% | 4.5%(+2.00)#64 | 5.3%(+1.25)#8,989 |
| 65. | Farr West | 6.5% | 4.5%(+1.95)#65 | 5.3%(+1.20)#9,128 |
| 66. | Wallsburg | 6.4% | 4.5%(+1.89)#66 | 5.3%(+1.14)#9,274 |
| 67. | Tabiona | 6.2% | 4.5%(+1.71)#67 | 5.3%(+0.964)#9,685 |
| 68. | Millville | 6.1% | 4.5%(+1.56)#68 | 5.3%(+0.807)#10,092 |
| 69. | Oak City | 6.1% | 4.5%(+1.52)#69 | 5.3%(+0.775)#10,166 |
| 70. | Leeds | 6.0% | 4.5%(+1.49)#70 | 5.3%(+0.746)#10,257 |
| 71. | South Salt Lake | 6.0% | 4.5%(+1.42)#71 | 5.3%(+0.670)#10,445 |
| 72. | St George | 5.8% | 4.5%(+1.31)#72 | 5.3%(+0.559)#10,700 |
| 73. | Monticello | 5.8% | 4.5%(+1.27)#73 | 5.3%(+0.524)#10,783 |
| 74. | Francis | 5.7% | 4.5%(+1.21)#74 | 5.3%(+0.461)#10,942 |
| 75. | Orem | 5.7% | 4.5%(+1.16)#75 | 5.3%(+0.411)#11,099 |
| 76. | East Carbon | 5.6% | 4.5%(+1.04)#76 | 5.3%(+0.293)#11,420 |
| 77. | Harrisville | 5.6% | 4.5%(+1.03)#77 | 5.3%(+0.282)#11,450 |
| 78. | Salt Lake City | 5.5% | 4.5%(+1.01)#78 | 5.3%(+0.260)#11,529 |
| 79. | Plymouth | 5.5% | 4.5%(+0.988)#79 | 5.3%(+0.239)#11,579 |
| 80. | Tooele | 5.5% | 4.5%(+0.956)#80 | 5.3%(+0.207)#11,653 |
| 81. | Snyderville | 5.4% | 4.5%(+0.895)#81 | 5.3%(+0.146)#11,801 |
| 82. | North Logan | 5.4% | 4.5%(+0.879)#82 | 5.3%(+0.130)#11,832 |
| 83. | Parowan | 5.4% | 4.5%(+0.861)#83 | 5.3%(+0.112)#11,881 |
| 84. | Cedar City | 5.4% | 4.5%(+0.851)#84 | 5.3%(+0.102)#11,913 |
| 85. | Price | 5.4% | 4.5%(+0.821)#85 | 5.3%(+0.072)#11,991 |
| 86. | Payson | 5.3% | 4.5%(+0.755)#86 | 5.3%(+0.006)#12,177 |
| 87. | West Valley City | 5.3% | 4.5%(+0.747)#87 | 5.3%(-0.002)#12,196 |
| 88. | Moroni | 5.3% | 4.5%(+0.734)#88 | 5.3%(-0.014)#12,233 |
| 89. | Genola | 5.2% | 4.5%(+0.712)#89 | 5.3%(-0.037)#12,311 |
| 90. | Corinne | 5.2% | 4.5%(+0.712)#90 | 5.3%(-0.037)#12,312 |
| 91. | Huntington | 5.2% | 4.5%(+0.708)#91 | 5.3%(-0.041)#12,323 |
| 92. | Clearfield | 5.2% | 4.5%(+0.675)#92 | 5.3%(-0.074)#12,399 |
| 93. | Amalga | 5.2% | 4.5%(+0.663)#93 | 5.3%(-0.086)#12,438 |
| 94. | Wellington | 5.2% | 4.5%(+0.614)#94 | 5.3%(-0.135)#12,574 |
| 95. | North Salt Lake | 5.1% | 4.5%(+0.605)#95 | 5.3%(-0.144)#12,601 |
| 96. | Carbonville | 5.1% | 4.5%(+0.583)#96 | 5.3%(-0.166)#12,676 |
| 97. | Kanosh | 5.1% | 4.5%(+0.554)#97 | 5.3%(-0.195)#12,762 |
| 98. | Syracuse | 5.1% | 4.5%(+0.530)#98 | 5.3%(-0.219)#12,811 |
| 99. | Duchesne | 5.0% | 4.5%(+0.503)#99 | 5.3%(-0.246)#12,907 |
| 100. | Riverside | 5.0% | 4.5%(+0.454)#100 | 5.3%(-0.295)#13,059 |
Common Questions
What are the Top 10 Cities with the Highest Percentage of Population Employed in Food Preparation & Serving in Utah?
Top 10 Cities with the Highest Percentage of Population Employed in Food Preparation & Serving in Utah are:
What city has the Highest Percentage of Population Employed in Food Preparation & Serving in Utah?
Escalante has the Highest Percentage of Population Employed in Food Preparation & Serving in Utah with 38.0%.
What is the Percentage of Population Employed in Food Preparation & Serving in the State of Utah?
Percentage of Population Employed in Food Preparation & Serving in Utah is 4.5%.
What is the Percentage of Population Employed in Food Preparation & Serving in the United States?
Percentage of Population Employed in Food Preparation & Serving in the United States is 5.3%.