Cities with the Highest Percentage of Population Employed in Food Preparation & Serving in Pennsylvania
RELATED REPORTS & OPTIONS
Food Preparation & Serving
Pennsylvania
Compare Cities
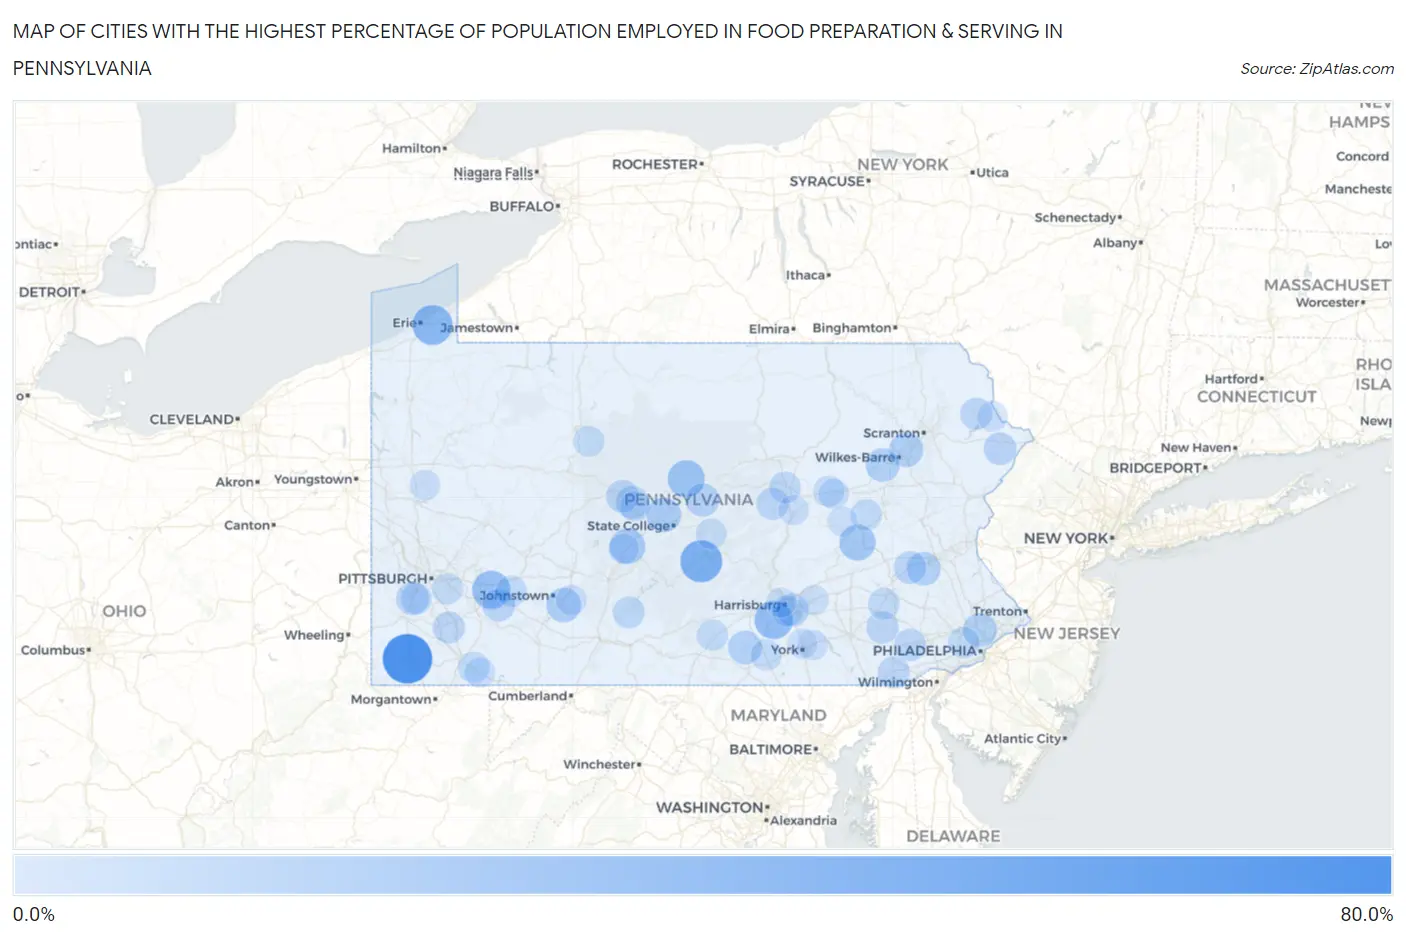
Map of Cities with the Highest Percentage of Population Employed in Food Preparation & Serving in Pennsylvania
0.0%
80.0%
Cities with the Highest Percentage of Population Employed in Food Preparation & Serving in Pennsylvania
| City | % Employed | vs State | vs National | |
| 1. | West Waynesburg | 64.5% | 5.0%(+59.5)#1 | 5.3%(+59.2)#61 |
| 2. | Aaronsburg Cdp Washington County | 63.6% | 5.0%(+58.6)#2 | 5.3%(+58.4)#63 |
| 3. | Granville | 44.3% | 5.0%(+39.3)#3 | 5.3%(+39.0)#146 |
| 4. | Milford Borough | 40.5% | 5.0%(+35.4)#4 | 5.3%(+35.2)#185 |
| 5. | Penn State Erie Behrend | 39.0% | 5.0%(+33.9)#5 | 5.3%(+33.7)#198 |
| 6. | Cove Forge | 36.5% | 5.0%(+31.5)#6 | 5.3%(+31.2)#229 |
| 7. | Messiah College | 35.0% | 5.0%(+29.9)#7 | 5.3%(+29.7)#256 |
| 8. | Crabtree | 34.7% | 5.0%(+29.6)#8 | 5.3%(+29.4)#258 |
| 9. | Carson Valley | 34.4% | 5.0%(+29.3)#9 | 5.3%(+29.1)#264 |
| 10. | Beavertown | 33.3% | 5.0%(+28.3)#10 | 5.3%(+28.0)#280 |
| 11. | Orviston | 31.6% | 5.0%(+26.5)#11 | 5.3%(+26.3)#305 |
| 12. | Glasgow Borough | 30.6% | 5.0%(+25.6)#12 | 5.3%(+25.3)#331 |
| 13. | Misericordia University | 30.5% | 5.0%(+25.5)#13 | 5.3%(+25.2)#333 |
| 14. | Marlin | 29.3% | 5.0%(+24.2)#14 | 5.3%(+24.0)#362 |
| 15. | Grazierville | 27.8% | 5.0%(+22.8)#15 | 5.3%(+22.5)#405 |
| 16. | Julian | 25.6% | 5.0%(+20.5)#16 | 5.3%(+20.3)#486 |
| 17. | University Of Pittsburgh Johnstown | 25.2% | 5.0%(+20.2)#17 | 5.3%(+20.0)#492 |
| 18. | Spring Drive Mobile Home Park | 24.7% | 5.0%(+19.6)#18 | 5.3%(+19.4)#519 |
| 19. | Eagleville Cdp Centre County | 24.5% | 5.0%(+19.5)#19 | 5.3%(+19.2)#526 |
| 20. | Inkerman | 24.3% | 5.0%(+19.3)#20 | 5.3%(+19.1)#534 |
| 21. | Shelocta Borough | 23.8% | 5.0%(+18.8)#21 | 5.3%(+18.5)#559 |
| 22. | Arcadia University | 23.7% | 5.0%(+18.7)#22 | 5.3%(+18.4)#568 |
| 23. | Aspers | 23.4% | 5.0%(+18.4)#23 | 5.3%(+18.1)#590 |
| 24. | Mertztown | 23.1% | 5.0%(+18.1)#24 | 5.3%(+17.8)#606 |
| 25. | Sheatown | 23.0% | 5.0%(+18.0)#25 | 5.3%(+17.8)#616 |
| 26. | Darlington Borough | 22.2% | 5.0%(+17.2)#26 | 5.3%(+16.9)#659 |
| 27. | Hublersburg | 22.1% | 5.0%(+17.0)#27 | 5.3%(+16.8)#677 |
| 28. | Morrisdale | 21.1% | 5.0%(+16.1)#28 | 5.3%(+15.8)#726 |
| 29. | Grampian Borough | 20.9% | 5.0%(+15.9)#29 | 5.3%(+15.7)#740 |
| 30. | Hendersonville | 20.9% | 5.0%(+15.9)#30 | 5.3%(+15.6)#744 |
| 31. | Hostetter | 20.9% | 5.0%(+15.8)#31 | 5.3%(+15.6)#745 |
| 32. | Bressler | 20.8% | 5.0%(+15.7)#32 | 5.3%(+15.5)#757 |
| 33. | Conashaugh Lakes | 20.5% | 5.0%(+15.5)#33 | 5.3%(+15.2)#783 |
| 34. | Bigler | 20.4% | 5.0%(+15.3)#34 | 5.3%(+15.1)#796 |
| 35. | Kutztown University | 20.2% | 5.0%(+15.1)#35 | 5.3%(+14.9)#823 |
| 36. | Manorville Borough | 20.1% | 5.0%(+15.1)#36 | 5.3%(+14.8)#827 |
| 37. | Orrstown Borough | 19.6% | 5.0%(+14.6)#37 | 5.3%(+14.3)#883 |
| 38. | East Earl | 19.5% | 5.0%(+14.5)#38 | 5.3%(+14.2)#892 |
| 39. | Vicksburg | 19.3% | 5.0%(+14.2)#39 | 5.3%(+14.0)#918 |
| 40. | Fairhope | 19.2% | 5.0%(+14.2)#40 | 5.3%(+13.9)#920 |
| 41. | Loretto Borough | 19.2% | 5.0%(+14.2)#41 | 5.3%(+13.9)#925 |
| 42. | Penn State Berks | 19.1% | 5.0%(+14.1)#42 | 5.3%(+13.8)#935 |
| 43. | Lincoln University | 19.1% | 5.0%(+14.0)#43 | 5.3%(+13.8)#936 |
| 44. | Caln | 19.0% | 5.0%(+13.9)#44 | 5.3%(+13.7)#948 |
| 45. | White Mills | 18.8% | 5.0%(+13.8)#45 | 5.3%(+13.6)#963 |
| 46. | Stonerstown | 18.6% | 5.0%(+13.6)#46 | 5.3%(+13.4)#988 |
| 47. | Little Meadows Borough | 18.4% | 5.0%(+13.4)#47 | 5.3%(+13.2)#1,014 |
| 48. | Haysville Borough | 18.4% | 5.0%(+13.3)#48 | 5.3%(+13.1)#1,021 |
| 49. | Markleysburg Borough | 18.2% | 5.0%(+13.1)#49 | 5.3%(+12.9)#1,041 |
| 50. | New Columbia | 18.0% | 5.0%(+13.0)#50 | 5.3%(+12.7)#1,060 |
| 51. | Gouglersville | 17.7% | 5.0%(+12.7)#51 | 5.3%(+12.5)#1,095 |
| 52. | Brandonville | 17.3% | 5.0%(+12.3)#52 | 5.3%(+12.0)#1,165 |
| 53. | Haverford College | 17.2% | 5.0%(+12.2)#53 | 5.3%(+11.9)#1,180 |
| 54. | Woodcock Borough | 17.2% | 5.0%(+12.1)#54 | 5.3%(+11.9)#1,182 |
| 55. | Adamsburg Borough | 17.2% | 5.0%(+12.1)#55 | 5.3%(+11.9)#1,183 |
| 56. | Millwood | 17.2% | 5.0%(+12.1)#56 | 5.3%(+11.9)#1,185 |
| 57. | Chalkhill | 17.1% | 5.0%(+12.1)#57 | 5.3%(+11.9)#1,187 |
| 58. | East Altoona | 17.1% | 5.0%(+12.1)#58 | 5.3%(+11.8)#1,193 |
| 59. | Shippensburg University | 17.1% | 5.0%(+12.0)#59 | 5.3%(+11.8)#1,196 |
| 60. | Lawrence | 17.0% | 5.0%(+12.0)#60 | 5.3%(+11.8)#1,199 |
| 61. | New Market | 17.0% | 5.0%(+12.0)#61 | 5.3%(+11.7)#1,201 |
| 62. | Duquesne | 17.0% | 5.0%(+12.0)#62 | 5.3%(+11.7)#1,206 |
| 63. | Indiana Borough | 16.7% | 5.0%(+11.7)#63 | 5.3%(+11.5)#1,236 |
| 64. | Kersey | 16.7% | 5.0%(+11.7)#64 | 5.3%(+11.4)#1,240 |
| 65. | Dale Borough | 16.7% | 5.0%(+11.6)#65 | 5.3%(+11.4)#1,248 |
| 66. | Hampton | 16.6% | 5.0%(+11.5)#66 | 5.3%(+11.3)#1,288 |
| 67. | Hawley Borough | 16.5% | 5.0%(+11.5)#67 | 5.3%(+11.3)#1,291 |
| 68. | Finleyville Borough | 16.4% | 5.0%(+11.4)#68 | 5.3%(+11.2)#1,305 |
| 69. | Duryea Borough | 16.4% | 5.0%(+11.4)#69 | 5.3%(+11.1)#1,311 |
| 70. | Buckhorn | 16.3% | 5.0%(+11.2)#70 | 5.3%(+11.0)#1,336 |
| 71. | Hooversville Borough | 16.2% | 5.0%(+11.2)#71 | 5.3%(+10.9)#1,347 |
| 72. | Elco Borough | 16.2% | 5.0%(+11.1)#72 | 5.3%(+10.9)#1,360 |
| 73. | Benton Borough | 16.1% | 5.0%(+11.1)#73 | 5.3%(+10.9)#1,375 |
| 74. | Elizabeth Borough | 16.0% | 5.0%(+11.0)#74 | 5.3%(+10.7)#1,405 |
| 75. | Siglerville | 15.9% | 5.0%(+10.9)#75 | 5.3%(+10.6)#1,422 |
| 76. | Shade Gap Borough | 15.8% | 5.0%(+10.7)#76 | 5.3%(+10.5)#1,449 |
| 77. | Etna Borough | 15.7% | 5.0%(+10.7)#77 | 5.3%(+10.5)#1,462 |
| 78. | Mount Oliver Borough | 15.7% | 5.0%(+10.7)#78 | 5.3%(+10.5)#1,463 |
| 79. | Landisburg Borough | 15.6% | 5.0%(+10.6)#79 | 5.3%(+10.3)#1,487 |
| 80. | Eastvale Borough | 15.6% | 5.0%(+10.5)#80 | 5.3%(+10.3)#1,497 |
| 81. | Watsontown Borough | 15.4% | 5.0%(+10.3)#81 | 5.3%(+10.1)#1,540 |
| 82. | Beaver Meadows Borough | 15.1% | 5.0%(+10.1)#82 | 5.3%(+9.83)#1,593 |
| 83. | Washingtonville Borough | 15.1% | 5.0%(+10.1)#83 | 5.3%(+9.81)#1,604 |
| 84. | Yorklyn | 15.1% | 5.0%(+10.0)#84 | 5.3%(+9.80)#1,606 |
| 85. | Juniata Gap | 15.0% | 5.0%(+9.97)#85 | 5.3%(+9.73)#1,622 |
| 86. | Farmington | 15.0% | 5.0%(+9.96)#86 | 5.3%(+9.71)#1,627 |
| 87. | Salix | 15.0% | 5.0%(+9.94)#87 | 5.3%(+9.70)#1,636 |
| 88. | Slippery Rock University | 15.0% | 5.0%(+9.94)#88 | 5.3%(+9.70)#1,638 |
| 89. | Fawn Lake Forest | 14.9% | 5.0%(+9.84)#89 | 5.3%(+9.60)#1,666 |
| 90. | Tipton | 14.8% | 5.0%(+9.80)#90 | 5.3%(+9.55)#1,677 |
| 91. | Bloomsburg | 14.8% | 5.0%(+9.75)#91 | 5.3%(+9.51)#1,689 |
| 92. | Catawissa Borough | 14.7% | 5.0%(+9.68)#92 | 5.3%(+9.44)#1,704 |
| 93. | Kapp Heights | 14.7% | 5.0%(+9.66)#93 | 5.3%(+9.42)#1,708 |
| 94. | Valley View Cdp York County | 14.6% | 5.0%(+9.57)#94 | 5.3%(+9.33)#1,733 |
| 95. | Hawk Run | 14.5% | 5.0%(+9.48)#95 | 5.3%(+9.24)#1,763 |
| 96. | State College Borough | 14.4% | 5.0%(+9.40)#96 | 5.3%(+9.15)#1,784 |
| 97. | Wilburton Number Two | 14.3% | 5.0%(+9.24)#97 | 5.3%(+9.00)#1,831 |
| 98. | West Fairview | 14.2% | 5.0%(+9.20)#98 | 5.3%(+8.96)#1,844 |
| 99. | Palmdale | 14.1% | 5.0%(+9.07)#99 | 5.3%(+8.82)#1,880 |
| 100. | Emigsville | 14.1% | 5.0%(+9.05)#100 | 5.3%(+8.80)#1,886 |
Common Questions
What are the Top 10 Cities with the Highest Percentage of Population Employed in Food Preparation & Serving in Pennsylvania?
Top 10 Cities with the Highest Percentage of Population Employed in Food Preparation & Serving in Pennsylvania are:
#1
64.5%
#2
44.3%
#3
39.0%
#4
35.0%
#5
34.7%
#6
31.6%
#7
29.3%
#8
27.8%
#9
25.6%
#10
25.2%
What city has the Highest Percentage of Population Employed in Food Preparation & Serving in Pennsylvania?
West Waynesburg has the Highest Percentage of Population Employed in Food Preparation & Serving in Pennsylvania with 64.5%.
What is the Percentage of Population Employed in Food Preparation & Serving in the State of Pennsylvania?
Percentage of Population Employed in Food Preparation & Serving in Pennsylvania is 5.0%.
What is the Percentage of Population Employed in Food Preparation & Serving in the United States?
Percentage of Population Employed in Food Preparation & Serving in the United States is 5.3%.