Cities with the Highest Percentage of Population Employed in Food Preparation & Serving in Maryland
RELATED REPORTS & OPTIONS
Food Preparation & Serving
Maryland
Compare Cities
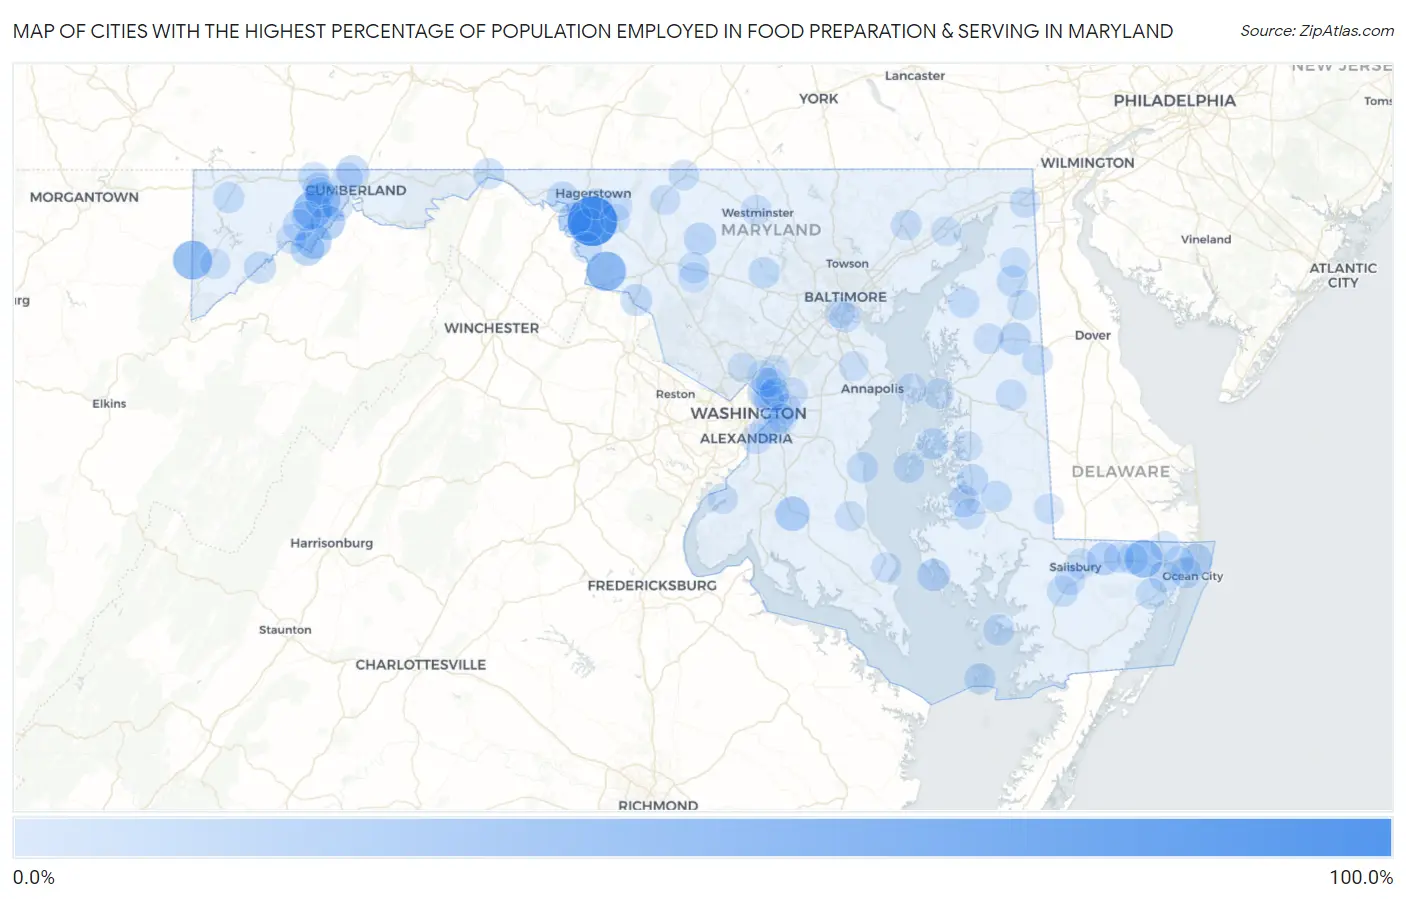
Map of Cities with the Highest Percentage of Population Employed in Food Preparation & Serving in Maryland
0.0%
100.0%
Cities with the Highest Percentage of Population Employed in Food Preparation & Serving in Maryland
| City | % Employed | vs State | vs National | |
| 1. | Breathedsville | 100.0% | 4.4%(+95.6)#1 | 5.3%(+94.7)#3 |
| 2. | Brownsville | 50.0% | 4.4%(+45.6)#2 | 5.3%(+44.7)#118 |
| 3. | Hutton | 48.3% | 4.4%(+43.9)#3 | 5.3%(+43.0)#126 |
| 4. | Gilmore | 43.8% | 4.4%(+39.4)#4 | 5.3%(+38.5)#152 |
| 5. | Whaleyville | 42.0% | 4.4%(+37.7)#5 | 5.3%(+36.8)#168 |
| 6. | Vale Summit | 32.6% | 4.4%(+28.2)#6 | 5.3%(+27.3)#288 |
| 7. | Dawson | 29.6% | 4.4%(+25.2)#7 | 5.3%(+24.3)#357 |
| 8. | Rawlings | 28.0% | 4.4%(+23.6)#8 | 5.3%(+22.7)#401 |
| 9. | Bryantown | 27.1% | 4.4%(+22.7)#9 | 5.3%(+21.8)#425 |
| 10. | Fairplay | 24.3% | 4.4%(+20.0)#10 | 5.3%(+19.1)#535 |
| 11. | Mccoole | 23.6% | 4.4%(+19.2)#11 | 5.3%(+18.3)#575 |
| 12. | Parsonsburg | 20.9% | 4.4%(+16.5)#12 | 5.3%(+15.6)#747 |
| 13. | Downsville | 20.5% | 4.4%(+16.1)#13 | 5.3%(+15.2)#782 |
| 14. | Fishing Creek | 18.1% | 4.4%(+13.7)#14 | 5.3%(+12.8)#1,055 |
| 15. | Barclay | 17.8% | 4.4%(+13.4)#15 | 5.3%(+12.5)#1,090 |
| 16. | Libertytown | 17.7% | 4.4%(+13.4)#16 | 5.3%(+12.5)#1,094 |
| 17. | Ocean City | 16.8% | 4.4%(+12.5)#17 | 5.3%(+11.6)#1,222 |
| 18. | Frostburg | 16.3% | 4.4%(+11.9)#18 | 5.3%(+11.0)#1,340 |
| 19. | Ellerslie | 15.9% | 4.4%(+11.5)#19 | 5.3%(+10.6)#1,421 |
| 20. | Kitzmiller | 14.8% | 4.4%(+10.4)#20 | 5.3%(+9.49)#1,693 |
| 21. | Algonquin | 14.5% | 4.4%(+10.1)#21 | 5.3%(+9.21)#1,770 |
| 22. | Point Of Rocks | 14.2% | 4.4%(+9.80)#22 | 5.3%(+8.89)#1,865 |
| 23. | Trappe | 14.1% | 4.4%(+9.70)#23 | 5.3%(+8.79)#1,893 |
| 24. | Barton | 14.0% | 4.4%(+9.66)#24 | 5.3%(+8.76)#1,903 |
| 25. | Berlin | 13.9% | 4.4%(+9.55)#25 | 5.3%(+8.64)#1,931 |
| 26. | Pinesburg | 13.9% | 4.4%(+9.53)#26 | 5.3%(+8.62)#1,936 |
| 27. | Brentwood | 13.2% | 4.4%(+8.80)#27 | 5.3%(+7.90)#2,194 |
| 28. | Smith Island | 12.9% | 4.4%(+8.52)#28 | 5.3%(+7.62)#2,291 |
| 29. | Edmonston | 12.8% | 4.4%(+8.42)#29 | 5.3%(+7.52)#2,345 |
| 30. | Sykesville | 12.8% | 4.4%(+8.40)#30 | 5.3%(+7.49)#2,356 |
| 31. | West Ocean City | 12.5% | 4.4%(+8.16)#31 | 5.3%(+7.26)#2,466 |
| 32. | St Michaels | 12.5% | 4.4%(+8.10)#32 | 5.3%(+7.19)#2,532 |
| 33. | Galena | 12.4% | 4.4%(+8.02)#33 | 5.3%(+7.11)#2,562 |
| 34. | Deal Island | 11.9% | 4.4%(+7.52)#34 | 5.3%(+6.62)#2,822 |
| 35. | New Market | 11.8% | 4.4%(+7.40)#35 | 5.3%(+6.49)#2,887 |
| 36. | Accident | 11.7% | 4.4%(+7.27)#36 | 5.3%(+6.36)#2,970 |
| 37. | Eden | 11.5% | 4.4%(+7.13)#37 | 5.3%(+6.23)#3,062 |
| 38. | Hancock | 11.4% | 4.4%(+7.04)#38 | 5.3%(+6.13)#3,112 |
| 39. | Worton | 11.3% | 4.4%(+6.96)#39 | 5.3%(+6.05)#3,173 |
| 40. | Newark | 11.3% | 4.4%(+6.94)#40 | 5.3%(+6.03)#3,183 |
| 41. | Finzel | 11.3% | 4.4%(+6.93)#41 | 5.3%(+6.02)#3,195 |
| 42. | North Beach | 11.1% | 4.4%(+6.68)#42 | 5.3%(+5.77)#3,355 |
| 43. | Lewistown | 10.9% | 4.4%(+6.50)#43 | 5.3%(+5.60)#3,452 |
| 44. | Secretary | 10.8% | 4.4%(+6.40)#44 | 5.3%(+5.50)#3,521 |
| 45. | Tilghman Island | 10.8% | 4.4%(+6.39)#45 | 5.3%(+5.49)#3,527 |
| 46. | Ocean Pines | 10.7% | 4.4%(+6.36)#46 | 5.3%(+5.45)#3,556 |
| 47. | Willards | 10.6% | 4.4%(+6.21)#47 | 5.3%(+5.30)#3,657 |
| 48. | Ridgely | 10.5% | 4.4%(+6.12)#48 | 5.3%(+5.22)#3,727 |
| 49. | Funkstown | 10.5% | 4.4%(+6.08)#49 | 5.3%(+5.18)#3,749 |
| 50. | Cambridge | 10.2% | 4.4%(+5.82)#50 | 5.3%(+4.92)#3,941 |
| 51. | Henderson | 10.0% | 4.4%(+5.62)#51 | 5.3%(+4.71)#4,112 |
| 52. | Grahamtown | 9.9% | 4.4%(+5.54)#52 | 5.3%(+4.63)#4,181 |
| 53. | Cottage City | 9.9% | 4.4%(+5.52)#53 | 5.3%(+4.61)#4,192 |
| 54. | Forest Heights | 9.8% | 4.4%(+5.41)#54 | 5.3%(+4.51)#4,268 |
| 55. | Sharpsburg | 9.7% | 4.4%(+5.28)#55 | 5.3%(+4.38)#4,381 |
| 56. | Cresaptown | 9.6% | 4.4%(+5.24)#56 | 5.3%(+4.33)#4,421 |
| 57. | Bel Air | 9.5% | 4.4%(+5.10)#57 | 5.3%(+4.20)#4,557 |
| 58. | Emmitsburg | 9.5% | 4.4%(+5.07)#58 | 5.3%(+4.17)#4,584 |
| 59. | Burnt Mills | 9.3% | 4.4%(+4.95)#59 | 5.3%(+4.04)#4,713 |
| 60. | Elkton | 9.2% | 4.4%(+4.78)#60 | 5.3%(+3.87)#4,880 |
| 61. | Salisbury | 9.1% | 4.4%(+4.76)#61 | 5.3%(+3.85)#4,899 |
| 62. | Pittsville | 9.1% | 4.4%(+4.68)#62 | 5.3%(+3.78)#4,990 |
| 63. | Grasonville | 9.0% | 4.4%(+4.62)#63 | 5.3%(+3.71)#5,059 |
| 64. | Lanham | 8.9% | 4.4%(+4.55)#64 | 5.3%(+3.65)#5,156 |
| 65. | Westernport | 8.7% | 4.4%(+4.31)#65 | 5.3%(+3.40)#5,449 |
| 66. | Monrovia | 8.6% | 4.4%(+4.27)#66 | 5.3%(+3.36)#5,492 |
| 67. | Church Hill | 8.5% | 4.4%(+4.12)#67 | 5.3%(+3.22)#5,658 |
| 68. | Brooklyn Park | 8.5% | 4.4%(+4.08)#68 | 5.3%(+3.18)#5,703 |
| 69. | Stevensville | 8.4% | 4.4%(+4.04)#69 | 5.3%(+3.14)#5,752 |
| 70. | Chillum | 8.4% | 4.4%(+4.04)#70 | 5.3%(+3.14)#5,757 |
| 71. | Baltimore Highlands | 8.4% | 4.4%(+3.98)#71 | 5.3%(+3.08)#5,825 |
| 72. | Indian Head | 8.3% | 4.4%(+3.97)#72 | 5.3%(+3.06)#5,847 |
| 73. | Millington | 8.2% | 4.4%(+3.77)#73 | 5.3%(+2.86)#6,138 |
| 74. | Summerfield | 8.1% | 4.4%(+3.74)#74 | 5.3%(+2.83)#6,175 |
| 75. | Mountain Lake Park | 8.1% | 4.4%(+3.73)#75 | 5.3%(+2.82)#6,182 |
| 76. | Fruitland | 8.1% | 4.4%(+3.72)#76 | 5.3%(+2.81)#6,203 |
| 77. | Capitol Heights | 8.1% | 4.4%(+3.70)#77 | 5.3%(+2.79)#6,233 |
| 78. | Westminster | 8.0% | 4.4%(+3.65)#78 | 5.3%(+2.75)#6,291 |
| 79. | Thurmont | 7.8% | 4.4%(+3.44)#79 | 5.3%(+2.54)#6,620 |
| 80. | College Park | 7.7% | 4.4%(+3.31)#80 | 5.3%(+2.41)#6,822 |
| 81. | Corriganville | 7.6% | 4.4%(+3.20)#81 | 5.3%(+2.29)#7,028 |
| 82. | Lonaconing | 7.5% | 4.4%(+3.15)#82 | 5.3%(+2.24)#7,094 |
| 83. | Lusby | 7.5% | 4.4%(+3.14)#83 | 5.3%(+2.23)#7,101 |
| 84. | Easton | 7.3% | 4.4%(+2.94)#84 | 5.3%(+2.04)#7,413 |
| 85. | Aberdeen | 7.3% | 4.4%(+2.94)#85 | 5.3%(+2.03)#7,415 |
| 86. | Mount Lena | 7.3% | 4.4%(+2.88)#86 | 5.3%(+1.98)#7,501 |
| 87. | Galestown | 7.1% | 4.4%(+2.76)#87 | 5.3%(+1.86)#7,745 |
| 88. | Beltsville | 7.1% | 4.4%(+2.74)#88 | 5.3%(+1.83)#7,781 |
| 89. | Silver Hill | 7.1% | 4.4%(+2.70)#89 | 5.3%(+1.79)#7,861 |
| 90. | Mount Aetna | 7.1% | 4.4%(+2.67)#90 | 5.3%(+1.77)#7,916 |
| 91. | Hillandale | 7.0% | 4.4%(+2.63)#91 | 5.3%(+1.73)#7,987 |
| 92. | Adelphi | 7.0% | 4.4%(+2.62)#92 | 5.3%(+1.72)#7,999 |
| 93. | Prince Frederick | 6.9% | 4.4%(+2.55)#93 | 5.3%(+1.64)#8,133 |
| 94. | Cecilton | 6.9% | 4.4%(+2.52)#94 | 5.3%(+1.62)#8,170 |
| 95. | Wheaton | 6.9% | 4.4%(+2.49)#95 | 5.3%(+1.58)#8,251 |
| 96. | Hillcrest Heights | 6.8% | 4.4%(+2.45)#96 | 5.3%(+1.54)#8,346 |
| 97. | Riverdale Park | 6.8% | 4.4%(+2.44)#97 | 5.3%(+1.54)#8,353 |
| 98. | Walker Mill | 6.7% | 4.4%(+2.33)#98 | 5.3%(+1.42)#8,596 |
| 99. | Bishopville | 6.7% | 4.4%(+2.29)#99 | 5.3%(+1.38)#8,680 |
| 100. | Herald Harbor | 6.7% | 4.4%(+2.28)#100 | 5.3%(+1.37)#8,733 |
Common Questions
What are the Top 10 Cities with the Highest Percentage of Population Employed in Food Preparation & Serving in Maryland?
Top 10 Cities with the Highest Percentage of Population Employed in Food Preparation & Serving in Maryland are:
#1
100.0%
#2
50.0%
#3
48.3%
#4
43.8%
#5
42.0%
#6
32.6%
#7
29.6%
#8
28.0%
#9
27.1%
#10
24.3%
What city has the Highest Percentage of Population Employed in Food Preparation & Serving in Maryland?
Breathedsville has the Highest Percentage of Population Employed in Food Preparation & Serving in Maryland with 100.0%.
What is the Percentage of Population Employed in Food Preparation & Serving in the State of Maryland?
Percentage of Population Employed in Food Preparation & Serving in Maryland is 4.4%.
What is the Percentage of Population Employed in Food Preparation & Serving in the United States?
Percentage of Population Employed in Food Preparation & Serving in the United States is 5.3%.