Cities with the Highest Percentage of Population Employed in Food Preparation & Serving in South Dakota
RELATED REPORTS & OPTIONS
Food Preparation & Serving
South Dakota
Compare Cities
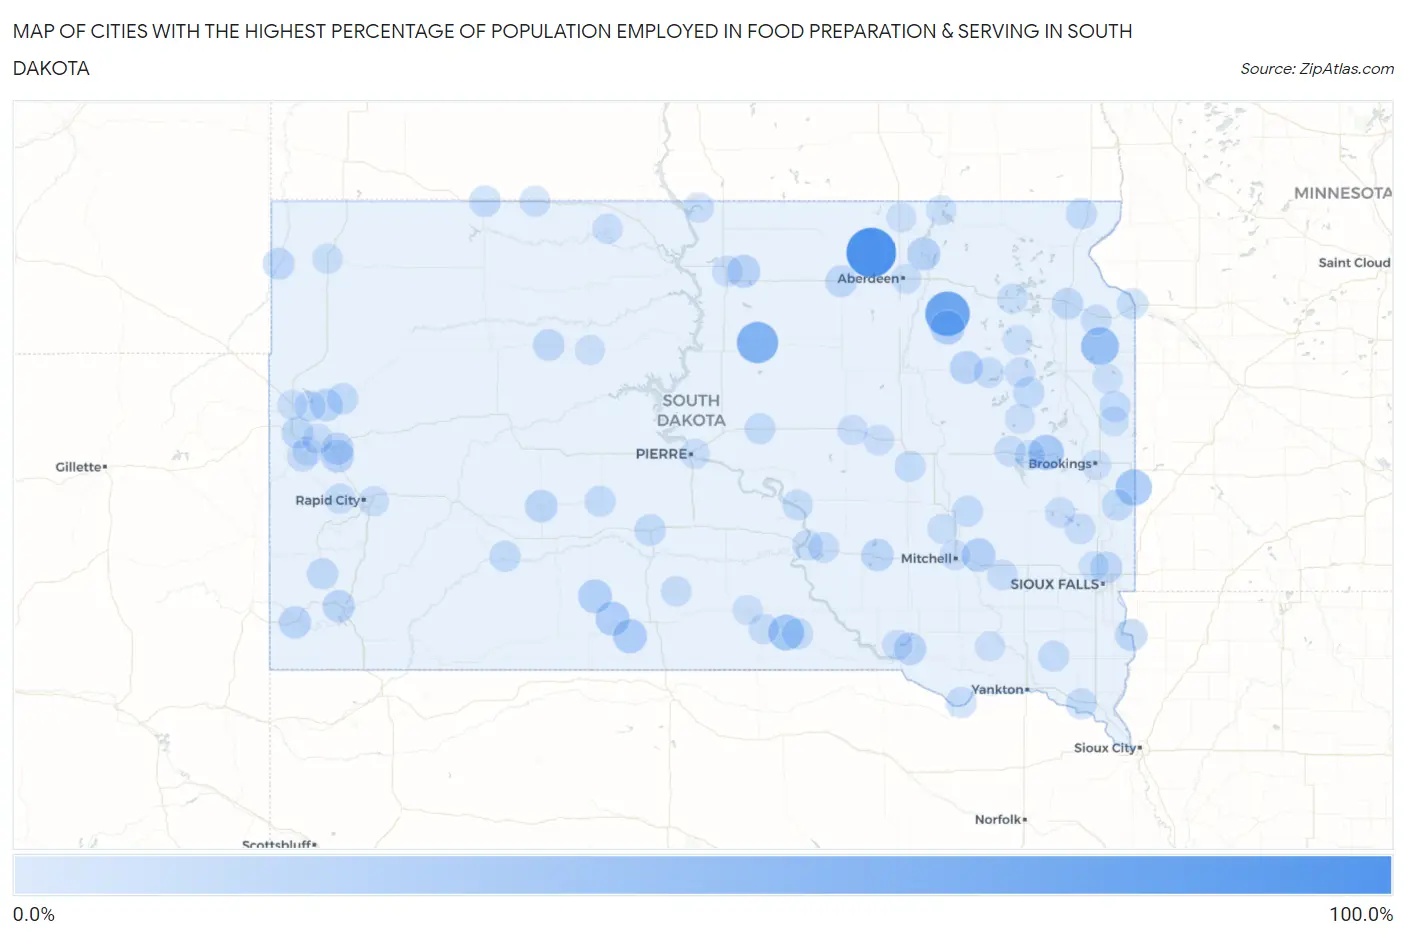
Map of Cities with the Highest Percentage of Population Employed in Food Preparation & Serving in South Dakota
0.0%
100.0%
Cities with the Highest Percentage of Population Employed in Food Preparation & Serving in South Dakota
| City | % Employed | vs State | vs National | |
| 1. | Wetonka | 100.0% | 5.7%(+94.3)#1 | 5.3%(+94.7)#30 |
| 2. | Horse Creek | 78.6% | 5.7%(+72.9)#2 | 5.3%(+73.3)#42 |
| 3. | Verdon | 75.0% | 5.7%(+69.3)#3 | 5.3%(+69.7)#50 |
| 4. | Lebanon | 59.6% | 5.7%(+53.9)#4 | 5.3%(+54.3)#74 |
| 5. | Strandburg | 42.9% | 5.7%(+37.2)#5 | 5.3%(+37.6)#160 |
| 6. | Ward | 35.0% | 5.7%(+29.3)#6 | 5.3%(+29.7)#255 |
| 7. | Grassland Colony | 33.3% | 5.7%(+27.7)#7 | 5.3%(+28.0)#282 |
| 8. | Dallas | 32.8% | 5.7%(+27.1)#8 | 5.3%(+27.5)#286 |
| 9. | Hetland | 31.2% | 5.7%(+25.6)#9 | 5.3%(+26.0)#314 |
| 10. | Golden View Colony | 26.9% | 5.7%(+21.3)#10 | 5.3%(+21.6)#433 |
| 11. | Conde | 26.0% | 5.7%(+20.3)#11 | 5.3%(+20.7)#472 |
| 12. | Parmelee | 25.0% | 5.7%(+19.3)#12 | 5.3%(+19.7)#500 |
| 13. | Two Strike | 25.0% | 5.7%(+19.3)#13 | 5.3%(+19.7)#501 |
| 14. | Norris | 23.5% | 5.7%(+17.9)#14 | 5.3%(+18.2)#578 |
| 15. | Fulton | 22.5% | 5.7%(+16.8)#15 | 5.3%(+17.2)#642 |
| 16. | Columbia | 20.6% | 5.7%(+15.0)#16 | 5.3%(+15.3)#775 |
| 17. | Java | 20.2% | 5.7%(+14.6)#17 | 5.3%(+15.0)#813 |
| 18. | Raymond | 20.0% | 5.7%(+14.3)#18 | 5.3%(+14.7)#850 |
| 19. | Blucksberg Mountain | 19.5% | 5.7%(+13.8)#19 | 5.3%(+14.2)#896 |
| 20. | Philip | 18.3% | 5.7%(+12.7)#20 | 5.3%(+13.1)#1,024 |
| 21. | Ravinia | 18.2% | 5.7%(+12.5)#21 | 5.3%(+12.9)#1,046 |
| 22. | Nisland | 17.9% | 5.7%(+12.2)#22 | 5.3%(+12.6)#1,088 |
| 23. | Sturgis | 17.7% | 5.7%(+12.1)#23 | 5.3%(+12.4)#1,098 |
| 24. | White Lake | 17.5% | 5.7%(+11.9)#24 | 5.3%(+12.2)#1,131 |
| 25. | Edgemont | 17.2% | 5.7%(+11.6)#25 | 5.3%(+11.9)#1,176 |
| 26. | Stephan | 17.1% | 5.7%(+11.5)#26 | 5.3%(+11.9)#1,188 |
| 27. | Hot Springs | 17.0% | 5.7%(+11.3)#27 | 5.3%(+11.7)#1,211 |
| 28. | Enemy Swim | 16.3% | 5.7%(+10.7)#28 | 5.3%(+11.0)#1,326 |
| 29. | Fairview | 16.1% | 5.7%(+10.4)#29 | 5.3%(+10.8)#1,395 |
| 30. | Ipswich | 15.3% | 5.7%(+9.67)#30 | 5.3%(+10.0)#1,550 |
| 31. | Camp Crook | 15.0% | 5.7%(+9.34)#31 | 5.3%(+9.71)#1,635 |
| 32. | Spearfish | 14.9% | 5.7%(+9.22)#32 | 5.3%(+9.60)#1,668 |
| 33. | Dupree | 14.7% | 5.7%(+9.00)#33 | 5.3%(+9.37)#1,717 |
| 34. | Renner Corner | 14.6% | 5.7%(+8.90)#34 | 5.3%(+9.28)#1,751 |
| 35. | Summit | 14.2% | 5.7%(+8.54)#35 | 5.3%(+8.91)#1,859 |
| 36. | Murdo | 13.9% | 5.7%(+8.22)#36 | 5.3%(+8.59)#1,949 |
| 37. | Mountain Plains | 13.4% | 5.7%(+7.75)#37 | 5.3%(+8.13)#2,101 |
| 38. | Lemmon | 13.2% | 5.7%(+7.55)#38 | 5.3%(+7.93)#2,173 |
| 39. | Newell | 13.2% | 5.7%(+7.53)#39 | 5.3%(+7.90)#2,190 |
| 40. | Flandreau | 12.9% | 5.7%(+7.29)#40 | 5.3%(+7.66)#2,277 |
| 41. | Pringle | 12.9% | 5.7%(+7.24)#41 | 5.3%(+7.62)#2,293 |
| 42. | Hazel | 12.9% | 5.7%(+7.24)#42 | 5.3%(+7.62)#2,296 |
| 43. | Millerdale Colony | 12.5% | 5.7%(+6.84)#43 | 5.3%(+7.21)#2,508 |
| 44. | Interior | 12.5% | 5.7%(+6.84)#44 | 5.3%(+7.21)#2,515 |
| 45. | Virgil | 12.5% | 5.7%(+6.84)#45 | 5.3%(+7.21)#2,523 |
| 46. | Fruitdale | 12.2% | 5.7%(+6.53)#46 | 5.3%(+6.91)#2,650 |
| 47. | Running Water | 12.0% | 5.7%(+6.34)#47 | 5.3%(+6.71)#2,765 |
| 48. | Gregory | 11.9% | 5.7%(+6.28)#48 | 5.3%(+6.66)#2,798 |
| 49. | New Effington | 11.8% | 5.7%(+6.10)#49 | 5.3%(+6.48)#2,893 |
| 50. | Big Stone City | 11.7% | 5.7%(+6.09)#50 | 5.3%(+6.46)#2,908 |
| 51. | Vermillion | 11.7% | 5.7%(+6.07)#51 | 5.3%(+6.44)#2,921 |
| 52. | Brandt | 11.7% | 5.7%(+6.01)#52 | 5.3%(+6.38)#2,964 |
| 53. | Irene | 11.6% | 5.7%(+5.91)#53 | 5.3%(+6.28)#3,029 |
| 54. | Artesian | 11.5% | 5.7%(+5.88)#54 | 5.3%(+6.25)#3,048 |
| 55. | Harrold | 11.3% | 5.7%(+5.66)#55 | 5.3%(+6.03)#3,186 |
| 56. | Midland | 11.3% | 5.7%(+5.61)#56 | 5.3%(+5.98)#3,219 |
| 57. | Morristown | 10.8% | 5.7%(+5.15)#57 | 5.3%(+5.52)#3,511 |
| 58. | Twin Brooks | 10.5% | 5.7%(+4.87)#58 | 5.3%(+5.24)#3,707 |
| 59. | Pukwana | 10.4% | 5.7%(+4.78)#59 | 5.3%(+5.15)#3,769 |
| 60. | Selby | 10.4% | 5.7%(+4.71)#60 | 5.3%(+5.09)#3,812 |
| 61. | Clark | 10.3% | 5.7%(+4.68)#61 | 5.3%(+5.06)#3,833 |
| 62. | Chester | 10.3% | 5.7%(+4.66)#62 | 5.3%(+5.03)#3,855 |
| 63. | De Smet | 9.9% | 5.7%(+4.28)#63 | 5.3%(+4.66)#4,154 |
| 64. | Emery | 9.8% | 5.7%(+4.16)#64 | 5.3%(+4.53)#4,250 |
| 65. | Chamberlain | 9.8% | 5.7%(+4.09)#65 | 5.3%(+4.47)#4,312 |
| 66. | Johnson Siding | 9.7% | 5.7%(+4.03)#66 | 5.3%(+4.40)#4,363 |
| 67. | Lead | 9.7% | 5.7%(+4.00)#67 | 5.3%(+4.38)#4,380 |
| 68. | Colome | 9.6% | 5.7%(+3.92)#68 | 5.3%(+4.29)#4,462 |
| 69. | Wood | 9.5% | 5.7%(+3.86)#69 | 5.3%(+4.24)#4,519 |
| 70. | Fort Thompson | 9.5% | 5.7%(+3.83)#70 | 5.3%(+4.21)#4,542 |
| 71. | Henry | 9.4% | 5.7%(+3.71)#71 | 5.3%(+4.09)#4,664 |
| 72. | Bullhead | 9.3% | 5.7%(+3.64)#72 | 5.3%(+4.02)#4,744 |
| 73. | Wessington | 9.2% | 5.7%(+3.51)#73 | 5.3%(+3.89)#4,863 |
| 74. | Pollock | 9.2% | 5.7%(+3.49)#74 | 5.3%(+3.87)#4,884 |
| 75. | St Lawrence | 8.8% | 5.7%(+3.11)#75 | 5.3%(+3.49)#5,346 |
| 76. | Whitewood | 8.4% | 5.7%(+2.72)#76 | 5.3%(+3.09)#5,810 |
| 77. | Webster | 8.3% | 5.7%(+2.67)#77 | 5.3%(+3.05)#5,857 |
| 78. | Lake Andes | 8.3% | 5.7%(+2.67)#78 | 5.3%(+3.05)#5,861 |
| 79. | Buffalo | 8.3% | 5.7%(+2.67)#79 | 5.3%(+3.05)#5,872 |
| 80. | Lake Preston | 8.3% | 5.7%(+2.64)#80 | 5.3%(+3.01)#5,936 |
| 81. | Madison | 8.2% | 5.7%(+2.54)#81 | 5.3%(+2.92)#6,050 |
| 82. | Mitchell | 8.2% | 5.7%(+2.49)#82 | 5.3%(+2.87)#6,134 |
| 83. | Letcher | 8.1% | 5.7%(+2.48)#83 | 5.3%(+2.85)#6,153 |
| 84. | Rapid Valley | 8.1% | 5.7%(+2.43)#84 | 5.3%(+2.81)#6,209 |
| 85. | Aberdeen | 8.0% | 5.7%(+2.35)#85 | 5.3%(+2.72)#6,318 |
| 86. | Toronto | 7.9% | 5.7%(+2.25)#86 | 5.3%(+2.63)#6,468 |
| 87. | Deadwood | 7.9% | 5.7%(+2.24)#87 | 5.3%(+2.62)#6,481 |
| 88. | Winner | 7.9% | 5.7%(+2.20)#88 | 5.3%(+2.58)#6,552 |
| 89. | Belle Fourche | 7.6% | 5.7%(+1.90)#89 | 5.3%(+2.27)#7,053 |
| 90. | North Eagle Butte | 7.6% | 5.7%(+1.89)#90 | 5.3%(+2.26)#7,059 |
| 91. | Frederick | 7.5% | 5.7%(+1.89)#91 | 5.3%(+2.26)#7,066 |
| 92. | Scotland | 7.5% | 5.7%(+1.85)#92 | 5.3%(+2.22)#7,120 |
| 93. | Bryant | 7.4% | 5.7%(+1.70)#93 | 5.3%(+2.08)#7,340 |
| 94. | Hecla | 7.2% | 5.7%(+1.59)#94 | 5.3%(+1.96)#7,529 |
| 95. | Crooks | 7.2% | 5.7%(+1.57)#95 | 5.3%(+1.95)#7,558 |
| 96. | Brookings | 7.2% | 5.7%(+1.54)#96 | 5.3%(+1.92)#7,612 |
| 97. | Mina | 7.1% | 5.7%(+1.48)#97 | 5.3%(+1.86)#7,715 |
| 98. | Wallace | 7.1% | 5.7%(+1.48)#98 | 5.3%(+1.86)#7,746 |
| 99. | Altamont | 7.1% | 5.7%(+1.48)#99 | 5.3%(+1.86)#7,750 |
| 100. | Pierre | 7.1% | 5.7%(+1.47)#100 | 5.3%(+1.84)#7,767 |
Common Questions
What are the Top 10 Cities with the Highest Percentage of Population Employed in Food Preparation & Serving in South Dakota?
Top 10 Cities with the Highest Percentage of Population Employed in Food Preparation & Serving in South Dakota are:
#1
100.0%
#2
75.0%
#3
59.6%
#4
42.9%
#5
35.0%
#6
32.8%
#7
31.2%
#8
26.0%
#9
25.0%
#10
25.0%
What city has the Highest Percentage of Population Employed in Food Preparation & Serving in South Dakota?
Wetonka has the Highest Percentage of Population Employed in Food Preparation & Serving in South Dakota with 100.0%.
What is the Percentage of Population Employed in Food Preparation & Serving in the State of South Dakota?
Percentage of Population Employed in Food Preparation & Serving in South Dakota is 5.7%.
What is the Percentage of Population Employed in Food Preparation & Serving in the United States?
Percentage of Population Employed in Food Preparation & Serving in the United States is 5.3%.