Zip Codes with the Highest Percentage of Population Employed in Food Preparation & Serving in Duarte, CA
RELATED REPORTS & OPTIONS
Food Preparation & Serving
Duarte
Compare Zip Codes
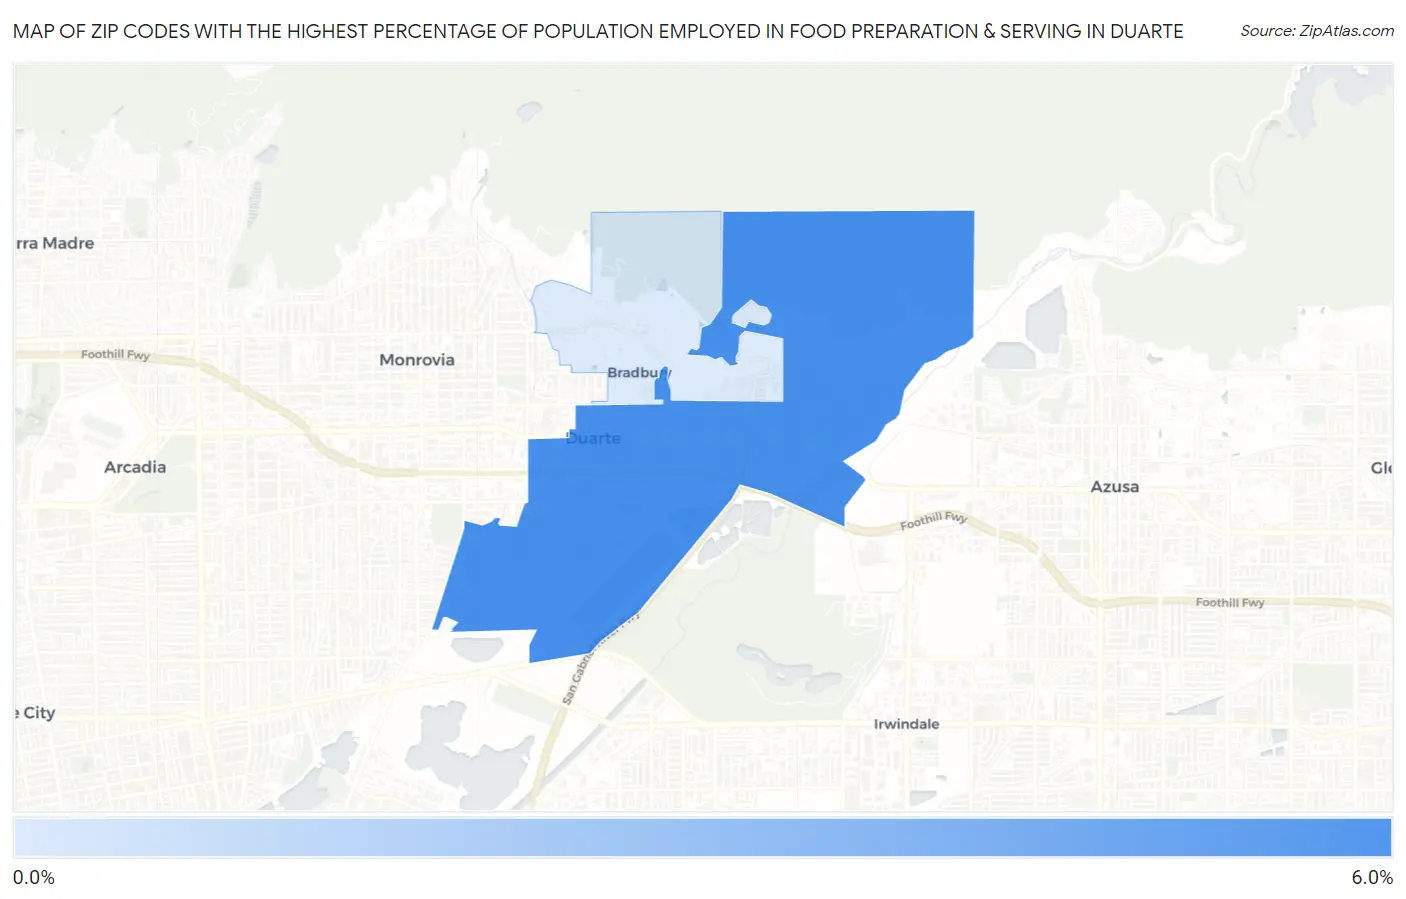
Map of Zip Codes with the Highest Percentage of Population Employed in Food Preparation & Serving in Duarte
0.28%
5.1%
Zip Codes with the Highest Percentage of Population Employed in Food Preparation & Serving in Duarte, CA
| Zip Code | % Employed | vs State | vs National | |
| 1. | 91010 | 5.1% | 5.4%(-0.283)#756 | 5.3%(-0.186)#12,545 |
| 2. | 91008 | 0.28% | 5.4%(-5.10)#1,500 | 5.3%(-5.01)#27,854 |
1
Common Questions
What are the Top Zip Codes with the Highest Percentage of Population Employed in Food Preparation & Serving in Duarte, CA?
Top Zip Codes with the Highest Percentage of Population Employed in Food Preparation & Serving in Duarte, CA are:
What zip code has the Highest Percentage of Population Employed in Food Preparation & Serving in Duarte, CA?
91010 has the Highest Percentage of Population Employed in Food Preparation & Serving in Duarte, CA with 5.1%.
What is the Percentage of Population Employed in Food Preparation & Serving in Duarte, CA?
Percentage of Population Employed in Food Preparation & Serving in Duarte is 4.7%.
What is the Percentage of Population Employed in Food Preparation & Serving in California?
Percentage of Population Employed in Food Preparation & Serving in California is 5.4%.
What is the Percentage of Population Employed in Food Preparation & Serving in the United States?
Percentage of Population Employed in Food Preparation & Serving in the United States is 5.3%.