Buena Vista, CA Map & Demographics
Buena Vista Map
Buena Vista Overview
$31,814
PER CAPITA INCOME
$83,641
AVG FAMILY INCOME
$65,259
AVG HOUSEHOLD INCOME
0.30
INEQUALITY / GINI INDEX
713
TOTAL POPULATION
231
MALE POPULATION
482
FEMALE POPULATION
47.93
MALES / 100 FEMALES
208.66
FEMALES / 100 MALES
34.4
MEDIAN AGE
3.6
AVG FAMILY SIZE
2.9
AVG HOUSEHOLD SIZE
375
LABOR FORCE [ PEOPLE ]
61.4%
PERCENT IN LABOR FORCE
7.5%
UNEMPLOYMENT RATE
Income in Buena Vista
Income Overview in Buena Vista
Per Capita Income in Buena Vista is $31,814, while median incomes of families and households are $83,641 and $65,259 respectively.
| Characteristic | Number | Measure |
| Per Capita Income | 713 | $31,814 |
| Median Family Income | 153 | $83,641 |
| Mean Family Income | 153 | $77,817 |
| Median Household Income | 246 | $65,259 |
| Mean Household Income | 246 | $68,327 |
| Income Deficit | 153 | $0 |
| Wage / Income Gap (%) | 713 | 0.00% |
| Wage / Income Gap ($) | 713 | 100.00¢ per $1 |
| Gini / Inequality Index | 713 | 0.30 |
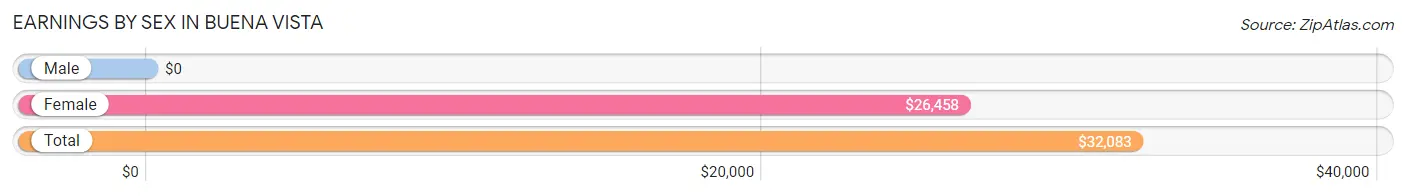
Earnings by Sex in Buena Vista
| Sex | Number | Average Earnings |
| Male | 175 (44.0%) | $0 |
| Female | 223 (56.0%) | $26,458 |
| Total | 398 (100.0%) | $32,083 |
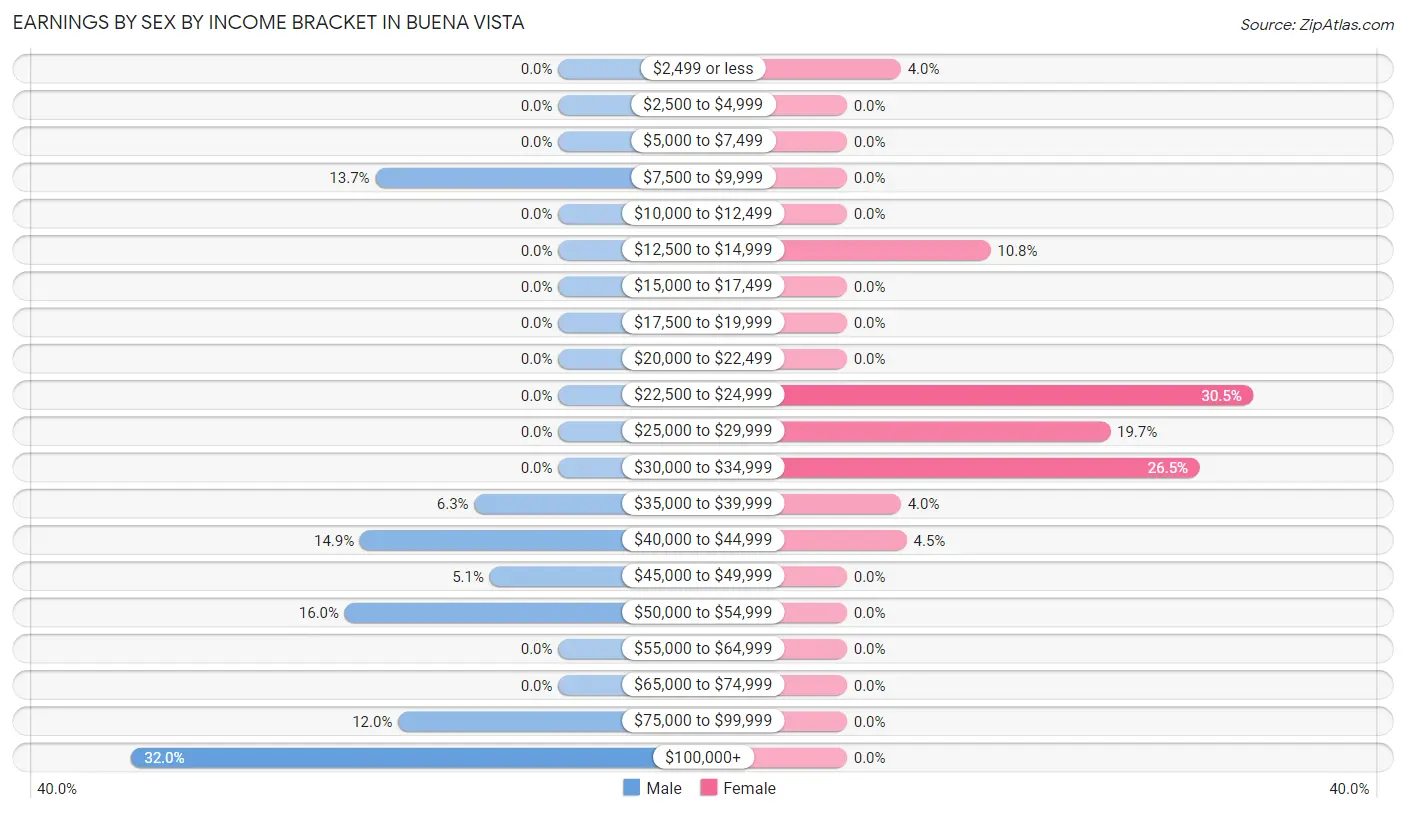
Earnings by Sex by Income Bracket in Buena Vista
The most common earnings brackets in Buena Vista are $100,000+ for men (56 | 32.0%) and $22,500 to $24,999 for women (68 | 30.5%).
| Income | Male | Female |
| $2,499 or less | 0 (0.0%) | 9 (4.0%) |
| $2,500 to $4,999 | 0 (0.0%) | 0 (0.0%) |
| $5,000 to $7,499 | 0 (0.0%) | 0 (0.0%) |
| $7,500 to $9,999 | 24 (13.7%) | 0 (0.0%) |
| $10,000 to $12,499 | 0 (0.0%) | 0 (0.0%) |
| $12,500 to $14,999 | 0 (0.0%) | 24 (10.8%) |
| $15,000 to $17,499 | 0 (0.0%) | 0 (0.0%) |
| $17,500 to $19,999 | 0 (0.0%) | 0 (0.0%) |
| $20,000 to $22,499 | 0 (0.0%) | 0 (0.0%) |
| $22,500 to $24,999 | 0 (0.0%) | 68 (30.5%) |
| $25,000 to $29,999 | 0 (0.0%) | 44 (19.7%) |
| $30,000 to $34,999 | 0 (0.0%) | 59 (26.5%) |
| $35,000 to $39,999 | 11 (6.3%) | 9 (4.0%) |
| $40,000 to $44,999 | 26 (14.9%) | 10 (4.5%) |
| $45,000 to $49,999 | 9 (5.1%) | 0 (0.0%) |
| $50,000 to $54,999 | 28 (16.0%) | 0 (0.0%) |
| $55,000 to $64,999 | 0 (0.0%) | 0 (0.0%) |
| $65,000 to $74,999 | 0 (0.0%) | 0 (0.0%) |
| $75,000 to $99,999 | 21 (12.0%) | 0 (0.0%) |
| $100,000+ | 56 (32.0%) | 0 (0.0%) |
| Total | 175 (100.0%) | 223 (100.0%) |
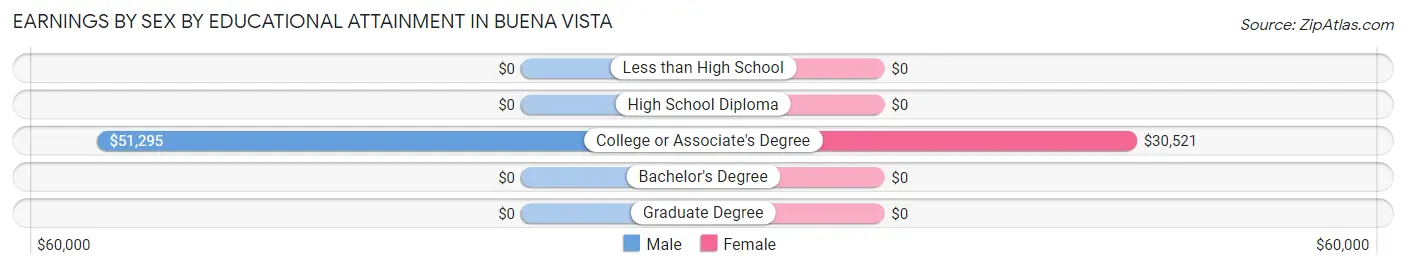
Earnings by Sex by Educational Attainment in Buena Vista
| Educational Attainment | Male Income | Female Income |
| Less than High School | - | - |
| High School Diploma | - | - |
| College or Associate's Degree | $51,295 | $30,521 |
| Bachelor's Degree | - | - |
| Graduate Degree | - | - |
| Total | - | - |
Family Income in Buena Vista
Family Income Brackets in Buena Vista
According to the Buena Vista family income data, there are 53 families falling into the $75,000 to $99,999 income range, which is the most common income bracket and makes up 34.6% of all families.
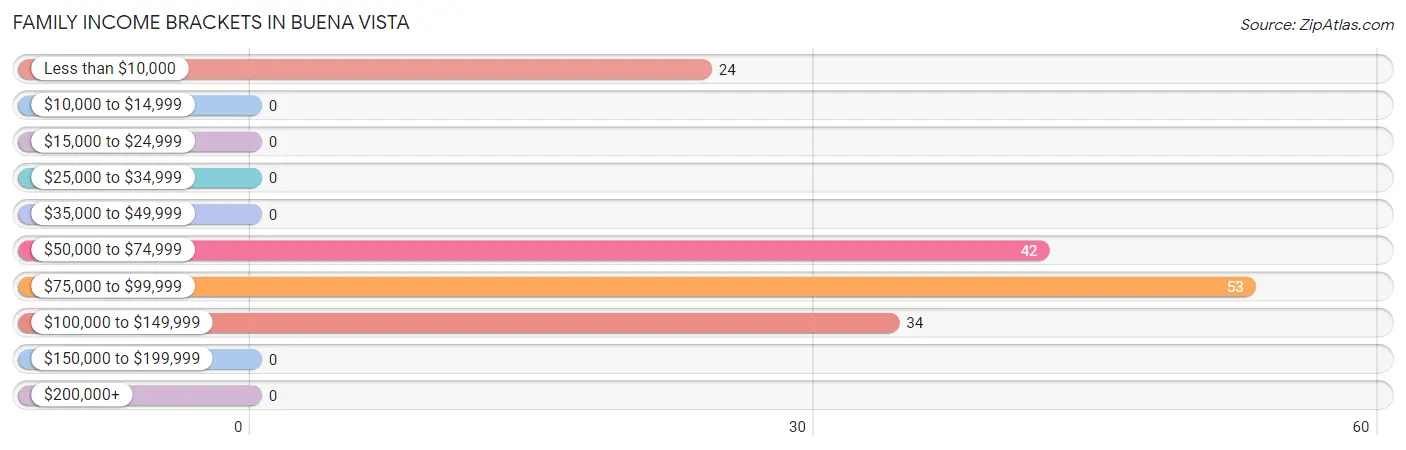
| Income Bracket | # Families | % Families |
| Less than $10,000 | 24 | 15.7% |
| $10,000 to $14,999 | 0 | 0.0% |
| $15,000 to $24,999 | 0 | 0.0% |
| $25,000 to $34,999 | 0 | 0.0% |
| $35,000 to $49,999 | 0 | 0.0% |
| $50,000 to $74,999 | 42 | 27.5% |
| $75,000 to $99,999 | 53 | 34.6% |
| $100,000 to $149,999 | 34 | 22.2% |
| $150,000 to $199,999 | 0 | 0.0% |
| $200,000+ | 0 | 0.0% |
Family Income by Famaliy Size in Buena Vista
3-person families (50 | 32.7%) account for the highest median family income in Buena Vista with $83,261 per family, while 3-person families (50 | 32.7%) have the highest median income of $27,754 per family member.
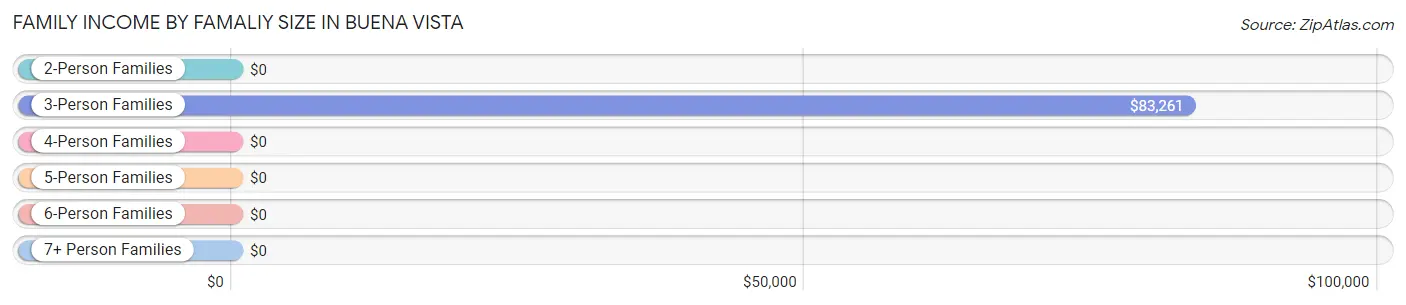
| Income Bracket | # Families | Median Income |
| 2-Person Families | 64 (41.8%) | $0 |
| 3-Person Families | 50 (32.7%) | $83,261 |
| 4-Person Families | 39 (25.5%) | $0 |
| 5-Person Families | 0 (0.0%) | $0 |
| 6-Person Families | 0 (0.0%) | $0 |
| 7+ Person Families | 0 (0.0%) | $0 |
| Total | 153 (100.0%) | $83,641 |
Family Income by Number of Earners in Buena Vista
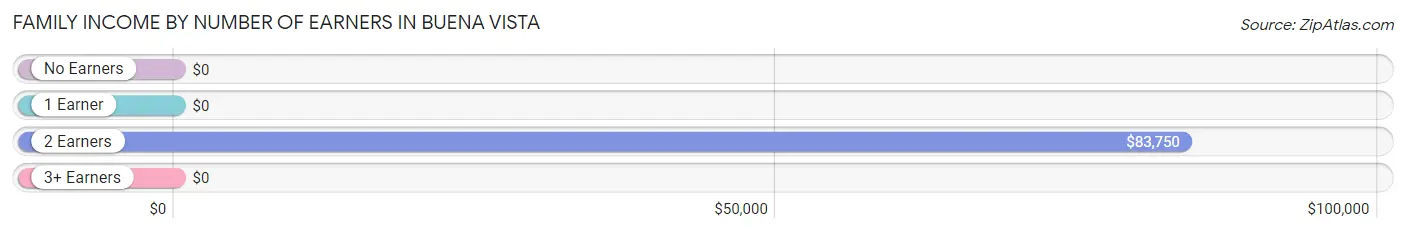
| Number of Earners | # Families | Median Income |
| No Earners | 0 (0.0%) | $0 |
| 1 Earner | 85 (55.6%) | $0 |
| 2 Earners | 59 (38.6%) | $83,750 |
| 3+ Earners | 9 (5.9%) | $0 |
| Total | 153 (100.0%) | $83,641 |
Household Income in Buena Vista
Household Income Brackets in Buena Vista
With 97 households falling in the category, the $50,000 to $74,999 income range is the most frequent in Buena Vista, accounting for 39.4% of all households.
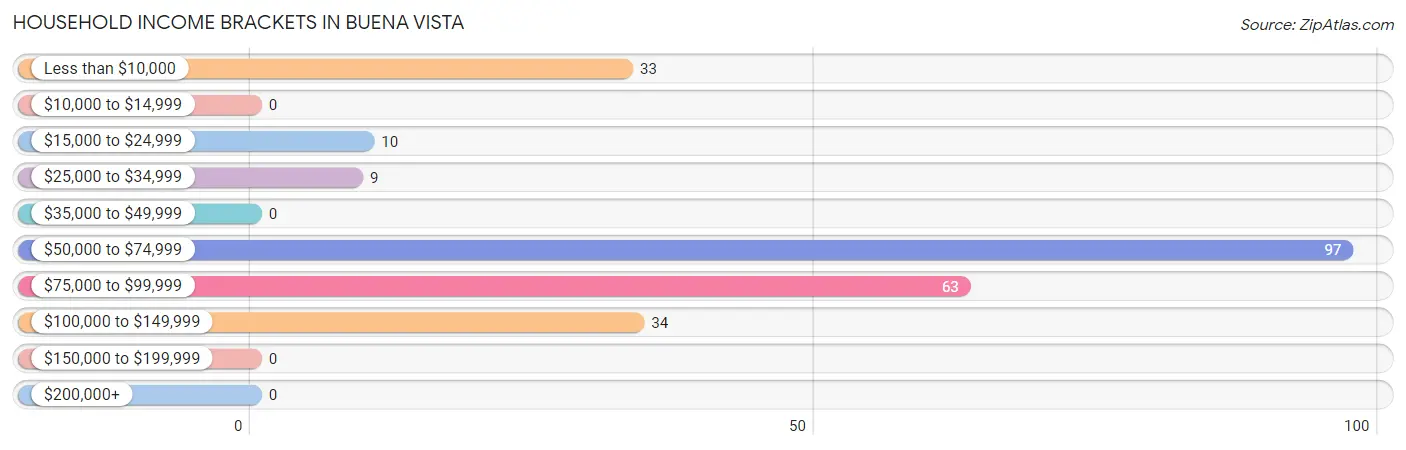
| Income Bracket | # Households | % Households |
| Less than $10,000 | 33 | 13.4% |
| $10,000 to $14,999 | 0 | 0.0% |
| $15,000 to $24,999 | 10 | 4.1% |
| $25,000 to $34,999 | 9 | 3.7% |
| $35,000 to $49,999 | 0 | 0.0% |
| $50,000 to $74,999 | 97 | 39.4% |
| $75,000 to $99,999 | 63 | 25.6% |
| $100,000 to $149,999 | 34 | 13.8% |
| $150,000 to $199,999 | 0 | 0.0% |
| $200,000+ | 0 | 0.0% |
Household Income by Householder Age in Buena Vista
The median household income in Buena Vista is $65,259, with the highest median household income of $97,917 found in the 45 to 64 years age bracket for the primary householder. A total of 71 households (28.9%) fall into this category. Meanwhile, the 15 to 24 years age bracket for the primary householder has the lowest median household income of $0, with 26 households (10.6%) in this group.
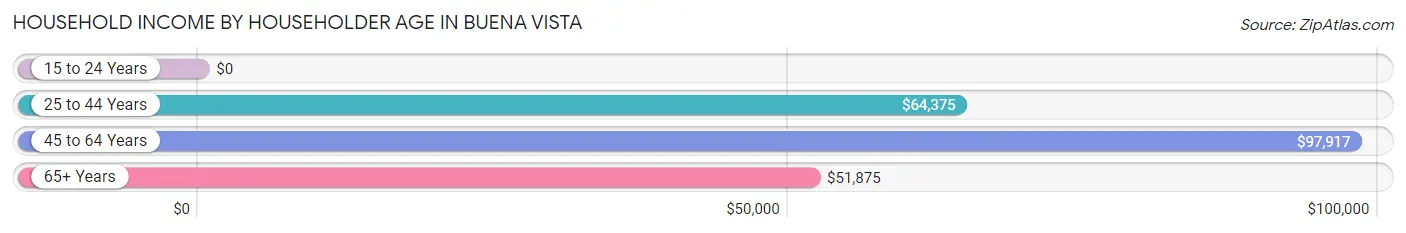
| Income Bracket | # Households | Median Income |
| 15 to 24 Years | 26 (10.6%) | $0 |
| 25 to 44 Years | 27 (11.0%) | $64,375 |
| 45 to 64 Years | 71 (28.9%) | $97,917 |
| 65+ Years | 122 (49.6%) | $51,875 |
| Total | 246 (100.0%) | $65,259 |
Poverty in Buena Vista
Income Below Poverty by Sex and Age in Buena Vista
With 14.3% poverty level for males and 14.7% for females among the residents of Buena Vista, 65 to 74 year old males and 45 to 54 year old females are the most vulnerable to poverty, with 24 males (45.3%) and 28 females (36.4%) in their respective age groups living below the poverty level.
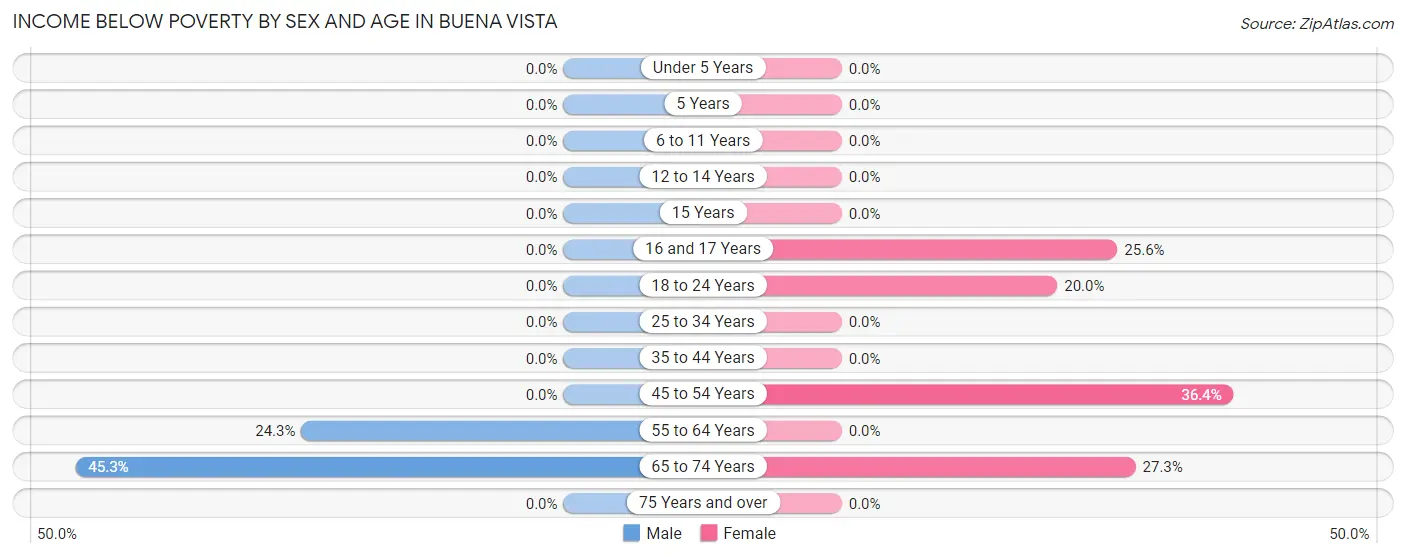
| Age Bracket | Male | Female |
| Under 5 Years | 0 (0.0%) | 0 (0.0%) |
| 5 Years | 0 (0.0%) | 0 (0.0%) |
| 6 to 11 Years | 0 (0.0%) | 0 (0.0%) |
| 12 to 14 Years | 0 (0.0%) | 0 (0.0%) |
| 15 Years | 0 (0.0%) | 0 (0.0%) |
| 16 and 17 Years | 0 (0.0%) | 22 (25.6%) |
| 18 to 24 Years | 0 (0.0%) | 9 (20.0%) |
| 25 to 34 Years | 0 (0.0%) | 0 (0.0%) |
| 35 to 44 Years | 0 (0.0%) | 0 (0.0%) |
| 45 to 54 Years | 0 (0.0%) | 28 (36.4%) |
| 55 to 64 Years | 9 (24.3%) | 0 (0.0%) |
| 65 to 74 Years | 24 (45.3%) | 9 (27.3%) |
| 75 Years and over | 0 (0.0%) | 0 (0.0%) |
| Total | 33 (14.3%) | 68 (14.7%) |
Income Above Poverty by Sex and Age in Buena Vista
According to the poverty statistics in Buena Vista, males aged under 5 years and females aged under 5 years are the age groups that are most secure financially, with 100.0% of males and 100.0% of females in these age groups living above the poverty line.
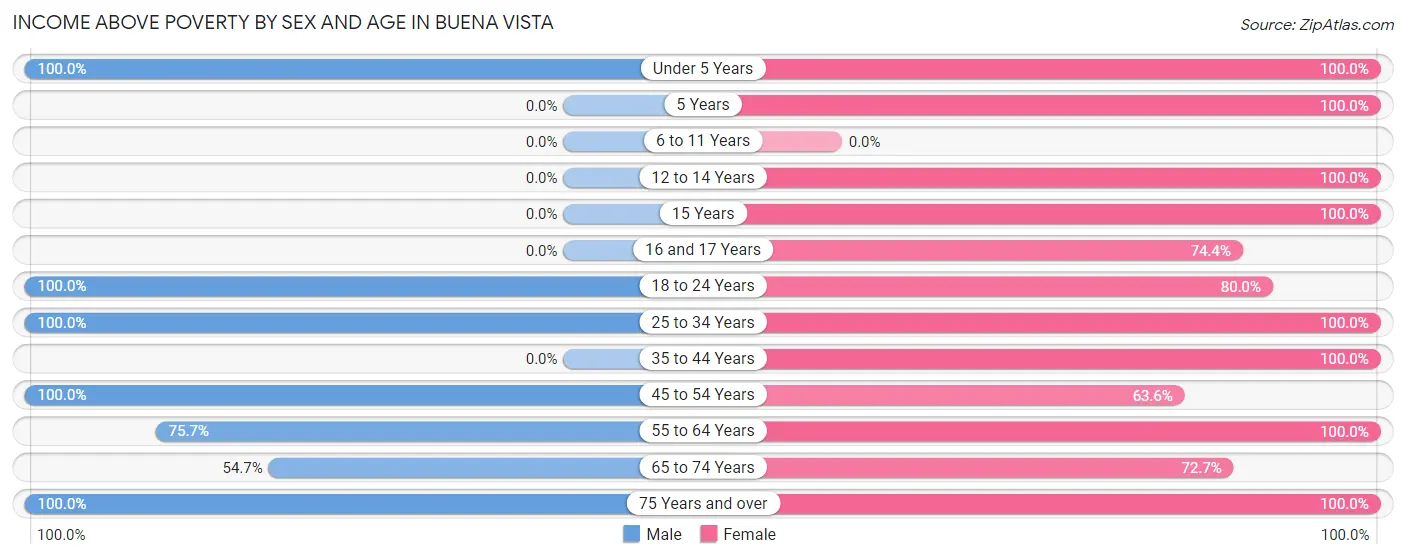
| Age Bracket | Male | Female |
| Under 5 Years | 8 (100.0%) | 24 (100.0%) |
| 5 Years | 0 (0.0%) | 16 (100.0%) |
| 6 to 11 Years | 0 (0.0%) | 0 (0.0%) |
| 12 to 14 Years | 0 (0.0%) | 17 (100.0%) |
| 15 Years | 0 (0.0%) | 16 (100.0%) |
| 16 and 17 Years | 0 (0.0%) | 64 (74.4%) |
| 18 to 24 Years | 26 (100.0%) | 36 (80.0%) |
| 25 to 34 Years | 76 (100.0%) | 44 (100.0%) |
| 35 to 44 Years | 0 (0.0%) | 10 (100.0%) |
| 45 to 54 Years | 21 (100.0%) | 49 (63.6%) |
| 55 to 64 Years | 28 (75.7%) | 67 (100.0%) |
| 65 to 74 Years | 29 (54.7%) | 24 (72.7%) |
| 75 Years and over | 10 (100.0%) | 26 (100.0%) |
| Total | 198 (85.7%) | 393 (85.3%) |
Income Below Poverty Among Married-Couple Families in Buena Vista
The poverty statistics for married-couple families in Buena Vista show that 28.2% or 24 of the total 85 families live below the poverty line. Families with no children have the highest poverty rate of 100.0%, comprising of 24 families. On the other hand, families with 1 or 2 children have the lowest poverty rate of 0.0%, which includes 0 families.
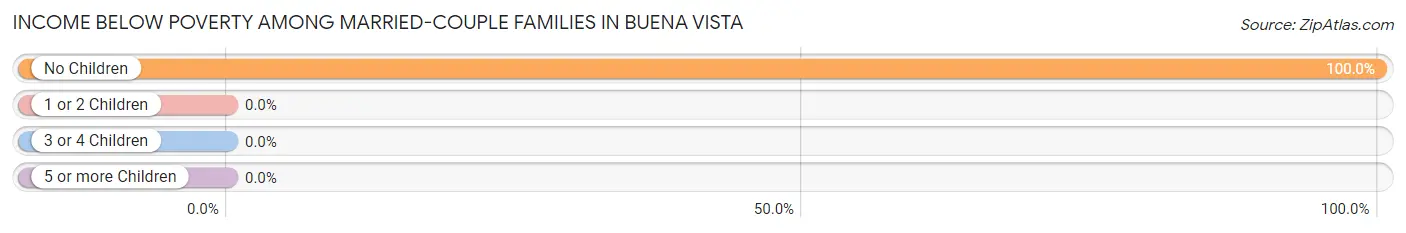
| Children | Above Poverty | Below Poverty |
| No Children | 0 (0.0%) | 24 (100.0%) |
| 1 or 2 Children | 61 (100.0%) | 0 (0.0%) |
| 3 or 4 Children | 0 (0.0%) | 0 (0.0%) |
| 5 or more Children | 0 (0.0%) | 0 (0.0%) |
| Total | 61 (71.8%) | 24 (28.2%) |
Income Below Poverty Among Single-Parent Households in Buena Vista
| Children | Single Father | Single Mother |
| No Children | 0 (0.0%) | 0 (0.0%) |
| 1 or 2 Children | 0 (0.0%) | 0 (0.0%) |
| 3 or 4 Children | 0 (0.0%) | 0 (0.0%) |
| 5 or more Children | 0 (0.0%) | 0 (0.0%) |
| Total | 0 (0.0%) | 0 (0.0%) |
Income Below Poverty Among Married-Couple vs Single-Parent Households in Buena Vista
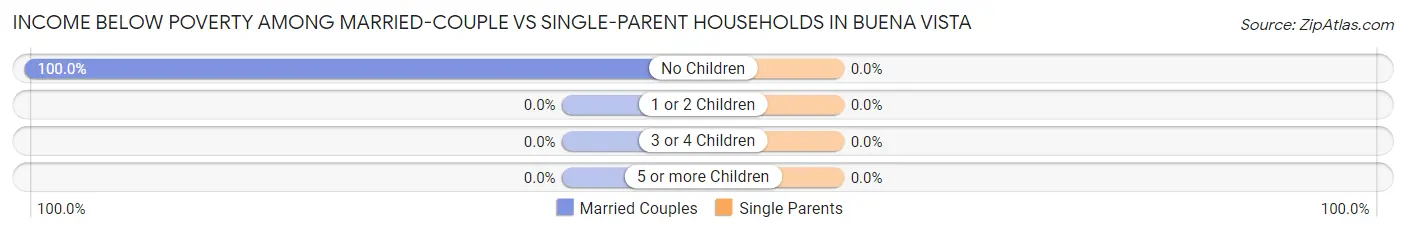
| Children | Married-Couple Families | Single-Parent Households |
| No Children | 24 (100.0%) | 0 (0.0%) |
| 1 or 2 Children | 0 (0.0%) | 0 (0.0%) |
| 3 or 4 Children | 0 (0.0%) | 0 (0.0%) |
| 5 or more Children | 0 (0.0%) | 0 (0.0%) |
| Total | 24 (28.2%) | 0 (0.0%) |
Race in Buena Vista
The most populous races in Buena Vista are White / Caucasian (610 | 85.6%), Hispanic or Latino (70 | 9.8%), and Native / Alaskan (52 | 7.3%).
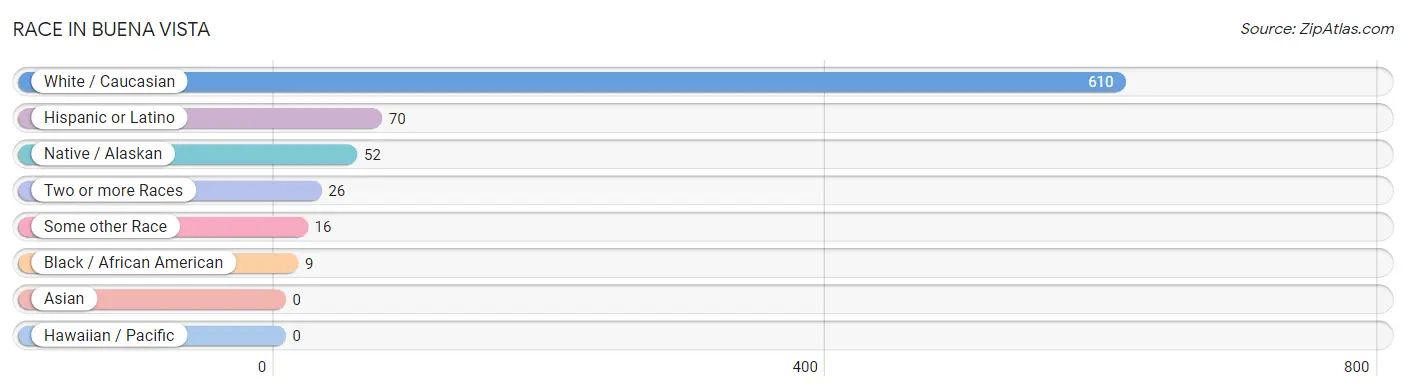
| Race | # Population | % Population |
| Asian | 0 | 0.0% |
| Black / African American | 9 | 1.3% |
| Hawaiian / Pacific | 0 | 0.0% |
| Hispanic or Latino | 70 | 9.8% |
| Native / Alaskan | 52 | 7.3% |
| White / Caucasian | 610 | 85.6% |
| Two or more Races | 26 | 3.6% |
| Some other Race | 16 | 2.2% |
| Total | 713 | 100.0% |
Ancestry in Buena Vista
The most populous ancestries reported in Buena Vista are German (217 | 30.4%), English (139 | 19.5%), Polish (118 | 16.6%), Italian (88 | 12.3%), and Irish (85 | 11.9%), together accounting for 90.7% of all Buena Vista residents.
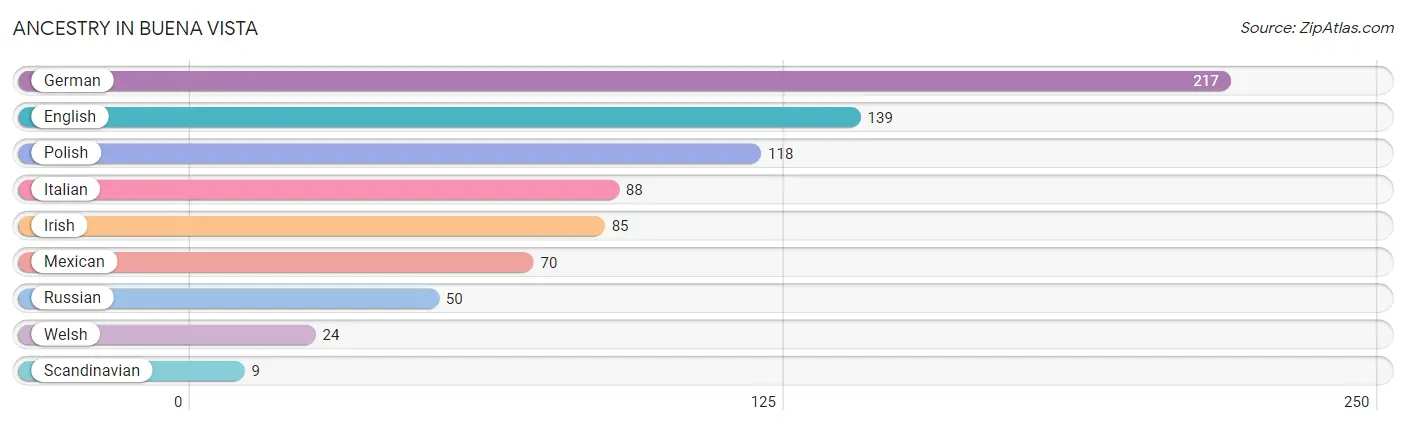
| Ancestry | # Population | % Population |
| English | 139 | 19.5% |
| German | 217 | 30.4% |
| Irish | 85 | 11.9% |
| Italian | 88 | 12.3% |
| Mexican | 70 | 9.8% |
| Polish | 118 | 16.6% |
| Russian | 50 | 7.0% |
| Scandinavian | 9 | 1.3% |
| Welsh | 24 | 3.4% | View All 9 Rows |
Immigrants in Buena Vista
The most numerous immigrant groups reported in Buena Vista came from Central America (44 | 6.2%), Latin America (44 | 6.2%), Mexico (44 | 6.2%), Eastern Europe (40 | 5.6%), and Europe (40 | 5.6%), together accounting for 29.7% of all Buena Vista residents.
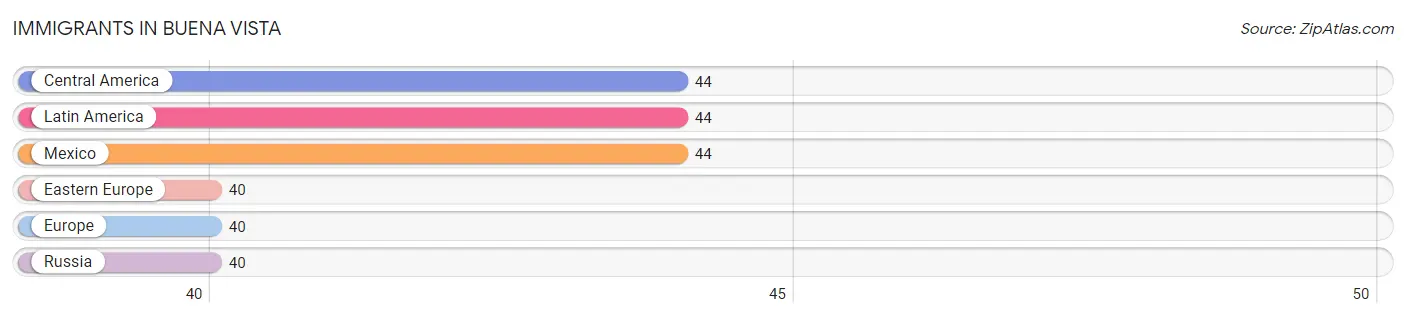
| Immigration Origin | # Population | % Population |
| Central America | 44 | 6.2% |
| Eastern Europe | 40 | 5.6% |
| Europe | 40 | 5.6% |
| Latin America | 44 | 6.2% |
| Mexico | 44 | 6.2% |
| Russia | 40 | 5.6% | View All 6 Rows |
Sex and Age in Buena Vista
Sex and Age in Buena Vista
The most populous age groups in Buena Vista are 25 to 29 Years (67 | 29.0%) for men and 15 to 19 Years (102 | 21.2%) for women.
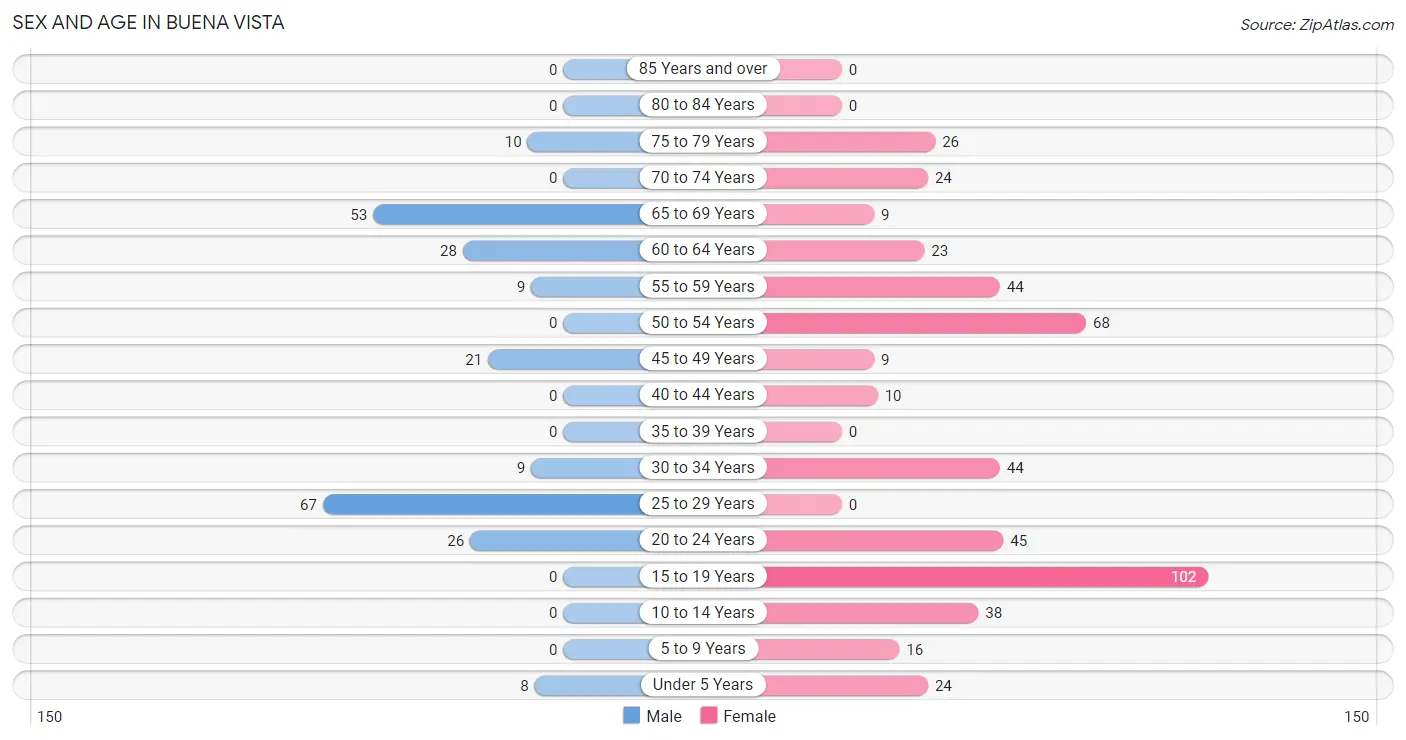
| Age Bracket | Male | Female |
| Under 5 Years | 8 (3.5%) | 24 (5.0%) |
| 5 to 9 Years | 0 (0.0%) | 16 (3.3%) |
| 10 to 14 Years | 0 (0.0%) | 38 (7.9%) |
| 15 to 19 Years | 0 (0.0%) | 102 (21.2%) |
| 20 to 24 Years | 26 (11.3%) | 45 (9.3%) |
| 25 to 29 Years | 67 (29.0%) | 0 (0.0%) |
| 30 to 34 Years | 9 (3.9%) | 44 (9.1%) |
| 35 to 39 Years | 0 (0.0%) | 0 (0.0%) |
| 40 to 44 Years | 0 (0.0%) | 10 (2.1%) |
| 45 to 49 Years | 21 (9.1%) | 9 (1.9%) |
| 50 to 54 Years | 0 (0.0%) | 68 (14.1%) |
| 55 to 59 Years | 9 (3.9%) | 44 (9.1%) |
| 60 to 64 Years | 28 (12.1%) | 23 (4.8%) |
| 65 to 69 Years | 53 (22.9%) | 9 (1.9%) |
| 70 to 74 Years | 0 (0.0%) | 24 (5.0%) |
| 75 to 79 Years | 10 (4.3%) | 26 (5.4%) |
| 80 to 84 Years | 0 (0.0%) | 0 (0.0%) |
| 85 Years and over | 0 (0.0%) | 0 (0.0%) |
| Total | 231 (100.0%) | 482 (100.0%) |
Families and Households in Buena Vista
Median Family Size in Buena Vista
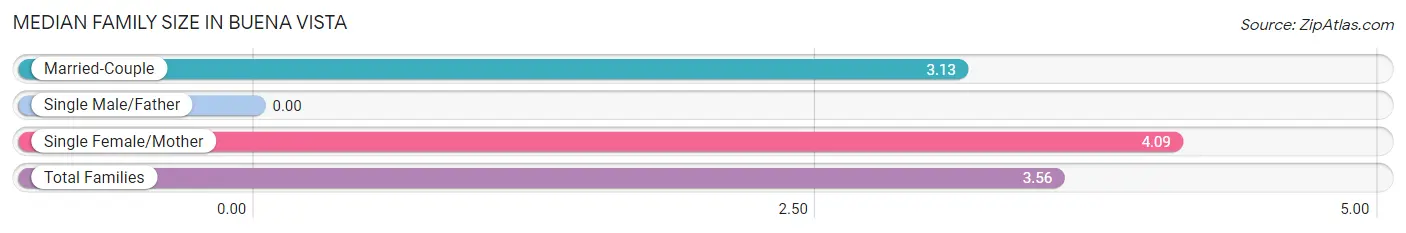
| Family Type | # Families | Family Size |
| Married-Couple | 85 (55.6%) | 3.13 |
| Single Male/Father | 0 (0.0%) | - |
| Single Female/Mother | 68 (44.4%) | 4.09 |
| Total Families | 153 (100.0%) | 3.56 |
Median Household Size in Buena Vista
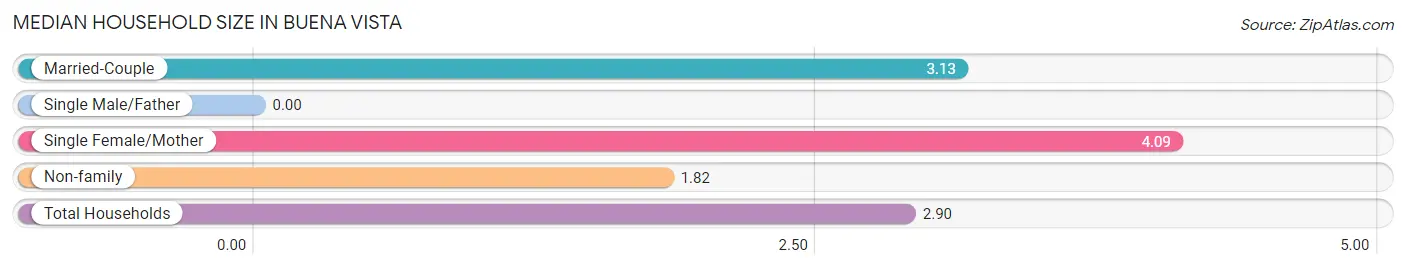
| Household Type | # Households | Household Size |
| Married-Couple | 85 (34.5%) | 3.13 |
| Single Male/Father | 0 (0.0%) | - |
| Single Female/Mother | 68 (27.6%) | 4.09 |
| Non-family | 93 (37.8%) | 1.82 |
| Total Households | 246 (100.0%) | 2.90 |
Household Size by Marriage Status in Buena Vista
Out of a total of 246 households in Buena Vista, 153 (62.2%) are family households, while 93 (37.8%) are nonfamily households. The most numerous type of family households are 2-person households, comprising 64, and the most common type of nonfamily households are 1-person households, comprising 58.
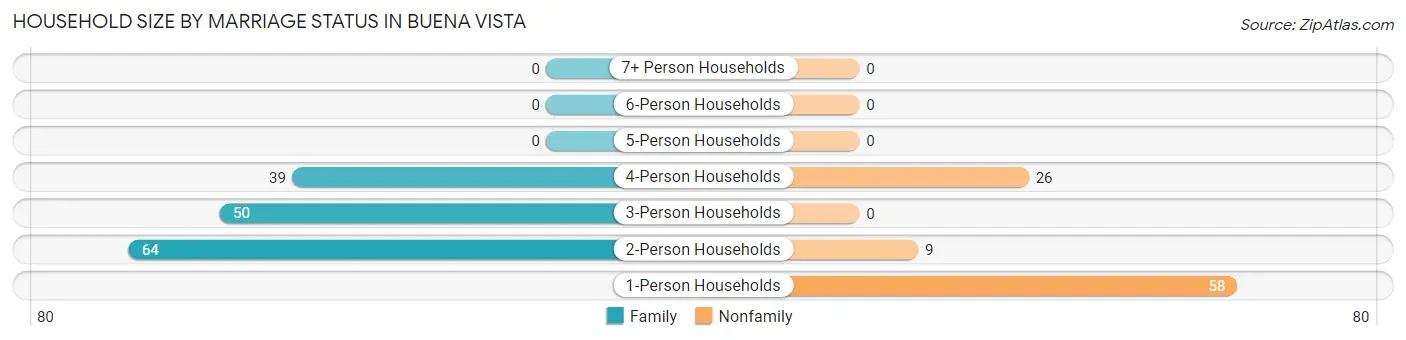
| Household Size | Family Households | Nonfamily Households |
| 1-Person Households | - | 58 (23.6%) |
| 2-Person Households | 64 (26.0%) | 9 (3.7%) |
| 3-Person Households | 50 (20.3%) | 0 (0.0%) |
| 4-Person Households | 39 (15.9%) | 26 (10.6%) |
| 5-Person Households | 0 (0.0%) | 0 (0.0%) |
| 6-Person Households | 0 (0.0%) | 0 (0.0%) |
| 7+ Person Households | 0 (0.0%) | 0 (0.0%) |
| Total | 153 (62.2%) | 93 (37.8%) |
Female Fertility in Buena Vista
Fertility by Age in Buena Vista
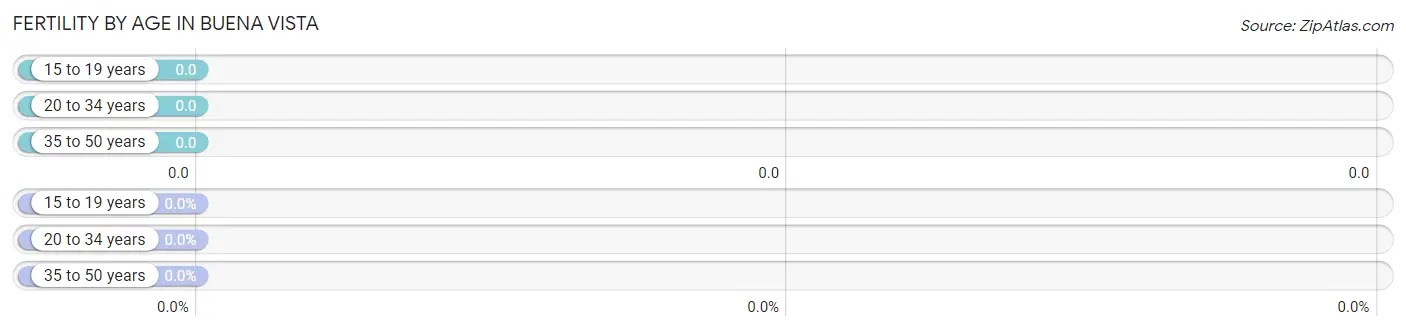
| Age Bracket | Women with Births | Births / 1,000 Women |
| 15 to 19 years | 0 (0.0%) | 0.0 |
| 20 to 34 years | 0 (0.0%) | 0.0 |
| 35 to 50 years | 0 (0.0%) | 0.0 |
| Total | 0 (0.0%) | 0.0 |
Fertility by Age by Marriage Status in Buena Vista
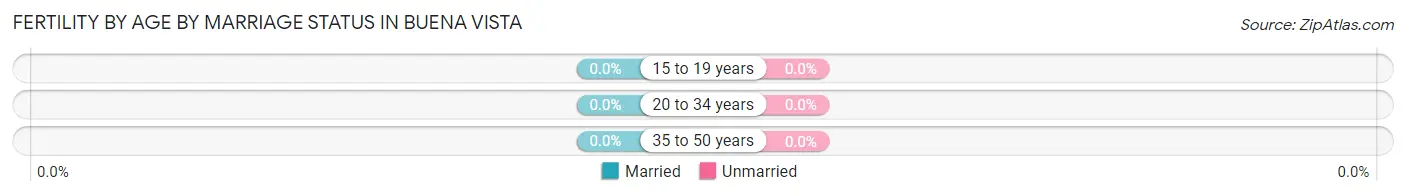
| Age Bracket | Married | Unmarried |
| 15 to 19 years | 0 (0.0%) | 0 (0.0%) |
| 20 to 34 years | 0 (0.0%) | 0 (0.0%) |
| 35 to 50 years | 0 (0.0%) | 0 (0.0%) |
| Total | 0 (0.0%) | 0 (0.0%) |
Fertility by Education in Buena Vista
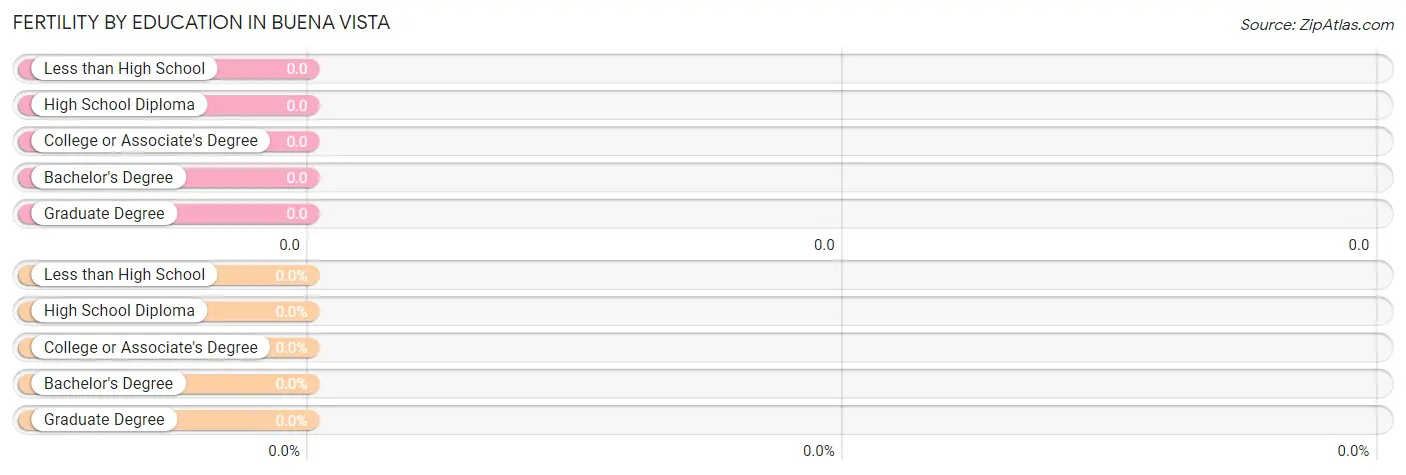
| Educational Attainment | Women with Births | Births / 1,000 Women |
| Less than High School | 0 (0.0%) | 0.0 |
| High School Diploma | 0 (0.0%) | 0.0 |
| College or Associate's Degree | 0 (0.0%) | 0.0 |
| Bachelor's Degree | 0 (0.0%) | 0.0 |
| Graduate Degree | 0 (0.0%) | 0.0 |
| Total | 0 (0.0%) | 0.0 |
Fertility by Education by Marriage Status in Buena Vista
| Educational Attainment | Married | Unmarried |
| Less than High School | 0 (0.0%) | 0 (0.0%) |
| High School Diploma | 0 (0.0%) | 0 (0.0%) |
| College or Associate's Degree | 0 (0.0%) | 0 (0.0%) |
| Bachelor's Degree | 0 (0.0%) | 0 (0.0%) |
| Graduate Degree | 0 (0.0%) | 0 (0.0%) |
| Total | 0 (0.0%) | 0 (0.0%) |
Employment Characteristics in Buena Vista
Employment by Class of Employer in Buena Vista
Among the 323 employed individuals in Buena Vista, private company employees (268 | 83.0%), state government employees (47 | 14.5%), and not-for-profit organizations (8 | 2.5%) make up the most common classes of employment.
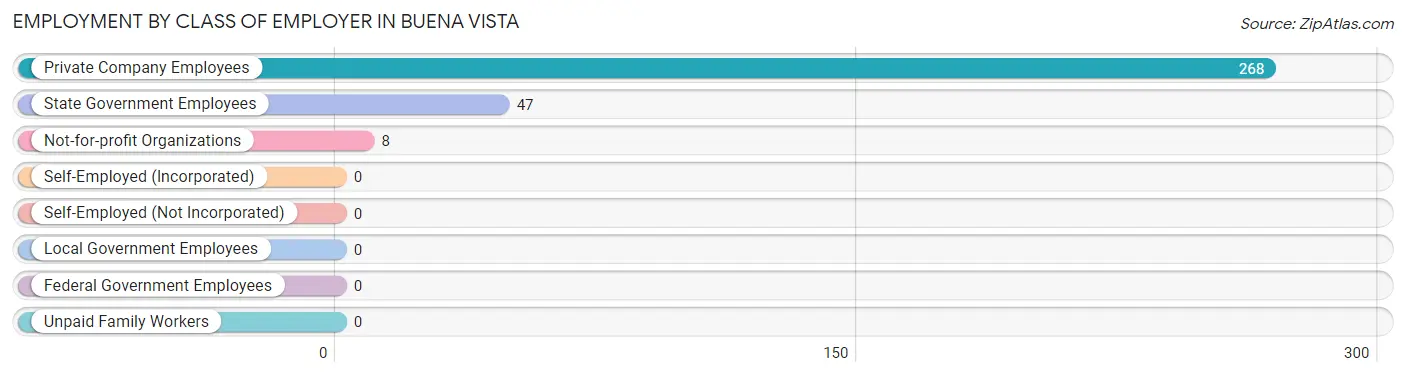
| Employer Class | # Employees | % Employees |
| Private Company Employees | 268 | 83.0% |
| Self-Employed (Incorporated) | 0 | 0.0% |
| Self-Employed (Not Incorporated) | 0 | 0.0% |
| Not-for-profit Organizations | 8 | 2.5% |
| Local Government Employees | 0 | 0.0% |
| State Government Employees | 47 | 14.5% |
| Federal Government Employees | 0 | 0.0% |
| Unpaid Family Workers | 0 | 0.0% |
| Total | 323 | 100.0% |
Employment Status by Age in Buena Vista
According to the labor force statistics for Buena Vista, out of the total population over 16 years of age (611), 61.4% or 375 individuals are in the labor force, with 7.5% or 28 of them unemployed. The age group with the highest labor force participation rate is 20 to 24 years, with 100.0% or 71 individuals in the labor force. Within the labor force, the 60 to 64 years age range has the highest percentage of unemployed individuals, with 100.0% or 28 of them being unemployed.
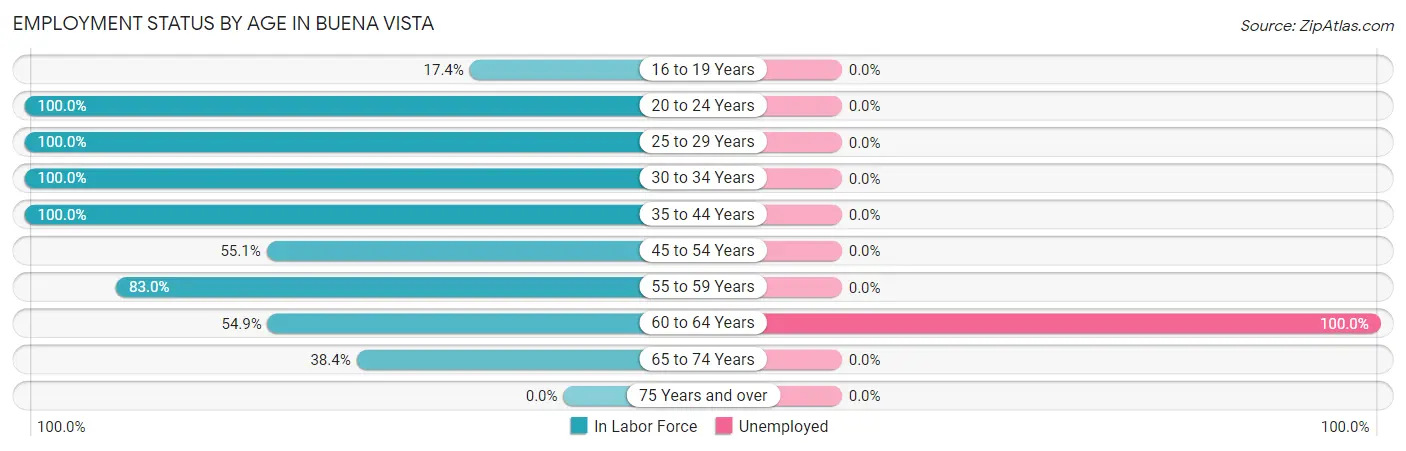
| Age Bracket | In Labor Force | Unemployed |
| 16 to 19 Years | 15 (17.4%) | 0 (0.0%) |
| 20 to 24 Years | 71 (100.0%) | 0 (0.0%) |
| 25 to 29 Years | 67 (100.0%) | 0 (0.0%) |
| 30 to 34 Years | 53 (100.0%) | 0 (0.0%) |
| 35 to 44 Years | 10 (100.0%) | 0 (0.0%) |
| 45 to 54 Years | 54 (55.1%) | 0 (0.0%) |
| 55 to 59 Years | 44 (83.0%) | 0 (0.0%) |
| 60 to 64 Years | 28 (54.9%) | 28 (100.0%) |
| 65 to 74 Years | 33 (38.4%) | 0 (0.0%) |
| 75 Years and over | 0 (0.0%) | 0 (0.0%) |
| Total | 375 (61.4%) | 28 (7.5%) |
Employment Status by Educational Attainment in Buena Vista
According to labor force statistics for Buena Vista, 77.1% of individuals (256) out of the total population between 25 and 64 years of age (332) are in the labor force, with 10.9% or 28 of them being unemployed. The group with the highest labor force participation rate are those with the educational attainment of bachelor's degree or higher, with 80.0% or 64 individuals in the labor force. Within the labor force, individuals with college / associate degree education have the highest percentage of unemployment, with 17.7% or 28 of them being unemployed.
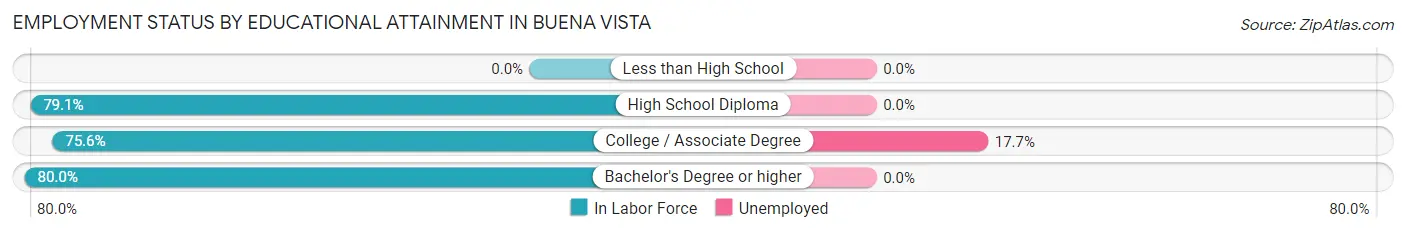
| Educational Attainment | In Labor Force | Unemployed |
| Less than High School | 0 (0.0%) | 0 (0.0%) |
| High School Diploma | 34 (79.1%) | 0 (0.0%) |
| College / Associate Degree | 158 (75.6%) | 37 (17.7%) |
| Bachelor's Degree or higher | 64 (80.0%) | 0 (0.0%) |
| Total | 256 (77.1%) | 36 (10.9%) |
Employment Occupations by Sex in Buena Vista
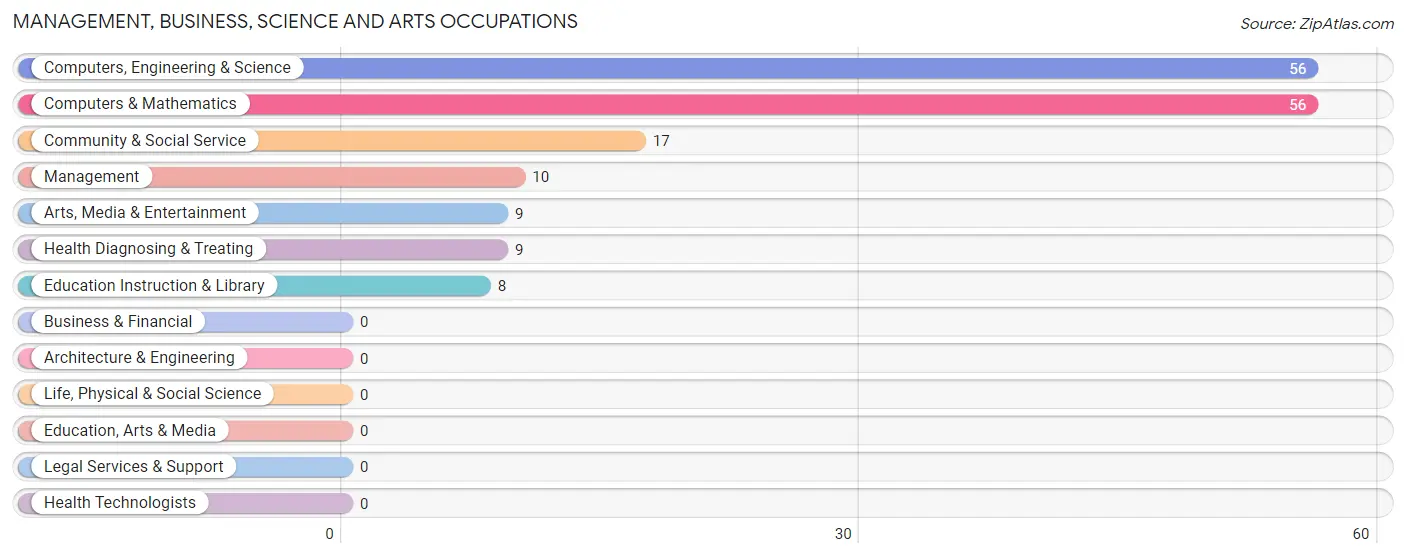
Management, Business, Science and Arts Occupations
The most common Management, Business, Science and Arts occupations in Buena Vista are Computers, Engineering & Science (56 | 16.1%), Computers & Mathematics (56 | 16.1%), Community & Social Service (17 | 4.9%), Management (10 | 2.9%), and Arts, Media & Entertainment (9 | 2.6%).
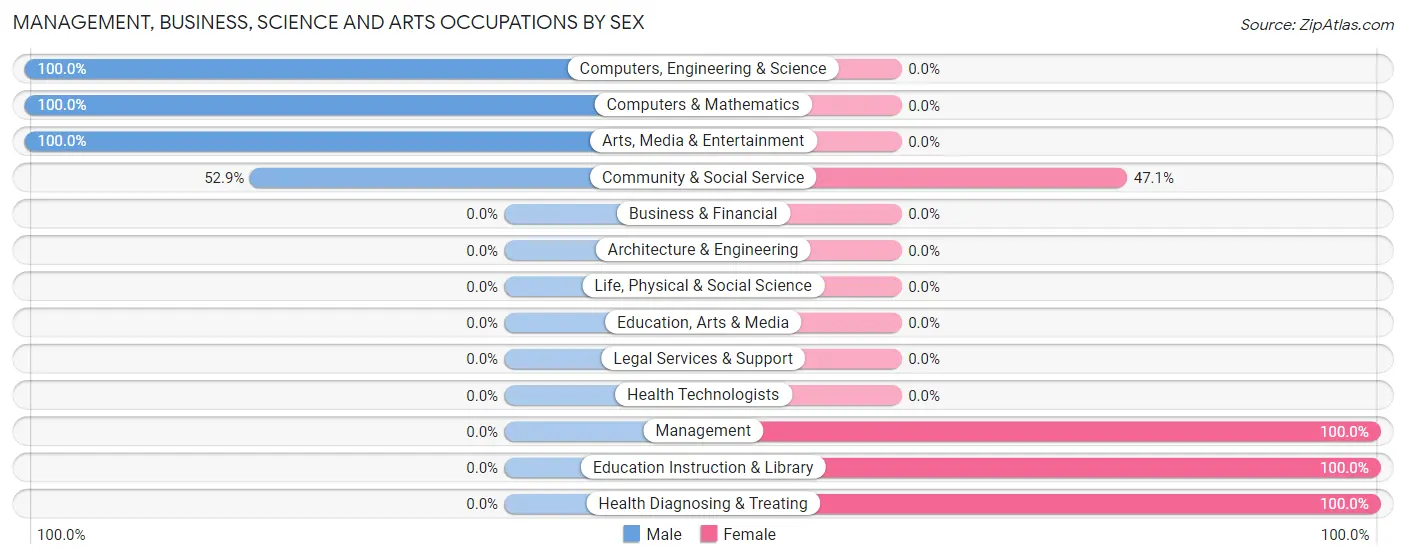
Management, Business, Science and Arts Occupations by Sex
Within the Management, Business, Science and Arts occupations in Buena Vista, the most male-oriented occupations are Computers, Engineering & Science (100.0%), Computers & Mathematics (100.0%), and Arts, Media & Entertainment (100.0%), while the most female-oriented occupations are Management (100.0%), Education Instruction & Library (100.0%), and Health Diagnosing & Treating (100.0%).
| Occupation | Male | Female |
| Management | 0 (0.0%) | 10 (100.0%) |
| Business & Financial | 0 (0.0%) | 0 (0.0%) |
| Computers, Engineering & Science | 56 (100.0%) | 0 (0.0%) |
| Computers & Mathematics | 56 (100.0%) | 0 (0.0%) |
| Architecture & Engineering | 0 (0.0%) | 0 (0.0%) |
| Life, Physical & Social Science | 0 (0.0%) | 0 (0.0%) |
| Community & Social Service | 9 (52.9%) | 8 (47.1%) |
| Education, Arts & Media | 0 (0.0%) | 0 (0.0%) |
| Legal Services & Support | 0 (0.0%) | 0 (0.0%) |
| Education Instruction & Library | 0 (0.0%) | 8 (100.0%) |
| Arts, Media & Entertainment | 9 (100.0%) | 0 (0.0%) |
| Health Diagnosing & Treating | 0 (0.0%) | 9 (100.0%) |
| Health Technologists | 0 (0.0%) | 0 (0.0%) |
| Total (Category) | 65 (70.7%) | 27 (29.3%) |
| Total (Overall) | 147 (42.4%) | 200 (57.6%) |
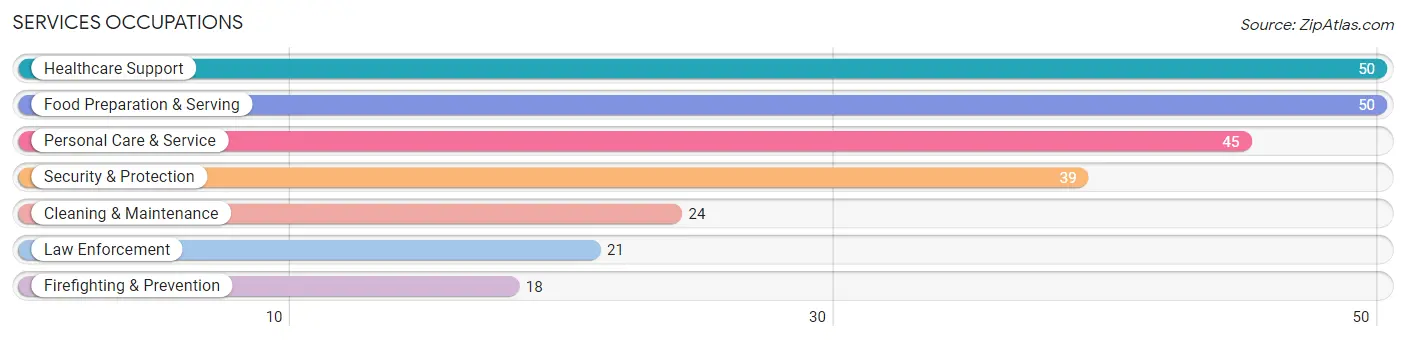
Services Occupations
The most common Services occupations in Buena Vista are Healthcare Support (50 | 14.4%), Food Preparation & Serving (50 | 14.4%), Personal Care & Service (45 | 13.0%), Security & Protection (39 | 11.2%), and Cleaning & Maintenance (24 | 6.9%).
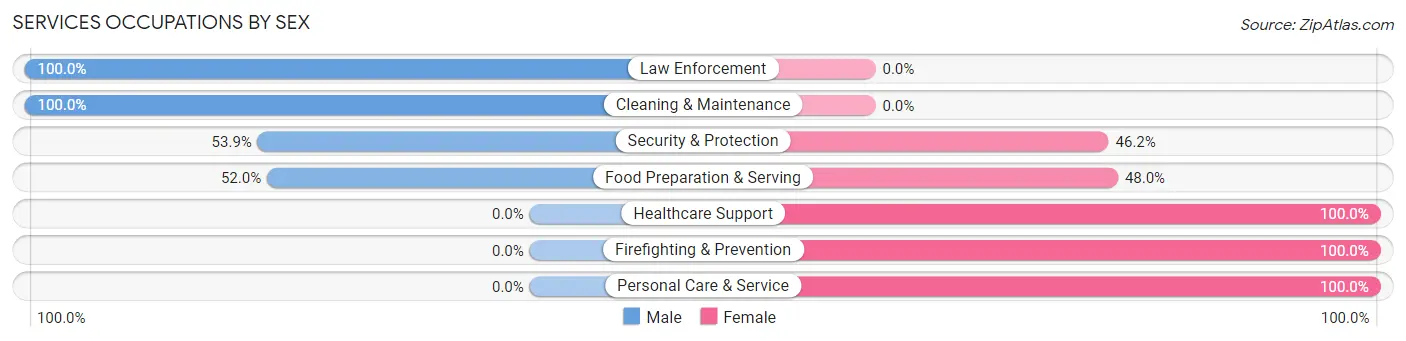
Services Occupations by Sex
Within the Services occupations in Buena Vista, the most male-oriented occupations are Law Enforcement (100.0%), Cleaning & Maintenance (100.0%), and Security & Protection (53.8%), while the most female-oriented occupations are Healthcare Support (100.0%), Firefighting & Prevention (100.0%), and Personal Care & Service (100.0%).
| Occupation | Male | Female |
| Healthcare Support | 0 (0.0%) | 50 (100.0%) |
| Security & Protection | 21 (53.8%) | 18 (46.2%) |
| Firefighting & Prevention | 0 (0.0%) | 18 (100.0%) |
| Law Enforcement | 21 (100.0%) | 0 (0.0%) |
| Food Preparation & Serving | 26 (52.0%) | 24 (48.0%) |
| Cleaning & Maintenance | 24 (100.0%) | 0 (0.0%) |
| Personal Care & Service | 0 (0.0%) | 45 (100.0%) |
| Total (Category) | 71 (34.1%) | 137 (65.9%) |
| Total (Overall) | 147 (42.4%) | 200 (57.6%) |
Sales and Office Occupations
The most common Sales and Office occupations in Buena Vista are , and Office & Administration (36 | 10.4%).
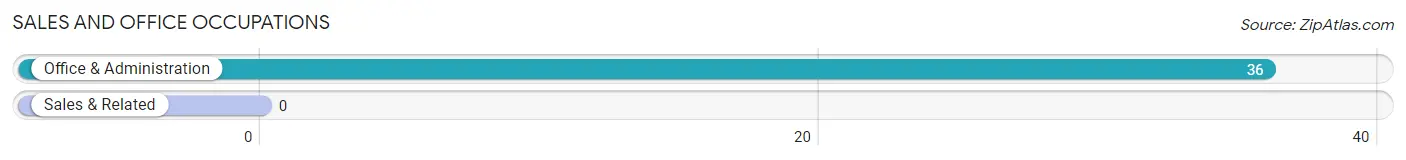
Sales and Office Occupations by Sex
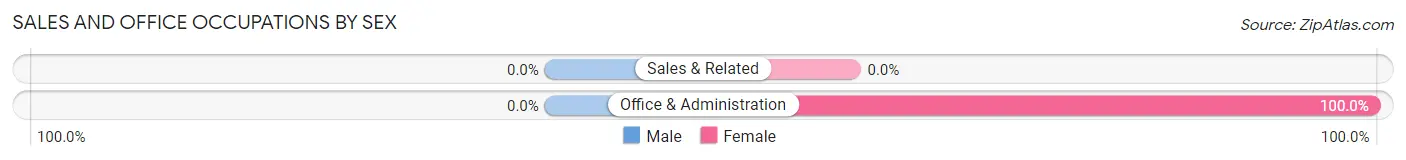
| Occupation | Male | Female |
| Sales & Related | 0 (0.0%) | 0 (0.0%) |
| Office & Administration | 0 (0.0%) | 36 (100.0%) |
| Total (Category) | 0 (0.0%) | 36 (100.0%) |
| Total (Overall) | 147 (42.4%) | 200 (57.6%) |
Natural Resources, Construction and Maintenance Occupations
The most common Natural Resources, Construction and Maintenance occupations in Buena Vista are , and Farming, Fishing & Forestry (11 | 3.2%).
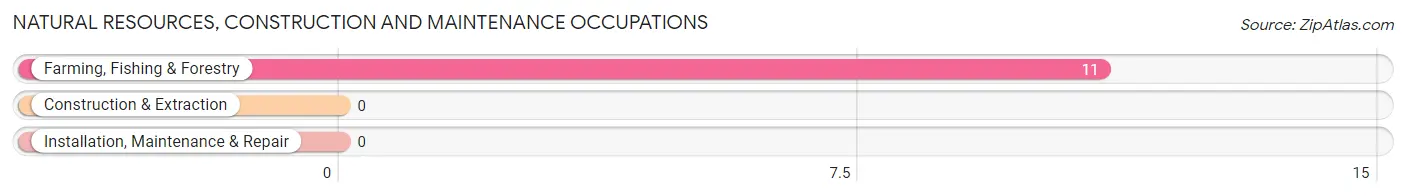
Natural Resources, Construction and Maintenance Occupations by Sex
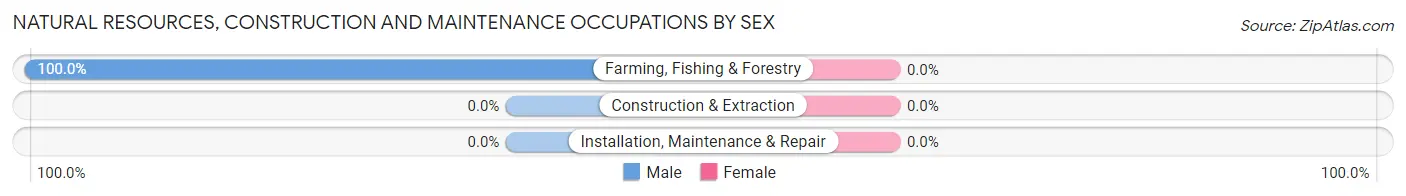
| Occupation | Male | Female |
| Farming, Fishing & Forestry | 11 (100.0%) | 0 (0.0%) |
| Construction & Extraction | 0 (0.0%) | 0 (0.0%) |
| Installation, Maintenance & Repair | 0 (0.0%) | 0 (0.0%) |
| Total (Category) | 11 (100.0%) | 0 (0.0%) |
| Total (Overall) | 147 (42.4%) | 200 (57.6%) |
Production, Transportation and Moving Occupations
Production, Transportation and Moving Occupations by Sex
| Occupation | Male | Female |
| Production | 0 (0.0%) | 0 (0.0%) |
| Transportation | 0 (0.0%) | 0 (0.0%) |
| Material Moving | 0 (0.0%) | 0 (0.0%) |
| Total (Category) | 0 (0.0%) | 0 (0.0%) |
| Total (Overall) | 147 (42.4%) | 200 (57.6%) |
Employment Industries by Sex in Buena Vista
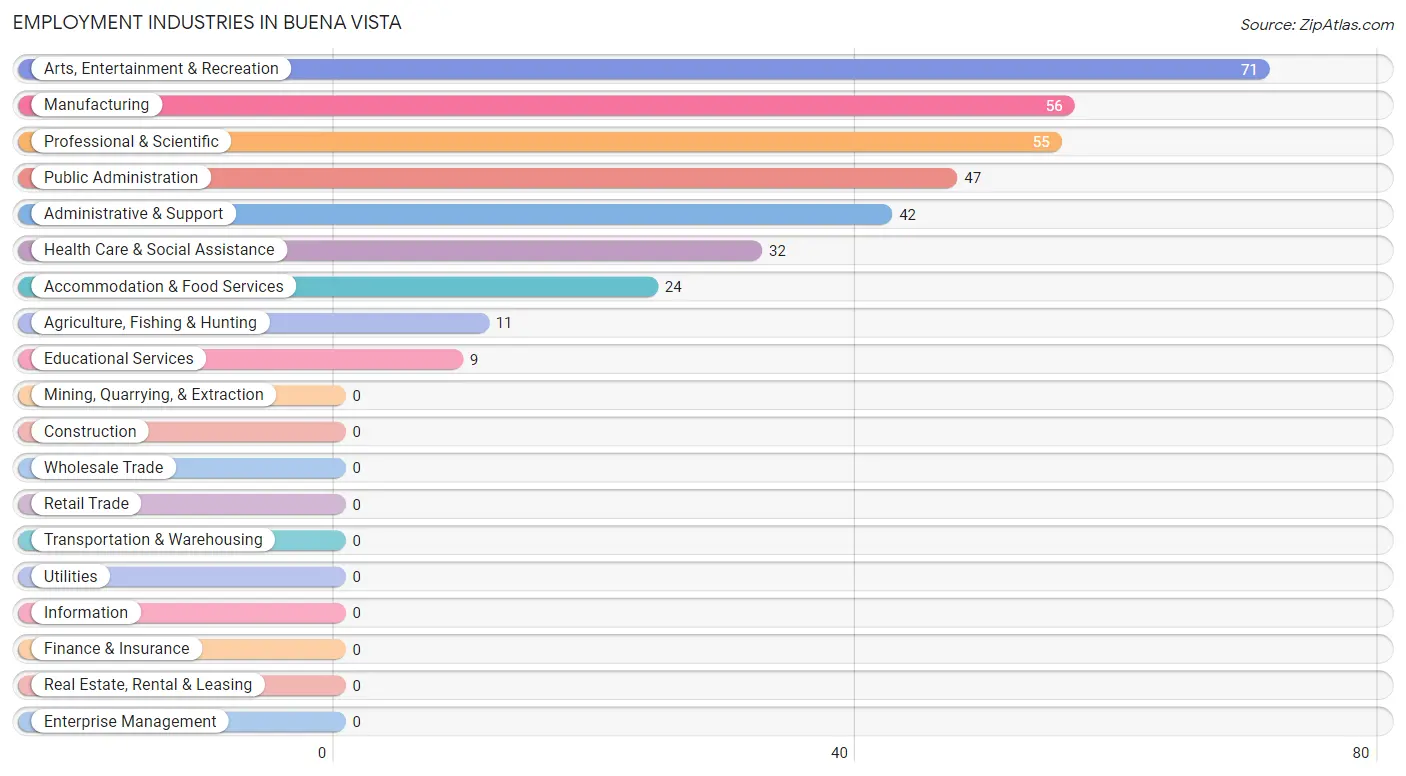
Employment Industries in Buena Vista
The major employment industries in Buena Vista include Arts, Entertainment & Recreation (71 | 20.5%), Manufacturing (56 | 16.1%), Professional & Scientific (55 | 15.9%), Public Administration (47 | 13.5%), and Administrative & Support (42 | 12.1%).
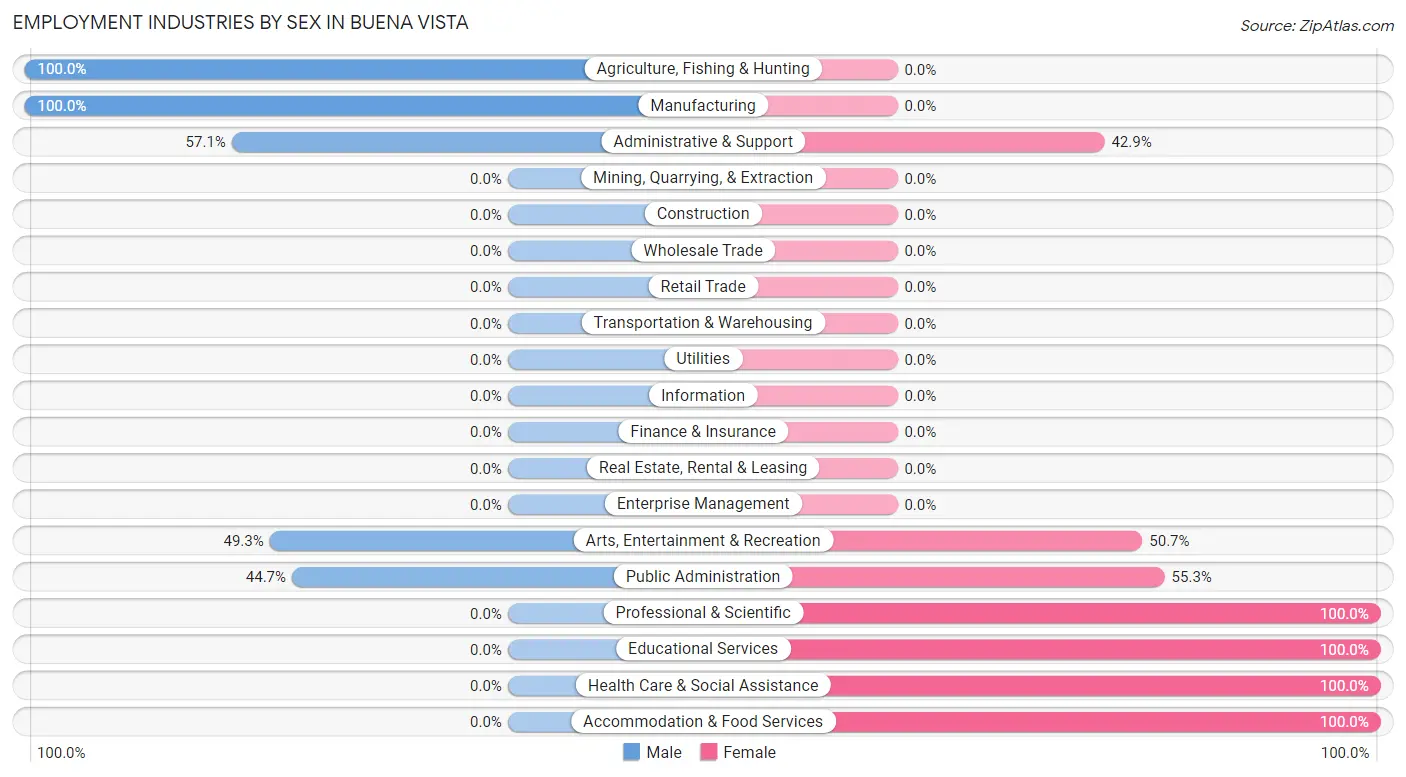
Employment Industries by Sex in Buena Vista
The Buena Vista industries that see more men than women are Agriculture, Fishing & Hunting (100.0%), Manufacturing (100.0%), and Administrative & Support (57.1%), whereas the industries that tend to have a higher number of women are Professional & Scientific (100.0%), Educational Services (100.0%), and Health Care & Social Assistance (100.0%).
| Industry | Male | Female |
| Agriculture, Fishing & Hunting | 11 (100.0%) | 0 (0.0%) |
| Mining, Quarrying, & Extraction | 0 (0.0%) | 0 (0.0%) |
| Construction | 0 (0.0%) | 0 (0.0%) |
| Manufacturing | 56 (100.0%) | 0 (0.0%) |
| Wholesale Trade | 0 (0.0%) | 0 (0.0%) |
| Retail Trade | 0 (0.0%) | 0 (0.0%) |
| Transportation & Warehousing | 0 (0.0%) | 0 (0.0%) |
| Utilities | 0 (0.0%) | 0 (0.0%) |
| Information | 0 (0.0%) | 0 (0.0%) |
| Finance & Insurance | 0 (0.0%) | 0 (0.0%) |
| Real Estate, Rental & Leasing | 0 (0.0%) | 0 (0.0%) |
| Professional & Scientific | 0 (0.0%) | 55 (100.0%) |
| Enterprise Management | 0 (0.0%) | 0 (0.0%) |
| Administrative & Support | 24 (57.1%) | 18 (42.9%) |
| Educational Services | 0 (0.0%) | 9 (100.0%) |
| Health Care & Social Assistance | 0 (0.0%) | 32 (100.0%) |
| Arts, Entertainment & Recreation | 35 (49.3%) | 36 (50.7%) |
| Accommodation & Food Services | 0 (0.0%) | 24 (100.0%) |
| Public Administration | 21 (44.7%) | 26 (55.3%) |
| Total | 147 (42.4%) | 200 (57.6%) |
Education in Buena Vista
School Enrollment in Buena Vista
The most common levels of schooling among the 211 students in Buena Vista are high school (97 | 46.0%), college / undergraduate (45 | 21.3%), and nursery / preschool (24 | 11.4%).
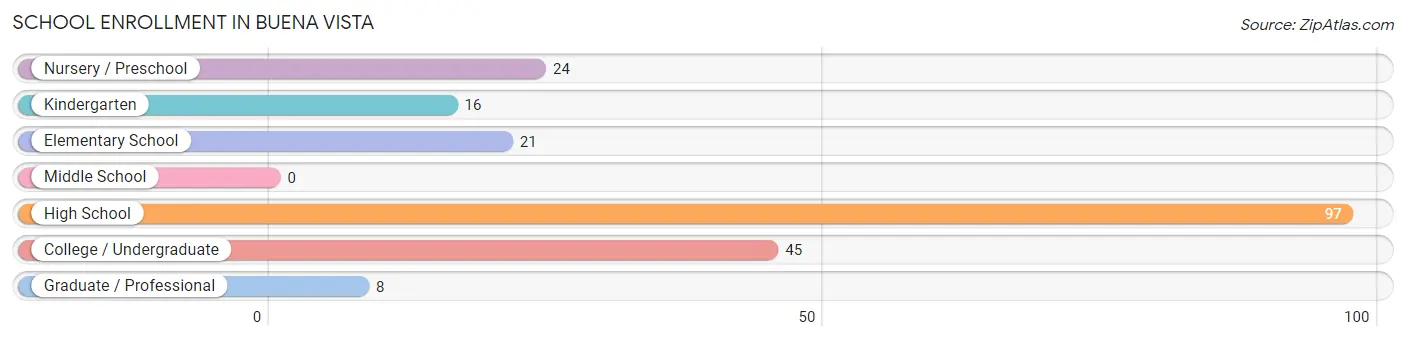
| School Level | # Students | % Students |
| Nursery / Preschool | 24 | 11.4% |
| Kindergarten | 16 | 7.6% |
| Elementary School | 21 | 10.0% |
| Middle School | 0 | 0.0% |
| High School | 97 | 46.0% |
| College / Undergraduate | 45 | 21.3% |
| Graduate / Professional | 8 | 3.8% |
| Total | 211 | 100.0% |
School Enrollment by Age by Funding Source in Buena Vista
Out of a total of 211 students who are enrolled in schools in Buena Vista, 39 (18.5%) attend a private institution, while the remaining 172 (81.5%) are enrolled in public schools. The age group of 3 to 4 year olds has the highest likelihood of being enrolled in private schools, with 24 (100.0% in the age bracket) enrolled. Conversely, the age group of 5 to 9 year old has the lowest likelihood of being enrolled in a private school, with 16 (100.0% in the age bracket) attending a public institution.
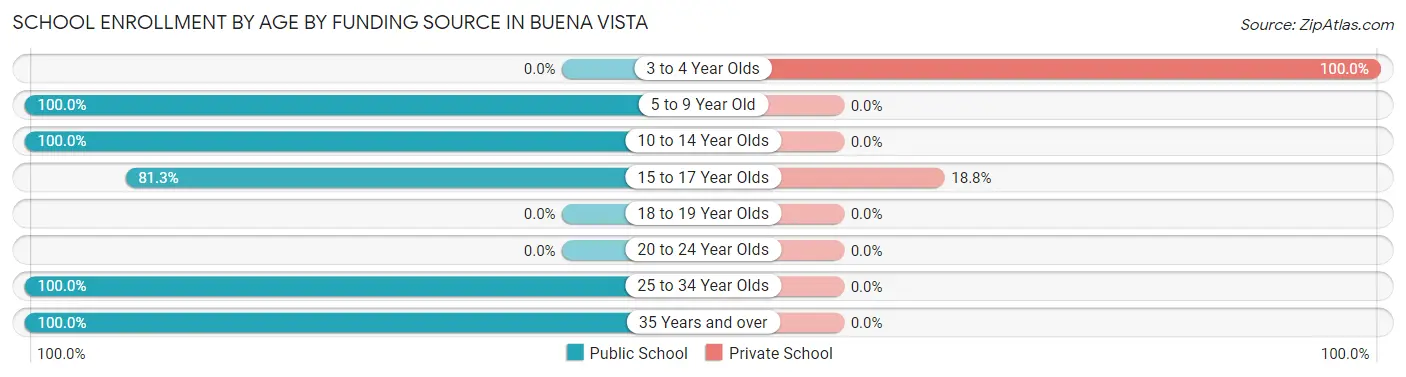
| Age Bracket | Public School | Private School |
| 3 to 4 Year Olds | 0 (0.0%) | 24 (100.0%) |
| 5 to 9 Year Old | 16 (100.0%) | 0 (0.0%) |
| 10 to 14 Year Olds | 38 (100.0%) | 0 (0.0%) |
| 15 to 17 Year Olds | 65 (81.2%) | 15 (18.8%) |
| 18 to 19 Year Olds | 0 (0.0%) | 0 (0.0%) |
| 20 to 24 Year Olds | 0 (0.0%) | 0 (0.0%) |
| 25 to 34 Year Olds | 44 (100.0%) | 0 (0.0%) |
| 35 Years and over | 9 (100.0%) | 0 (0.0%) |
| Total | 172 (81.5%) | 39 (18.5%) |
Educational Attainment by Field of Study in Buena Vista
Business (96 | 92.3%), and liberal arts & history (8 | 7.7%) are the most common fields of study among 104 individuals in Buena Vista who have obtained a bachelor's degree or higher.
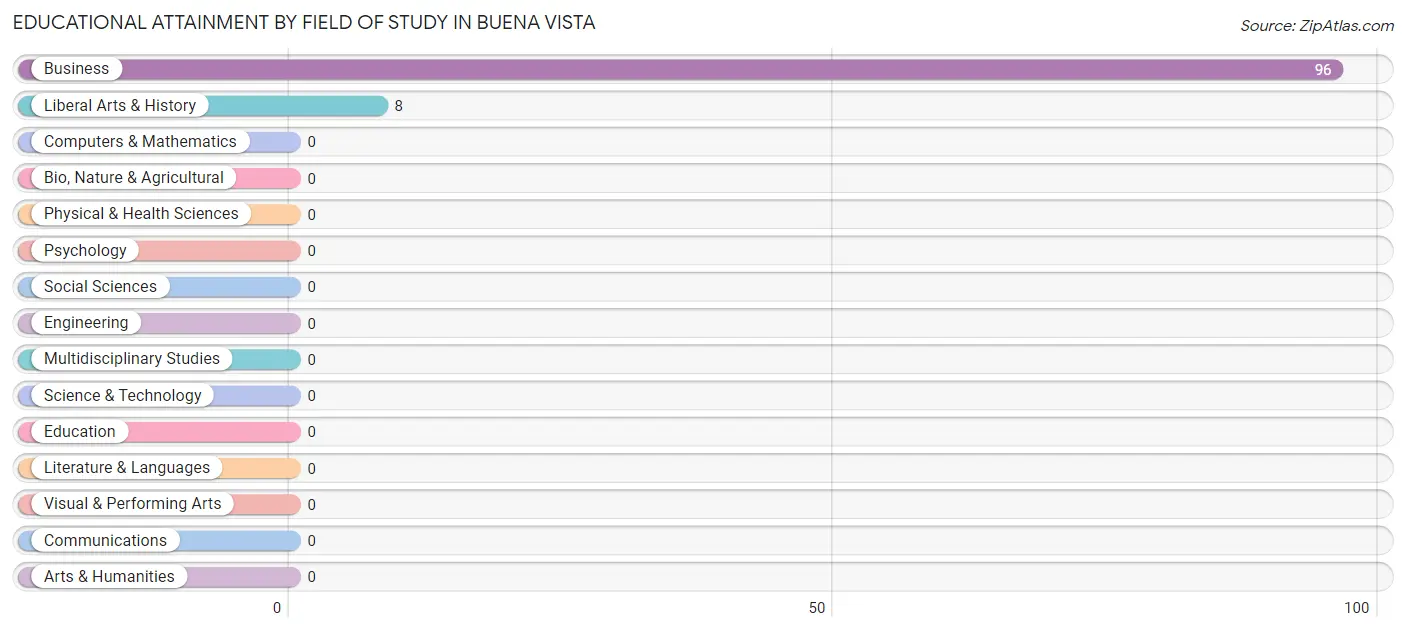
| Field of Study | # Graduates | % Graduates |
| Computers & Mathematics | 0 | 0.0% |
| Bio, Nature & Agricultural | 0 | 0.0% |
| Physical & Health Sciences | 0 | 0.0% |
| Psychology | 0 | 0.0% |
| Social Sciences | 0 | 0.0% |
| Engineering | 0 | 0.0% |
| Multidisciplinary Studies | 0 | 0.0% |
| Science & Technology | 0 | 0.0% |
| Business | 96 | 92.3% |
| Education | 0 | 0.0% |
| Literature & Languages | 0 | 0.0% |
| Liberal Arts & History | 8 | 7.7% |
| Visual & Performing Arts | 0 | 0.0% |
| Communications | 0 | 0.0% |
| Arts & Humanities | 0 | 0.0% |
| Total | 104 | 100.0% |
Transportation & Commute in Buena Vista
Vehicle Availability by Sex in Buena Vista
The most prevalent vehicle ownership categories in Buena Vista are males with 2 vehicles (71, accounting for 48.3%) and females with 2 vehicles (135, making up 40.3%).
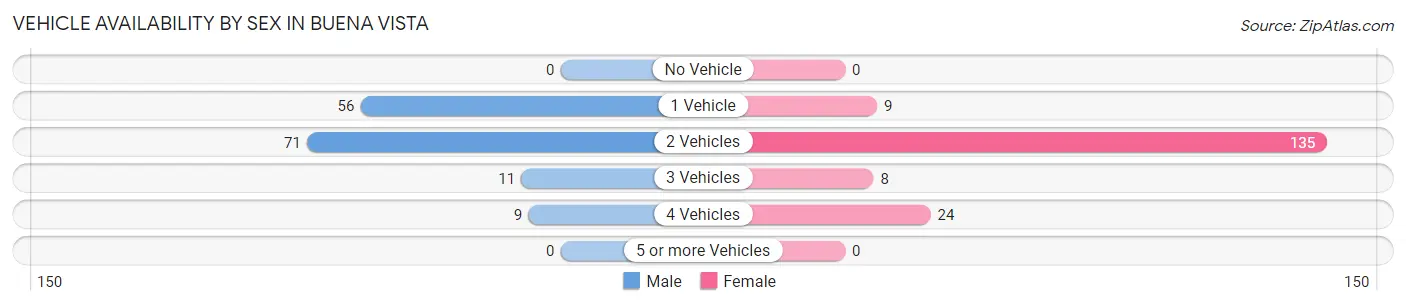
| Vehicles Available | Male | Female |
| No Vehicle | 0 (0.0%) | 0 (0.0%) |
| 1 Vehicle | 56 (38.1%) | 9 (5.1%) |
| 2 Vehicles | 71 (48.3%) | 135 (76.7%) |
| 3 Vehicles | 11 (7.5%) | 8 (4.5%) |
| 4 Vehicles | 9 (6.1%) | 24 (13.6%) |
| 5 or more Vehicles | 0 (0.0%) | 0 (0.0%) |
| Total | 147 (100.0%) | 176 (100.0%) |
Commute Time in Buena Vista
The most frequently occuring commute durations in Buena Vista are 15 to 19 minutes (137 commuters, 43.8%), 30 to 34 minutes (75 commuters, 24.0%), and 60 to 89 minutes (33 commuters, 10.5%).
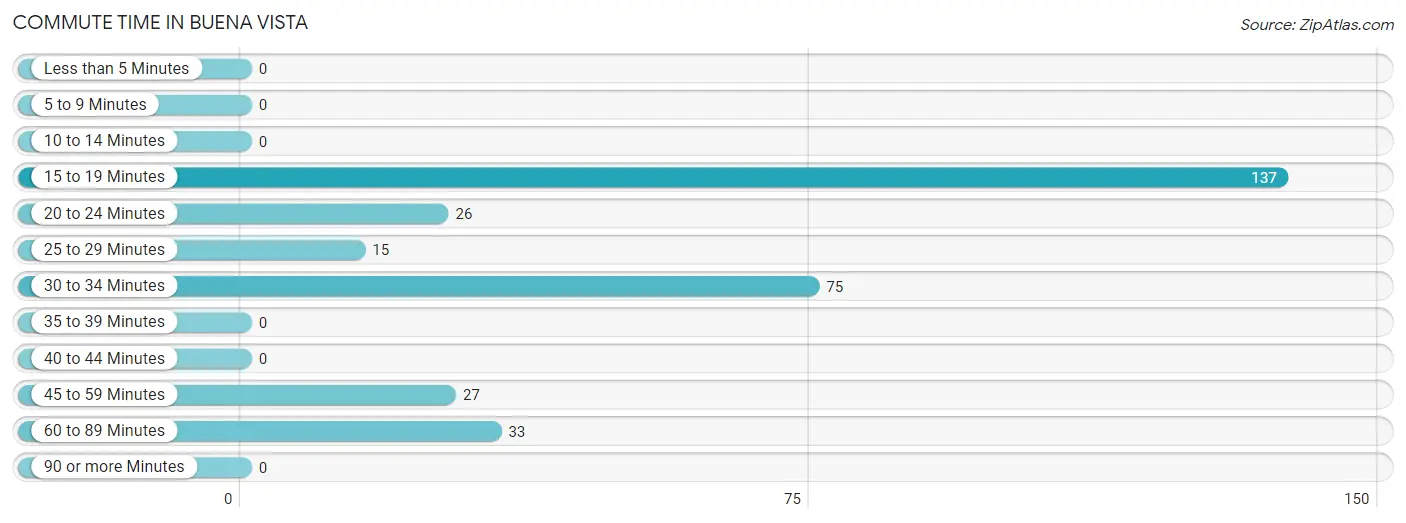
| Commute Time | # Commuters | % Commuters |
| Less than 5 Minutes | 0 | 0.0% |
| 5 to 9 Minutes | 0 | 0.0% |
| 10 to 14 Minutes | 0 | 0.0% |
| 15 to 19 Minutes | 137 | 43.8% |
| 20 to 24 Minutes | 26 | 8.3% |
| 25 to 29 Minutes | 15 | 4.8% |
| 30 to 34 Minutes | 75 | 24.0% |
| 35 to 39 Minutes | 0 | 0.0% |
| 40 to 44 Minutes | 0 | 0.0% |
| 45 to 59 Minutes | 27 | 8.6% |
| 60 to 89 Minutes | 33 | 10.5% |
| 90 or more Minutes | 0 | 0.0% |
Commute Time by Sex in Buena Vista
The most common commute times in Buena Vista are 30 to 34 minutes (67 commuters, 45.6%) for males and 15 to 19 minutes (116 commuters, 69.9%) for females.
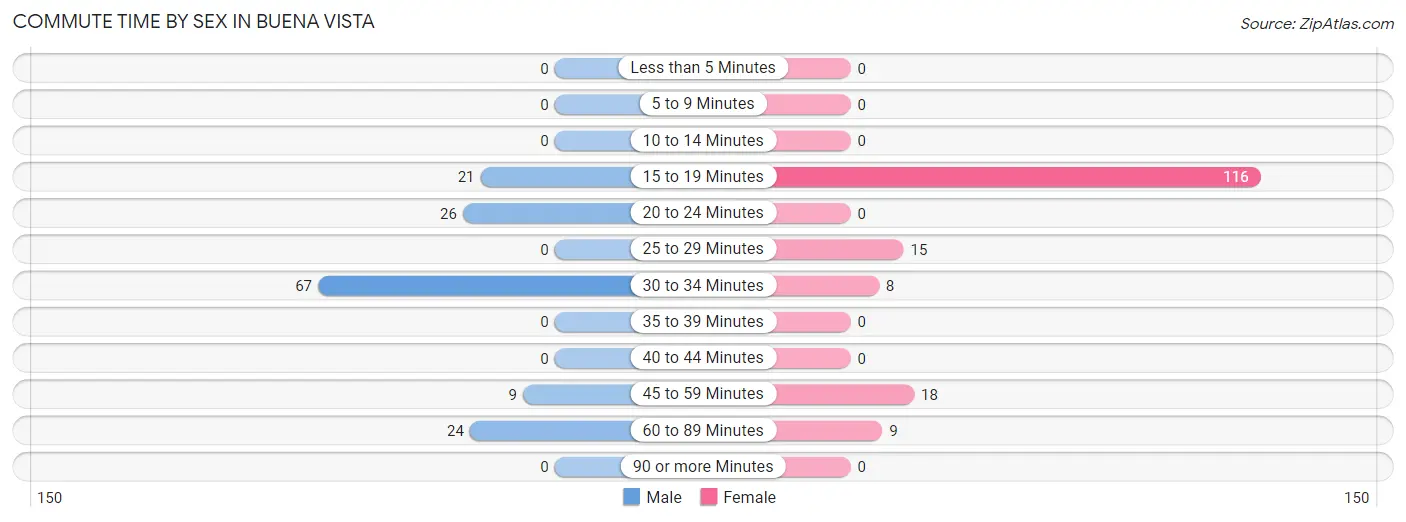
| Commute Time | Male | Female |
| Less than 5 Minutes | 0 (0.0%) | 0 (0.0%) |
| 5 to 9 Minutes | 0 (0.0%) | 0 (0.0%) |
| 10 to 14 Minutes | 0 (0.0%) | 0 (0.0%) |
| 15 to 19 Minutes | 21 (14.3%) | 116 (69.9%) |
| 20 to 24 Minutes | 26 (17.7%) | 0 (0.0%) |
| 25 to 29 Minutes | 0 (0.0%) | 15 (9.0%) |
| 30 to 34 Minutes | 67 (45.6%) | 8 (4.8%) |
| 35 to 39 Minutes | 0 (0.0%) | 0 (0.0%) |
| 40 to 44 Minutes | 0 (0.0%) | 0 (0.0%) |
| 45 to 59 Minutes | 9 (6.1%) | 18 (10.8%) |
| 60 to 89 Minutes | 24 (16.3%) | 9 (5.4%) |
| 90 or more Minutes | 0 (0.0%) | 0 (0.0%) |
Time of Departure to Work by Sex in Buena Vista
The most frequent times of departure to work in Buena Vista are 5:00 AM to 5:29 AM (82, 55.8%) for males and 12:00 AM to 4:59 AM (63, 38.0%) for females.
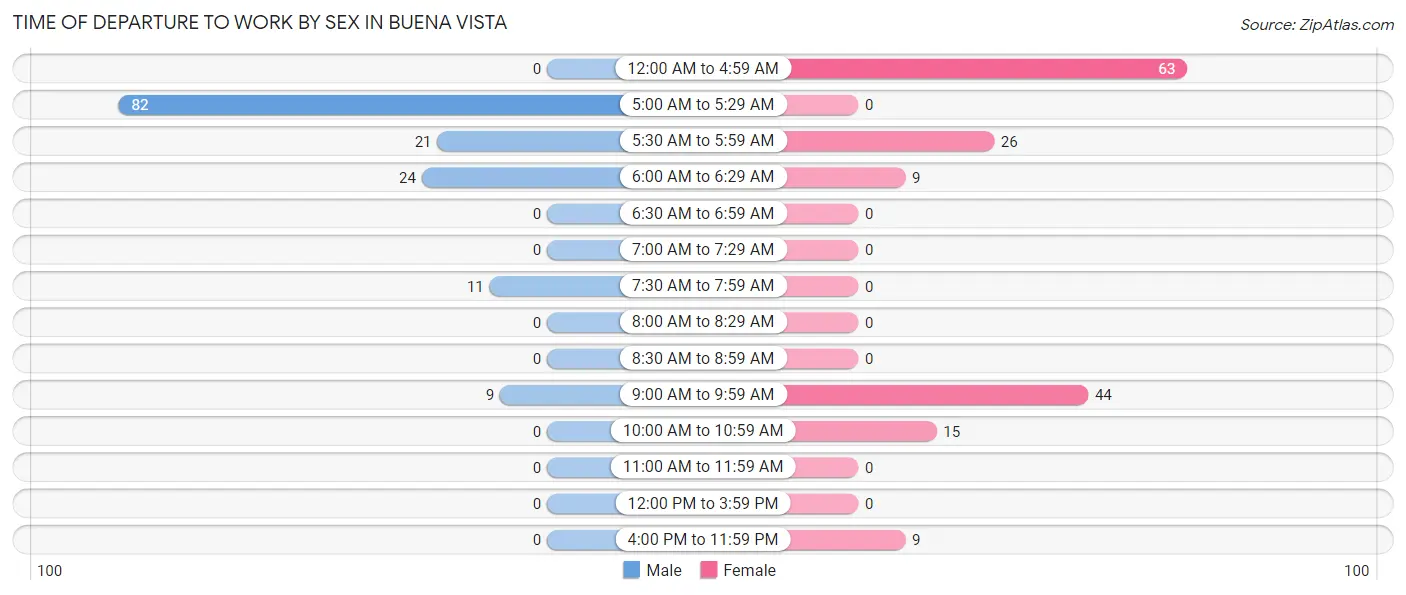
| Time of Departure | Male | Female |
| 12:00 AM to 4:59 AM | 0 (0.0%) | 63 (38.0%) |
| 5:00 AM to 5:29 AM | 82 (55.8%) | 0 (0.0%) |
| 5:30 AM to 5:59 AM | 21 (14.3%) | 26 (15.7%) |
| 6:00 AM to 6:29 AM | 24 (16.3%) | 9 (5.4%) |
| 6:30 AM to 6:59 AM | 0 (0.0%) | 0 (0.0%) |
| 7:00 AM to 7:29 AM | 0 (0.0%) | 0 (0.0%) |
| 7:30 AM to 7:59 AM | 11 (7.5%) | 0 (0.0%) |
| 8:00 AM to 8:29 AM | 0 (0.0%) | 0 (0.0%) |
| 8:30 AM to 8:59 AM | 0 (0.0%) | 0 (0.0%) |
| 9:00 AM to 9:59 AM | 9 (6.1%) | 44 (26.5%) |
| 10:00 AM to 10:59 AM | 0 (0.0%) | 15 (9.0%) |
| 11:00 AM to 11:59 AM | 0 (0.0%) | 0 (0.0%) |
| 12:00 PM to 3:59 PM | 0 (0.0%) | 0 (0.0%) |
| 4:00 PM to 11:59 PM | 0 (0.0%) | 9 (5.4%) |
| Total | 147 (100.0%) | 166 (100.0%) |
Housing Occupancy in Buena Vista
Occupancy by Ownership in Buena Vista
Of the total 246 dwellings in Buena Vista, owner-occupied units account for 140 (56.9%), while renter-occupied units make up 106 (43.1%).
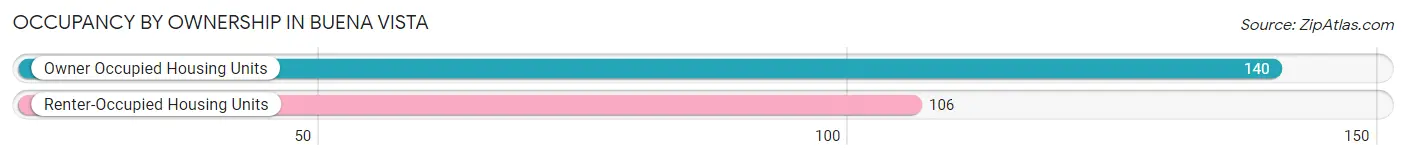
| Occupancy | # Housing Units | % Housing Units |
| Owner Occupied Housing Units | 140 | 56.9% |
| Renter-Occupied Housing Units | 106 | 43.1% |
| Total Occupied Housing Units | 246 | 100.0% |
Occupancy by Household Size in Buena Vista
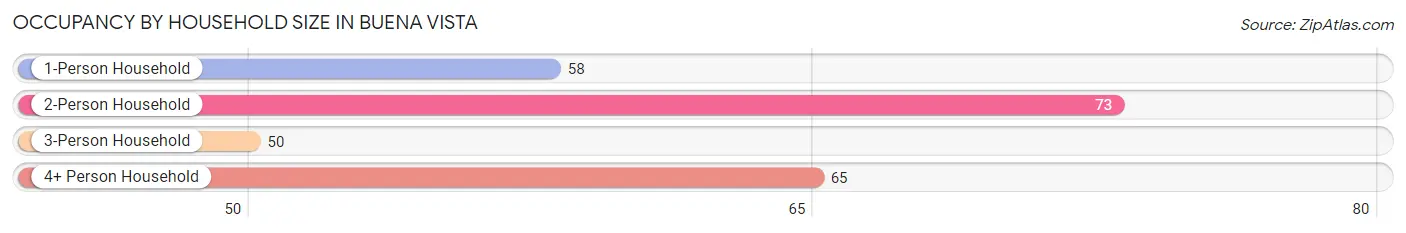
| Household Size | # Housing Units | % Housing Units |
| 1-Person Household | 58 | 23.6% |
| 2-Person Household | 73 | 29.7% |
| 3-Person Household | 50 | 20.3% |
| 4+ Person Household | 65 | 26.4% |
| Total Housing Units | 246 | 100.0% |
Occupancy by Ownership by Household Size in Buena Vista
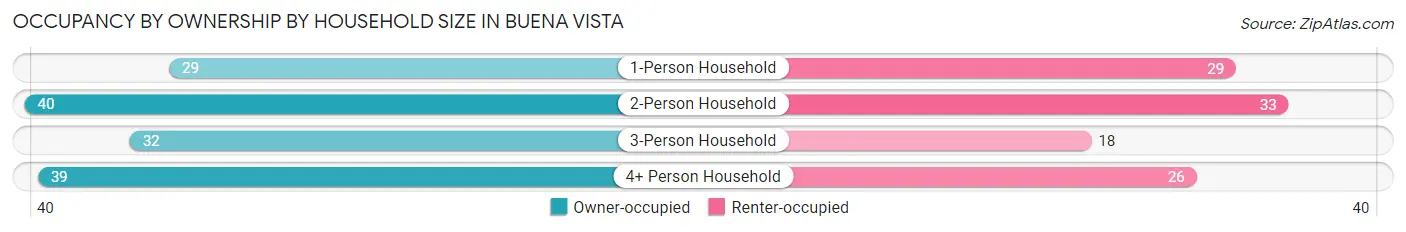
| Household Size | Owner-occupied | Renter-occupied |
| 1-Person Household | 29 (50.0%) | 29 (50.0%) |
| 2-Person Household | 40 (54.8%) | 33 (45.2%) |
| 3-Person Household | 32 (64.0%) | 18 (36.0%) |
| 4+ Person Household | 39 (60.0%) | 26 (40.0%) |
| Total Housing Units | 140 (56.9%) | 106 (43.1%) |
Occupancy by Educational Attainment in Buena Vista
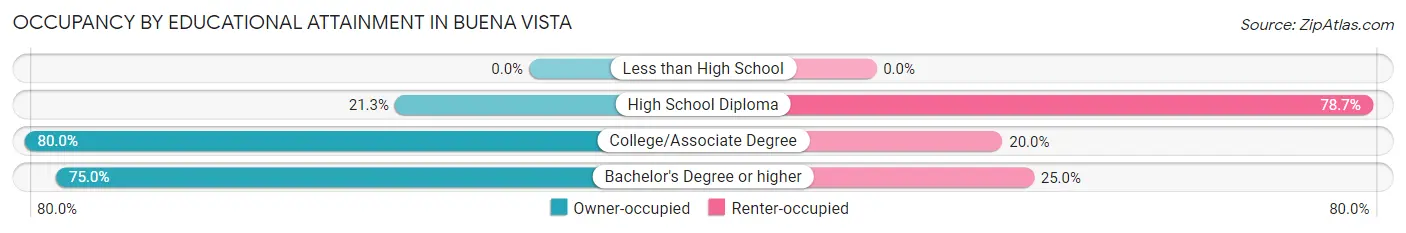
| Household Size | Owner-occupied | Renter-occupied |
| Less than High School | 0 (0.0%) | 0 (0.0%) |
| High School Diploma | 20 (21.3%) | 74 (78.7%) |
| College/Associate Degree | 96 (80.0%) | 24 (20.0%) |
| Bachelor's Degree or higher | 24 (75.0%) | 8 (25.0%) |
Occupancy by Age of Householder in Buena Vista
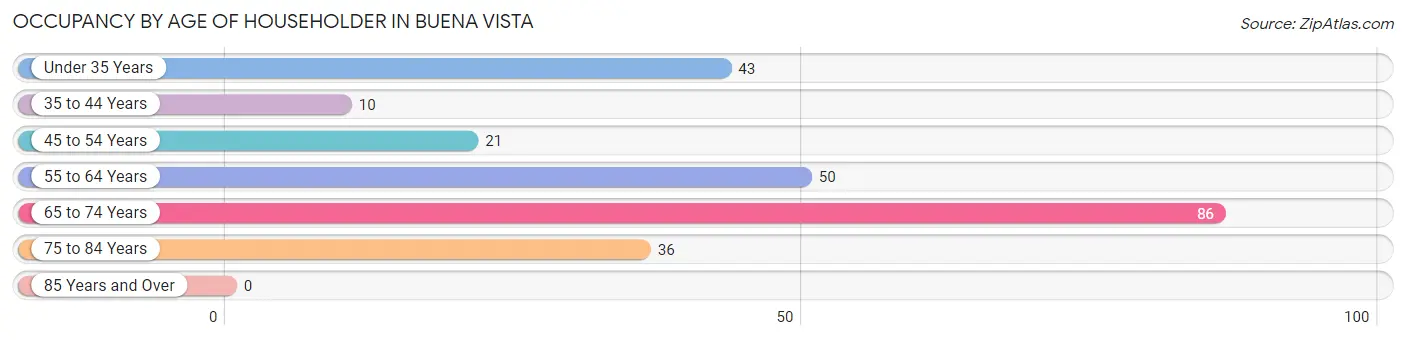
| Age Bracket | # Households | % Households |
| Under 35 Years | 43 | 17.5% |
| 35 to 44 Years | 10 | 4.1% |
| 45 to 54 Years | 21 | 8.5% |
| 55 to 64 Years | 50 | 20.3% |
| 65 to 74 Years | 86 | 35.0% |
| 75 to 84 Years | 36 | 14.6% |
| 85 Years and Over | 0 | 0.0% |
| Total | 246 | 100.0% |
Housing Finances in Buena Vista
Median Income by Occupancy in Buena Vista
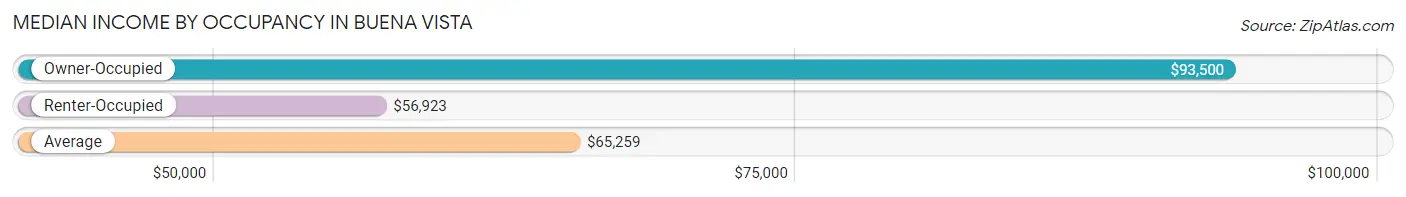
| Occupancy Type | # Households | Median Income |
| Owner-Occupied | 140 (56.9%) | $93,500 |
| Renter-Occupied | 106 (43.1%) | $56,923 |
| Average | 246 (100.0%) | $65,259 |
Occupancy by Householder Income Bracket in Buena Vista
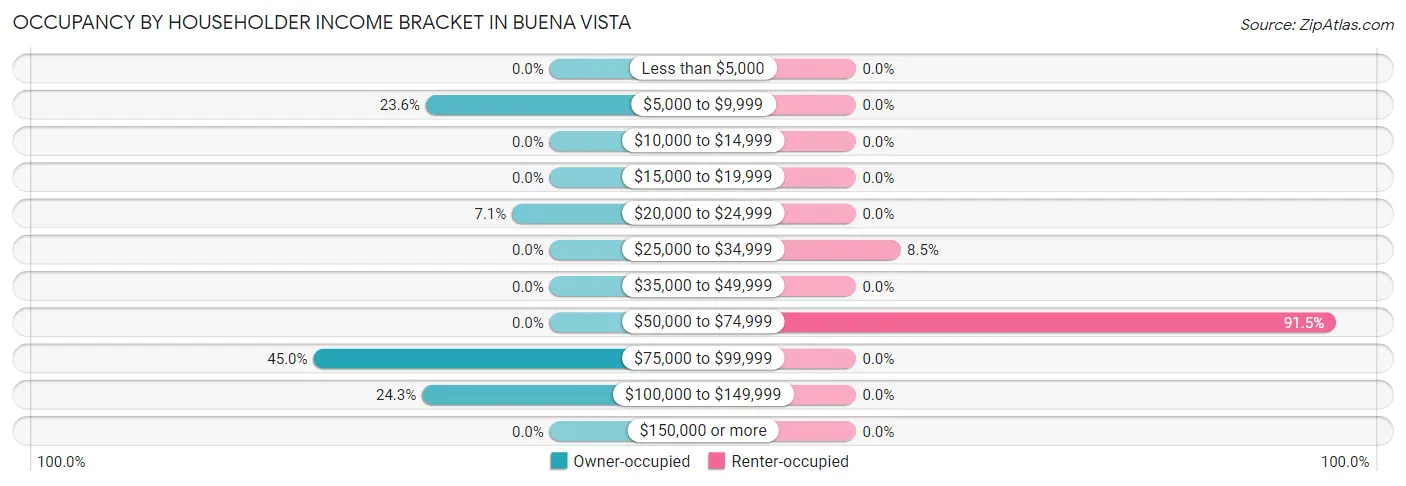
| Income Bracket | Owner-occupied | Renter-occupied |
| Less than $5,000 | 0 (0.0%) | 0 (0.0%) |
| $5,000 to $9,999 | 33 (23.6%) | 0 (0.0%) |
| $10,000 to $14,999 | 0 (0.0%) | 0 (0.0%) |
| $15,000 to $19,999 | 0 (0.0%) | 0 (0.0%) |
| $20,000 to $24,999 | 10 (7.1%) | 0 (0.0%) |
| $25,000 to $34,999 | 0 (0.0%) | 9 (8.5%) |
| $35,000 to $49,999 | 0 (0.0%) | 0 (0.0%) |
| $50,000 to $74,999 | 0 (0.0%) | 97 (91.5%) |
| $75,000 to $99,999 | 63 (45.0%) | 0 (0.0%) |
| $100,000 to $149,999 | 34 (24.3%) | 0 (0.0%) |
| $150,000 or more | 0 (0.0%) | 0 (0.0%) |
| Total | 140 (100.0%) | 106 (100.0%) |
Monthly Housing Cost Tiers in Buena Vista
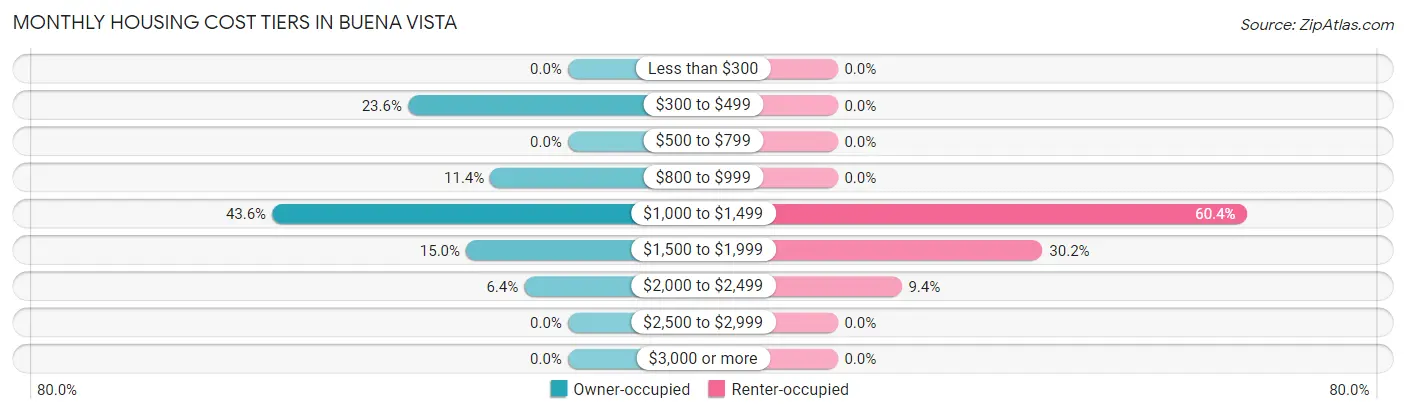
| Monthly Cost | Owner-occupied | Renter-occupied |
| Less than $300 | 0 (0.0%) | 0 (0.0%) |
| $300 to $499 | 33 (23.6%) | 0 (0.0%) |
| $500 to $799 | 0 (0.0%) | 0 (0.0%) |
| $800 to $999 | 16 (11.4%) | 0 (0.0%) |
| $1,000 to $1,499 | 61 (43.6%) | 64 (60.4%) |
| $1,500 to $1,999 | 21 (15.0%) | 32 (30.2%) |
| $2,000 to $2,499 | 9 (6.4%) | 10 (9.4%) |
| $2,500 to $2,999 | 0 (0.0%) | 0 (0.0%) |
| $3,000 or more | 0 (0.0%) | 0 (0.0%) |
| Total | 140 (100.0%) | 106 (100.0%) |
Physical Housing Characteristics in Buena Vista
Housing Structures in Buena Vista
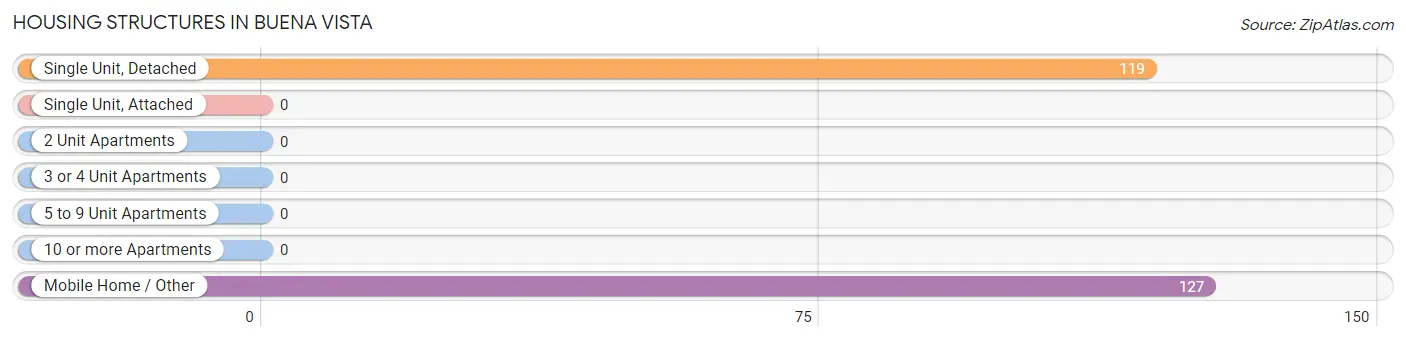
| Structure Type | # Housing Units | % Housing Units |
| Single Unit, Detached | 119 | 48.4% |
| Single Unit, Attached | 0 | 0.0% |
| 2 Unit Apartments | 0 | 0.0% |
| 3 or 4 Unit Apartments | 0 | 0.0% |
| 5 to 9 Unit Apartments | 0 | 0.0% |
| 10 or more Apartments | 0 | 0.0% |
| Mobile Home / Other | 127 | 51.6% |
| Total | 246 | 100.0% |
Housing Structures by Occupancy in Buena Vista
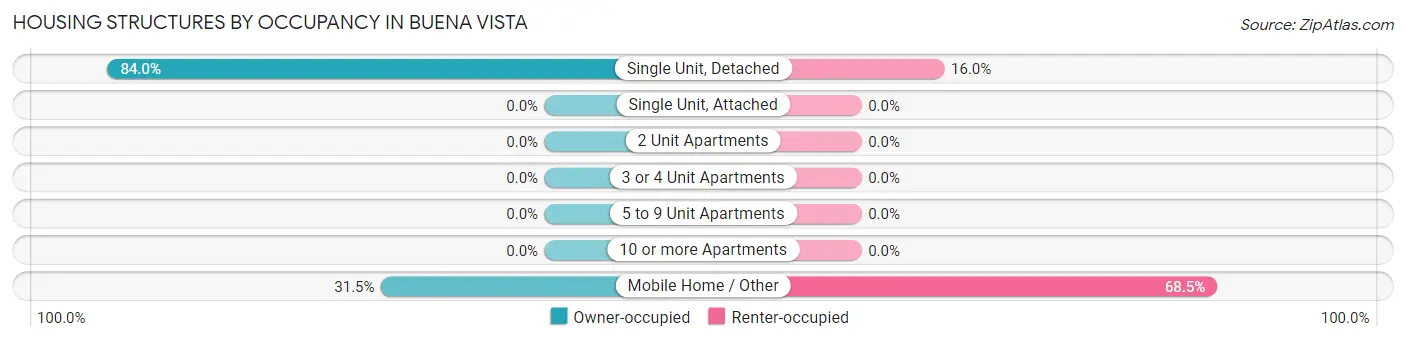
| Structure Type | Owner-occupied | Renter-occupied |
| Single Unit, Detached | 100 (84.0%) | 19 (16.0%) |
| Single Unit, Attached | 0 (0.0%) | 0 (0.0%) |
| 2 Unit Apartments | 0 (0.0%) | 0 (0.0%) |
| 3 or 4 Unit Apartments | 0 (0.0%) | 0 (0.0%) |
| 5 to 9 Unit Apartments | 0 (0.0%) | 0 (0.0%) |
| 10 or more Apartments | 0 (0.0%) | 0 (0.0%) |
| Mobile Home / Other | 40 (31.5%) | 87 (68.5%) |
| Total | 140 (56.9%) | 106 (43.1%) |
Housing Structures by Number of Rooms in Buena Vista
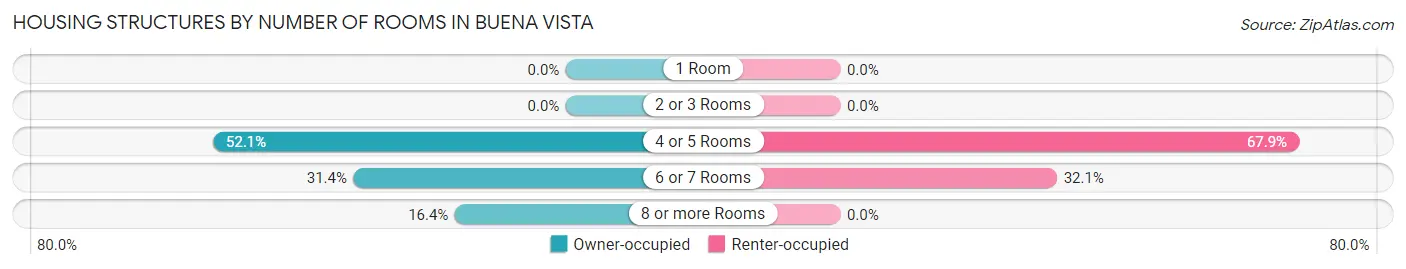
| Number of Rooms | Owner-occupied | Renter-occupied |
| 1 Room | 0 (0.0%) | 0 (0.0%) |
| 2 or 3 Rooms | 0 (0.0%) | 0 (0.0%) |
| 4 or 5 Rooms | 73 (52.1%) | 72 (67.9%) |
| 6 or 7 Rooms | 44 (31.4%) | 34 (32.1%) |
| 8 or more Rooms | 23 (16.4%) | 0 (0.0%) |
| Total | 140 (100.0%) | 106 (100.0%) |
Housing Structure by Heating Type in Buena Vista
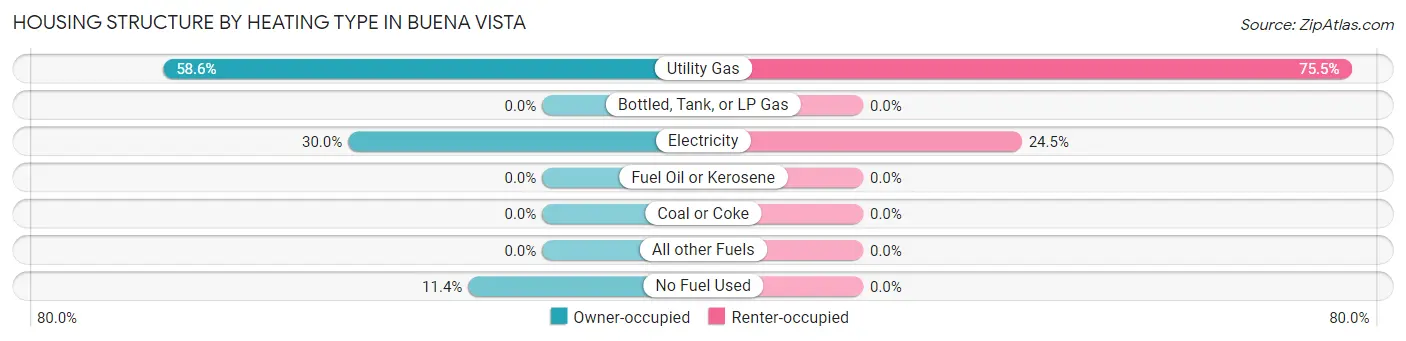
| Heating Type | Owner-occupied | Renter-occupied |
| Utility Gas | 82 (58.6%) | 80 (75.5%) |
| Bottled, Tank, or LP Gas | 0 (0.0%) | 0 (0.0%) |
| Electricity | 42 (30.0%) | 26 (24.5%) |
| Fuel Oil or Kerosene | 0 (0.0%) | 0 (0.0%) |
| Coal or Coke | 0 (0.0%) | 0 (0.0%) |
| All other Fuels | 0 (0.0%) | 0 (0.0%) |
| No Fuel Used | 16 (11.4%) | 0 (0.0%) |
| Total | 140 (100.0%) | 106 (100.0%) |
Household Vehicle Usage in Buena Vista
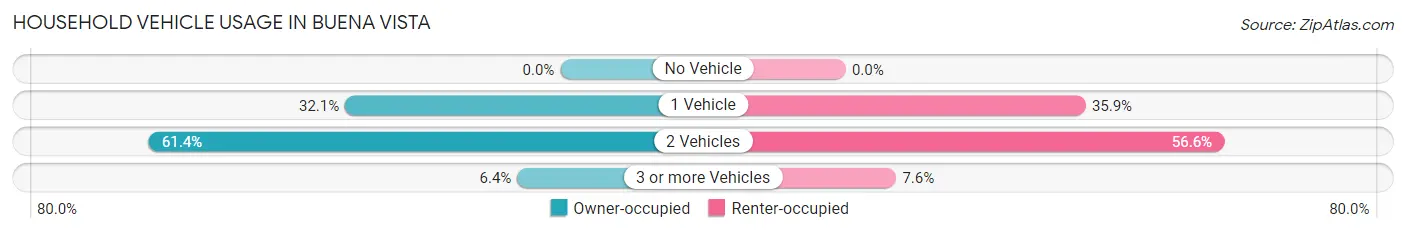
| Vehicles per Household | Owner-occupied | Renter-occupied |
| No Vehicle | 0 (0.0%) | 0 (0.0%) |
| 1 Vehicle | 45 (32.1%) | 38 (35.8%) |
| 2 Vehicles | 86 (61.4%) | 60 (56.6%) |
| 3 or more Vehicles | 9 (6.4%) | 8 (7.5%) |
| Total | 140 (100.0%) | 106 (100.0%) |
Real Estate & Mortgages in Buena Vista
Real Estate and Mortgage Overview in Buena Vista
| Characteristic | Without Mortgage | With Mortgage |
| Housing Units | 49 | 91 |
| Median Property Value | $237,100 | $191,000 |
| Median Household Income | $92,875 | $0 |
| Monthly Housing Costs | - | - |
| Real Estate Taxes | $1,371 | $0 |
Property Value by Mortgage Status in Buena Vista
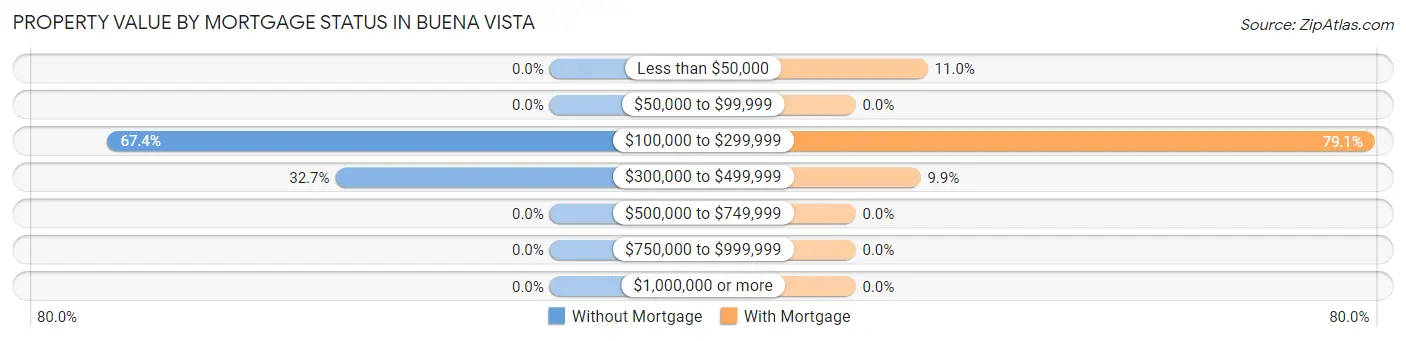
| Property Value | Without Mortgage | With Mortgage |
| Less than $50,000 | 0 (0.0%) | 10 (11.0%) |
| $50,000 to $99,999 | 0 (0.0%) | 0 (0.0%) |
| $100,000 to $299,999 | 33 (67.3%) | 72 (79.1%) |
| $300,000 to $499,999 | 16 (32.7%) | 9 (9.9%) |
| $500,000 to $749,999 | 0 (0.0%) | 0 (0.0%) |
| $750,000 to $999,999 | 0 (0.0%) | 0 (0.0%) |
| $1,000,000 or more | 0 (0.0%) | 0 (0.0%) |
| Total | 49 (100.0%) | 91 (100.0%) |
Household Income by Mortgage Status in Buena Vista
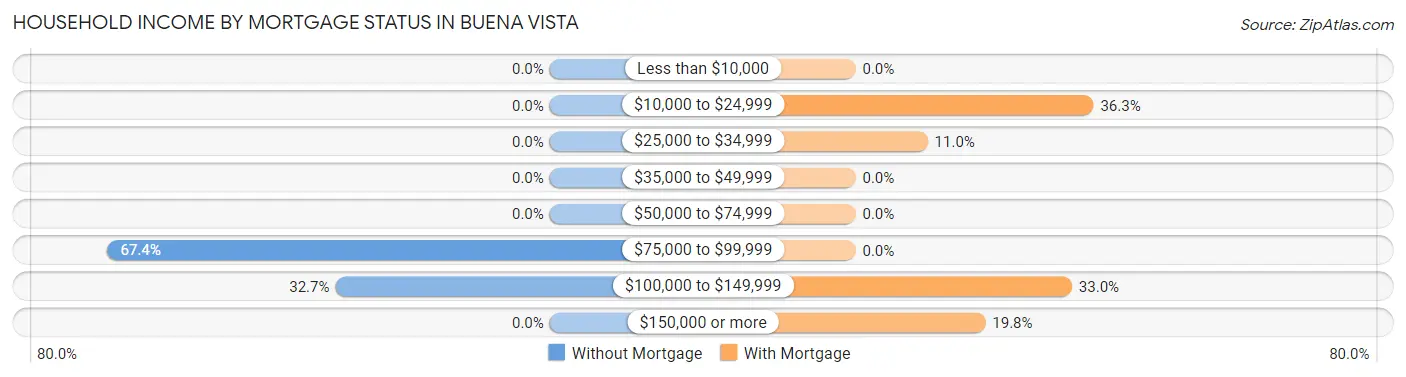
| Household Income | Without Mortgage | With Mortgage |
| Less than $10,000 | 0 (0.0%) | 0 (0.0%) |
| $10,000 to $24,999 | 0 (0.0%) | 33 (36.3%) |
| $25,000 to $34,999 | 0 (0.0%) | 10 (11.0%) |
| $35,000 to $49,999 | 0 (0.0%) | 0 (0.0%) |
| $50,000 to $74,999 | 0 (0.0%) | 0 (0.0%) |
| $75,000 to $99,999 | 33 (67.3%) | 0 (0.0%) |
| $100,000 to $149,999 | 16 (32.7%) | 30 (33.0%) |
| $150,000 or more | 0 (0.0%) | 18 (19.8%) |
| Total | 49 (100.0%) | 91 (100.0%) |
Property Value to Household Income Ratio in Buena Vista
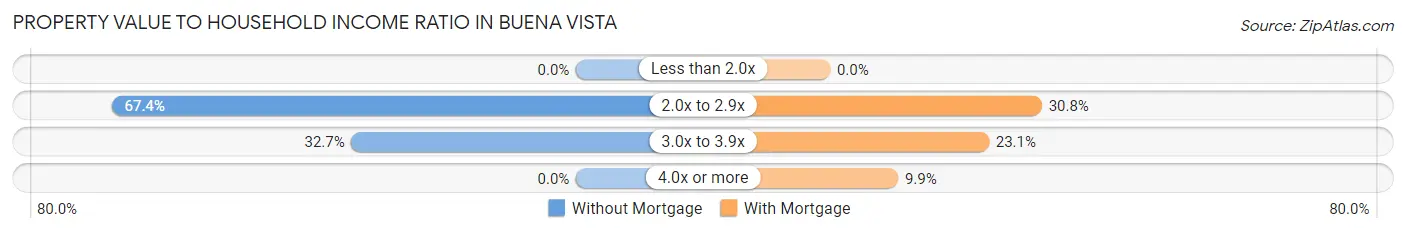
| Value-to-Income Ratio | Without Mortgage | With Mortgage |
| Less than 2.0x | 0 (0.0%) | 0 (0.0%) |
| 2.0x to 2.9x | 33 (67.3%) | 28 (30.8%) |
| 3.0x to 3.9x | 16 (32.7%) | 21 (23.1%) |
| 4.0x or more | 0 (0.0%) | 9 (9.9%) |
| Total | 49 (100.0%) | 91 (100.0%) |
Real Estate Taxes by Mortgage Status in Buena Vista
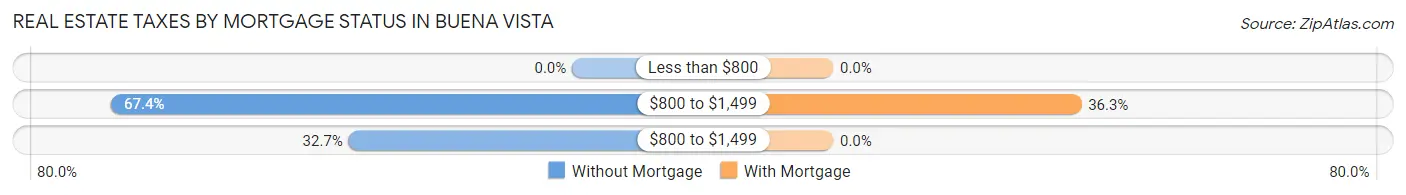
| Property Taxes | Without Mortgage | With Mortgage |
| Less than $800 | 0 (0.0%) | 0 (0.0%) |
| $800 to $1,499 | 33 (67.3%) | 33 (36.3%) |
| $800 to $1,499 | 16 (32.7%) | 0 (0.0%) |
| Total | 49 (100.0%) | 91 (100.0%) |
Health & Disability in Buena Vista
Health Insurance Coverage by Age in Buena Vista
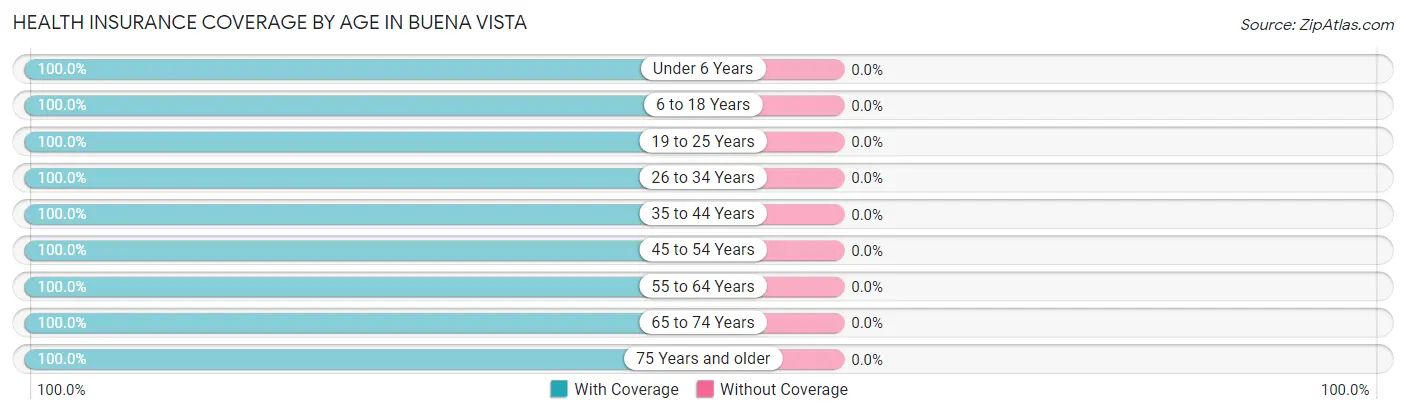
| Age Bracket | With Coverage | Without Coverage |
| Under 6 Years | 48 (100.0%) | 0 (0.0%) |
| 6 to 18 Years | 140 (100.0%) | 0 (0.0%) |
| 19 to 25 Years | 71 (100.0%) | 0 (0.0%) |
| 26 to 34 Years | 120 (100.0%) | 0 (0.0%) |
| 35 to 44 Years | 10 (100.0%) | 0 (0.0%) |
| 45 to 54 Years | 98 (100.0%) | 0 (0.0%) |
| 55 to 64 Years | 104 (100.0%) | 0 (0.0%) |
| 65 to 74 Years | 86 (100.0%) | 0 (0.0%) |
| 75 Years and older | 36 (100.0%) | 0 (0.0%) |
| Total | 713 (100.0%) | 0 (0.0%) |
Health Insurance Coverage by Citizenship Status in Buena Vista
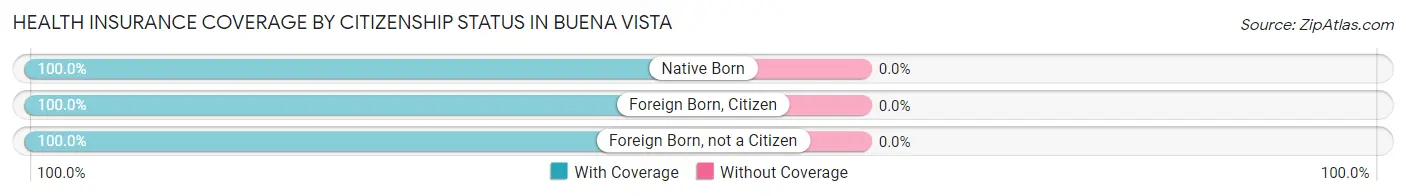
| Citizenship Status | With Coverage | Without Coverage |
| Native Born | 48 (100.0%) | 0 (0.0%) |
| Foreign Born, Citizen | 140 (100.0%) | 0 (0.0%) |
| Foreign Born, not a Citizen | 71 (100.0%) | 0 (0.0%) |
Health Insurance Coverage by Household Income in Buena Vista
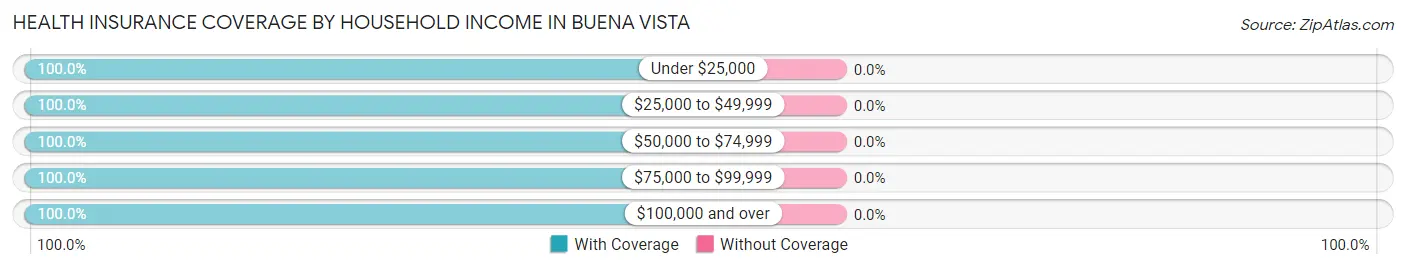
| Household Income | With Coverage | Without Coverage |
| Under $25,000 | 71 (100.0%) | 0 (0.0%) |
| $25,000 to $49,999 | 33 (100.0%) | 0 (0.0%) |
| $50,000 to $74,999 | 246 (100.0%) | 0 (0.0%) |
| $75,000 to $99,999 | 197 (100.0%) | 0 (0.0%) |
| $100,000 and over | 166 (100.0%) | 0 (0.0%) |
Public vs Private Health Insurance Coverage by Age in Buena Vista
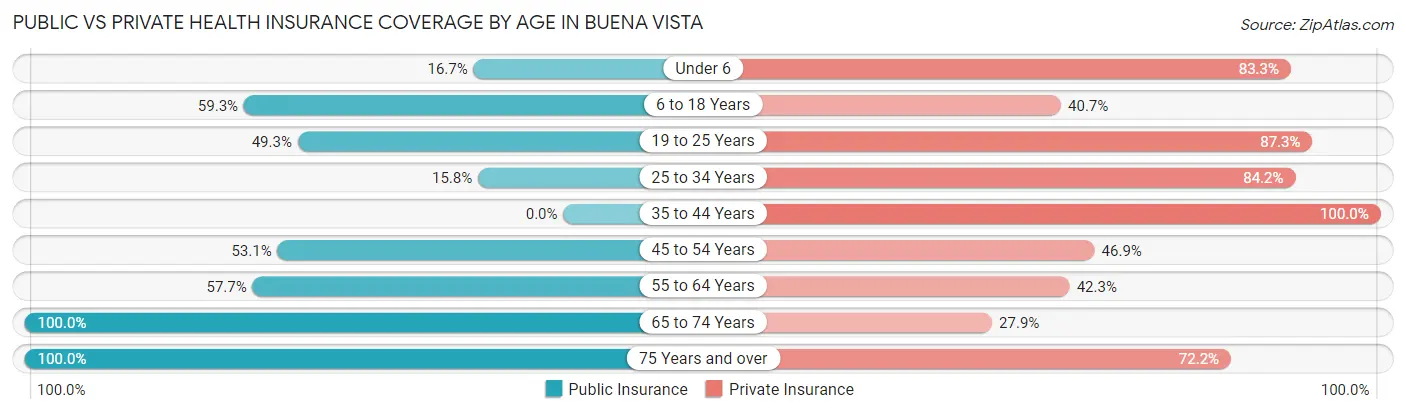
| Age Bracket | Public Insurance | Private Insurance |
| Under 6 | 8 (16.7%) | 40 (83.3%) |
| 6 to 18 Years | 83 (59.3%) | 57 (40.7%) |
| 19 to 25 Years | 35 (49.3%) | 62 (87.3%) |
| 25 to 34 Years | 19 (15.8%) | 101 (84.2%) |
| 35 to 44 Years | 0 (0.0%) | 10 (100.0%) |
| 45 to 54 Years | 52 (53.1%) | 46 (46.9%) |
| 55 to 64 Years | 60 (57.7%) | 44 (42.3%) |
| 65 to 74 Years | 86 (100.0%) | 24 (27.9%) |
| 75 Years and over | 36 (100.0%) | 26 (72.2%) |
| Total | 379 (53.2%) | 410 (57.5%) |
Disability Status by Sex by Age in Buena Vista
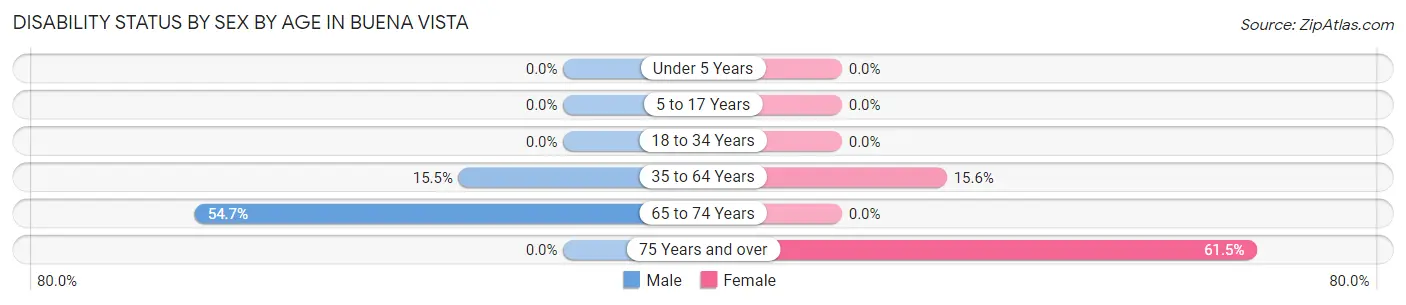
| Age Bracket | Male | Female |
| Under 5 Years | 0 (0.0%) | 0 (0.0%) |
| 5 to 17 Years | 0 (0.0%) | 0 (0.0%) |
| 18 to 34 Years | 0 (0.0%) | 0 (0.0%) |
| 35 to 64 Years | 9 (15.5%) | 24 (15.6%) |
| 65 to 74 Years | 29 (54.7%) | 0 (0.0%) |
| 75 Years and over | 0 (0.0%) | 16 (61.5%) |
Disability Class by Sex by Age in Buena Vista
Disability Class: Hearing Difficulty
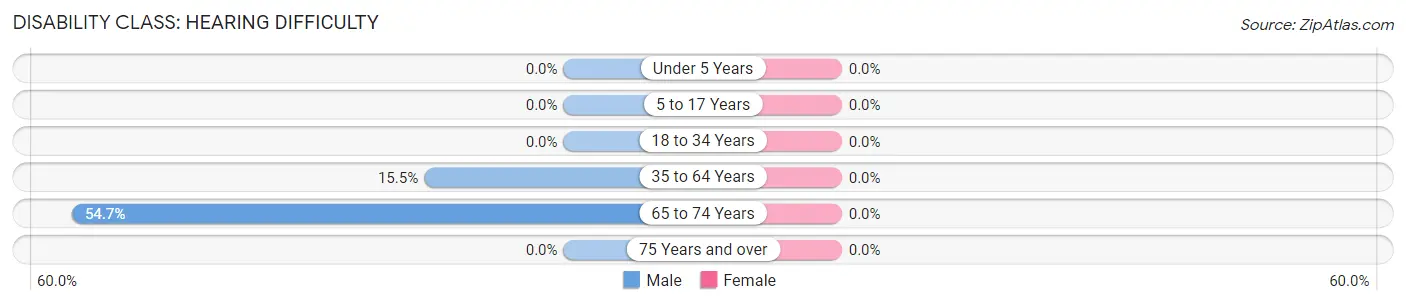
| Age Bracket | Male | Female |
| Under 5 Years | 0 (0.0%) | 0 (0.0%) |
| 5 to 17 Years | 0 (0.0%) | 0 (0.0%) |
| 18 to 34 Years | 0 (0.0%) | 0 (0.0%) |
| 35 to 64 Years | 9 (15.5%) | 0 (0.0%) |
| 65 to 74 Years | 29 (54.7%) | 0 (0.0%) |
| 75 Years and over | 0 (0.0%) | 0 (0.0%) |
Disability Class: Vision Difficulty
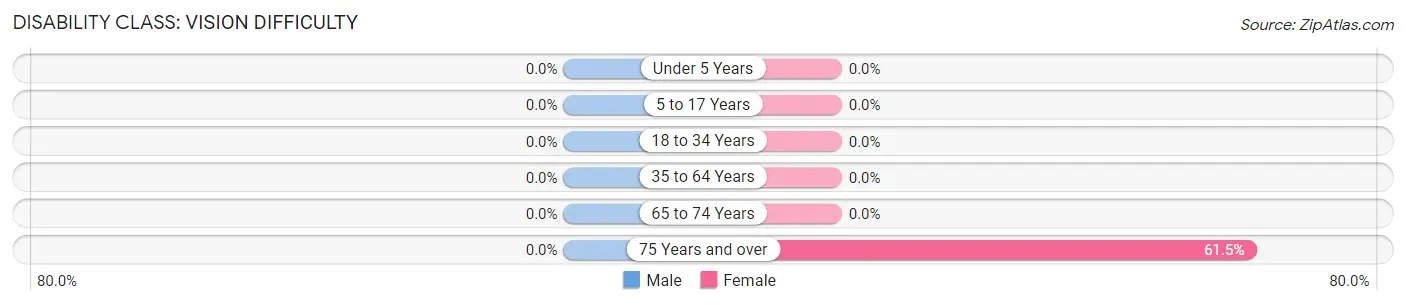
| Age Bracket | Male | Female |
| Under 5 Years | 0 (0.0%) | 0 (0.0%) |
| 5 to 17 Years | 0 (0.0%) | 0 (0.0%) |
| 18 to 34 Years | 0 (0.0%) | 0 (0.0%) |
| 35 to 64 Years | 0 (0.0%) | 0 (0.0%) |
| 65 to 74 Years | 0 (0.0%) | 0 (0.0%) |
| 75 Years and over | 0 (0.0%) | 16 (61.5%) |
Disability Class: Cognitive Difficulty

| Age Bracket | Male | Female |
| 5 to 17 Years | 0 (0.0%) | 0 (0.0%) |
| 18 to 34 Years | 0 (0.0%) | 0 (0.0%) |
| 35 to 64 Years | 9 (15.5%) | 24 (15.6%) |
| 65 to 74 Years | 0 (0.0%) | 0 (0.0%) |
| 75 Years and over | 0 (0.0%) | 16 (61.5%) |
Disability Class: Ambulatory Difficulty
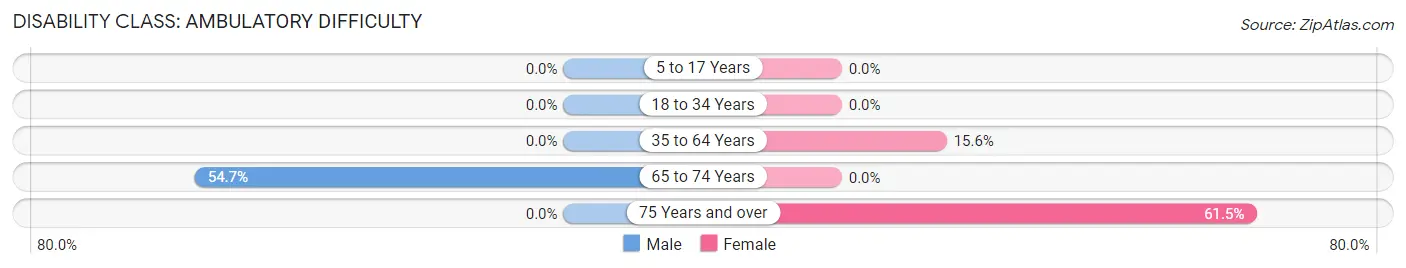
| Age Bracket | Male | Female |
| 5 to 17 Years | 0 (0.0%) | 0 (0.0%) |
| 18 to 34 Years | 0 (0.0%) | 0 (0.0%) |
| 35 to 64 Years | 0 (0.0%) | 24 (15.6%) |
| 65 to 74 Years | 29 (54.7%) | 0 (0.0%) |
| 75 Years and over | 0 (0.0%) | 16 (61.5%) |
Disability Class: Self-Care Difficulty
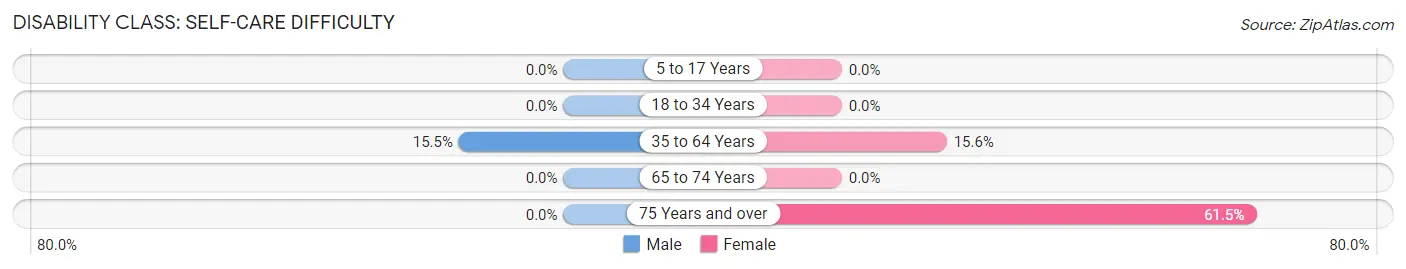
| Age Bracket | Male | Female |
| 5 to 17 Years | 0 (0.0%) | 0 (0.0%) |
| 18 to 34 Years | 0 (0.0%) | 0 (0.0%) |
| 35 to 64 Years | 9 (15.5%) | 24 (15.6%) |
| 65 to 74 Years | 0 (0.0%) | 0 (0.0%) |
| 75 Years and over | 0 (0.0%) | 16 (61.5%) |
Technology Access in Buena Vista
Computing Device Access in Buena Vista
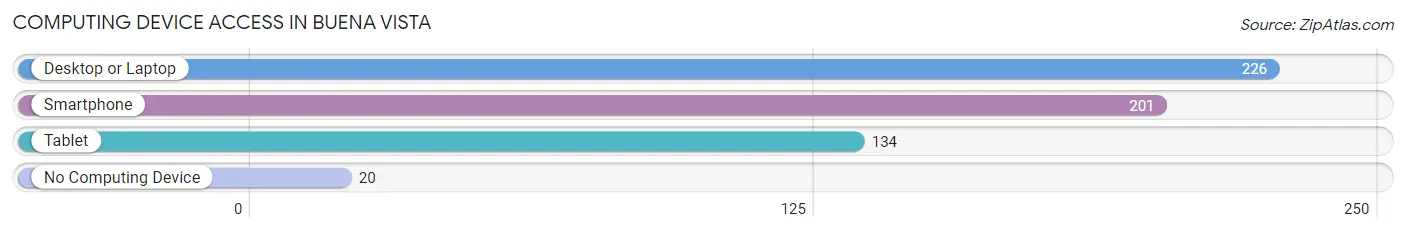
| Device Type | # Households | % Households |
| Desktop or Laptop | 226 | 91.9% |
| Smartphone | 201 | 81.7% |
| Tablet | 134 | 54.5% |
| No Computing Device | 20 | 8.1% |
| Total | 246 | 100.0% |
Internet Access in Buena Vista
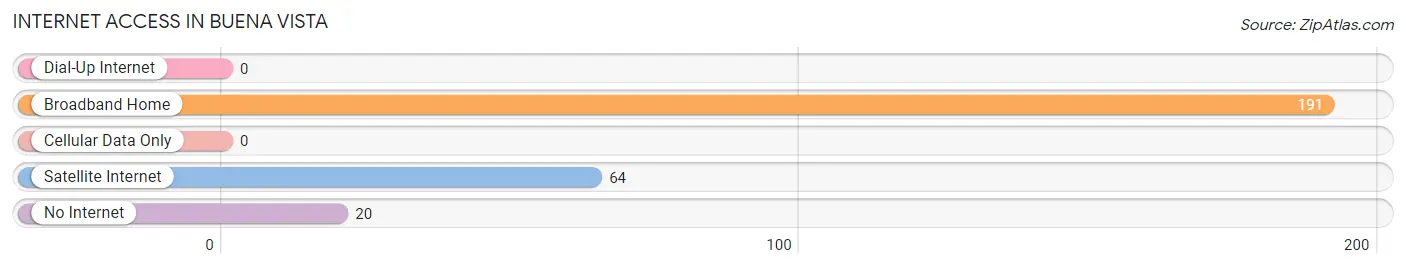
| Internet Type | # Households | % Households |
| Dial-Up Internet | 0 | 0.0% |
| Broadband Home | 191 | 77.6% |
| Cellular Data Only | 0 | 0.0% |
| Satellite Internet | 64 | 26.0% |
| No Internet | 20 | 8.1% |
| Total | 246 | 100.0% |
Buena Vista Summary
Buena Vista, California is a small unincorporated community located in the San Joaquin Valley of California. It is situated in Fresno County, approximately 20 miles south of Fresno and about 40 miles north of Bakersfield. The population of Buena Vista was estimated to be around 1,000 people in 2020.
History
The area that is now Buena Vista was originally inhabited by the Yokuts people, who were hunter-gatherers. The Yokuts were displaced by Spanish settlers in the late 18th century. The area was then part of the Rancho San Joaquin, a large land grant given to the Lugo family in 1844. The Lugo family sold the land to the Buena Vista Land Company in 1887, and the town of Buena Vista was established in 1888.
The town was named after the nearby Buena Vista Lake, which was named by the Spanish settlers for its beautiful views. The town was initially a farming community, with the main crops being wheat, barley, and alfalfa. The town also had a small lumber mill and a few stores.
In the early 20th century, the town began to grow as more people moved to the area. The population peaked in the 1950s, when it had around 1,500 people. Since then, the population has slowly declined as people have moved away from the area.
Geography
Buena Vista is located in the San Joaquin Valley of California, approximately 20 miles south of Fresno and 40 miles north of Bakersfield. The town is situated on the banks of the San Joaquin River, which flows through the valley. The town is surrounded by rolling hills and farmland.
The climate in Buena Vista is hot and dry in the summer, with temperatures reaching up to 100 degrees Fahrenheit. In the winter, temperatures can drop to freezing. The area receives an average of 10 inches of rain per year.
Economy
The economy of Buena Vista is largely based on agriculture. The main crops grown in the area are wheat, barley, alfalfa, and cotton. The town also has a few small businesses, including a gas station, a grocery store, and a few restaurants.
Demographics
The population of Buena Vista was estimated to be around 1,000 people in 2020. The town is predominantly Hispanic, with around 80% of the population identifying as Hispanic or Latino. The median household income in Buena Vista is around $30,000, which is lower than the national average. The town has a high poverty rate, with around 30% of the population living below the poverty line.
Common Questions
What is Per Capita Income in Buena Vista?
Per Capita income in Buena Vista is $31,814.
What is the Median Family Income in Buena Vista?
Median Family Income in Buena Vista is $83,641.
What is the Median Household income in Buena Vista?
Median Household Income in Buena Vista is $65,259.
What is Inequality or Gini Index in Buena Vista?
Inequality or Gini Index in Buena Vista is 0.30.
What is the Total Population of Buena Vista?
Total Population of Buena Vista is 713.
What is the Total Male Population of Buena Vista?
Total Male Population of Buena Vista is 231.
What is the Total Female Population of Buena Vista?
Total Female Population of Buena Vista is 482.
What is the Ratio of Males per 100 Females in Buena Vista?
There are 47.93 Males per 100 Females in Buena Vista.
What is the Ratio of Females per 100 Males in Buena Vista?
There are 208.66 Females per 100 Males in Buena Vista.
What is the Median Population Age in Buena Vista?
Median Population Age in Buena Vista is 34.4 Years.
What is the Average Family Size in Buena Vista
Average Family Size in Buena Vista is 3.6 People.
What is the Average Household Size in Buena Vista
Average Household Size in Buena Vista is 2.9 People.
How Large is the Labor Force in Buena Vista?
There are 375 People in the Labor Forcein in Buena Vista.
What is the Percentage of People in the Labor Force in Buena Vista?
61.4% of People are in the Labor Force in Buena Vista.
What is the Unemployment Rate in Buena Vista?
Unemployment Rate in Buena Vista is 7.5%.