Zip Codes with the Highest Percentage of Population Employed in Food Preparation & Serving in Oakland, CA
RELATED REPORTS & OPTIONS
Food Preparation & Serving
Oakland
Compare Zip Codes
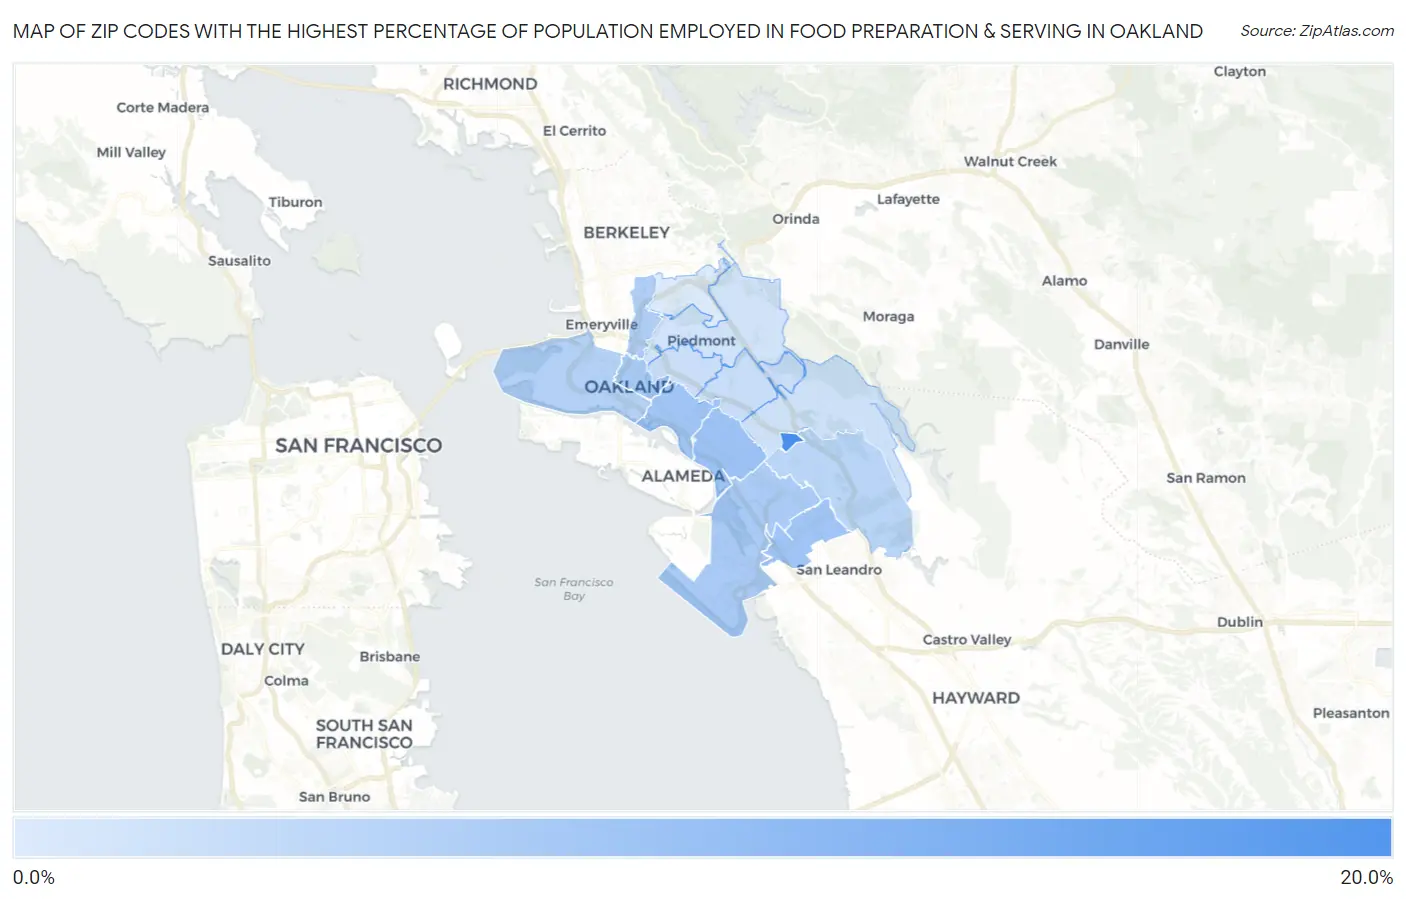
Map of Zip Codes with the Highest Percentage of Population Employed in Food Preparation & Serving in Oakland
1.2%
15.7%
Zip Codes with the Highest Percentage of Population Employed in Food Preparation & Serving in Oakland, CA
| Zip Code | % Employed | vs State | vs National | |
| 1. | 94613 | 15.7% | 5.4%(+10.3)#49 | 5.3%(+10.4)#891 |
| 2. | 94601 | 7.3% | 5.4%(+1.95)#294 | 5.3%(+2.05)#5,868 |
| 3. | 94606 | 6.8% | 5.4%(+1.45)#373 | 5.3%(+1.55)#6,979 |
| 4. | 94603 | 6.7% | 5.4%(+1.35)#396 | 5.3%(+1.44)#7,261 |
| 5. | 94612 | 6.1% | 5.4%(+0.685)#529 | 5.3%(+0.781)#9,120 |
| 6. | 94621 | 5.9% | 5.4%(+0.516)#562 | 5.3%(+0.613)#9,690 |
| 7. | 94609 | 5.5% | 5.4%(+0.118)#657 | 5.3%(+0.215)#11,063 |
| 8. | 94607 | 5.1% | 5.4%(-0.236)#739 | 5.3%(-0.140)#12,377 |
| 9. | 94605 | 4.3% | 5.4%(-1.07)#965 | 5.3%(-0.978)#15,859 |
| 10. | 94602 | 3.0% | 5.4%(-2.34)#1,212 | 5.3%(-2.24)#21,074 |
| 11. | 94610 | 2.8% | 5.4%(-2.55)#1,257 | 5.3%(-2.46)#21,963 |
| 12. | 94619 | 2.5% | 5.4%(-2.83)#1,302 | 5.3%(-2.74)#22,982 |
| 13. | 94611 | 2.2% | 5.4%(-3.18)#1,362 | 5.3%(-3.08)#24,083 |
| 14. | 94618 | 1.2% | 5.4%(-4.14)#1,454 | 5.3%(-4.04)#26,512 |
1
Common Questions
What are the Top 10 Zip Codes with the Highest Percentage of Population Employed in Food Preparation & Serving in Oakland, CA?
Top 10 Zip Codes with the Highest Percentage of Population Employed in Food Preparation & Serving in Oakland, CA are:
What zip code has the Highest Percentage of Population Employed in Food Preparation & Serving in Oakland, CA?
94613 has the Highest Percentage of Population Employed in Food Preparation & Serving in Oakland, CA with 15.7%.
What is the Percentage of Population Employed in Food Preparation & Serving in Oakland, CA?
Percentage of Population Employed in Food Preparation & Serving in Oakland is 4.7%.
What is the Percentage of Population Employed in Food Preparation & Serving in California?
Percentage of Population Employed in Food Preparation & Serving in California is 5.4%.
What is the Percentage of Population Employed in Food Preparation & Serving in the United States?
Percentage of Population Employed in Food Preparation & Serving in the United States is 5.3%.