Zip Codes with the Highest Percentage of Population Employed in Food Preparation & Serving in California
RELATED REPORTS & OPTIONS
Food Preparation & Serving
California
Compare Zip Codes
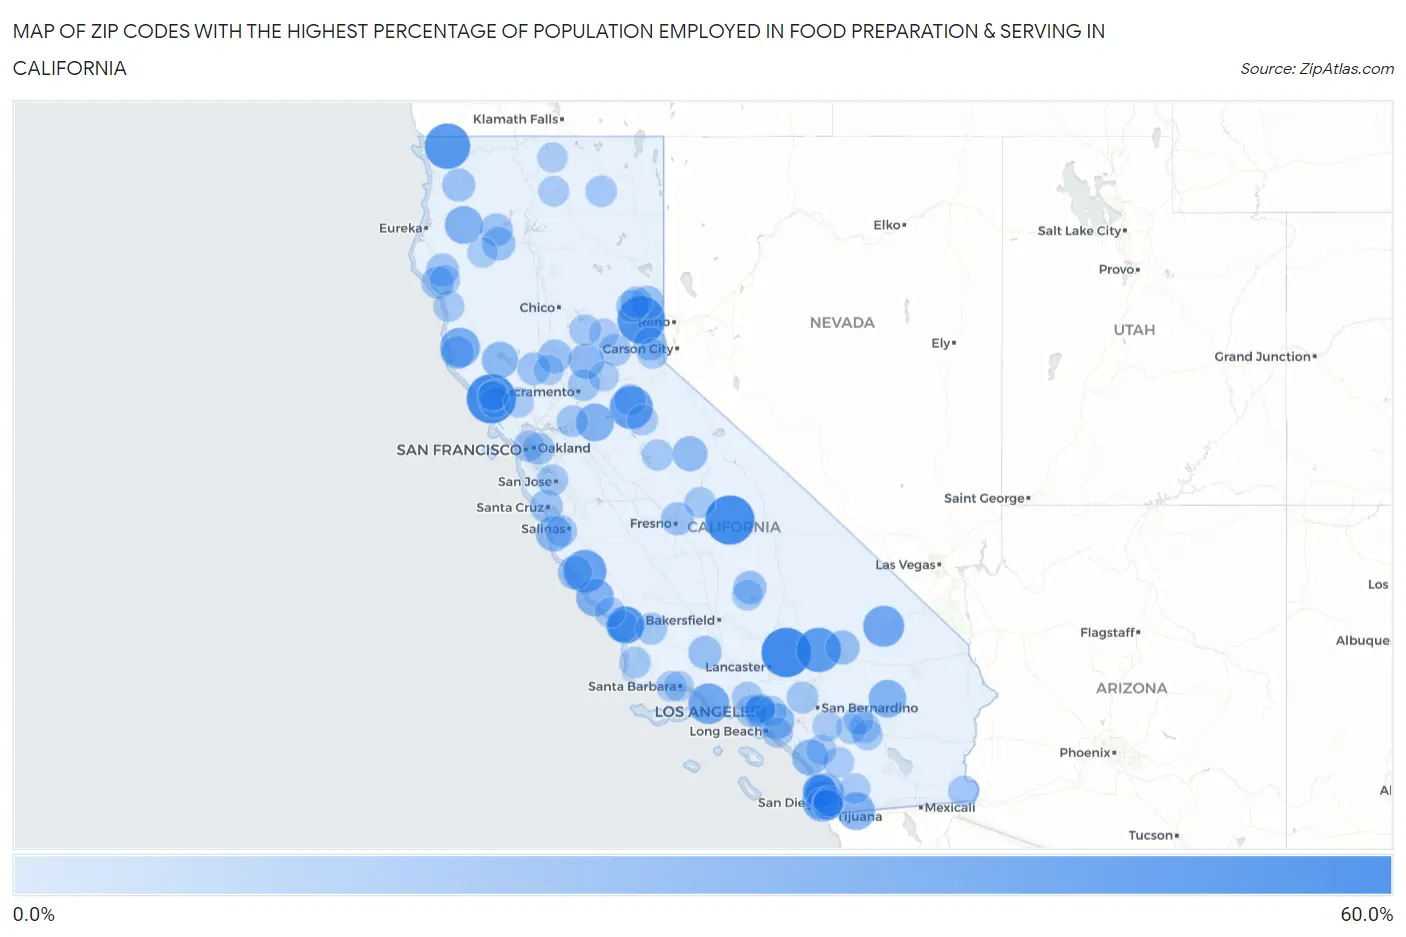
Map of Zip Codes with the Highest Percentage of Population Employed in Food Preparation & Serving in California
0.0%
60.0%
Zip Codes with the Highest Percentage of Population Employed in Food Preparation & Serving in California
| Zip Code | % Employed | vs State | vs National | |
| 1. | 93524 | 60.0% | 5.4%(+54.6)#1 | 5.3%(+54.7)#33 |
| 2. | 95486 | 59.3% | 5.4%(+53.9)#2 | 5.3%(+54.0)#34 |
| 3. | 93628 | 59.0% | 5.4%(+53.6)#3 | 5.3%(+53.7)#35 |
| 4. | 96126 | 55.0% | 5.4%(+49.6)#4 | 5.3%(+49.7)#42 |
| 5. | 95543 | 50.0% | 5.4%(+44.6)#5 | 5.3%(+44.7)#55 |
| 6. | 92347 | 47.3% | 5.4%(+41.9)#6 | 5.3%(+42.0)#66 |
| 7. | 95232 | 43.5% | 5.4%(+38.1)#7 | 5.3%(+38.2)#83 |
| 8. | 93928 | 42.6% | 5.4%(+37.3)#8 | 5.3%(+37.4)#90 |
| 9. | 92309 | 38.1% | 5.4%(+32.7)#9 | 5.3%(+32.8)#114 |
| 10. | 93043 | 37.5% | 5.4%(+32.1)#10 | 5.3%(+32.2)#122 |
| 11. | 92140 | 37.0% | 5.4%(+31.6)#11 | 5.3%(+31.7)#130 |
| 12. | 95463 | 34.6% | 5.4%(+29.2)#12 | 5.3%(+29.3)#155 |
| 13. | 92145 | 31.0% | 5.4%(+25.7)#13 | 5.3%(+25.7)#195 |
| 14. | 95563 | 30.2% | 5.4%(+24.8)#14 | 5.3%(+24.9)#205 |
| 15. | 95253 | 30.2% | 5.4%(+24.8)#15 | 5.3%(+24.9)#206 |
| 16. | 93452 | 29.9% | 5.4%(+24.5)#16 | 5.3%(+24.6)#213 |
| 17. | 91980 | 29.6% | 5.4%(+24.2)#17 | 5.3%(+24.3)#221 |
| 18. | 92278 | 29.5% | 5.4%(+24.2)#18 | 5.3%(+24.3)#222 |
| 19. | 93407 | 29.3% | 5.4%(+23.9)#19 | 5.3%(+24.0)#227 |
| 20. | 93410 | 27.1% | 5.4%(+21.7)#20 | 5.3%(+21.8)#261 |
| 21. | 95435 | 26.1% | 5.4%(+20.7)#21 | 5.3%(+20.8)#285 |
| 22. | 92055 | 25.9% | 5.4%(+20.5)#22 | 5.3%(+20.6)#290 |
| 23. | 90639 | 25.6% | 5.4%(+20.2)#23 | 5.3%(+20.3)#298 |
| 24. | 93944 | 24.4% | 5.4%(+19.1)#24 | 5.3%(+19.2)#327 |
| 25. | 95681 | 23.5% | 5.4%(+18.1)#25 | 5.3%(+18.2)#367 |
| 26. | 95389 | 22.9% | 5.4%(+17.5)#26 | 5.3%(+17.6)#385 |
| 27. | 92093 | 22.6% | 5.4%(+17.2)#27 | 5.3%(+17.3)#395 |
| 28. | 92398 | 21.0% | 5.4%(+15.6)#28 | 5.3%(+15.7)#461 |
| 29. | 93920 | 20.7% | 5.4%(+15.3)#29 | 5.3%(+15.4)#466 |
| 30. | 96105 | 19.2% | 5.4%(+13.8)#30 | 5.3%(+13.9)#550 |
| 31. | 95950 | 19.2% | 5.4%(+13.8)#31 | 5.3%(+13.9)#553 |
| 32. | 96146 | 18.7% | 5.4%(+13.4)#32 | 5.3%(+13.5)#589 |
| 33. | 93238 | 18.7% | 5.4%(+13.3)#33 | 5.3%(+13.4)#590 |
| 34. | 93222 | 18.7% | 5.4%(+13.3)#34 | 5.3%(+13.4)#591 |
| 35. | 96024 | 18.7% | 5.4%(+13.3)#35 | 5.3%(+13.4)#595 |
| 36. | 92092 | 18.4% | 5.4%(+13.0)#36 | 5.3%(+13.1)#619 |
| 37. | 95432 | 18.3% | 5.4%(+12.9)#37 | 5.3%(+13.0)#624 |
| 38. | 95556 | 18.2% | 5.4%(+12.8)#38 | 5.3%(+12.9)#634 |
| 39. | 93740 | 18.2% | 5.4%(+12.8)#39 | 5.3%(+12.9)#636 |
| 40. | 96093 | 18.2% | 5.4%(+12.8)#40 | 5.3%(+12.9)#637 |
| 41. | 95064 | 17.7% | 5.4%(+12.3)#41 | 5.3%(+12.4)#680 |
| 42. | 95553 | 17.5% | 5.4%(+12.1)#42 | 5.3%(+12.2)#706 |
| 43. | 95679 | 17.3% | 5.4%(+11.9)#43 | 5.3%(+12.0)#721 |
| 44. | 96106 | 17.0% | 5.4%(+11.6)#44 | 5.3%(+11.7)#755 |
| 45. | 95589 | 16.7% | 5.4%(+11.3)#45 | 5.3%(+11.4)#772 |
| 46. | 95717 | 16.3% | 5.4%(+10.9)#46 | 5.3%(+11.0)#819 |
| 47. | 92135 | 15.8% | 5.4%(+10.4)#47 | 5.3%(+10.5)#883 |
| 48. | 93405 | 15.8% | 5.4%(+10.4)#48 | 5.3%(+10.5)#885 |
| 49. | 94613 | 15.7% | 5.4%(+10.3)#49 | 5.3%(+10.4)#891 |
| 50. | 92358 | 15.2% | 5.4%(+9.87)#50 | 5.3%(+9.96)#951 |
| 51. | 96122 | 15.1% | 5.4%(+9.73)#51 | 5.3%(+9.82)#967 |
| 52. | 95689 | 15.1% | 5.4%(+9.70)#52 | 5.3%(+9.80)#970 |
| 53. | 93453 | 15.0% | 5.4%(+9.65)#53 | 5.3%(+9.75)#980 |
| 54. | 95652 | 15.0% | 5.4%(+9.58)#54 | 5.3%(+9.68)#985 |
| 55. | 90005 | 14.8% | 5.4%(+9.43)#55 | 5.3%(+9.52)#1,006 |
| 56. | 95641 | 14.7% | 5.4%(+9.29)#56 | 5.3%(+9.39)#1,036 |
| 57. | 93437 | 14.5% | 5.4%(+9.10)#57 | 5.3%(+9.19)#1,063 |
| 58. | 90073 | 14.3% | 5.4%(+8.90)#58 | 5.3%(+9.00)#1,096 |
| 59. | 95053 | 14.2% | 5.4%(+8.85)#59 | 5.3%(+8.95)#1,115 |
| 60. | 93955 | 14.2% | 5.4%(+8.80)#60 | 5.3%(+8.90)#1,125 |
| 61. | 95914 | 14.1% | 5.4%(+8.75)#61 | 5.3%(+8.84)#1,139 |
| 62. | 96054 | 14.1% | 5.4%(+8.74)#62 | 5.3%(+8.83)#1,141 |
| 63. | 95311 | 13.8% | 5.4%(+8.43)#63 | 5.3%(+8.52)#1,204 |
| 64. | 91330 | 13.7% | 5.4%(+8.35)#64 | 5.3%(+8.44)#1,224 |
| 65. | 94130 | 13.7% | 5.4%(+8.33)#65 | 5.3%(+8.43)#1,230 |
| 66. | 92283 | 13.7% | 5.4%(+8.29)#66 | 5.3%(+8.39)#1,239 |
| 67. | 93602 | 13.6% | 5.4%(+8.26)#67 | 5.3%(+8.35)#1,243 |
| 68. | 95488 | 13.2% | 5.4%(+7.78)#68 | 5.3%(+7.87)#1,355 |
| 69. | 93285 | 13.1% | 5.4%(+7.73)#69 | 5.3%(+7.83)#1,366 |
| 70. | 90006 | 13.1% | 5.4%(+7.72)#70 | 5.3%(+7.81)#1,369 |
| 71. | 92113 | 12.7% | 5.4%(+7.29)#71 | 5.3%(+7.39)#1,477 |
| 72. | 92234 | 12.6% | 5.4%(+7.22)#72 | 5.3%(+7.31)#1,492 |
| 73. | 91755 | 12.6% | 5.4%(+7.22)#73 | 5.3%(+7.31)#1,493 |
| 74. | 96057 | 12.5% | 5.4%(+7.12)#74 | 5.3%(+7.21)#1,513 |
| 75. | 95233 | 12.3% | 5.4%(+6.90)#75 | 5.3%(+6.99)#1,571 |
| 76. | 92136 | 12.1% | 5.4%(+6.76)#76 | 5.3%(+6.85)#1,618 |
| 77. | 92061 | 12.0% | 5.4%(+6.61)#77 | 5.3%(+6.70)#1,672 |
| 78. | 92655 | 11.9% | 5.4%(+6.55)#78 | 5.3%(+6.65)#1,693 |
| 79. | 96041 | 11.9% | 5.4%(+6.55)#79 | 5.3%(+6.65)#1,694 |
| 80. | 91916 | 11.9% | 5.4%(+6.53)#80 | 5.3%(+6.63)#1,700 |
| 81. | 92260 | 11.8% | 5.4%(+6.41)#81 | 5.3%(+6.51)#1,737 |
| 82. | 92105 | 11.8% | 5.4%(+6.40)#82 | 5.3%(+6.49)#1,740 |
| 83. | 93430 | 11.7% | 5.4%(+6.33)#83 | 5.3%(+6.43)#1,768 |
| 84. | 92590 | 11.7% | 5.4%(+6.32)#84 | 5.3%(+6.42)#1,774 |
| 85. | 95419 | 11.7% | 5.4%(+6.28)#85 | 5.3%(+6.38)#1,788 |
| 86. | 95471 | 11.6% | 5.4%(+6.24)#86 | 5.3%(+6.33)#1,810 |
| 87. | 93106 | 11.6% | 5.4%(+6.18)#87 | 5.3%(+6.27)#1,827 |
| 88. | 93109 | 11.6% | 5.4%(+6.18)#88 | 5.3%(+6.27)#1,828 |
| 89. | 95937 | 11.5% | 5.4%(+6.16)#89 | 5.3%(+6.25)#1,833 |
| 90. | 92549 | 11.5% | 5.4%(+6.13)#90 | 5.3%(+6.23)#1,842 |
| 91. | 90029 | 11.4% | 5.4%(+6.05)#91 | 5.3%(+6.15)#1,862 |
| 92. | 95960 | 11.4% | 5.4%(+6.05)#92 | 5.3%(+6.14)#1,864 |
| 93. | 95542 | 11.4% | 5.4%(+6.04)#93 | 5.3%(+6.14)#1,867 |
| 94. | 96058 | 11.3% | 5.4%(+5.94)#94 | 5.3%(+6.03)#1,907 |
| 95. | 95664 | 11.3% | 5.4%(+5.93)#95 | 5.3%(+6.03)#1,912 |
| 96. | 92567 | 11.3% | 5.4%(+5.93)#96 | 5.3%(+6.03)#1,914 |
| 97. | 95446 | 11.3% | 5.4%(+5.90)#97 | 5.3%(+6.00)#1,922 |
| 98. | 95452 | 11.3% | 5.4%(+5.87)#98 | 5.3%(+5.97)#1,935 |
| 99. | 96141 | 11.3% | 5.4%(+5.87)#99 | 5.3%(+5.96)#1,937 |
| 100. | 92258 | 11.2% | 5.4%(+5.82)#100 | 5.3%(+5.92)#1,957 |
Common Questions
What are the Top 10 Zip Codes with the Highest Percentage of Population Employed in Food Preparation & Serving in California?
Top 10 Zip Codes with the Highest Percentage of Population Employed in Food Preparation & Serving in California are:
What zip code has the Highest Percentage of Population Employed in Food Preparation & Serving in California?
93524 has the Highest Percentage of Population Employed in Food Preparation & Serving in California with 60.0%.
What is the Percentage of Population Employed in Food Preparation & Serving in the State of California?
Percentage of Population Employed in Food Preparation & Serving in California is 5.4%.
What is the Percentage of Population Employed in Food Preparation & Serving in the United States?
Percentage of Population Employed in Food Preparation & Serving in the United States is 5.3%.