Salton Sea Beach, CA Map & Demographics
Salton Sea Beach Map
Salton Sea Beach Overview
$17,165
PER CAPITA INCOME
0.38
INEQUALITY / GINI INDEX
186
TOTAL POPULATION
92
MALE POPULATION
94
FEMALE POPULATION
97.87
MALES / 100 FEMALES
102.17
FEMALES / 100 MALES
45.5
MEDIAN AGE
2.6
AVG FAMILY SIZE
1.8
AVG HOUSEHOLD SIZE
104
LABOR FORCE [ PEOPLE ]
55.9%
PERCENT IN LABOR FORCE
49.0%
UNEMPLOYMENT RATE
Income in Salton Sea Beach
Income Overview in Salton Sea Beach
| Characteristic | Number | Measure |
| Per Capita Income | 186 | $17,165 |
| Median Family Income | 52 | $0 |
| Mean Family Income | 52 | $48,227 |
| Median Household Income | 103 | $0 |
| Mean Household Income | 103 | $31,099 |
| Income Deficit | 52 | $0 |
| Wage / Income Gap (%) | 186 | 0.00% |
| Wage / Income Gap ($) | 186 | 100.00¢ per $1 |
| Gini / Inequality Index | 186 | 0.38 |
Earnings by Sex in Salton Sea Beach
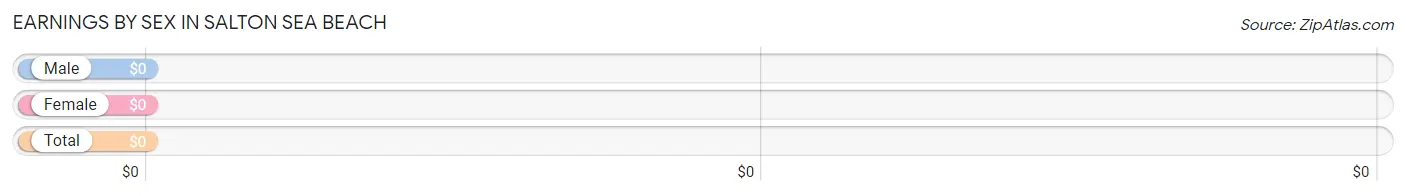
| Sex | Number | Average Earnings |
| Male | 40 (74.1%) | $0 |
| Female | 14 (25.9%) | $0 |
| Total | 54 (100.0%) | $0 |
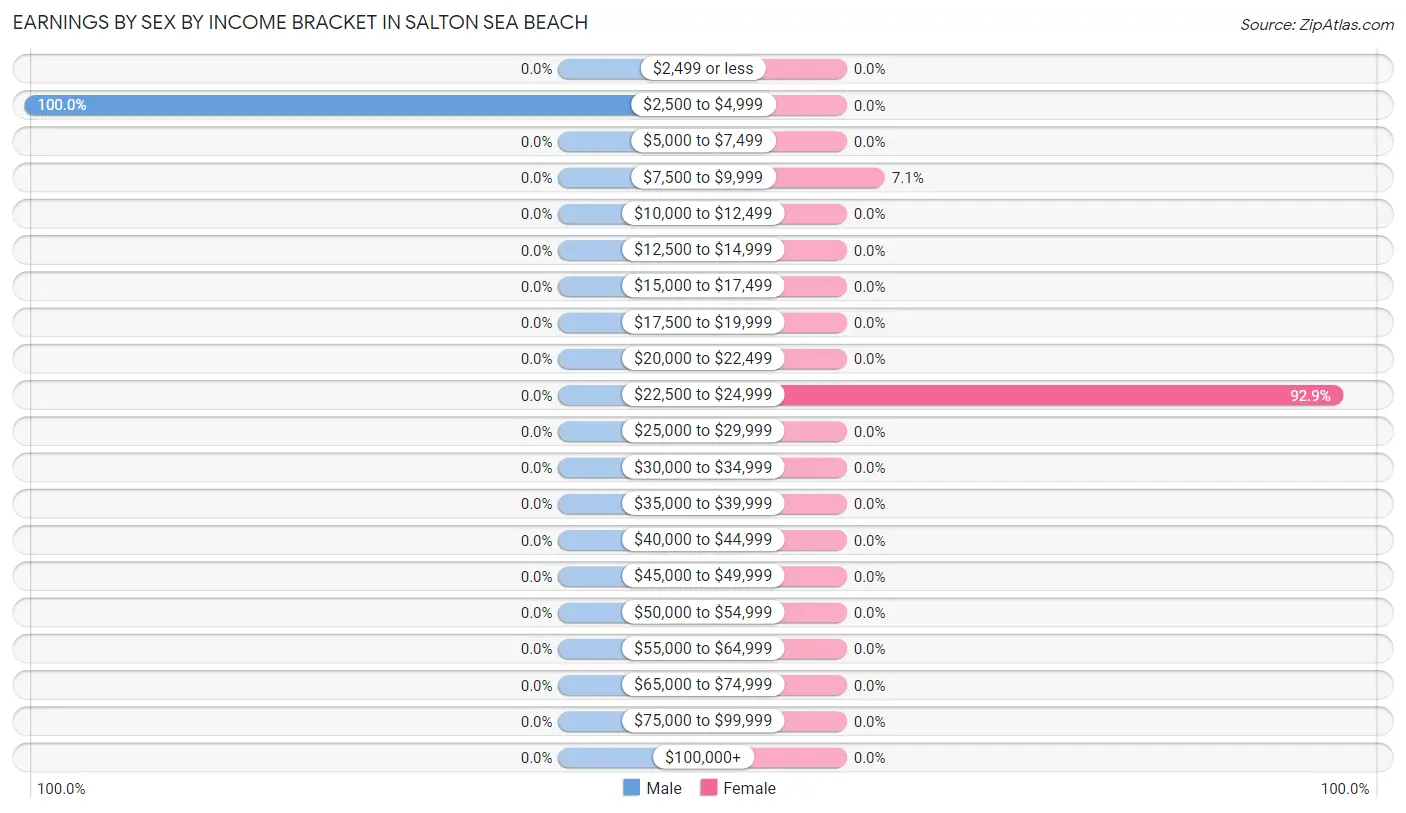
Earnings by Sex by Income Bracket in Salton Sea Beach
The most common earnings brackets in Salton Sea Beach are $2,500 to $4,999 for men (40 | 100.0%) and $22,500 to $24,999 for women (13 | 92.9%).
| Income | Male | Female |
| $2,499 or less | 0 (0.0%) | 0 (0.0%) |
| $2,500 to $4,999 | 40 (100.0%) | 0 (0.0%) |
| $5,000 to $7,499 | 0 (0.0%) | 0 (0.0%) |
| $7,500 to $9,999 | 0 (0.0%) | 1 (7.1%) |
| $10,000 to $12,499 | 0 (0.0%) | 0 (0.0%) |
| $12,500 to $14,999 | 0 (0.0%) | 0 (0.0%) |
| $15,000 to $17,499 | 0 (0.0%) | 0 (0.0%) |
| $17,500 to $19,999 | 0 (0.0%) | 0 (0.0%) |
| $20,000 to $22,499 | 0 (0.0%) | 0 (0.0%) |
| $22,500 to $24,999 | 0 (0.0%) | 13 (92.9%) |
| $25,000 to $29,999 | 0 (0.0%) | 0 (0.0%) |
| $30,000 to $34,999 | 0 (0.0%) | 0 (0.0%) |
| $35,000 to $39,999 | 0 (0.0%) | 0 (0.0%) |
| $40,000 to $44,999 | 0 (0.0%) | 0 (0.0%) |
| $45,000 to $49,999 | 0 (0.0%) | 0 (0.0%) |
| $50,000 to $54,999 | 0 (0.0%) | 0 (0.0%) |
| $55,000 to $64,999 | 0 (0.0%) | 0 (0.0%) |
| $65,000 to $74,999 | 0 (0.0%) | 0 (0.0%) |
| $75,000 to $99,999 | 0 (0.0%) | 0 (0.0%) |
| $100,000+ | 0 (0.0%) | 0 (0.0%) |
| Total | 40 (100.0%) | 14 (100.0%) |
Earnings by Sex by Educational Attainment in Salton Sea Beach
| Educational Attainment | Male Income | Female Income |
| Less than High School | - | - |
| High School Diploma | - | - |
| College or Associate's Degree | - | - |
| Bachelor's Degree | - | - |
| Graduate Degree | - | - |
| Total | - | - |
Family Income in Salton Sea Beach
Family Income Brackets in Salton Sea Beach
According to the Salton Sea Beach family income data, there are 27 families falling into the $50,000 to $74,999 income range, which is the most common income bracket and makes up 51.9% of all families.
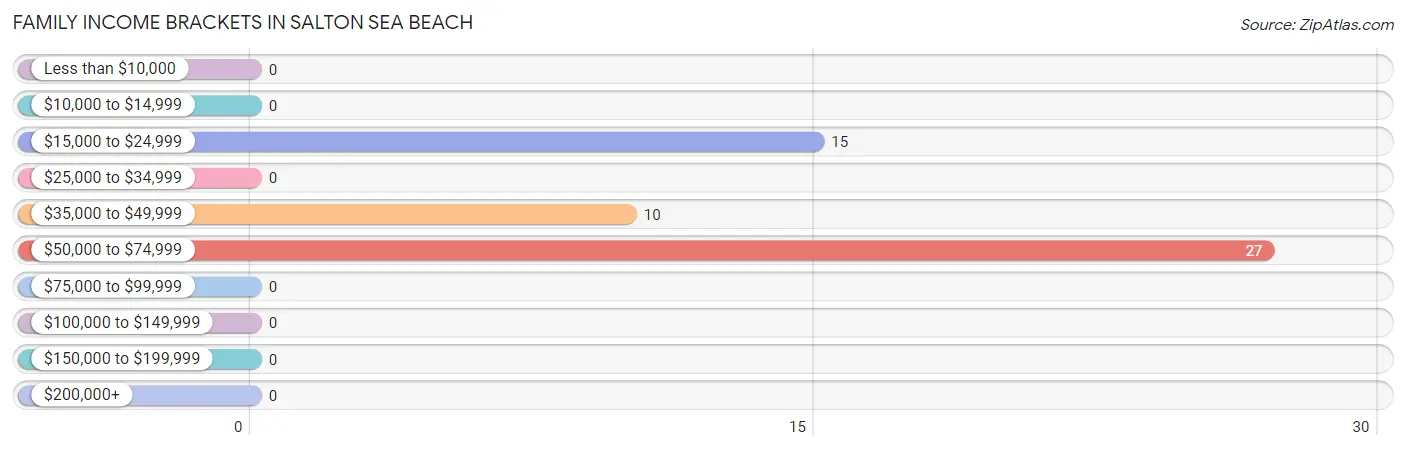
| Income Bracket | # Families | % Families |
| Less than $10,000 | 0 | 0.0% |
| $10,000 to $14,999 | 0 | 0.0% |
| $15,000 to $24,999 | 15 | 28.8% |
| $25,000 to $34,999 | 0 | 0.0% |
| $35,000 to $49,999 | 10 | 19.2% |
| $50,000 to $74,999 | 27 | 51.9% |
| $75,000 to $99,999 | 0 | 0.0% |
| $100,000 to $149,999 | 0 | 0.0% |
| $150,000 to $199,999 | 0 | 0.0% |
| $200,000+ | 0 | 0.0% |
Family Income by Famaliy Size in Salton Sea Beach
2-person families (37 | 71.2%) account for the highest median family income in Salton Sea Beach with $66,635 per family, while 2-person families (37 | 71.2%) have the highest median income of $33,318 per family member.
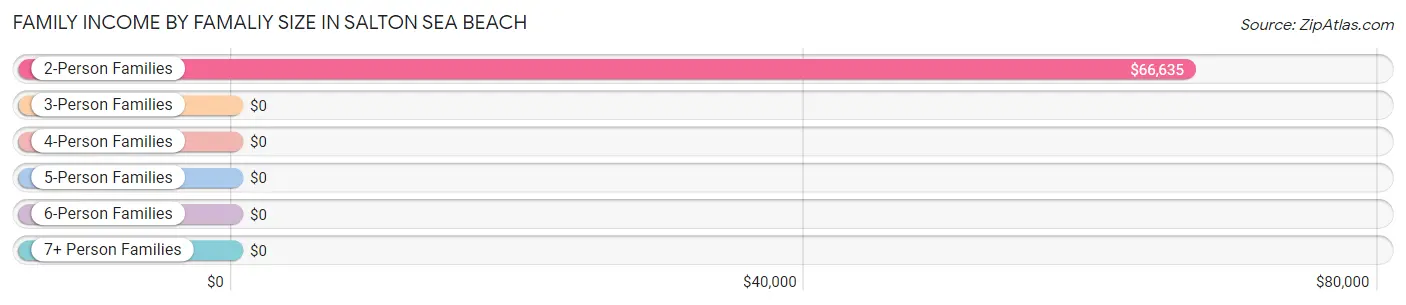
| Income Bracket | # Families | Median Income |
| 2-Person Families | 37 (71.2%) | $66,635 |
| 3-Person Families | 15 (28.8%) | $0 |
| 4-Person Families | 0 (0.0%) | $0 |
| 5-Person Families | 0 (0.0%) | $0 |
| 6-Person Families | 0 (0.0%) | $0 |
| 7+ Person Families | 0 (0.0%) | $0 |
| Total | 52 (100.0%) | $0 |
Family Income by Number of Earners in Salton Sea Beach
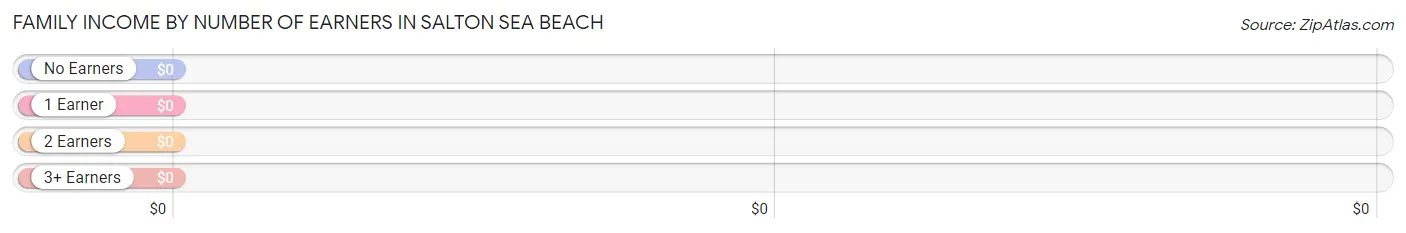
| Number of Earners | # Families | Median Income |
| No Earners | 24 (46.2%) | $0 |
| 1 Earner | 28 (53.8%) | $0 |
| 2 Earners | 0 (0.0%) | $0 |
| 3+ Earners | 0 (0.0%) | $0 |
| Total | 52 (100.0%) | $0 |
Household Income in Salton Sea Beach
Household Income Brackets in Salton Sea Beach
With 51 households falling in the category, the $10,000 to $14,999 income range is the most frequent in Salton Sea Beach, accounting for 49.5% of all households.
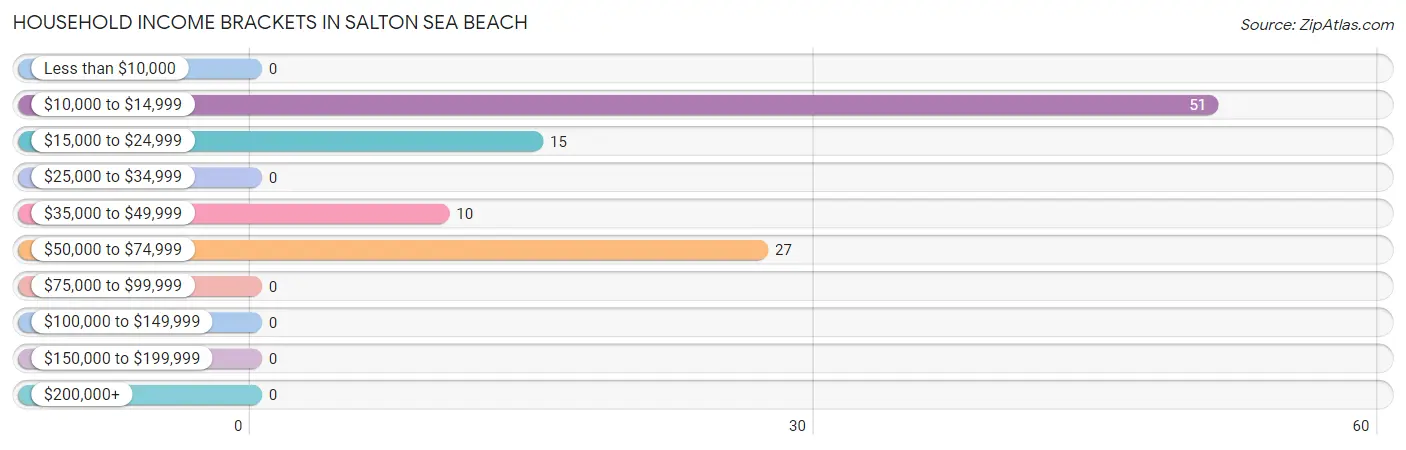
| Income Bracket | # Households | % Households |
| Less than $10,000 | 0 | 0.0% |
| $10,000 to $14,999 | 51 | 49.5% |
| $15,000 to $24,999 | 15 | 14.6% |
| $25,000 to $34,999 | 0 | 0.0% |
| $35,000 to $49,999 | 10 | 9.7% |
| $50,000 to $74,999 | 27 | 26.2% |
| $75,000 to $99,999 | 0 | 0.0% |
| $100,000 to $149,999 | 0 | 0.0% |
| $150,000 to $199,999 | 0 | 0.0% |
| $200,000+ | 0 | 0.0% |
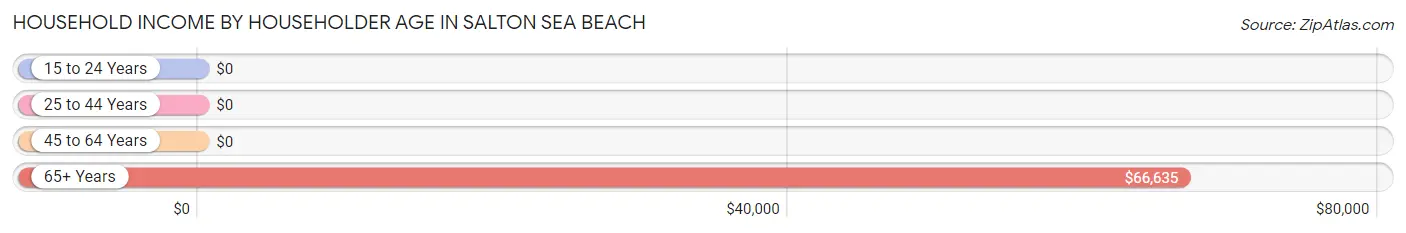
Household Income by Householder Age in Salton Sea Beach
The median household income in Salton Sea Beach is $0, with the highest median household income of $66,635 found in the 65+ years age bracket for the primary householder. A total of 37 households (35.9%) fall into this category.
| Income Bracket | # Households | Median Income |
| 15 to 24 Years | 0 (0.0%) | $0 |
| 25 to 44 Years | 51 (49.5%) | $0 |
| 45 to 64 Years | 15 (14.6%) | $0 |
| 65+ Years | 37 (35.9%) | $66,635 |
| Total | 103 (100.0%) | $0 |
Poverty in Salton Sea Beach
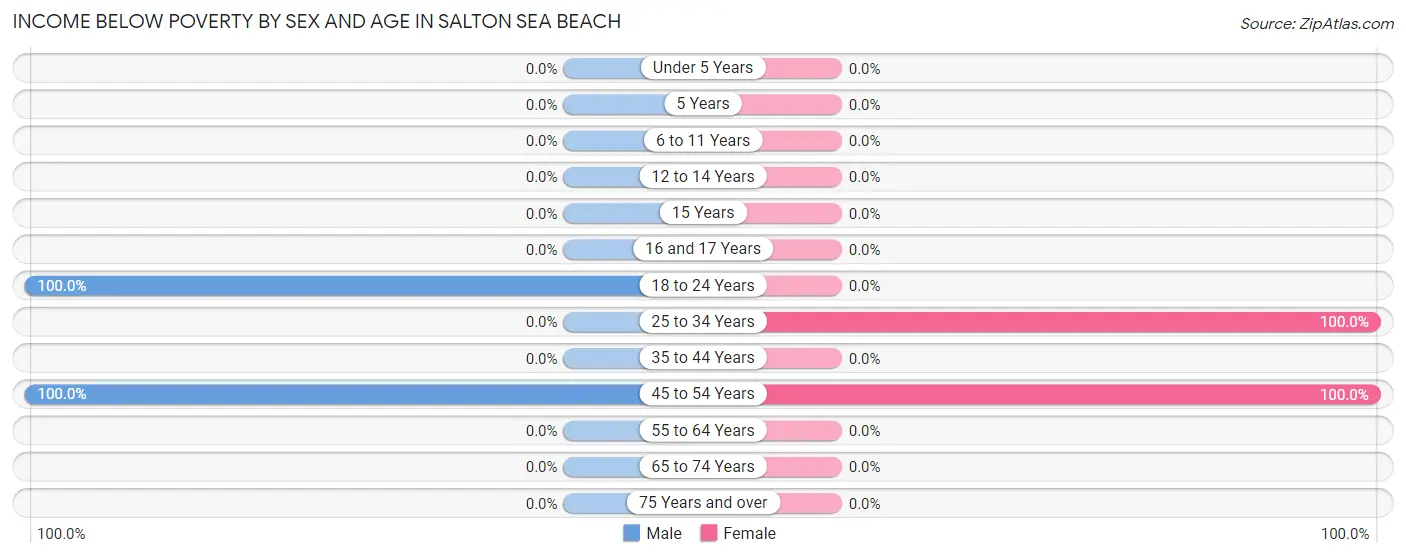
Income Below Poverty by Sex and Age in Salton Sea Beach
With 59.8% poverty level for males and 64.1% for females among the residents of Salton Sea Beach, 18 to 24 year old males and 25 to 34 year old females are the most vulnerable to poverty, with 40 males (100.0%) and 51 females (100.0%) in their respective age groups living below the poverty level.
| Age Bracket | Male | Female |
| Under 5 Years | 0 (0.0%) | 0 (0.0%) |
| 5 Years | 0 (0.0%) | 0 (0.0%) |
| 6 to 11 Years | 0 (0.0%) | 0 (0.0%) |
| 12 to 14 Years | 0 (0.0%) | 0 (0.0%) |
| 15 Years | 0 (0.0%) | 0 (0.0%) |
| 16 and 17 Years | 0 (0.0%) | 0 (0.0%) |
| 18 to 24 Years | 40 (100.0%) | 0 (0.0%) |
| 25 to 34 Years | 0 (0.0%) | 51 (100.0%) |
| 35 to 44 Years | 0 (0.0%) | 0 (0.0%) |
| 45 to 54 Years | 15 (100.0%) | 8 (100.0%) |
| 55 to 64 Years | 0 (0.0%) | 0 (0.0%) |
| 65 to 74 Years | 0 (0.0%) | 0 (0.0%) |
| 75 Years and over | 0 (0.0%) | 0 (0.0%) |
| Total | 55 (59.8%) | 59 (64.1%) |
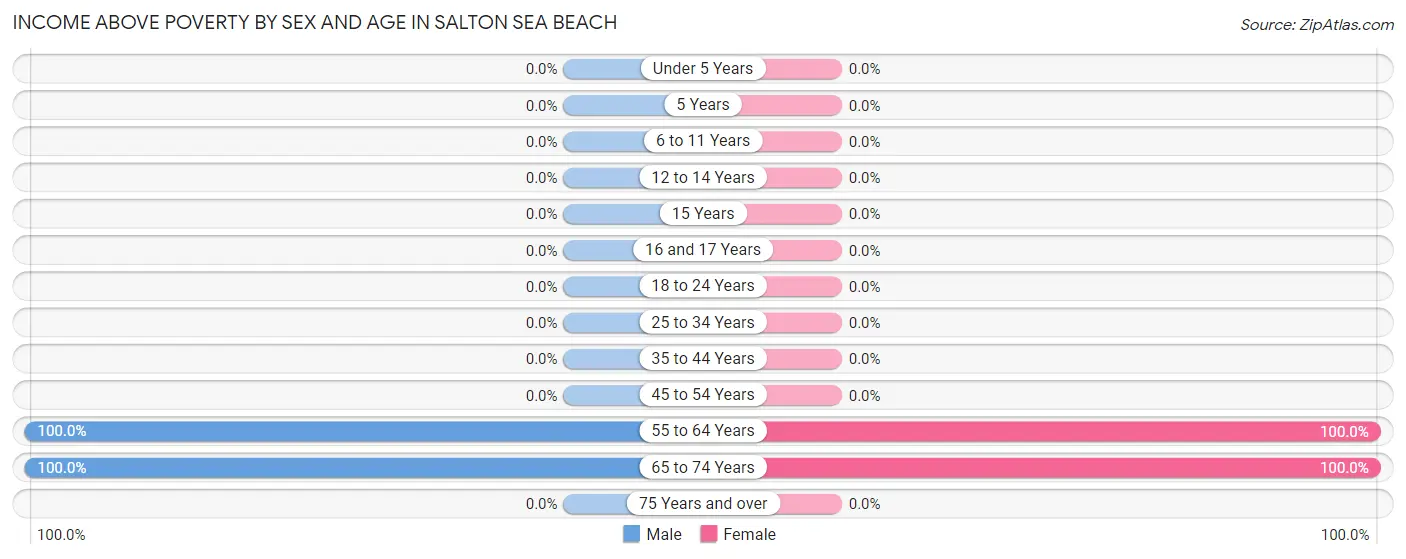
Income Above Poverty by Sex and Age in Salton Sea Beach
According to the poverty statistics in Salton Sea Beach, males aged 55 to 64 years and females aged 55 to 64 years are the age groups that are most secure financially, with 100.0% of males and 100.0% of females in these age groups living above the poverty line.
| Age Bracket | Male | Female |
| Under 5 Years | 0 (0.0%) | 0 (0.0%) |
| 5 Years | 0 (0.0%) | 0 (0.0%) |
| 6 to 11 Years | 0 (0.0%) | 0 (0.0%) |
| 12 to 14 Years | 0 (0.0%) | 0 (0.0%) |
| 15 Years | 0 (0.0%) | 0 (0.0%) |
| 16 and 17 Years | 0 (0.0%) | 0 (0.0%) |
| 18 to 24 Years | 0 (0.0%) | 0 (0.0%) |
| 25 to 34 Years | 0 (0.0%) | 0 (0.0%) |
| 35 to 44 Years | 0 (0.0%) | 0 (0.0%) |
| 45 to 54 Years | 0 (0.0%) | 0 (0.0%) |
| 55 to 64 Years | 13 (100.0%) | 9 (100.0%) |
| 65 to 74 Years | 24 (100.0%) | 24 (100.0%) |
| 75 Years and over | 0 (0.0%) | 0 (0.0%) |
| Total | 37 (40.2%) | 33 (35.9%) |
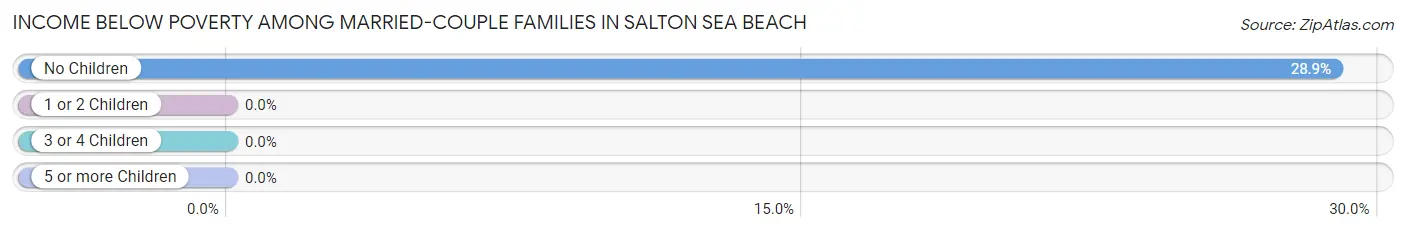
Income Below Poverty Among Married-Couple Families in Salton Sea Beach
The poverty statistics for married-couple families in Salton Sea Beach show that 28.8% or 15 of the total 52 families live below the poverty line. Families with no children have the highest poverty rate of 28.8%, comprising of 15 families. On the other hand, families with no children have the lowest poverty rate of 28.8%, which includes 15 families.
| Children | Above Poverty | Below Poverty |
| No Children | 37 (71.2%) | 15 (28.8%) |
| 1 or 2 Children | 0 (0.0%) | 0 (0.0%) |
| 3 or 4 Children | 0 (0.0%) | 0 (0.0%) |
| 5 or more Children | 0 (0.0%) | 0 (0.0%) |
| Total | 37 (71.2%) | 15 (28.8%) |
Income Below Poverty Among Single-Parent Households in Salton Sea Beach
| Children | Single Father | Single Mother |
| No Children | 0 (0.0%) | 0 (0.0%) |
| 1 or 2 Children | 0 (0.0%) | 0 (0.0%) |
| 3 or 4 Children | 0 (0.0%) | 0 (0.0%) |
| 5 or more Children | 0 (0.0%) | 0 (0.0%) |
| Total | 0 (0.0%) | 0 (0.0%) |
Income Below Poverty Among Married-Couple vs Single-Parent Households in Salton Sea Beach
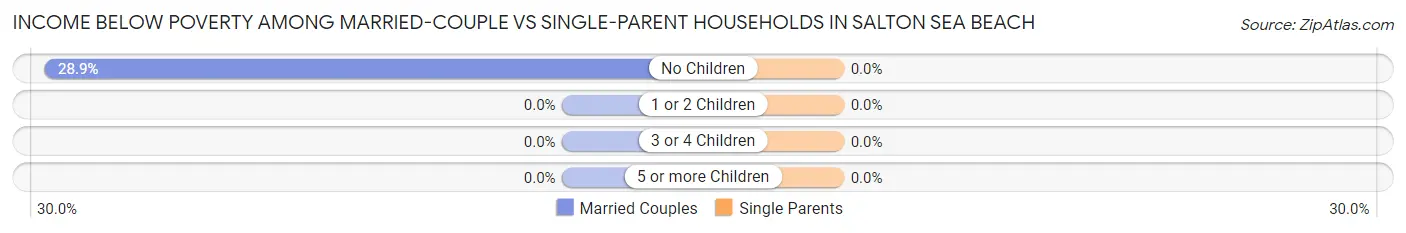
| Children | Married-Couple Families | Single-Parent Households |
| No Children | 15 (28.8%) | 0 (0.0%) |
| 1 or 2 Children | 0 (0.0%) | 0 (0.0%) |
| 3 or 4 Children | 0 (0.0%) | 0 (0.0%) |
| 5 or more Children | 0 (0.0%) | 0 (0.0%) |
| Total | 15 (28.8%) | 0 (0.0%) |
Race in Salton Sea Beach
The most populous races in Salton Sea Beach are White / Caucasian (186 | 100.0%), and Hispanic or Latino (24 | 12.9%).
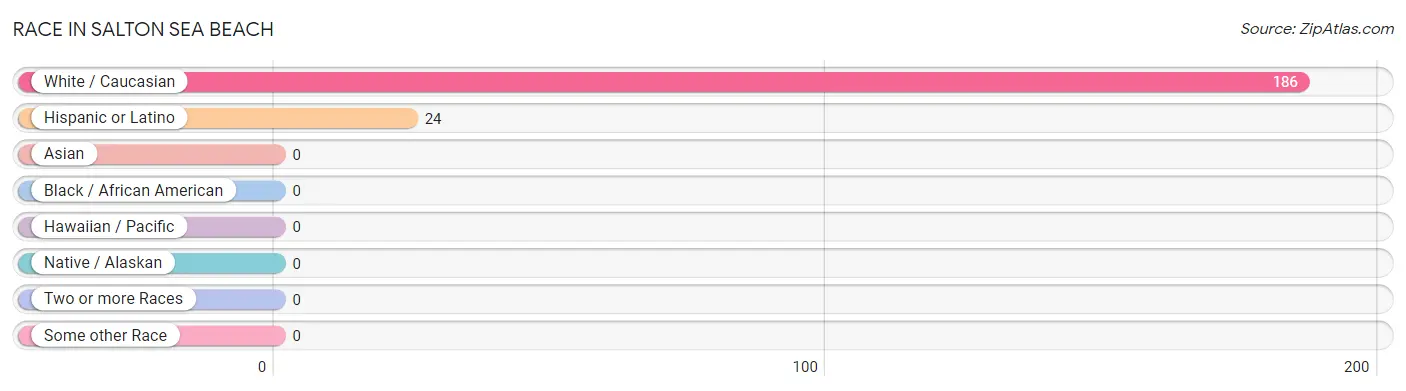
| Race | # Population | % Population |
| Asian | 0 | 0.0% |
| Black / African American | 0 | 0.0% |
| Hawaiian / Pacific | 0 | 0.0% |
| Hispanic or Latino | 24 | 12.9% |
| Native / Alaskan | 0 | 0.0% |
| White / Caucasian | 186 | 100.0% |
| Two or more Races | 0 | 0.0% |
| Some other Race | 0 | 0.0% |
| Total | 186 | 100.0% |
Ancestry in Salton Sea Beach
The most populous ancestries reported in Salton Sea Beach are English (74 | 39.8%), German (61 | 32.8%), Mexican (24 | 12.9%), Irish (14 | 7.5%), and European (13 | 7.0%), together accounting for 100.0% of all Salton Sea Beach residents.
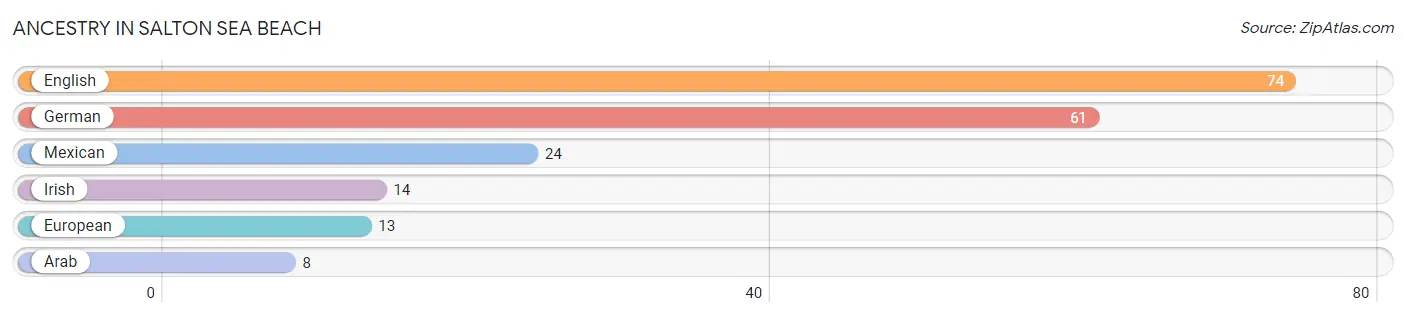
| Ancestry | # Population | % Population |
| Arab | 8 | 4.3% |
| English | 74 | 39.8% |
| European | 13 | 7.0% |
| German | 61 | 32.8% |
| Irish | 14 | 7.5% |
| Mexican | 24 | 12.9% | View All 6 Rows |
Immigrants in Salton Sea Beach

| Immigration Origin | # Population | % Population | View All 0 Rows |
Sex and Age in Salton Sea Beach
Sex and Age in Salton Sea Beach
The most populous age groups in Salton Sea Beach are 20 to 24 Years (40 | 43.5%) for men and 30 to 34 Years (51 | 54.3%) for women.
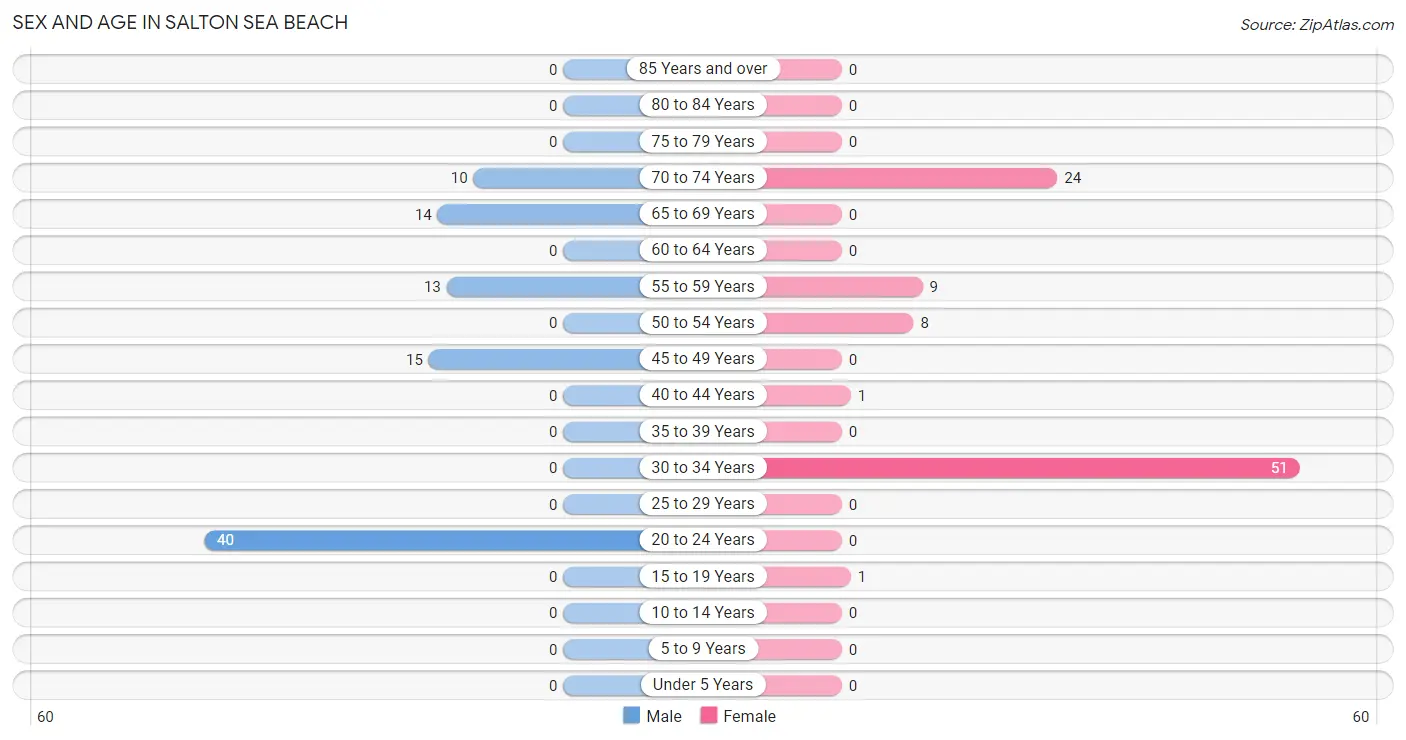
| Age Bracket | Male | Female |
| Under 5 Years | 0 (0.0%) | 0 (0.0%) |
| 5 to 9 Years | 0 (0.0%) | 0 (0.0%) |
| 10 to 14 Years | 0 (0.0%) | 0 (0.0%) |
| 15 to 19 Years | 0 (0.0%) | 1 (1.1%) |
| 20 to 24 Years | 40 (43.5%) | 0 (0.0%) |
| 25 to 29 Years | 0 (0.0%) | 0 (0.0%) |
| 30 to 34 Years | 0 (0.0%) | 51 (54.3%) |
| 35 to 39 Years | 0 (0.0%) | 0 (0.0%) |
| 40 to 44 Years | 0 (0.0%) | 1 (1.1%) |
| 45 to 49 Years | 15 (16.3%) | 0 (0.0%) |
| 50 to 54 Years | 0 (0.0%) | 8 (8.5%) |
| 55 to 59 Years | 13 (14.1%) | 9 (9.6%) |
| 60 to 64 Years | 0 (0.0%) | 0 (0.0%) |
| 65 to 69 Years | 14 (15.2%) | 0 (0.0%) |
| 70 to 74 Years | 10 (10.9%) | 24 (25.5%) |
| 75 to 79 Years | 0 (0.0%) | 0 (0.0%) |
| 80 to 84 Years | 0 (0.0%) | 0 (0.0%) |
| 85 Years and over | 0 (0.0%) | 0 (0.0%) |
| Total | 92 (100.0%) | 94 (100.0%) |
Families and Households in Salton Sea Beach
Median Family Size in Salton Sea Beach
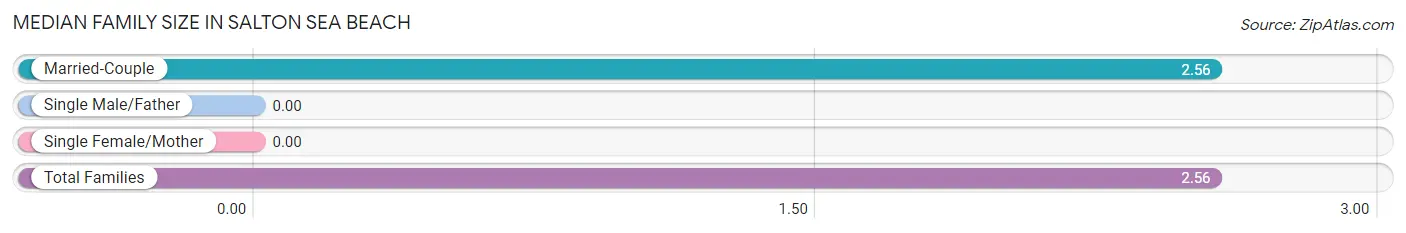
| Family Type | # Families | Family Size |
| Married-Couple | 52 (100.0%) | 2.56 |
| Single Male/Father | 0 (0.0%) | - |
| Single Female/Mother | 0 (0.0%) | - |
| Total Families | 52 (100.0%) | 2.56 |
Median Household Size in Salton Sea Beach
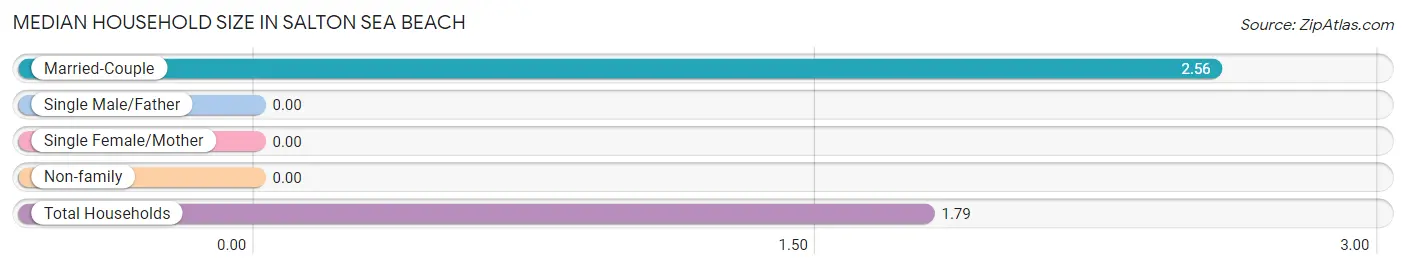
| Household Type | # Households | Household Size |
| Married-Couple | 52 (50.5%) | 2.56 |
| Single Male/Father | 0 (0.0%) | - |
| Single Female/Mother | 0 (0.0%) | - |
| Non-family | 51 (49.5%) | - |
| Total Households | 103 (100.0%) | 1.79 |
Household Size by Marriage Status in Salton Sea Beach
Out of a total of 103 households in Salton Sea Beach, 52 (50.5%) are family households, while 51 (49.5%) are nonfamily households. The most numerous type of family households are 2-person households, comprising 37, and the most common type of nonfamily households are 1-person households, comprising 51.
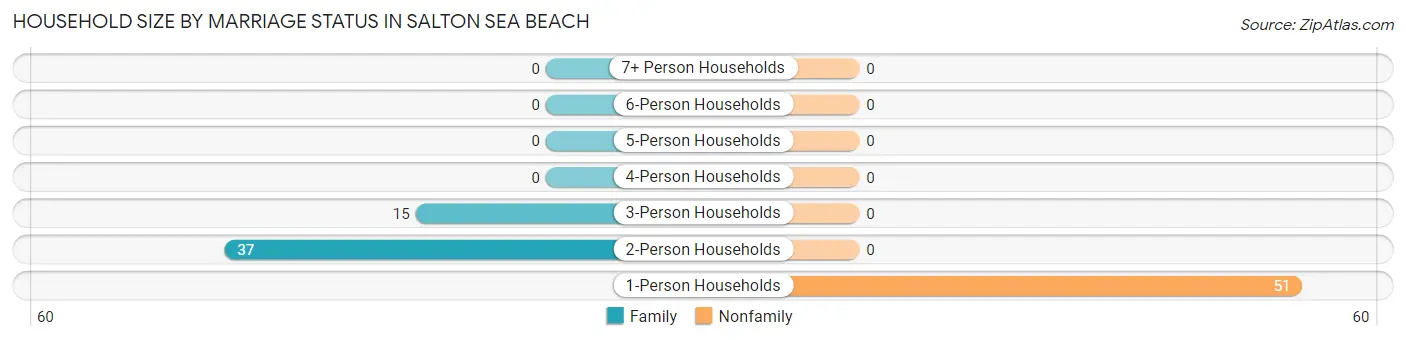
| Household Size | Family Households | Nonfamily Households |
| 1-Person Households | - | 51 (49.5%) |
| 2-Person Households | 37 (35.9%) | 0 (0.0%) |
| 3-Person Households | 15 (14.6%) | 0 (0.0%) |
| 4-Person Households | 0 (0.0%) | 0 (0.0%) |
| 5-Person Households | 0 (0.0%) | 0 (0.0%) |
| 6-Person Households | 0 (0.0%) | 0 (0.0%) |
| 7+ Person Households | 0 (0.0%) | 0 (0.0%) |
| Total | 52 (50.5%) | 51 (49.5%) |
Female Fertility in Salton Sea Beach
Fertility by Age in Salton Sea Beach
| Age Bracket | Women with Births | Births / 1,000 Women |
| 15 to 19 years | 0 (0.0%) | 0.0 |
| 20 to 34 years | 0 (0.0%) | 0.0 |
| 35 to 50 years | 0 (0.0%) | 0.0 |
| Total | 0 (0.0%) | 0.0 |
Fertility by Age by Marriage Status in Salton Sea Beach
| Age Bracket | Married | Unmarried |
| 15 to 19 years | 0 (0.0%) | 0 (0.0%) |
| 20 to 34 years | 0 (0.0%) | 0 (0.0%) |
| 35 to 50 years | 0 (0.0%) | 0 (0.0%) |
| Total | 0 (0.0%) | 0 (0.0%) |
Fertility by Education in Salton Sea Beach
| Educational Attainment | Women with Births | Births / 1,000 Women |
| Less than High School | 0 (0.0%) | 0.0 |
| High School Diploma | 0 (0.0%) | 0.0 |
| College or Associate's Degree | 0 (0.0%) | 0.0 |
| Bachelor's Degree | 0 (0.0%) | 0.0 |
| Graduate Degree | 0 (0.0%) | 0.0 |
| Total | 0 (0.0%) | 0.0 |
Fertility by Education by Marriage Status in Salton Sea Beach
| Educational Attainment | Married | Unmarried |
| Less than High School | 0 (0.0%) | 0 (0.0%) |
| High School Diploma | 0 (0.0%) | 0 (0.0%) |
| College or Associate's Degree | 0 (0.0%) | 0 (0.0%) |
| Bachelor's Degree | 0 (0.0%) | 0 (0.0%) |
| Graduate Degree | 0 (0.0%) | 0 (0.0%) |
| Total | 0 (0.0%) | 0 (0.0%) |
Employment Characteristics in Salton Sea Beach
Employment by Class of Employer in Salton Sea Beach
Among the 53 employed individuals in Salton Sea Beach, , and private company employees (53 | 100.0%) make up the most common classes of employment.
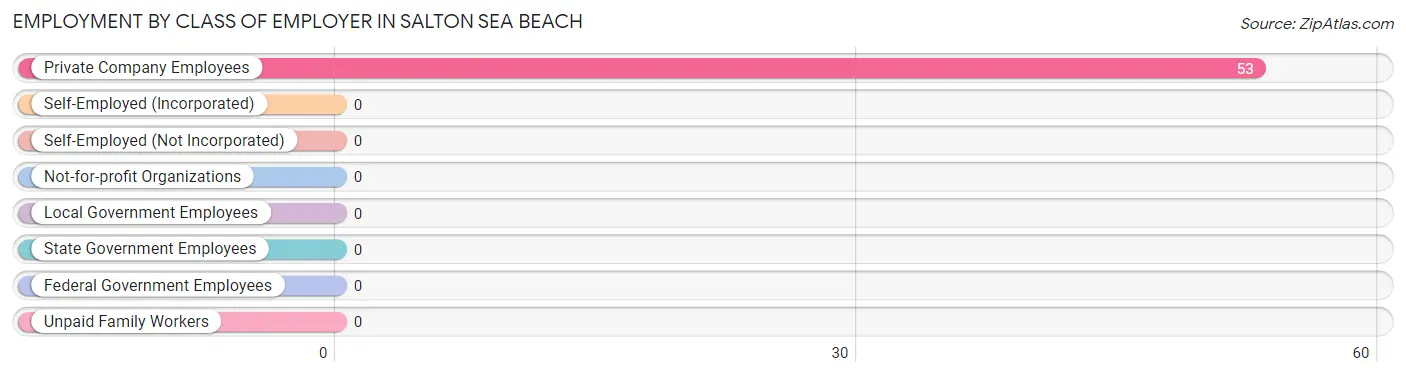
| Employer Class | # Employees | % Employees |
| Private Company Employees | 53 | 100.0% |
| Self-Employed (Incorporated) | 0 | 0.0% |
| Self-Employed (Not Incorporated) | 0 | 0.0% |
| Not-for-profit Organizations | 0 | 0.0% |
| Local Government Employees | 0 | 0.0% |
| State Government Employees | 0 | 0.0% |
| Federal Government Employees | 0 | 0.0% |
| Unpaid Family Workers | 0 | 0.0% |
| Total | 53 | 100.0% |
Employment Status by Age in Salton Sea Beach
According to the labor force statistics for Salton Sea Beach, out of the total population over 16 years of age (186), 55.9% or 104 individuals are in the labor force, with 49.0% or 51 of them unemployed. The age group with the highest labor force participation rate is 20 to 24 years, with 100.0% or 40 individuals in the labor force. Within the labor force, the 30 to 34 years age range has the highest percentage of unemployed individuals, with 100.0% or 51 of them being unemployed.
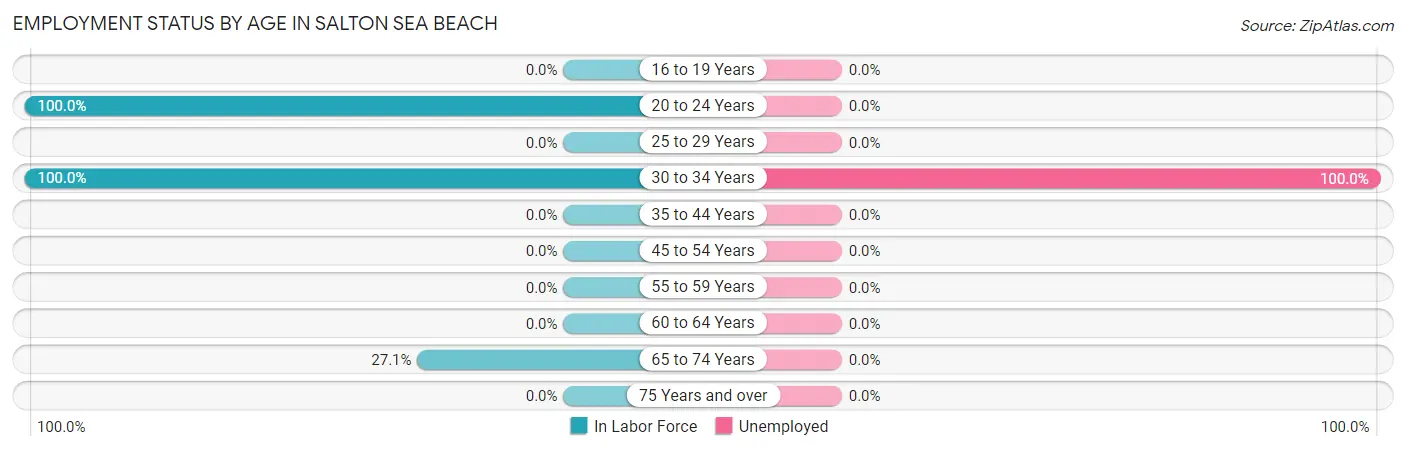
| Age Bracket | In Labor Force | Unemployed |
| 16 to 19 Years | 0 (0.0%) | 0 (0.0%) |
| 20 to 24 Years | 40 (100.0%) | 0 (0.0%) |
| 25 to 29 Years | 0 (0.0%) | 0 (0.0%) |
| 30 to 34 Years | 51 (100.0%) | 51 (100.0%) |
| 35 to 44 Years | 0 (0.0%) | 0 (0.0%) |
| 45 to 54 Years | 0 (0.0%) | 0 (0.0%) |
| 55 to 59 Years | 0 (0.0%) | 0 (0.0%) |
| 60 to 64 Years | 0 (0.0%) | 0 (0.0%) |
| 65 to 74 Years | 13 (27.1%) | 0 (0.0%) |
| 75 Years and over | 0 (0.0%) | 0 (0.0%) |
| Total | 104 (55.9%) | 51 (49.0%) |
Employment Status by Educational Attainment in Salton Sea Beach
According to labor force statistics for Salton Sea Beach, 52.6% of individuals (51) out of the total population between 25 and 64 years of age (97) are in the labor force, with 100.0% or 51 of them being unemployed. The group with the highest labor force participation rate are those with the educational attainment of high school diploma, with 69.9% or 51 individuals in the labor force. Within the labor force, individuals with high school diploma education have the highest percentage of unemployment, with 100.0% or 51 of them being unemployed.
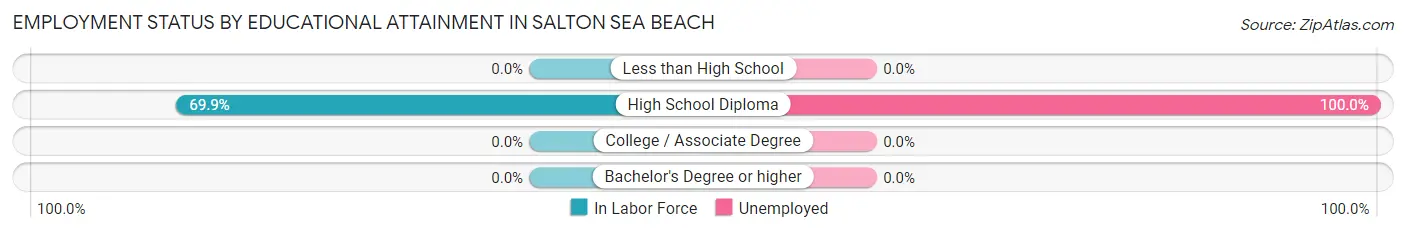
| Educational Attainment | In Labor Force | Unemployed |
| Less than High School | 0 (0.0%) | 0 (0.0%) |
| High School Diploma | 51 (69.9%) | 73 (100.0%) |
| College / Associate Degree | 0 (0.0%) | 0 (0.0%) |
| Bachelor's Degree or higher | 0 (0.0%) | 0 (0.0%) |
| Total | 51 (52.6%) | 97 (100.0%) |
Employment Occupations by Sex in Salton Sea Beach
Management, Business, Science and Arts Occupations
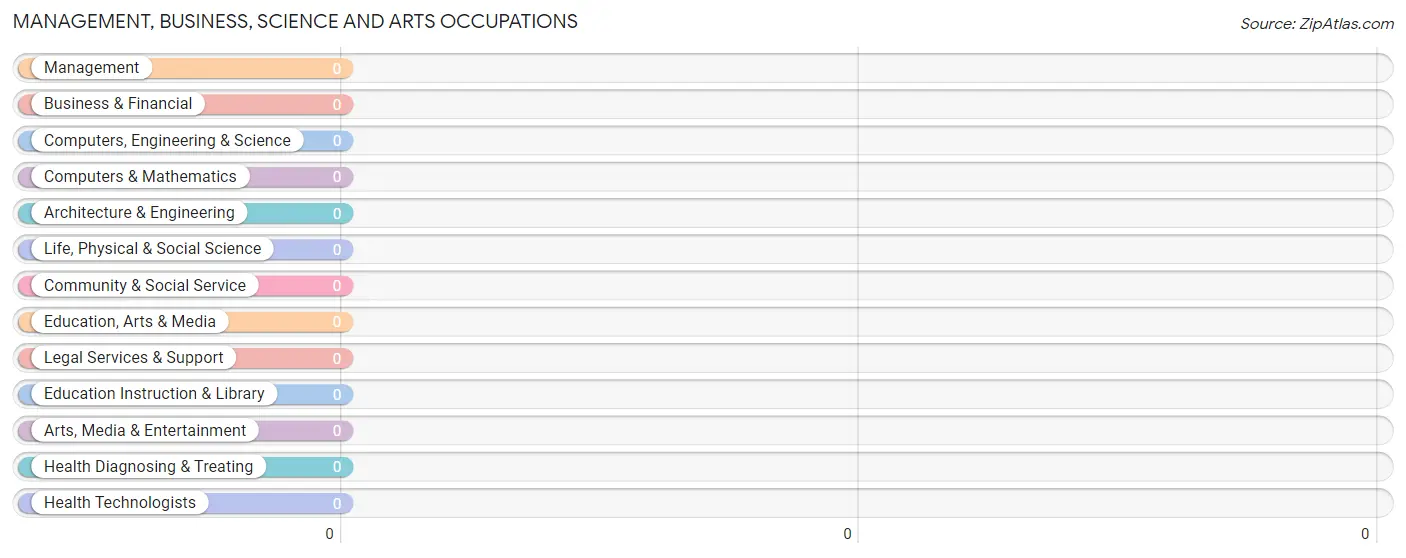
Management, Business, Science and Arts Occupations by Sex
| Occupation | Male | Female |
| Management | 0 (0.0%) | 0 (0.0%) |
| Business & Financial | 0 (0.0%) | 0 (0.0%) |
| Computers, Engineering & Science | 0 (0.0%) | 0 (0.0%) |
| Computers & Mathematics | 0 (0.0%) | 0 (0.0%) |
| Architecture & Engineering | 0 (0.0%) | 0 (0.0%) |
| Life, Physical & Social Science | 0 (0.0%) | 0 (0.0%) |
| Community & Social Service | 0 (0.0%) | 0 (0.0%) |
| Education, Arts & Media | 0 (0.0%) | 0 (0.0%) |
| Legal Services & Support | 0 (0.0%) | 0 (0.0%) |
| Education Instruction & Library | 0 (0.0%) | 0 (0.0%) |
| Arts, Media & Entertainment | 0 (0.0%) | 0 (0.0%) |
| Health Diagnosing & Treating | 0 (0.0%) | 0 (0.0%) |
| Health Technologists | 0 (0.0%) | 0 (0.0%) |
| Total (Category) | 0 (0.0%) | 0 (0.0%) |
| Total (Overall) | 40 (75.5%) | 13 (24.5%) |
Services Occupations
The most common Services occupations in Salton Sea Beach are , and Food Preparation & Serving (40 | 75.5%).
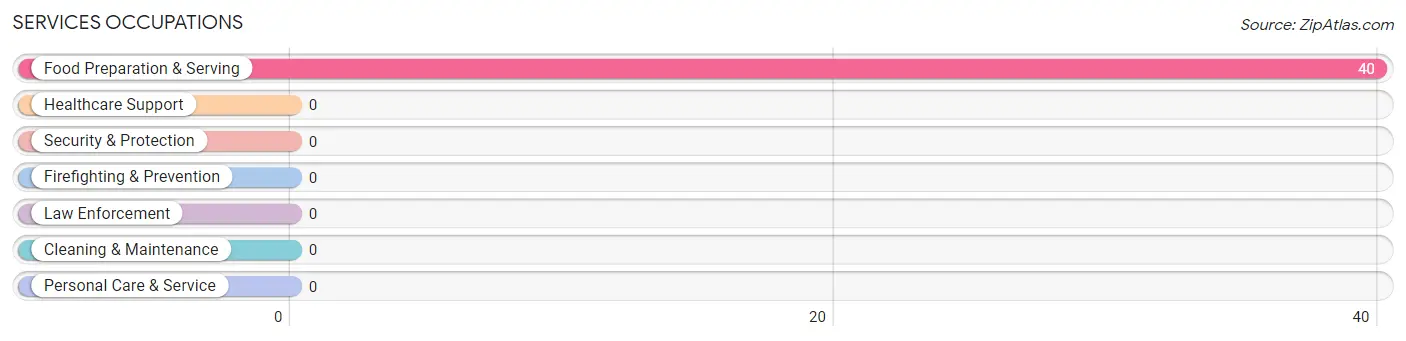
Services Occupations by Sex
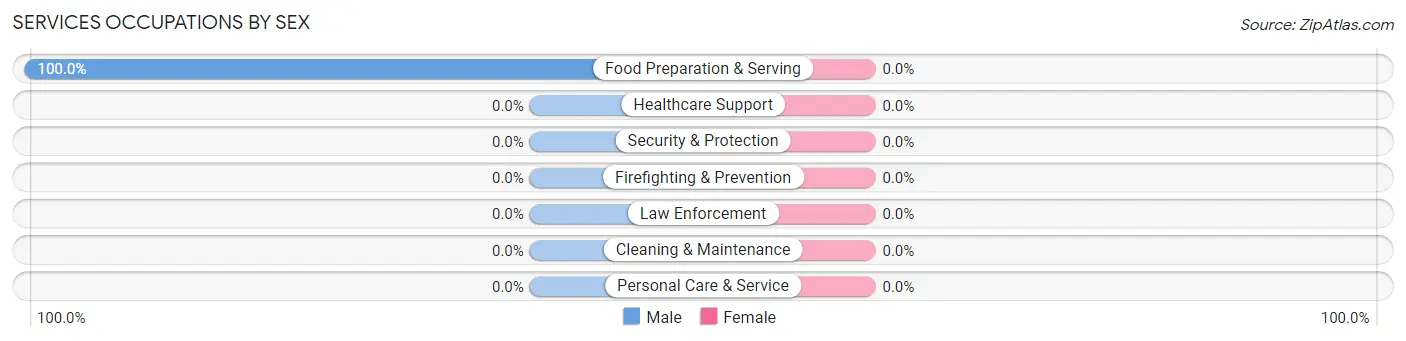
| Occupation | Male | Female |
| Healthcare Support | 0 (0.0%) | 0 (0.0%) |
| Security & Protection | 0 (0.0%) | 0 (0.0%) |
| Firefighting & Prevention | 0 (0.0%) | 0 (0.0%) |
| Law Enforcement | 0 (0.0%) | 0 (0.0%) |
| Food Preparation & Serving | 40 (100.0%) | 0 (0.0%) |
| Cleaning & Maintenance | 0 (0.0%) | 0 (0.0%) |
| Personal Care & Service | 0 (0.0%) | 0 (0.0%) |
| Total (Category) | 40 (100.0%) | 0 (0.0%) |
| Total (Overall) | 40 (75.5%) | 13 (24.5%) |
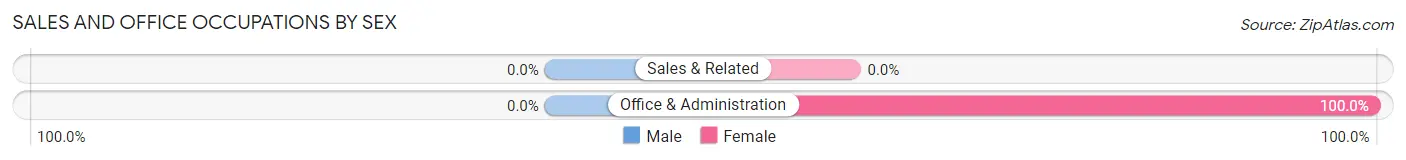
Sales and Office Occupations
The most common Sales and Office occupations in Salton Sea Beach are , and Office & Administration (13 | 24.5%).
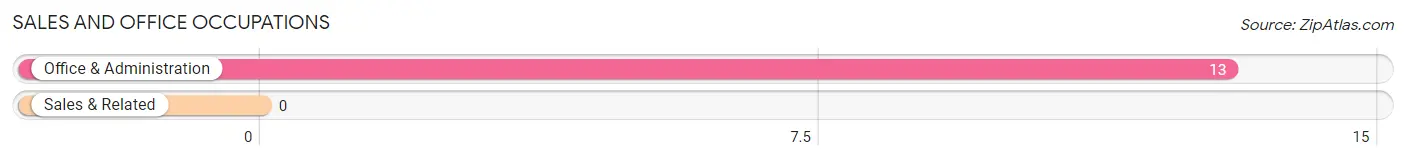
Sales and Office Occupations by Sex
| Occupation | Male | Female |
| Sales & Related | 0 (0.0%) | 0 (0.0%) |
| Office & Administration | 0 (0.0%) | 13 (100.0%) |
| Total (Category) | 0 (0.0%) | 13 (100.0%) |
| Total (Overall) | 40 (75.5%) | 13 (24.5%) |
Natural Resources, Construction and Maintenance Occupations
Natural Resources, Construction and Maintenance Occupations by Sex
| Occupation | Male | Female |
| Farming, Fishing & Forestry | 0 (0.0%) | 0 (0.0%) |
| Construction & Extraction | 0 (0.0%) | 0 (0.0%) |
| Installation, Maintenance & Repair | 0 (0.0%) | 0 (0.0%) |
| Total (Category) | 0 (0.0%) | 0 (0.0%) |
| Total (Overall) | 40 (75.5%) | 13 (24.5%) |
Production, Transportation and Moving Occupations
Production, Transportation and Moving Occupations by Sex
| Occupation | Male | Female |
| Production | 0 (0.0%) | 0 (0.0%) |
| Transportation | 0 (0.0%) | 0 (0.0%) |
| Material Moving | 0 (0.0%) | 0 (0.0%) |
| Total (Category) | 0 (0.0%) | 0 (0.0%) |
| Total (Overall) | 40 (75.5%) | 13 (24.5%) |
Employment Industries by Sex in Salton Sea Beach
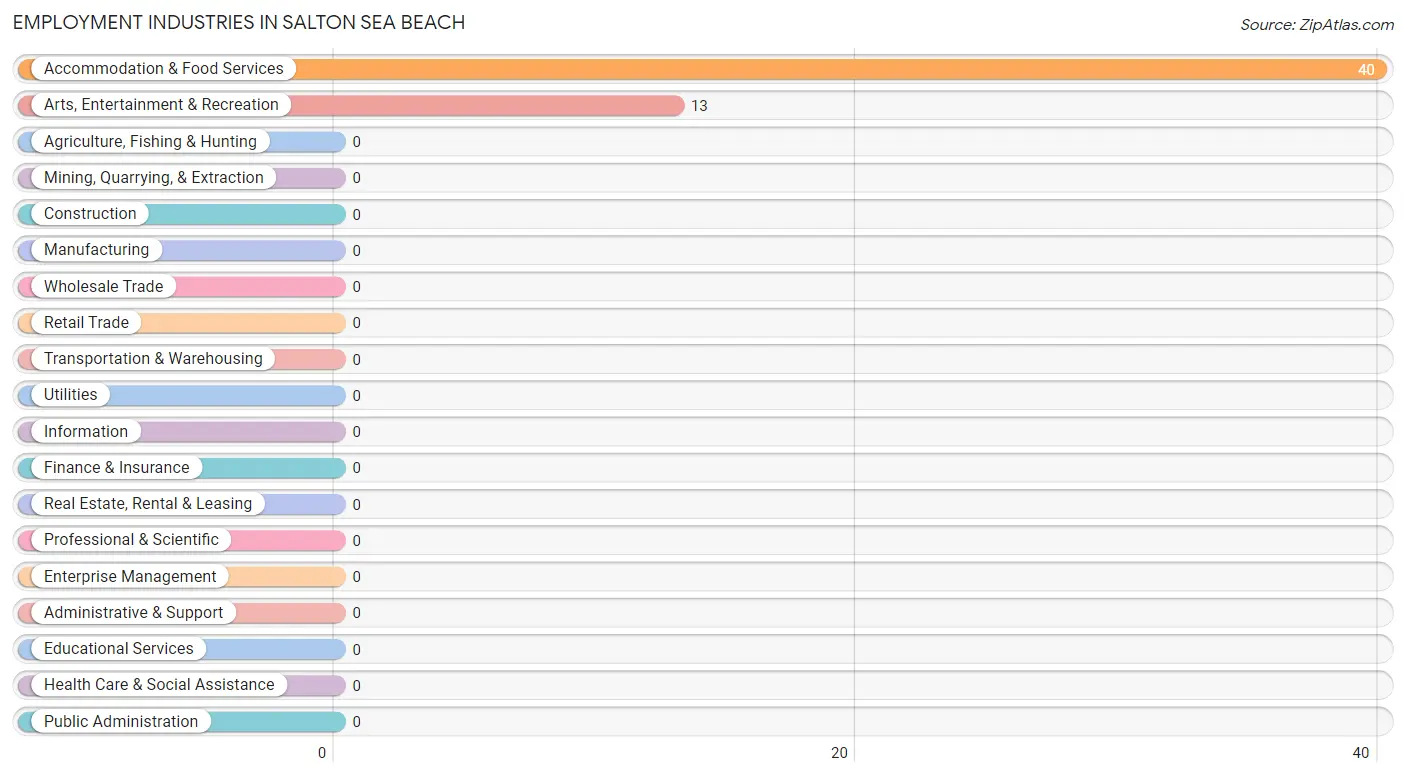
Employment Industries in Salton Sea Beach
The major employment industries in Salton Sea Beach include Accommodation & Food Services (40 | 75.5%), and Arts, Entertainment & Recreation (13 | 24.5%).
Employment Industries by Sex in Salton Sea Beach
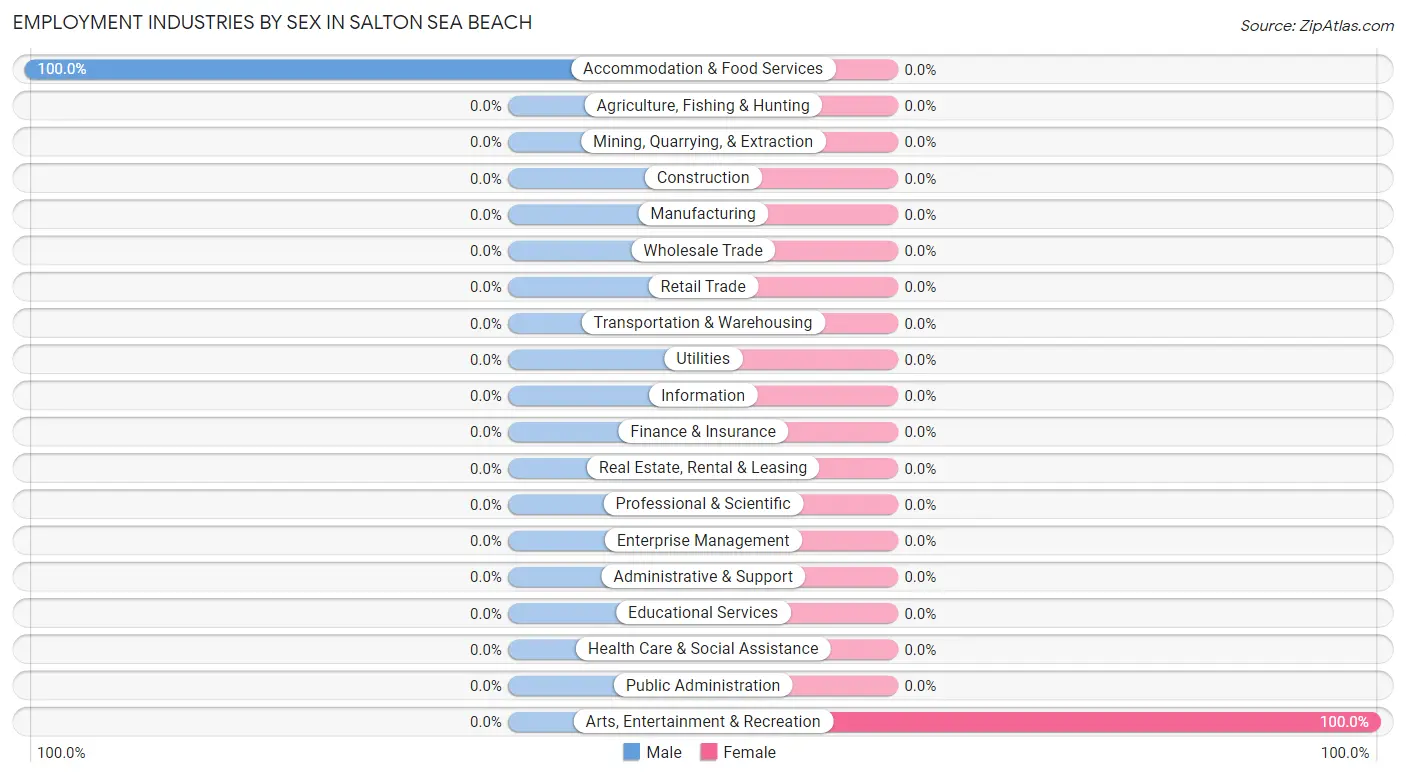
| Industry | Male | Female |
| Agriculture, Fishing & Hunting | 0 (0.0%) | 0 (0.0%) |
| Mining, Quarrying, & Extraction | 0 (0.0%) | 0 (0.0%) |
| Construction | 0 (0.0%) | 0 (0.0%) |
| Manufacturing | 0 (0.0%) | 0 (0.0%) |
| Wholesale Trade | 0 (0.0%) | 0 (0.0%) |
| Retail Trade | 0 (0.0%) | 0 (0.0%) |
| Transportation & Warehousing | 0 (0.0%) | 0 (0.0%) |
| Utilities | 0 (0.0%) | 0 (0.0%) |
| Information | 0 (0.0%) | 0 (0.0%) |
| Finance & Insurance | 0 (0.0%) | 0 (0.0%) |
| Real Estate, Rental & Leasing | 0 (0.0%) | 0 (0.0%) |
| Professional & Scientific | 0 (0.0%) | 0 (0.0%) |
| Enterprise Management | 0 (0.0%) | 0 (0.0%) |
| Administrative & Support | 0 (0.0%) | 0 (0.0%) |
| Educational Services | 0 (0.0%) | 0 (0.0%) |
| Health Care & Social Assistance | 0 (0.0%) | 0 (0.0%) |
| Arts, Entertainment & Recreation | 0 (0.0%) | 13 (100.0%) |
| Accommodation & Food Services | 40 (100.0%) | 0 (0.0%) |
| Public Administration | 0 (0.0%) | 0 (0.0%) |
| Total | 40 (75.5%) | 13 (24.5%) |
Education in Salton Sea Beach
School Enrollment in Salton Sea Beach
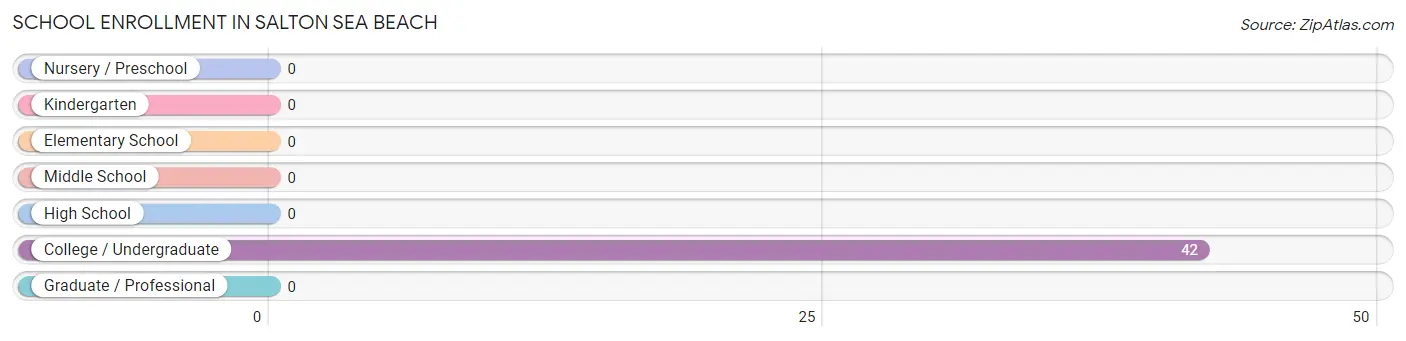
| School Level | # Students | % Students |
| Nursery / Preschool | 0 | 0.0% |
| Kindergarten | 0 | 0.0% |
| Elementary School | 0 | 0.0% |
| Middle School | 0 | 0.0% |
| High School | 0 | 0.0% |
| College / Undergraduate | 42 | 100.0% |
| Graduate / Professional | 0 | 0.0% |
| Total | 42 | 100.0% |
School Enrollment by Age by Funding Source in Salton Sea Beach
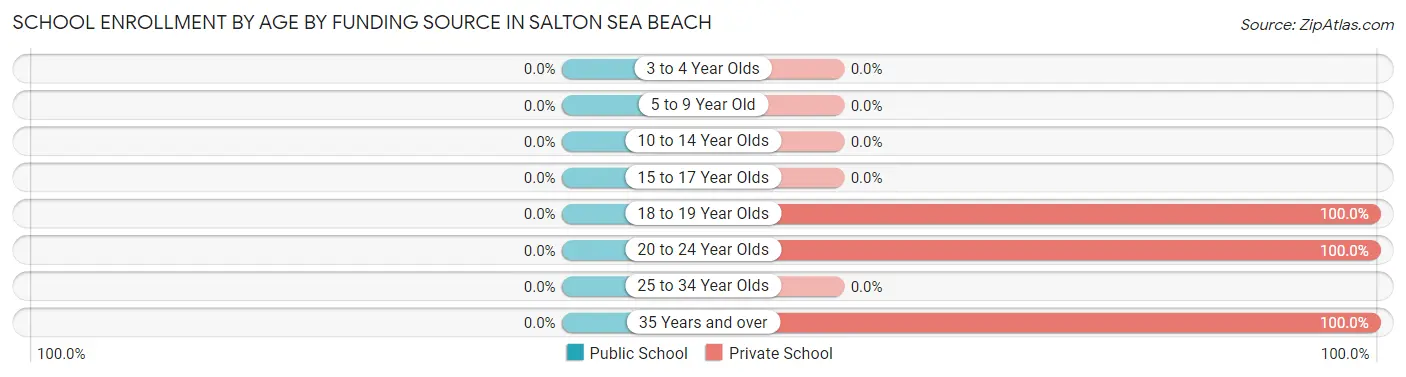
| Age Bracket | Public School | Private School |
| 3 to 4 Year Olds | 0 (0.0%) | 0 (0.0%) |
| 5 to 9 Year Old | 0 (0.0%) | 0 (0.0%) |
| 10 to 14 Year Olds | 0 (0.0%) | 0 (0.0%) |
| 15 to 17 Year Olds | 0 (0.0%) | 0 (0.0%) |
| 18 to 19 Year Olds | 0 (0.0%) | 1 (100.0%) |
| 20 to 24 Year Olds | 0 (0.0%) | 40 (100.0%) |
| 25 to 34 Year Olds | 0 (0.0%) | 0 (0.0%) |
| 35 Years and over | 0 (0.0%) | 1 (100.0%) |
| Total | 0 (0.0%) | 42 (100.0%) |
Educational Attainment by Field of Study in Salton Sea Beach
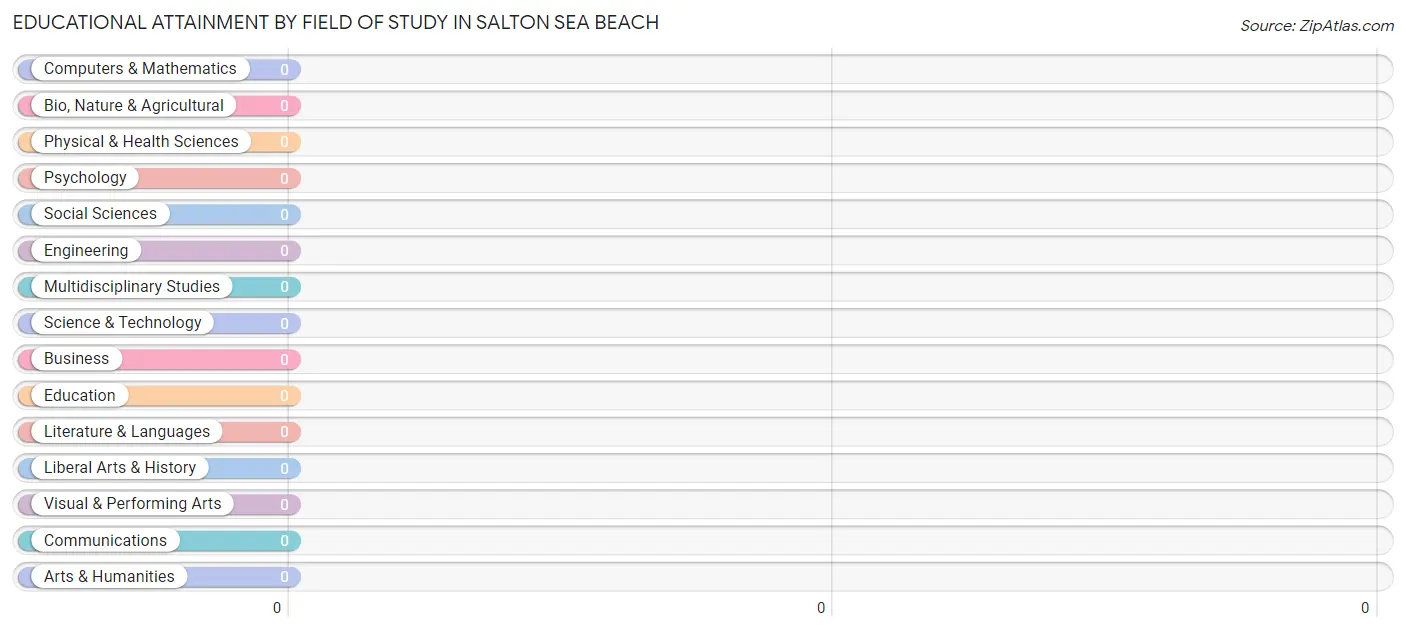
| Field of Study | # Graduates | % Graduates |
| Computers & Mathematics | 0 | 0.0% |
| Bio, Nature & Agricultural | 0 | 0.0% |
| Physical & Health Sciences | 0 | 0.0% |
| Psychology | 0 | 0.0% |
| Social Sciences | 0 | 0.0% |
| Engineering | 0 | 0.0% |
| Multidisciplinary Studies | 0 | 0.0% |
| Science & Technology | 0 | 0.0% |
| Business | 0 | 0.0% |
| Education | 0 | 0.0% |
| Literature & Languages | 0 | 0.0% |
| Liberal Arts & History | 0 | 0.0% |
| Visual & Performing Arts | 0 | 0.0% |
| Communications | 0 | 0.0% |
| Arts & Humanities | 0 | 0.0% |
| Total | 0 | 0.0% |
Transportation & Commute in Salton Sea Beach
Vehicle Availability by Sex in Salton Sea Beach
The most prevalent vehicle ownership categories in Salton Sea Beach are males with 3 vehicles (40, accounting for 100.0%) and females with 3 vehicles (0, making up 307.7%).
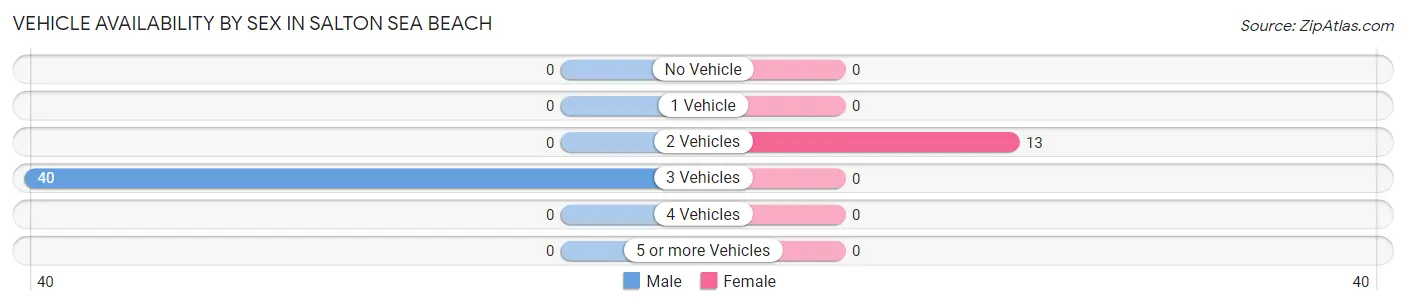
| Vehicles Available | Male | Female |
| No Vehicle | 0 (0.0%) | 0 (0.0%) |
| 1 Vehicle | 0 (0.0%) | 0 (0.0%) |
| 2 Vehicles | 0 (0.0%) | 13 (100.0%) |
| 3 Vehicles | 40 (100.0%) | 0 (0.0%) |
| 4 Vehicles | 0 (0.0%) | 0 (0.0%) |
| 5 or more Vehicles | 0 (0.0%) | 0 (0.0%) |
| Total | 40 (100.0%) | 13 (100.0%) |
Commute Time in Salton Sea Beach
The most frequently occuring commute durations in Salton Sea Beach are 15 to 19 minutes (40 commuters, 75.5%), 5 to 9 minutes (13 commuters, 24.5%), and less than 5 minutes (0 commuters, 0.0%).
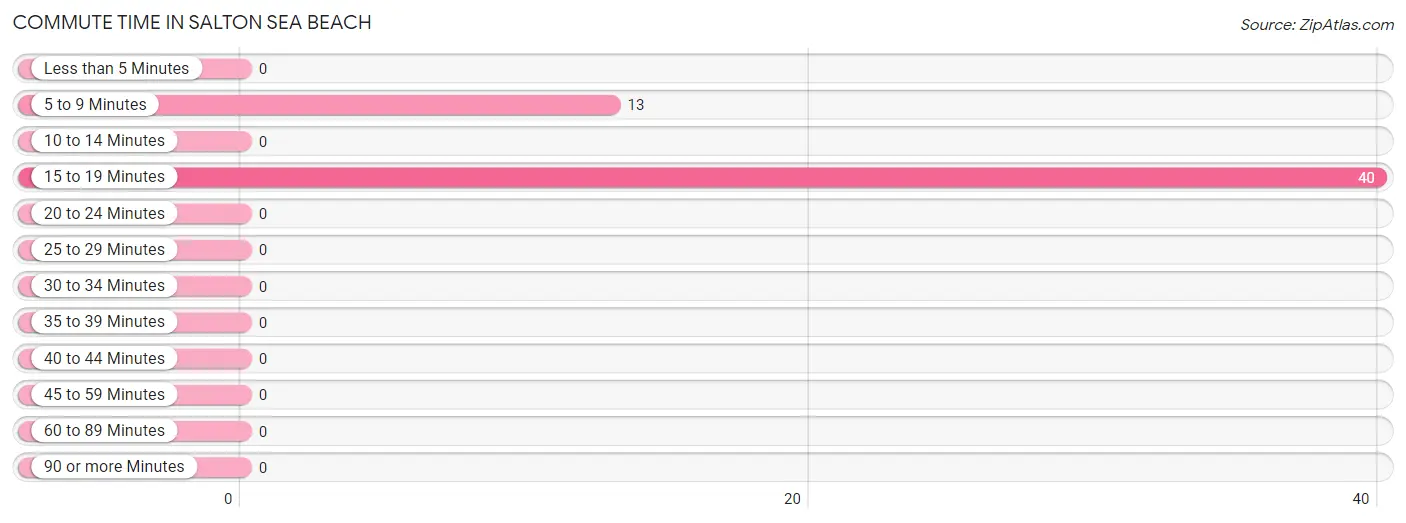
| Commute Time | # Commuters | % Commuters |
| Less than 5 Minutes | 0 | 0.0% |
| 5 to 9 Minutes | 13 | 24.5% |
| 10 to 14 Minutes | 0 | 0.0% |
| 15 to 19 Minutes | 40 | 75.5% |
| 20 to 24 Minutes | 0 | 0.0% |
| 25 to 29 Minutes | 0 | 0.0% |
| 30 to 34 Minutes | 0 | 0.0% |
| 35 to 39 Minutes | 0 | 0.0% |
| 40 to 44 Minutes | 0 | 0.0% |
| 45 to 59 Minutes | 0 | 0.0% |
| 60 to 89 Minutes | 0 | 0.0% |
| 90 or more Minutes | 0 | 0.0% |
Commute Time by Sex in Salton Sea Beach
The most common commute times in Salton Sea Beach are 15 to 19 minutes (40 commuters, 100.0%) for males and 5 to 9 minutes (13 commuters, 100.0%) for females.
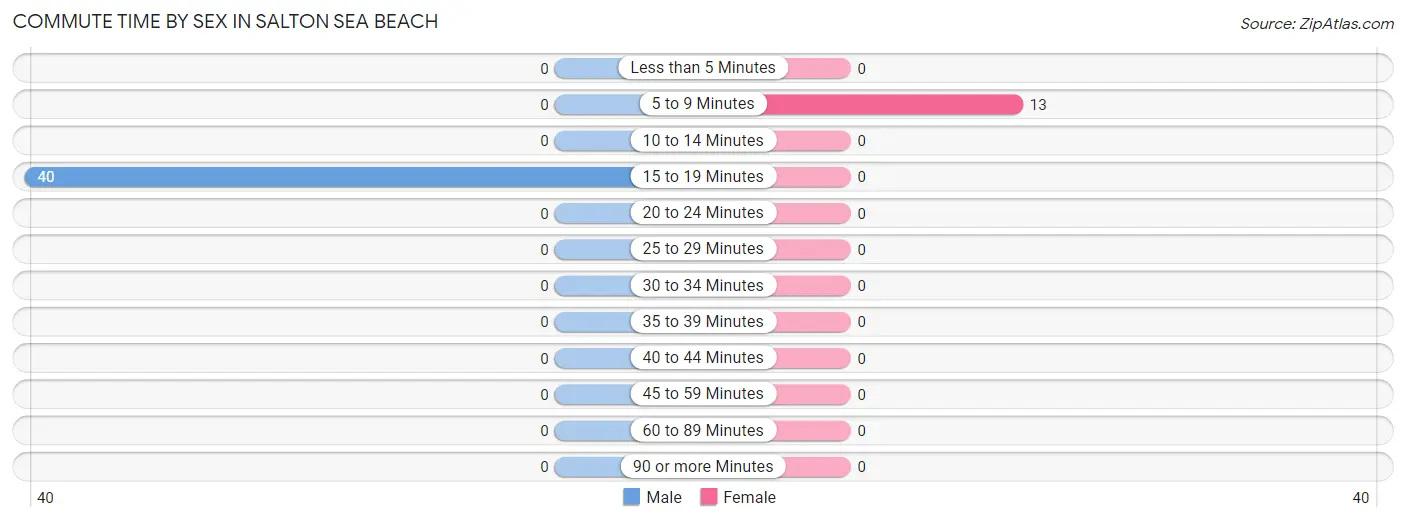
| Commute Time | Male | Female |
| Less than 5 Minutes | 0 (0.0%) | 0 (0.0%) |
| 5 to 9 Minutes | 0 (0.0%) | 13 (100.0%) |
| 10 to 14 Minutes | 0 (0.0%) | 0 (0.0%) |
| 15 to 19 Minutes | 40 (100.0%) | 0 (0.0%) |
| 20 to 24 Minutes | 0 (0.0%) | 0 (0.0%) |
| 25 to 29 Minutes | 0 (0.0%) | 0 (0.0%) |
| 30 to 34 Minutes | 0 (0.0%) | 0 (0.0%) |
| 35 to 39 Minutes | 0 (0.0%) | 0 (0.0%) |
| 40 to 44 Minutes | 0 (0.0%) | 0 (0.0%) |
| 45 to 59 Minutes | 0 (0.0%) | 0 (0.0%) |
| 60 to 89 Minutes | 0 (0.0%) | 0 (0.0%) |
| 90 or more Minutes | 0 (0.0%) | 0 (0.0%) |
Time of Departure to Work by Sex in Salton Sea Beach
The most frequent times of departure to work in Salton Sea Beach are 12:00 AM to 4:59 AM (40, 100.0%) for males and 12:00 PM to 3:59 PM (13, 100.0%) for females.
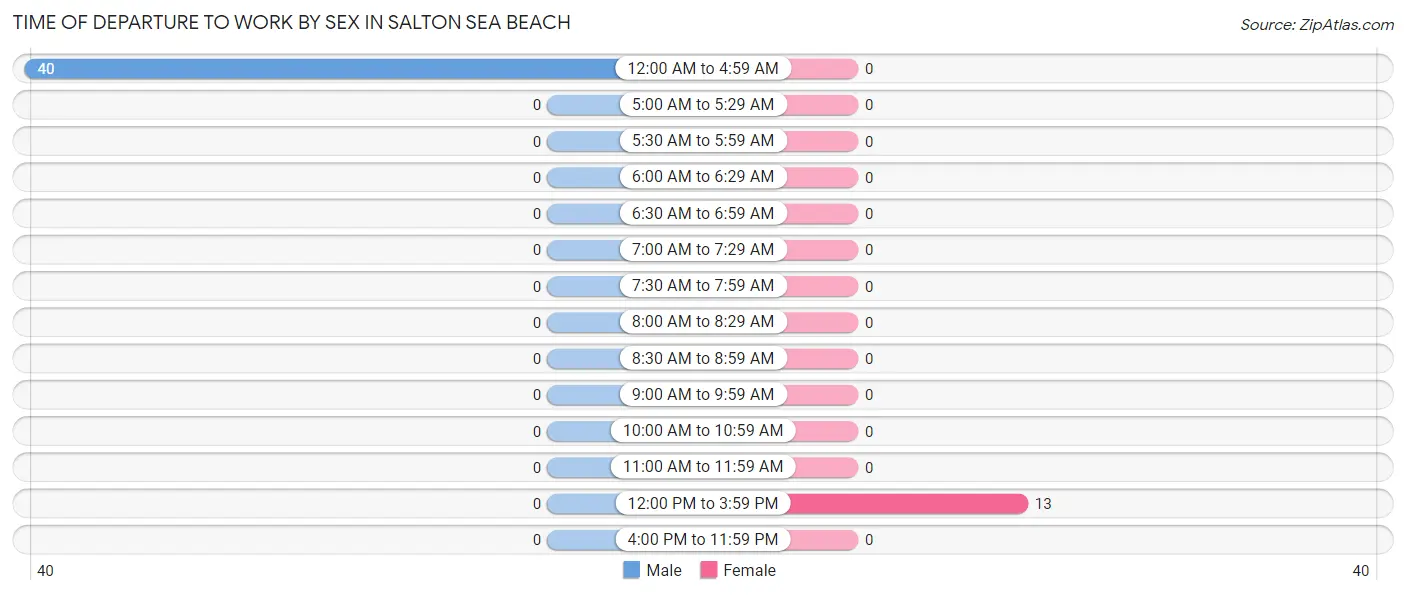
| Time of Departure | Male | Female |
| 12:00 AM to 4:59 AM | 40 (100.0%) | 0 (0.0%) |
| 5:00 AM to 5:29 AM | 0 (0.0%) | 0 (0.0%) |
| 5:30 AM to 5:59 AM | 0 (0.0%) | 0 (0.0%) |
| 6:00 AM to 6:29 AM | 0 (0.0%) | 0 (0.0%) |
| 6:30 AM to 6:59 AM | 0 (0.0%) | 0 (0.0%) |
| 7:00 AM to 7:29 AM | 0 (0.0%) | 0 (0.0%) |
| 7:30 AM to 7:59 AM | 0 (0.0%) | 0 (0.0%) |
| 8:00 AM to 8:29 AM | 0 (0.0%) | 0 (0.0%) |
| 8:30 AM to 8:59 AM | 0 (0.0%) | 0 (0.0%) |
| 9:00 AM to 9:59 AM | 0 (0.0%) | 0 (0.0%) |
| 10:00 AM to 10:59 AM | 0 (0.0%) | 0 (0.0%) |
| 11:00 AM to 11:59 AM | 0 (0.0%) | 0 (0.0%) |
| 12:00 PM to 3:59 PM | 0 (0.0%) | 13 (100.0%) |
| 4:00 PM to 11:59 PM | 0 (0.0%) | 0 (0.0%) |
| Total | 40 (100.0%) | 13 (100.0%) |
Housing Occupancy in Salton Sea Beach
Occupancy by Ownership in Salton Sea Beach
Of the total 103 dwellings in Salton Sea Beach, owner-occupied units account for 52 (50.5%), while renter-occupied units make up 51 (49.5%).
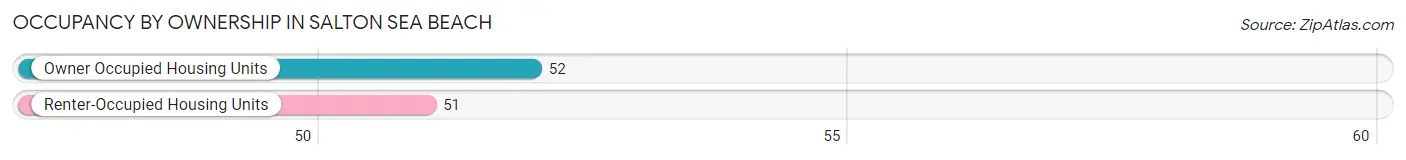
| Occupancy | # Housing Units | % Housing Units |
| Owner Occupied Housing Units | 52 | 50.5% |
| Renter-Occupied Housing Units | 51 | 49.5% |
| Total Occupied Housing Units | 103 | 100.0% |
Occupancy by Household Size in Salton Sea Beach
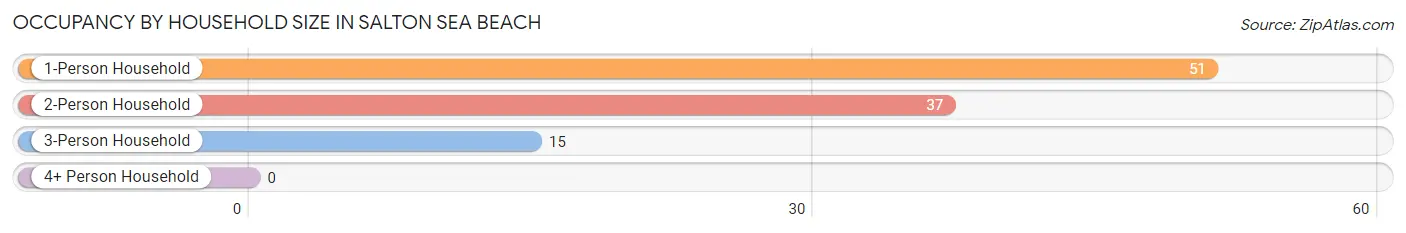
| Household Size | # Housing Units | % Housing Units |
| 1-Person Household | 51 | 49.5% |
| 2-Person Household | 37 | 35.9% |
| 3-Person Household | 15 | 14.6% |
| 4+ Person Household | 0 | 0.0% |
| Total Housing Units | 103 | 100.0% |
Occupancy by Ownership by Household Size in Salton Sea Beach
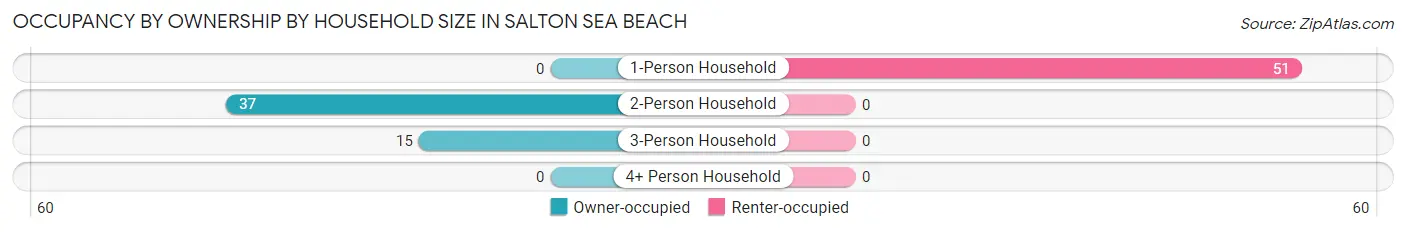
| Household Size | Owner-occupied | Renter-occupied |
| 1-Person Household | 0 (0.0%) | 51 (100.0%) |
| 2-Person Household | 37 (100.0%) | 0 (0.0%) |
| 3-Person Household | 15 (100.0%) | 0 (0.0%) |
| 4+ Person Household | 0 (0.0%) | 0 (0.0%) |
| Total Housing Units | 52 (50.5%) | 51 (49.5%) |
Occupancy by Educational Attainment in Salton Sea Beach
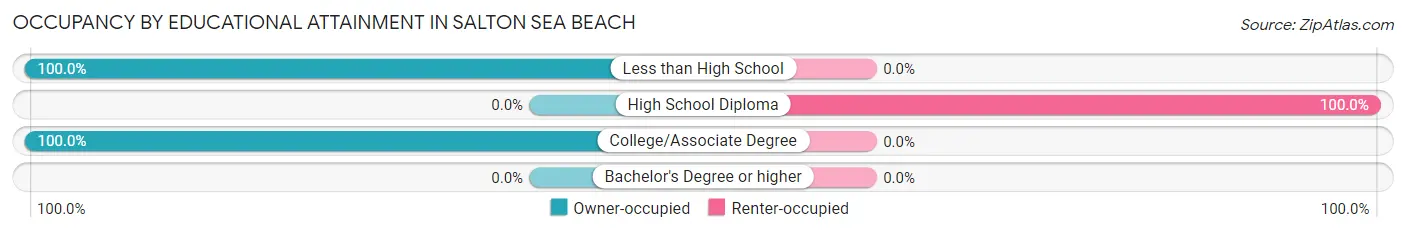
| Household Size | Owner-occupied | Renter-occupied |
| Less than High School | 15 (100.0%) | 0 (0.0%) |
| High School Diploma | 0 (0.0%) | 51 (100.0%) |
| College/Associate Degree | 37 (100.0%) | 0 (0.0%) |
| Bachelor's Degree or higher | 0 (0.0%) | 0 (0.0%) |
Occupancy by Age of Householder in Salton Sea Beach
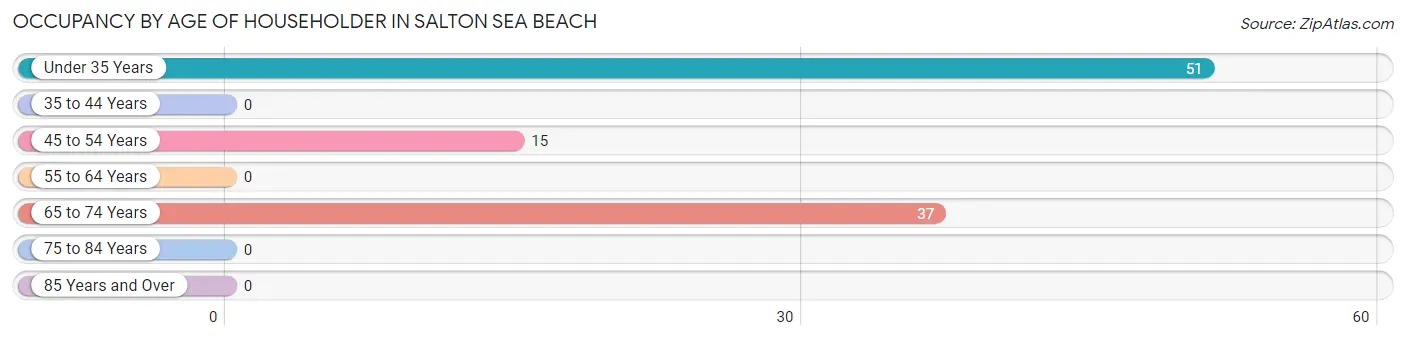
| Age Bracket | # Households | % Households |
| Under 35 Years | 51 | 49.5% |
| 35 to 44 Years | 0 | 0.0% |
| 45 to 54 Years | 15 | 14.6% |
| 55 to 64 Years | 0 | 0.0% |
| 65 to 74 Years | 37 | 35.9% |
| 75 to 84 Years | 0 | 0.0% |
| 85 Years and Over | 0 | 0.0% |
| Total | 103 | 100.0% |
Housing Finances in Salton Sea Beach
Median Income by Occupancy in Salton Sea Beach
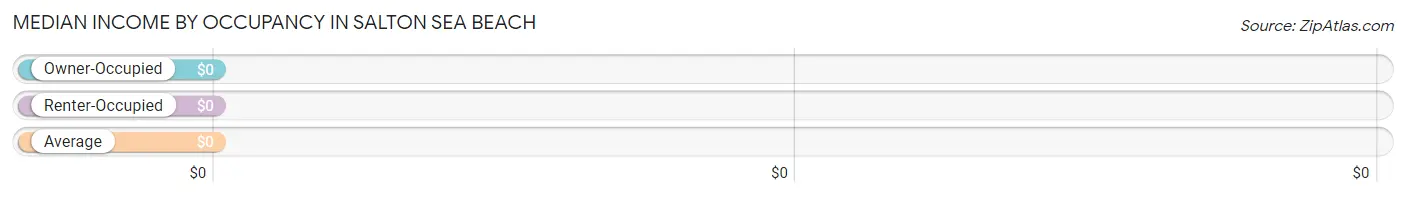
| Occupancy Type | # Households | Median Income |
| Owner-Occupied | 52 (50.5%) | $0 |
| Renter-Occupied | 51 (49.5%) | $0 |
| Average | 103 (100.0%) | $0 |
Occupancy by Householder Income Bracket in Salton Sea Beach
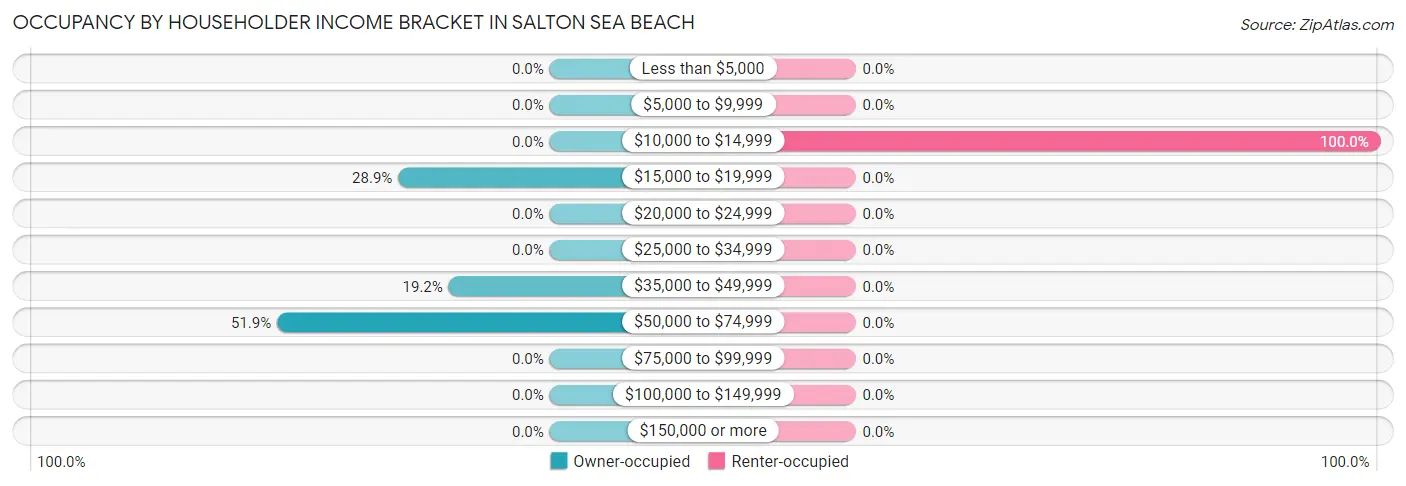
| Income Bracket | Owner-occupied | Renter-occupied |
| Less than $5,000 | 0 (0.0%) | 0 (0.0%) |
| $5,000 to $9,999 | 0 (0.0%) | 0 (0.0%) |
| $10,000 to $14,999 | 0 (0.0%) | 51 (100.0%) |
| $15,000 to $19,999 | 15 (28.8%) | 0 (0.0%) |
| $20,000 to $24,999 | 0 (0.0%) | 0 (0.0%) |
| $25,000 to $34,999 | 0 (0.0%) | 0 (0.0%) |
| $35,000 to $49,999 | 10 (19.2%) | 0 (0.0%) |
| $50,000 to $74,999 | 27 (51.9%) | 0 (0.0%) |
| $75,000 to $99,999 | 0 (0.0%) | 0 (0.0%) |
| $100,000 to $149,999 | 0 (0.0%) | 0 (0.0%) |
| $150,000 or more | 0 (0.0%) | 0 (0.0%) |
| Total | 52 (100.0%) | 51 (100.0%) |
Monthly Housing Cost Tiers in Salton Sea Beach
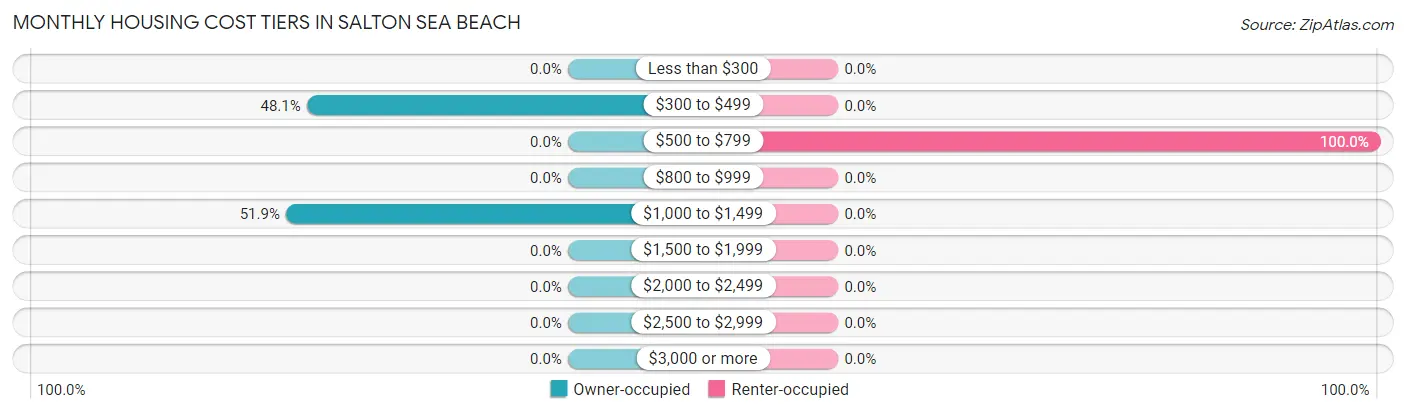
| Monthly Cost | Owner-occupied | Renter-occupied |
| Less than $300 | 0 (0.0%) | 0 (0.0%) |
| $300 to $499 | 25 (48.1%) | 0 (0.0%) |
| $500 to $799 | 0 (0.0%) | 51 (100.0%) |
| $800 to $999 | 0 (0.0%) | 0 (0.0%) |
| $1,000 to $1,499 | 27 (51.9%) | 0 (0.0%) |
| $1,500 to $1,999 | 0 (0.0%) | 0 (0.0%) |
| $2,000 to $2,499 | 0 (0.0%) | 0 (0.0%) |
| $2,500 to $2,999 | 0 (0.0%) | 0 (0.0%) |
| $3,000 or more | 0 (0.0%) | 0 (0.0%) |
| Total | 52 (100.0%) | 51 (100.0%) |
Physical Housing Characteristics in Salton Sea Beach
Housing Structures in Salton Sea Beach
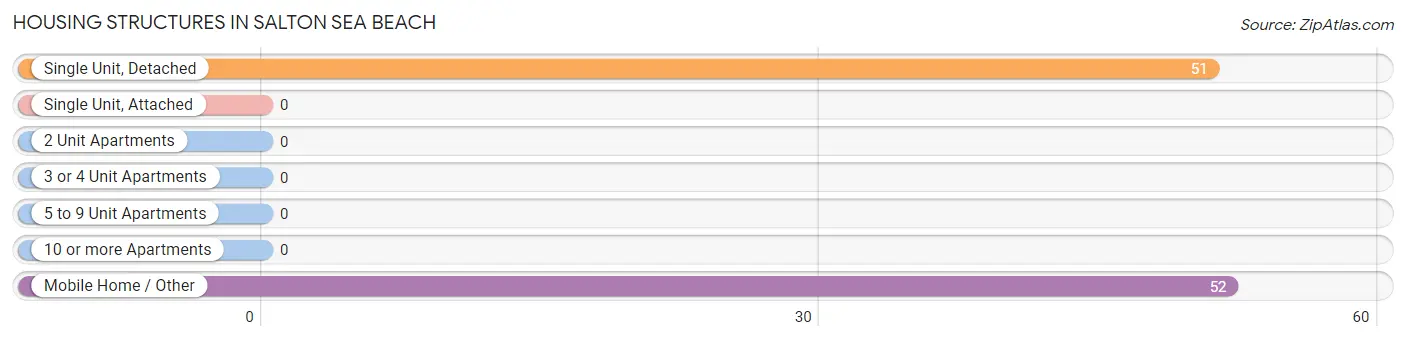
| Structure Type | # Housing Units | % Housing Units |
| Single Unit, Detached | 51 | 49.5% |
| Single Unit, Attached | 0 | 0.0% |
| 2 Unit Apartments | 0 | 0.0% |
| 3 or 4 Unit Apartments | 0 | 0.0% |
| 5 to 9 Unit Apartments | 0 | 0.0% |
| 10 or more Apartments | 0 | 0.0% |
| Mobile Home / Other | 52 | 50.5% |
| Total | 103 | 100.0% |
Housing Structures by Occupancy in Salton Sea Beach
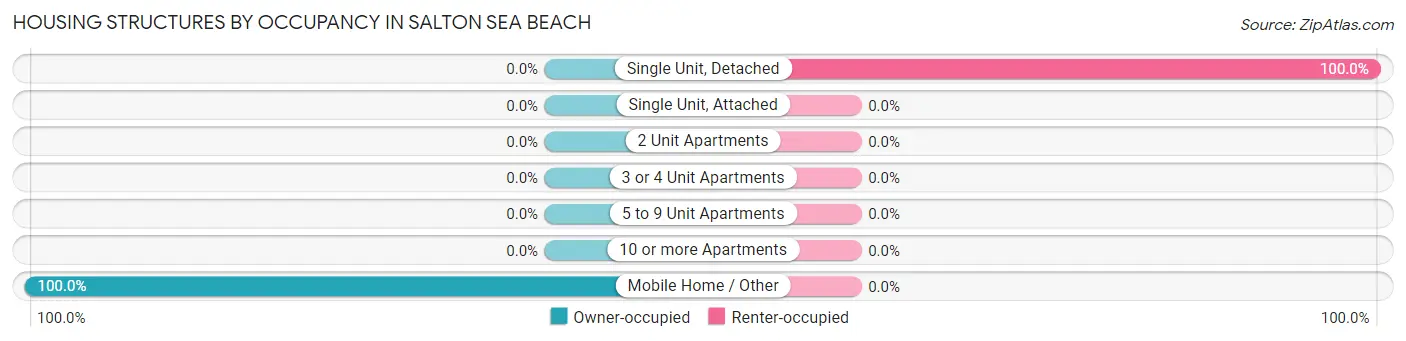
| Structure Type | Owner-occupied | Renter-occupied |
| Single Unit, Detached | 0 (0.0%) | 51 (100.0%) |
| Single Unit, Attached | 0 (0.0%) | 0 (0.0%) |
| 2 Unit Apartments | 0 (0.0%) | 0 (0.0%) |
| 3 or 4 Unit Apartments | 0 (0.0%) | 0 (0.0%) |
| 5 to 9 Unit Apartments | 0 (0.0%) | 0 (0.0%) |
| 10 or more Apartments | 0 (0.0%) | 0 (0.0%) |
| Mobile Home / Other | 52 (100.0%) | 0 (0.0%) |
| Total | 52 (50.5%) | 51 (49.5%) |
Housing Structures by Number of Rooms in Salton Sea Beach
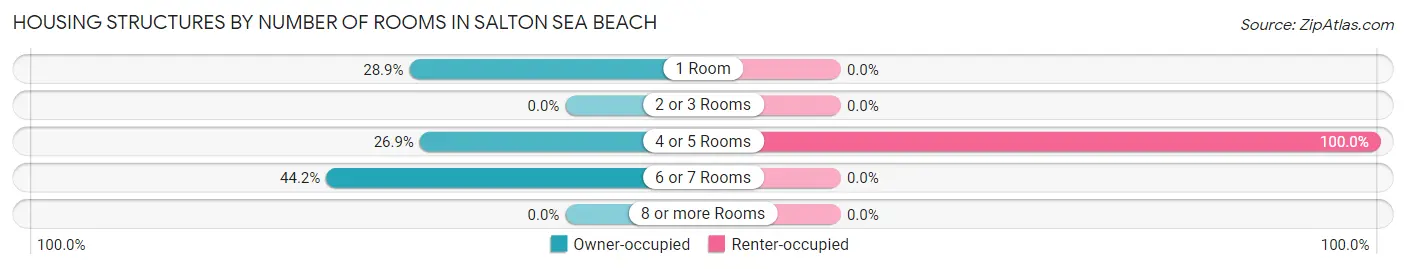
| Number of Rooms | Owner-occupied | Renter-occupied |
| 1 Room | 15 (28.8%) | 0 (0.0%) |
| 2 or 3 Rooms | 0 (0.0%) | 0 (0.0%) |
| 4 or 5 Rooms | 14 (26.9%) | 51 (100.0%) |
| 6 or 7 Rooms | 23 (44.2%) | 0 (0.0%) |
| 8 or more Rooms | 0 (0.0%) | 0 (0.0%) |
| Total | 52 (100.0%) | 51 (100.0%) |
Housing Structure by Heating Type in Salton Sea Beach
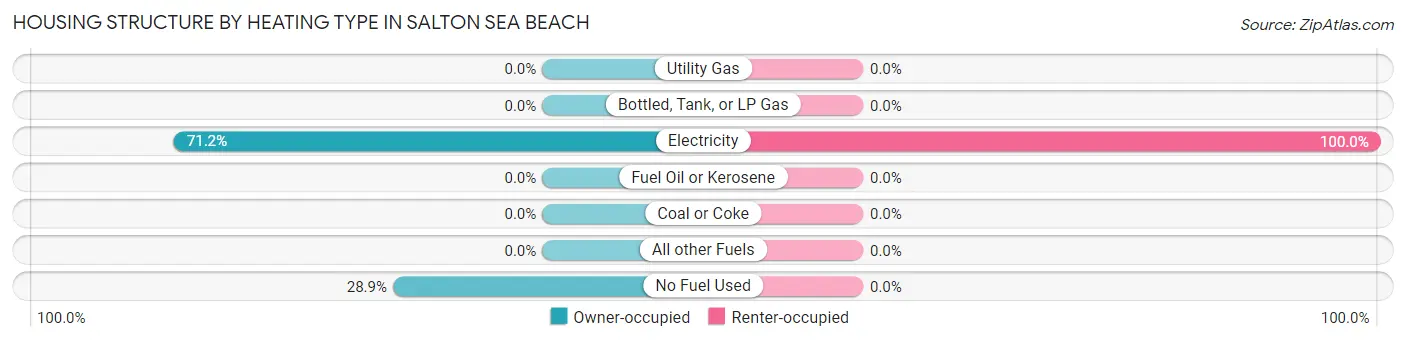
| Heating Type | Owner-occupied | Renter-occupied |
| Utility Gas | 0 (0.0%) | 0 (0.0%) |
| Bottled, Tank, or LP Gas | 0 (0.0%) | 0 (0.0%) |
| Electricity | 37 (71.2%) | 51 (100.0%) |
| Fuel Oil or Kerosene | 0 (0.0%) | 0 (0.0%) |
| Coal or Coke | 0 (0.0%) | 0 (0.0%) |
| All other Fuels | 0 (0.0%) | 0 (0.0%) |
| No Fuel Used | 15 (28.8%) | 0 (0.0%) |
| Total | 52 (100.0%) | 51 (100.0%) |
Household Vehicle Usage in Salton Sea Beach
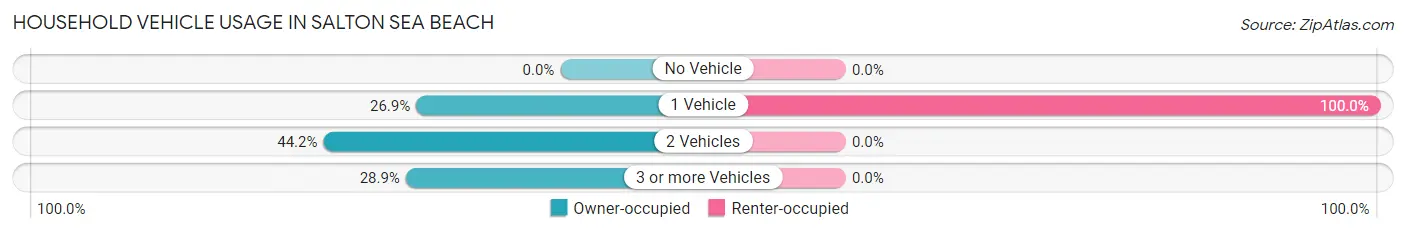
| Vehicles per Household | Owner-occupied | Renter-occupied |
| No Vehicle | 0 (0.0%) | 0 (0.0%) |
| 1 Vehicle | 14 (26.9%) | 51 (100.0%) |
| 2 Vehicles | 23 (44.2%) | 0 (0.0%) |
| 3 or more Vehicles | 15 (28.8%) | 0 (0.0%) |
| Total | 52 (100.0%) | 51 (100.0%) |
Real Estate & Mortgages in Salton Sea Beach
Real Estate and Mortgage Overview in Salton Sea Beach
| Characteristic | Without Mortgage | With Mortgage |
| Housing Units | 25 | 27 |
| Median Property Value | - | - |
| Median Household Income | - | - |
| Monthly Housing Costs | - | - |
| Real Estate Taxes | - | - |
Property Value by Mortgage Status in Salton Sea Beach
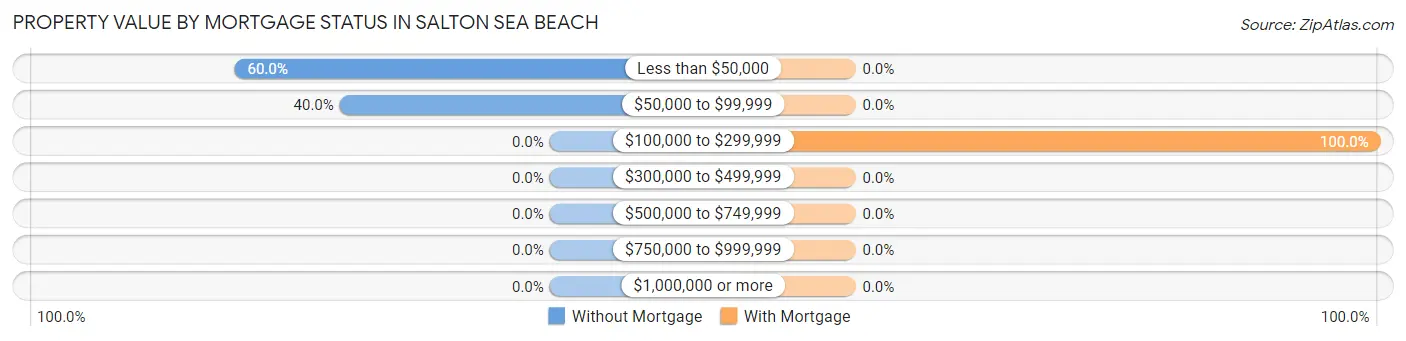
| Property Value | Without Mortgage | With Mortgage |
| Less than $50,000 | 15 (60.0%) | 0 (0.0%) |
| $50,000 to $99,999 | 10 (40.0%) | 0 (0.0%) |
| $100,000 to $299,999 | 0 (0.0%) | 27 (100.0%) |
| $300,000 to $499,999 | 0 (0.0%) | 0 (0.0%) |
| $500,000 to $749,999 | 0 (0.0%) | 0 (0.0%) |
| $750,000 to $999,999 | 0 (0.0%) | 0 (0.0%) |
| $1,000,000 or more | 0 (0.0%) | 0 (0.0%) |
| Total | 25 (100.0%) | 27 (100.0%) |
Household Income by Mortgage Status in Salton Sea Beach
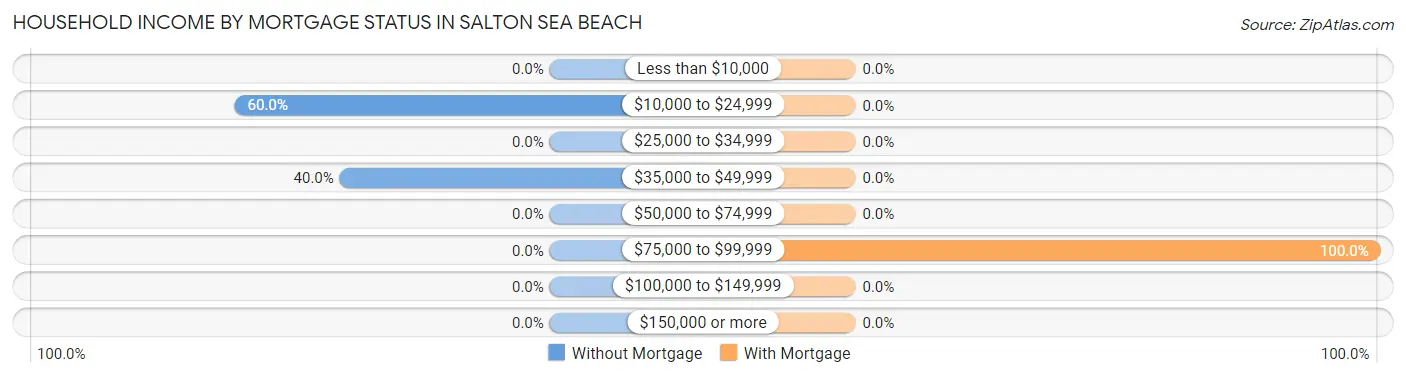
| Household Income | Without Mortgage | With Mortgage |
| Less than $10,000 | 0 (0.0%) | 0 (0.0%) |
| $10,000 to $24,999 | 15 (60.0%) | 0 (0.0%) |
| $25,000 to $34,999 | 0 (0.0%) | 0 (0.0%) |
| $35,000 to $49,999 | 10 (40.0%) | 0 (0.0%) |
| $50,000 to $74,999 | 0 (0.0%) | 0 (0.0%) |
| $75,000 to $99,999 | 0 (0.0%) | 27 (100.0%) |
| $100,000 to $149,999 | 0 (0.0%) | 0 (0.0%) |
| $150,000 or more | 0 (0.0%) | 0 (0.0%) |
| Total | 25 (100.0%) | 27 (100.0%) |
Property Value to Household Income Ratio in Salton Sea Beach
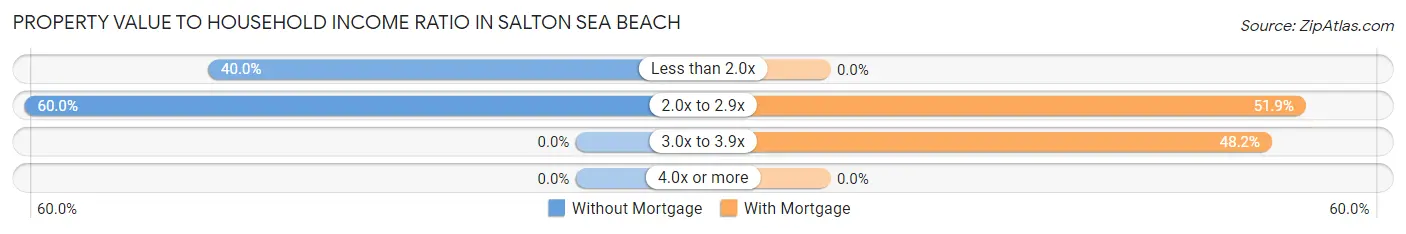
| Value-to-Income Ratio | Without Mortgage | With Mortgage |
| Less than 2.0x | 10 (40.0%) | 0 (0.0%) |
| 2.0x to 2.9x | 15 (60.0%) | 14 (51.8%) |
| 3.0x to 3.9x | 0 (0.0%) | 13 (48.1%) |
| 4.0x or more | 0 (0.0%) | 0 (0.0%) |
| Total | 25 (100.0%) | 27 (100.0%) |
Real Estate Taxes by Mortgage Status in Salton Sea Beach
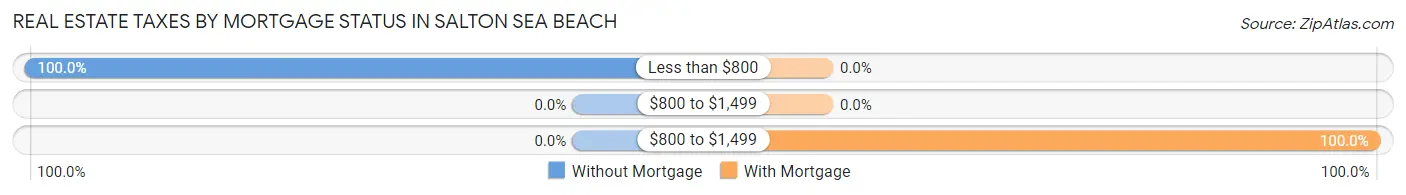
| Property Taxes | Without Mortgage | With Mortgage |
| Less than $800 | 25 (100.0%) | 0 (0.0%) |
| $800 to $1,499 | 0 (0.0%) | 0 (0.0%) |
| $800 to $1,499 | 0 (0.0%) | 27 (100.0%) |
| Total | 25 (100.0%) | 27 (100.0%) |
Health & Disability in Salton Sea Beach
Health Insurance Coverage by Age in Salton Sea Beach
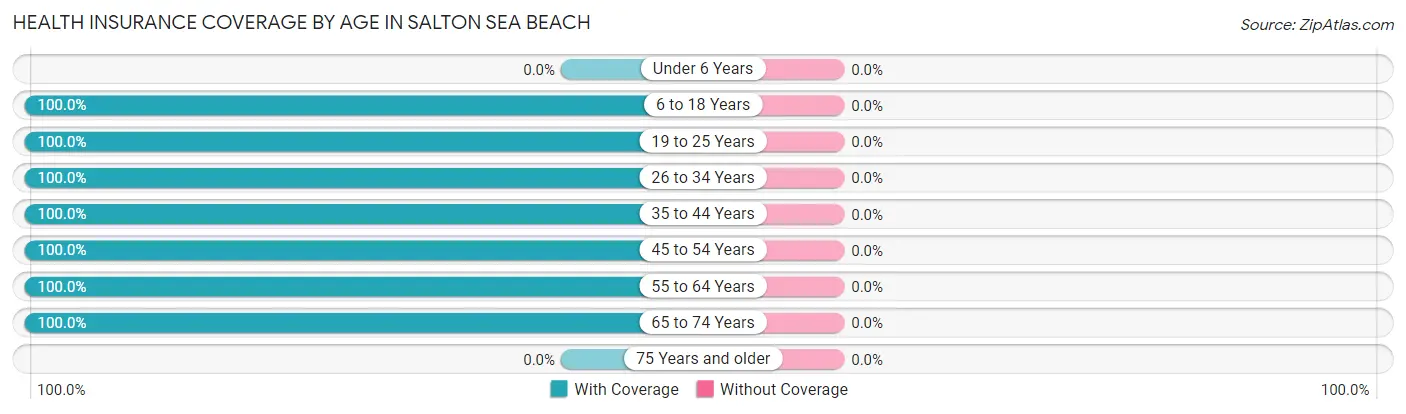
| Age Bracket | With Coverage | Without Coverage |
| Under 6 Years | 0 (0.0%) | 0 (0.0%) |
| 6 to 18 Years | 1 (100.0%) | 0 (0.0%) |
| 19 to 25 Years | 40 (100.0%) | 0 (0.0%) |
| 26 to 34 Years | 51 (100.0%) | 0 (0.0%) |
| 35 to 44 Years | 1 (100.0%) | 0 (0.0%) |
| 45 to 54 Years | 23 (100.0%) | 0 (0.0%) |
| 55 to 64 Years | 22 (100.0%) | 0 (0.0%) |
| 65 to 74 Years | 48 (100.0%) | 0 (0.0%) |
| 75 Years and older | 0 (0.0%) | 0 (0.0%) |
| Total | 186 (100.0%) | 0 (0.0%) |
Health Insurance Coverage by Citizenship Status in Salton Sea Beach
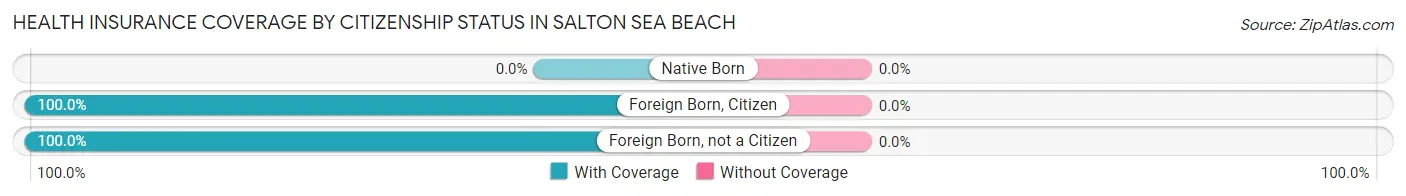
| Citizenship Status | With Coverage | Without Coverage |
| Native Born | 0 (0.0%) | 0 (0.0%) |
| Foreign Born, Citizen | 1 (100.0%) | 0 (0.0%) |
| Foreign Born, not a Citizen | 40 (100.0%) | 0 (0.0%) |
Health Insurance Coverage by Household Income in Salton Sea Beach
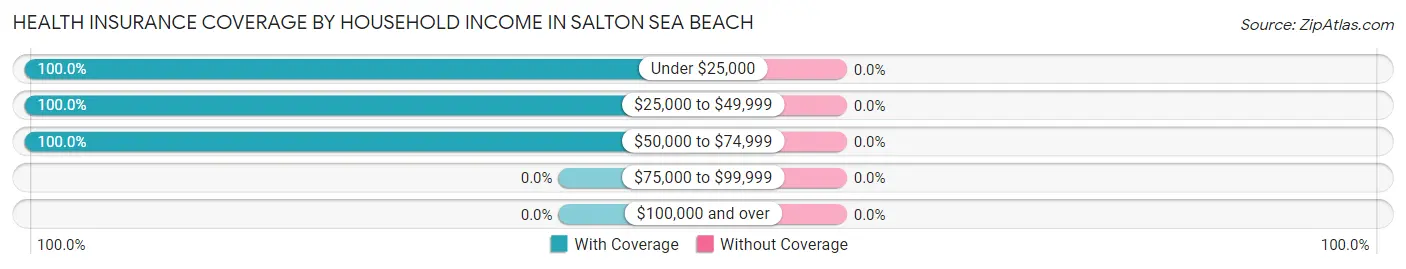
| Household Income | With Coverage | Without Coverage |
| Under $25,000 | 114 (100.0%) | 0 (0.0%) |
| $25,000 to $49,999 | 19 (100.0%) | 0 (0.0%) |
| $50,000 to $74,999 | 51 (100.0%) | 0 (0.0%) |
| $75,000 to $99,999 | 0 (0.0%) | 0 (0.0%) |
| $100,000 and over | 0 (0.0%) | 0 (0.0%) |
Public vs Private Health Insurance Coverage by Age in Salton Sea Beach
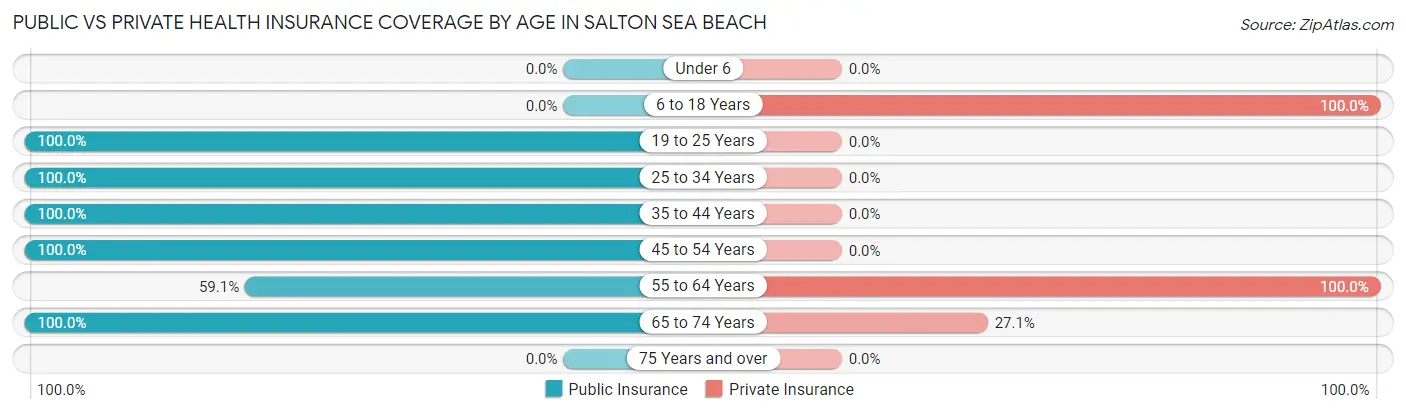
| Age Bracket | Public Insurance | Private Insurance |
| Under 6 | 0 (0.0%) | 0 (0.0%) |
| 6 to 18 Years | 0 (0.0%) | 1 (100.0%) |
| 19 to 25 Years | 40 (100.0%) | 0 (0.0%) |
| 25 to 34 Years | 51 (100.0%) | 0 (0.0%) |
| 35 to 44 Years | 1 (100.0%) | 0 (0.0%) |
| 45 to 54 Years | 23 (100.0%) | 0 (0.0%) |
| 55 to 64 Years | 13 (59.1%) | 22 (100.0%) |
| 65 to 74 Years | 48 (100.0%) | 13 (27.1%) |
| 75 Years and over | 0 (0.0%) | 0 (0.0%) |
| Total | 176 (94.6%) | 36 (19.4%) |
Disability Status by Sex by Age in Salton Sea Beach
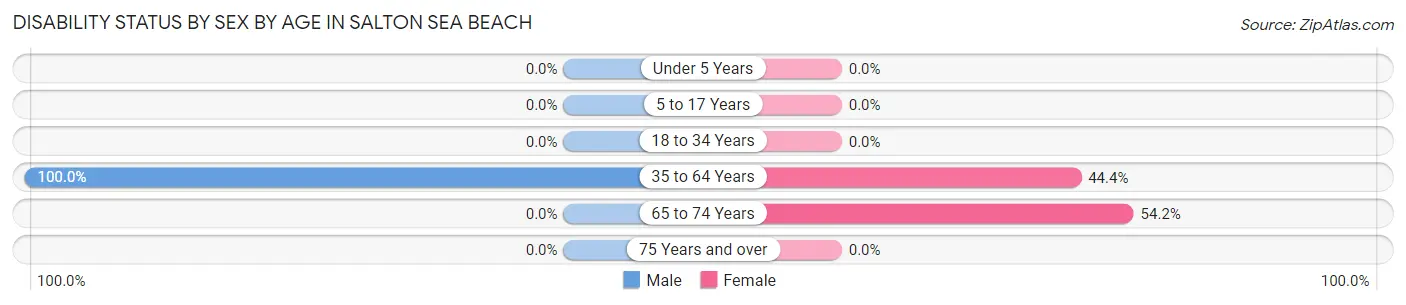
| Age Bracket | Male | Female |
| Under 5 Years | 0 (0.0%) | 0 (0.0%) |
| 5 to 17 Years | 0 (0.0%) | 0 (0.0%) |
| 18 to 34 Years | 0 (0.0%) | 0 (0.0%) |
| 35 to 64 Years | 28 (100.0%) | 8 (44.4%) |
| 65 to 74 Years | 0 (0.0%) | 13 (54.2%) |
| 75 Years and over | 0 (0.0%) | 0 (0.0%) |
Disability Class by Sex by Age in Salton Sea Beach
Disability Class: Hearing Difficulty
| Age Bracket | Male | Female |
| Under 5 Years | 0 (0.0%) | 0 (0.0%) |
| 5 to 17 Years | 0 (0.0%) | 0 (0.0%) |
| 18 to 34 Years | 0 (0.0%) | 0 (0.0%) |
| 35 to 64 Years | 0 (0.0%) | 0 (0.0%) |
| 65 to 74 Years | 0 (0.0%) | 0 (0.0%) |
| 75 Years and over | 0 (0.0%) | 0 (0.0%) |
Disability Class: Vision Difficulty
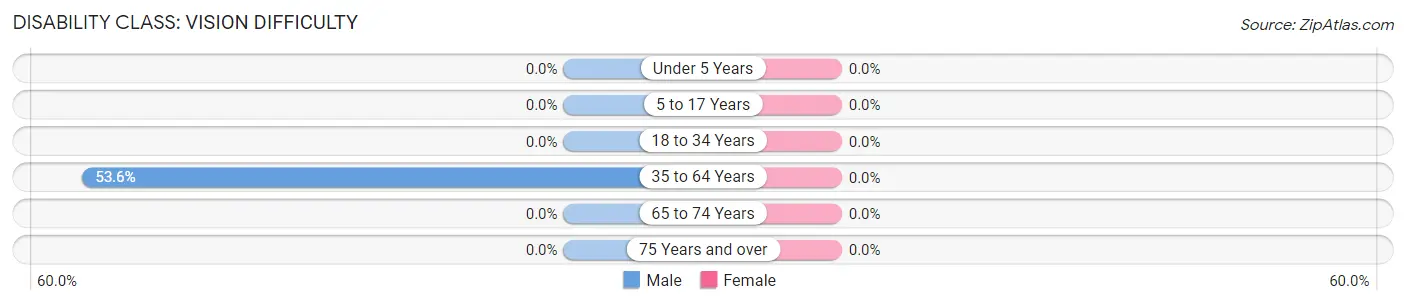
| Age Bracket | Male | Female |
| Under 5 Years | 0 (0.0%) | 0 (0.0%) |
| 5 to 17 Years | 0 (0.0%) | 0 (0.0%) |
| 18 to 34 Years | 0 (0.0%) | 0 (0.0%) |
| 35 to 64 Years | 15 (53.6%) | 0 (0.0%) |
| 65 to 74 Years | 0 (0.0%) | 0 (0.0%) |
| 75 Years and over | 0 (0.0%) | 0 (0.0%) |
Disability Class: Cognitive Difficulty
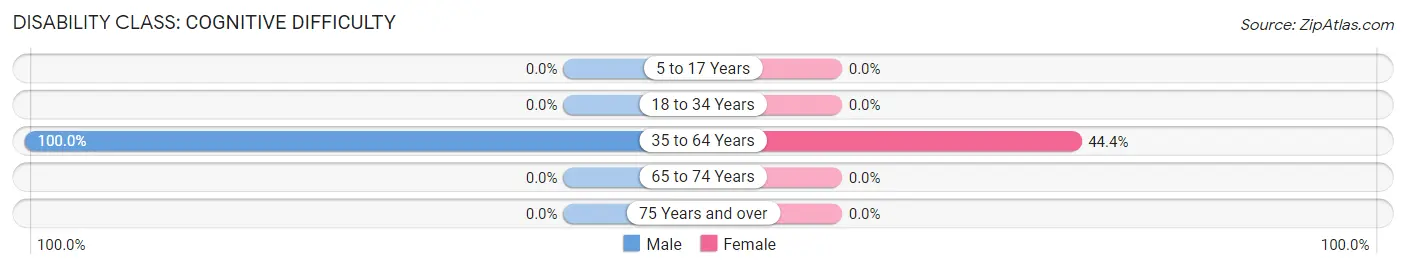
| Age Bracket | Male | Female |
| 5 to 17 Years | 0 (0.0%) | 0 (0.0%) |
| 18 to 34 Years | 0 (0.0%) | 0 (0.0%) |
| 35 to 64 Years | 28 (100.0%) | 8 (44.4%) |
| 65 to 74 Years | 0 (0.0%) | 0 (0.0%) |
| 75 Years and over | 0 (0.0%) | 0 (0.0%) |
Disability Class: Ambulatory Difficulty
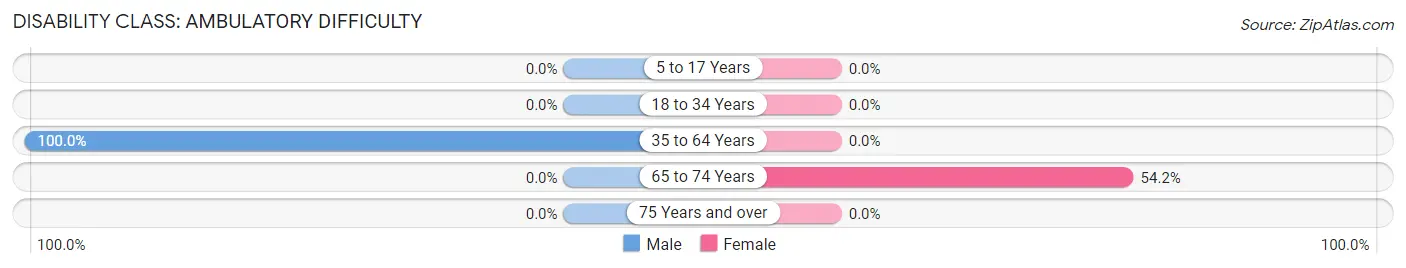
| Age Bracket | Male | Female |
| 5 to 17 Years | 0 (0.0%) | 0 (0.0%) |
| 18 to 34 Years | 0 (0.0%) | 0 (0.0%) |
| 35 to 64 Years | 28 (100.0%) | 0 (0.0%) |
| 65 to 74 Years | 0 (0.0%) | 13 (54.2%) |
| 75 Years and over | 0 (0.0%) | 0 (0.0%) |
Disability Class: Self-Care Difficulty
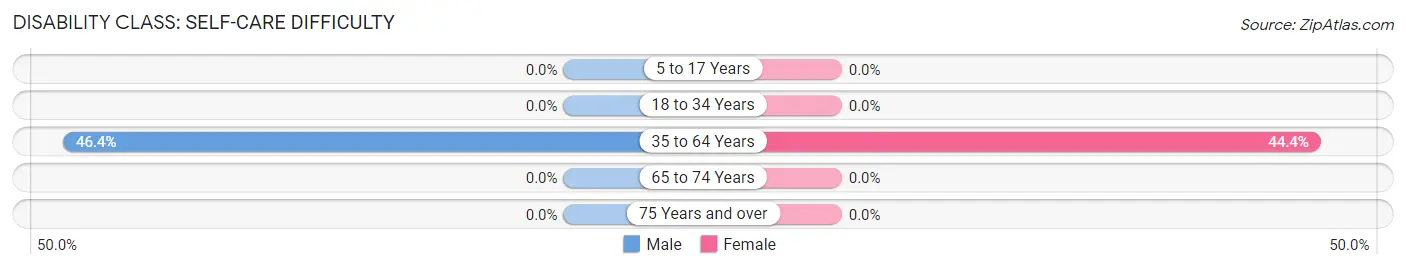
| Age Bracket | Male | Female |
| 5 to 17 Years | 0 (0.0%) | 0 (0.0%) |
| 18 to 34 Years | 0 (0.0%) | 0 (0.0%) |
| 35 to 64 Years | 13 (46.4%) | 8 (44.4%) |
| 65 to 74 Years | 0 (0.0%) | 0 (0.0%) |
| 75 Years and over | 0 (0.0%) | 0 (0.0%) |
Technology Access in Salton Sea Beach
Computing Device Access in Salton Sea Beach
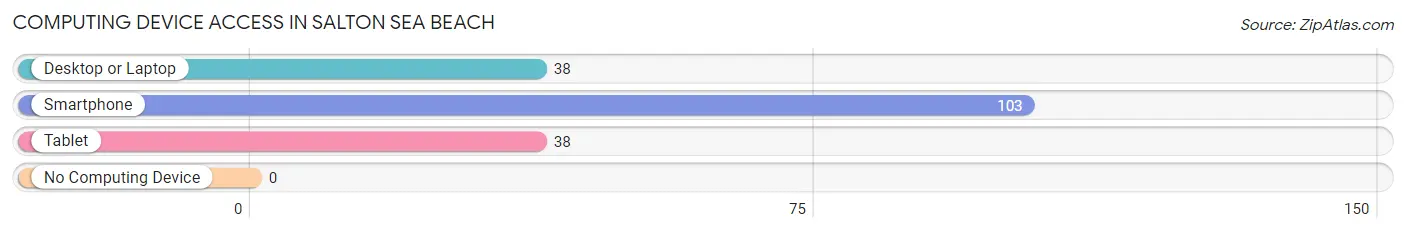
| Device Type | # Households | % Households |
| Desktop or Laptop | 38 | 36.9% |
| Smartphone | 103 | 100.0% |
| Tablet | 38 | 36.9% |
| No Computing Device | 0 | 0.0% |
| Total | 103 | 100.0% |
Internet Access in Salton Sea Beach
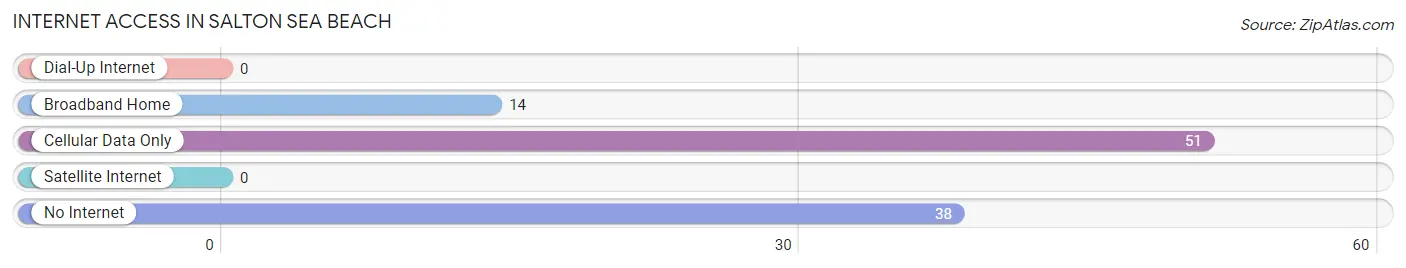
| Internet Type | # Households | % Households |
| Dial-Up Internet | 0 | 0.0% |
| Broadband Home | 14 | 13.6% |
| Cellular Data Only | 51 | 49.5% |
| Satellite Internet | 0 | 0.0% |
| No Internet | 38 | 36.9% |
| Total | 103 | 100.0% |
Salton Sea Beach Summary
Salton Sea Beach is a small unincorporated community located in Imperial County, California. It is situated on the eastern shore of the Salton Sea, a large saline lake located in the Colorado Desert of Southern California. The community is located approximately 10 miles south of the city of Calipatria and is part of the El Centro Metropolitan Statistical Area.
History
The Salton Sea was created in 1905 when the Colorado River breached an irrigation canal and flooded the Salton Sink. The lake quickly became a popular destination for recreational activities such as fishing, boating, and swimming. In the 1920s, the area around the Salton Sea began to be developed as a resort destination. The first resort in the area was the Salton Sea Beach Hotel, which opened in 1926. The hotel was a popular destination for Hollywood celebrities and other vacationers.
In the 1950s, the Salton Sea Beach area began to experience a decline in popularity as other resort destinations in the region became more popular. The hotel closed in the 1960s and the area began to be used primarily for agricultural purposes. In the 1970s, the Salton Sea began to experience an increase in salinity due to agricultural runoff and other sources of pollution. This caused a decline in the fish population and other aquatic life in the lake.
Geography
Salton Sea Beach is located in the Colorado Desert of Southern California. The community is situated on the eastern shore of the Salton Sea, a large saline lake located in the desert. The lake is approximately 35 miles long and 15 miles wide and has a maximum depth of 51 feet. The lake is fed by the New and Alamo Rivers, which flow into the lake from the north and south, respectively. The lake is surrounded by the Imperial, Riverside, and San Diego Counties.
The climate in the area is hot and dry, with temperatures ranging from the mid-90s in the summer to the mid-60s in the winter. The area receives an average of less than three inches of precipitation per year.
Economy
The economy of Salton Sea Beach is largely based on agriculture and tourism. The area is home to a number of farms that produce a variety of crops, including alfalfa, cotton, and vegetables. The area is also home to a number of resorts and recreational activities, such as fishing, boating, and swimming.
Demographics
As of the 2010 census, the population of Salton Sea Beach was 1,945. The racial makeup of the community was 73.3% White, 0.7% African American, 0.3% Native American, 0.2% Asian, 0.1% Pacific Islander, 22.7% from other races, and 2.7% from two or more races. Hispanic or Latino of any race were 44.2% of the population.
The median household income in Salton Sea Beach was $25,938, and the median family income was $30,938. The per capita income for the community was $13,938. About 24.3% of families and 28.2% of the population were below the poverty line, including 37.3% of those under age 18 and 10.3% of those age 65 or over.
Common Questions
What is Per Capita Income in Salton Sea Beach?
Per Capita income in Salton Sea Beach is $17,165.
What is Inequality or Gini Index in Salton Sea Beach?
Inequality or Gini Index in Salton Sea Beach is 0.38.
What is the Total Population of Salton Sea Beach?
Total Population of Salton Sea Beach is 186.
What is the Total Male Population of Salton Sea Beach?
Total Male Population of Salton Sea Beach is 92.
What is the Total Female Population of Salton Sea Beach?
Total Female Population of Salton Sea Beach is 94.
What is the Ratio of Males per 100 Females in Salton Sea Beach?
There are 97.87 Males per 100 Females in Salton Sea Beach.
What is the Ratio of Females per 100 Males in Salton Sea Beach?
There are 102.17 Females per 100 Males in Salton Sea Beach.
What is the Median Population Age in Salton Sea Beach?
Median Population Age in Salton Sea Beach is 45.5 Years.
What is the Average Family Size in Salton Sea Beach
Average Family Size in Salton Sea Beach is 2.6 People.
What is the Average Household Size in Salton Sea Beach
Average Household Size in Salton Sea Beach is 1.8 People.
How Large is the Labor Force in Salton Sea Beach?
There are 104 People in the Labor Forcein in Salton Sea Beach.
What is the Percentage of People in the Labor Force in Salton Sea Beach?
55.9% of People are in the Labor Force in Salton Sea Beach.
What is the Unemployment Rate in Salton Sea Beach?
Unemployment Rate in Salton Sea Beach is 49.0%.