Cities with the Highest Percentage of Population Employed in Food Preparation & Serving in Arizona
RELATED REPORTS & OPTIONS
Food Preparation & Serving
Arizona
Compare Cities
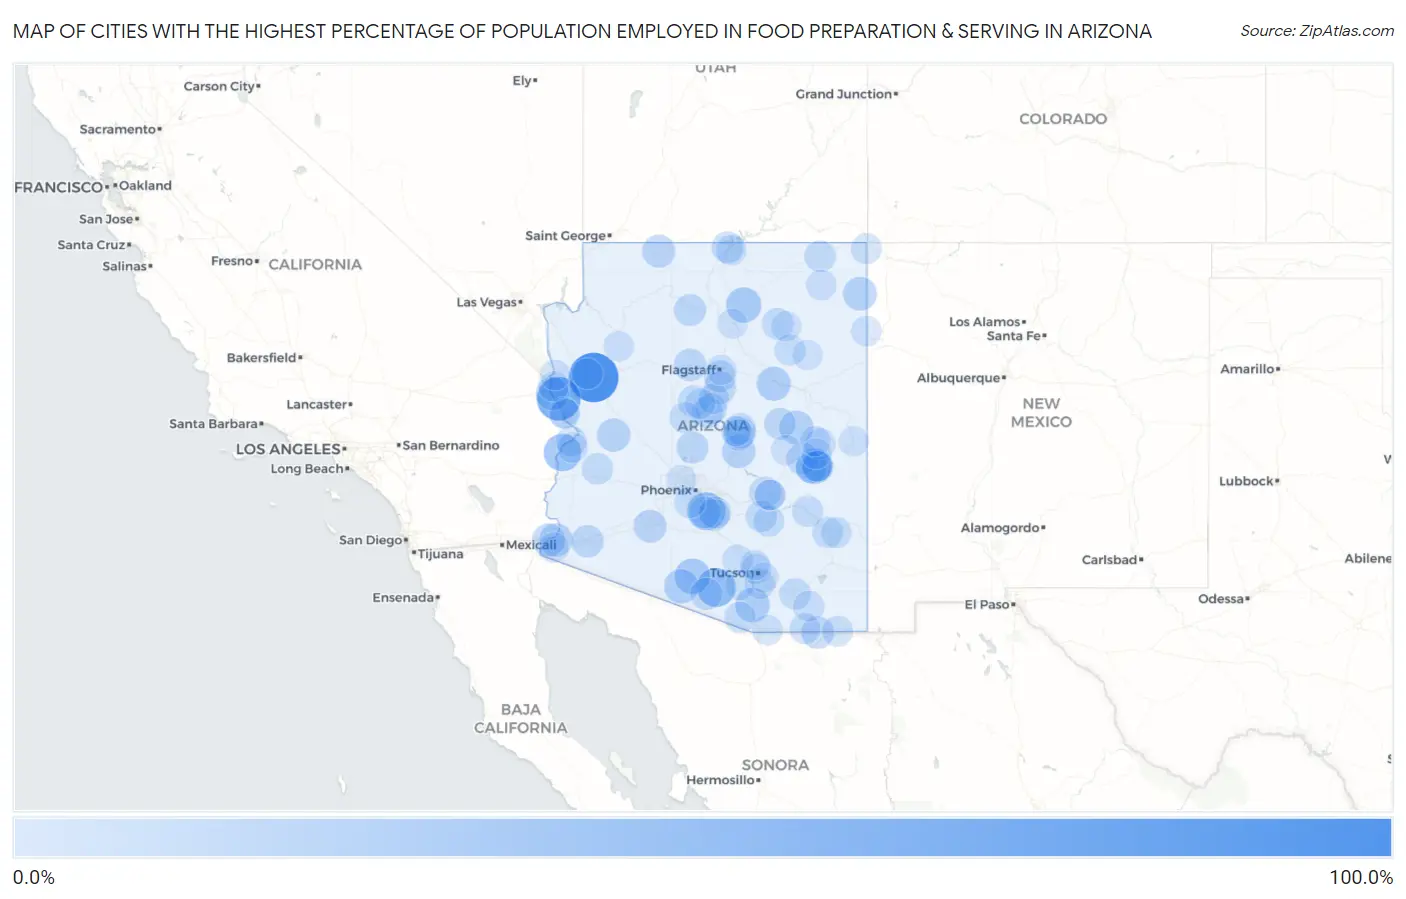
Map of Cities with the Highest Percentage of Population Employed in Food Preparation & Serving in Arizona
0.0%
100.0%
Cities with the Highest Percentage of Population Employed in Food Preparation & Serving in Arizona
| City | % Employed | vs State | vs National | |
| 1. | Pine Lake | 100.0% | 5.7%(+94.3)#1 | 5.3%(+94.7)#12 |
| 2. | Golden Shores | 71.3% | 5.7%(+65.6)#2 | 5.3%(+66.0)#54 |
| 3. | Haivana Nakya | 48.3% | 5.7%(+42.6)#3 | 5.3%(+43.0)#127 |
| 4. | Wet Camp Village | 43.8% | 5.7%(+38.1)#4 | 5.3%(+38.5)#151 |
| 5. | Poston | 41.5% | 5.7%(+35.9)#5 | 5.3%(+36.3)#173 |
| 6. | Fort Apache | 32.6% | 5.7%(+26.9)#6 | 5.3%(+27.3)#290 |
| 7. | Maish Vaya | 32.0% | 5.7%(+26.3)#7 | 5.3%(+26.7)#298 |
| 8. | Moenkopi | 31.1% | 5.7%(+25.4)#8 | 5.3%(+25.8)#315 |
| 9. | Forest Lakes | 31.1% | 5.7%(+25.4)#9 | 5.3%(+25.8)#316 |
| 10. | Arivaca Junction | 27.7% | 5.7%(+22.0)#10 | 5.3%(+22.4)#408 |
| 11. | Pisinemo | 26.9% | 5.7%(+21.2)#11 | 5.3%(+21.6)#437 |
| 12. | Winslow West | 25.6% | 5.7%(+20.0)#12 | 5.3%(+20.3)#481 |
| 13. | Turkey Creek | 25.5% | 5.7%(+19.8)#13 | 5.3%(+20.2)#487 |
| 14. | Clay Springs | 25.0% | 5.7%(+19.3)#14 | 5.3%(+19.7)#502 |
| 15. | Sehili | 24.0% | 5.7%(+18.3)#15 | 5.3%(+18.7)#549 |
| 16. | Jakes Corner | 22.9% | 5.7%(+17.2)#16 | 5.3%(+17.6)#624 |
| 17. | Arizona Village | 22.3% | 5.7%(+16.7)#17 | 5.3%(+17.0)#650 |
| 18. | El Prado Estates | 22.2% | 5.7%(+16.6)#18 | 5.3%(+16.9)#657 |
| 19. | Alamo Lake | 22.2% | 5.7%(+16.6)#19 | 5.3%(+16.9)#672 |
| 20. | Avenue B And C | 20.7% | 5.7%(+15.0)#20 | 5.3%(+15.4)#766 |
| 21. | Kaibab | 20.0% | 5.7%(+14.3)#21 | 5.3%(+14.7)#844 |
| 22. | Theba | 19.6% | 5.7%(+13.9)#22 | 5.3%(+14.3)#887 |
| 23. | Naco | 18.5% | 5.7%(+12.8)#23 | 5.3%(+13.2)#1,008 |
| 24. | Williams | 18.2% | 5.7%(+12.6)#24 | 5.3%(+12.9)#1,039 |
| 25. | Tacna | 18.1% | 5.7%(+12.5)#25 | 5.3%(+12.9)#1,051 |
| 26. | Greenehaven | 17.1% | 5.7%(+11.4)#26 | 5.3%(+11.8)#1,191 |
| 27. | Grand Canyon Village | 16.5% | 5.7%(+10.8)#27 | 5.3%(+11.2)#1,302 |
| 28. | Sells | 16.4% | 5.7%(+10.7)#28 | 5.3%(+11.1)#1,318 |
| 29. | Black Canyon City | 16.3% | 5.7%(+10.6)#29 | 5.3%(+11.0)#1,329 |
| 30. | Munds Park | 16.3% | 5.7%(+10.6)#30 | 5.3%(+11.0)#1,338 |
| 31. | Cedar Creek | 16.1% | 5.7%(+10.5)#31 | 5.3%(+10.9)#1,376 |
| 32. | Mesa Del Caballo | 16.0% | 5.7%(+10.3)#32 | 5.3%(+10.7)#1,407 |
| 33. | Mountainaire | 15.8% | 5.7%(+10.1)#33 | 5.3%(+10.5)#1,454 |
| 34. | Heber Overgaard | 15.7% | 5.7%(+10.1)#34 | 5.3%(+10.4)#1,467 |
| 35. | Sacaton | 15.5% | 5.7%(+9.83)#35 | 5.3%(+10.2)#1,506 |
| 36. | Upper Santan Village | 15.5% | 5.7%(+9.82)#36 | 5.3%(+10.2)#1,508 |
| 37. | Claypool | 15.5% | 5.7%(+9.81)#37 | 5.3%(+10.2)#1,514 |
| 38. | Casa Blanca | 15.1% | 5.7%(+9.39)#38 | 5.3%(+9.77)#1,613 |
| 39. | Page | 14.8% | 5.7%(+9.18)#39 | 5.3%(+9.56)#1,676 |
| 40. | Camp Verde | 14.5% | 5.7%(+8.88)#40 | 5.3%(+9.26)#1,756 |
| 41. | Beaver Valley | 14.3% | 5.7%(+8.62)#41 | 5.3%(+9.00)#1,824 |
| 42. | Kykotsmovi Village | 14.2% | 5.7%(+8.53)#42 | 5.3%(+8.91)#1,860 |
| 43. | Jerome | 14.0% | 5.7%(+8.32)#43 | 5.3%(+8.70)#1,923 |
| 44. | Vicksburg | 13.7% | 5.7%(+8.03)#44 | 5.3%(+8.41)#2,004 |
| 45. | Benson | 13.7% | 5.7%(+8.02)#45 | 5.3%(+8.40)#2,008 |
| 46. | Dennehotso | 13.5% | 5.7%(+7.81)#46 | 5.3%(+8.19)#2,076 |
| 47. | Canyon Day | 13.4% | 5.7%(+7.72)#47 | 5.3%(+8.10)#2,108 |
| 48. | Kearny | 13.3% | 5.7%(+7.58)#48 | 5.3%(+7.96)#2,160 |
| 49. | Payson | 13.0% | 5.7%(+7.31)#49 | 5.3%(+7.69)#2,266 |
| 50. | Gila Crossing | 12.9% | 5.7%(+7.20)#50 | 5.3%(+7.59)#2,311 |
| 51. | Pinetop Country Club | 12.5% | 5.7%(+6.83)#51 | 5.3%(+7.21)#2,478 |
| 52. | Bylas | 12.4% | 5.7%(+6.76)#52 | 5.3%(+7.14)#2,549 |
| 53. | Hayden | 12.2% | 5.7%(+6.56)#53 | 5.3%(+6.94)#2,634 |
| 54. | Arivaca | 12.0% | 5.7%(+6.33)#54 | 5.3%(+6.71)#2,758 |
| 55. | Lake Montezuma | 12.0% | 5.7%(+6.29)#55 | 5.3%(+6.67)#2,788 |
| 56. | Thatcher | 11.9% | 5.7%(+6.27)#56 | 5.3%(+6.66)#2,800 |
| 57. | Seven Mile | 11.9% | 5.7%(+6.26)#57 | 5.3%(+6.64)#2,809 |
| 58. | Tees Toh | 11.9% | 5.7%(+6.22)#58 | 5.3%(+6.60)#2,833 |
| 59. | Dewey Humboldt | 11.8% | 5.7%(+6.14)#59 | 5.3%(+6.52)#2,875 |
| 60. | Village Of Oak Creek Big Park | 11.2% | 5.7%(+5.50)#60 | 5.3%(+5.88)#3,284 |
| 61. | Pirtleville | 11.1% | 5.7%(+5.42)#61 | 5.3%(+5.80)#3,341 |
| 62. | Lazy Y U | 11.0% | 5.7%(+5.32)#62 | 5.3%(+5.70)#3,400 |
| 63. | Cottonwood | 11.0% | 5.7%(+5.31)#63 | 5.3%(+5.69)#3,404 |
| 64. | Miracle Valley | 11.0% | 5.7%(+5.31)#64 | 5.3%(+5.69)#3,407 |
| 65. | Crystal Beach | 10.9% | 5.7%(+5.20)#65 | 5.3%(+5.58)#3,466 |
| 66. | Tombstone | 10.9% | 5.7%(+5.20)#66 | 5.3%(+5.58)#3,474 |
| 67. | Bluewater | 10.7% | 5.7%(+5.02)#67 | 5.3%(+5.41)#3,587 |
| 68. | San Jose | 10.6% | 5.7%(+4.97)#68 | 5.3%(+5.35)#3,626 |
| 69. | Teec Nos Pos | 10.6% | 5.7%(+4.96)#69 | 5.3%(+5.34)#3,637 |
| 70. | Avra Valley | 10.6% | 5.7%(+4.92)#70 | 5.3%(+5.30)#3,658 |
| 71. | Lechee | 10.5% | 5.7%(+4.85)#71 | 5.3%(+5.23)#3,715 |
| 72. | Pinal | 10.5% | 5.7%(+4.83)#72 | 5.3%(+5.21)#3,731 |
| 73. | East Fork | 10.2% | 5.7%(+4.51)#73 | 5.3%(+4.89)#3,958 |
| 74. | Circle | 10.0% | 5.7%(+4.37)#74 | 5.3%(+4.75)#4,071 |
| 75. | Summit | 10.0% | 5.7%(+4.30)#75 | 5.3%(+4.68)#4,139 |
| 76. | North Fork | 9.7% | 5.7%(+4.05)#76 | 5.3%(+4.43)#4,349 |
| 77. | Fort Defiance | 9.6% | 5.7%(+3.89)#77 | 5.3%(+4.27)#4,484 |
| 78. | Rough Rock | 9.4% | 5.7%(+3.75)#78 | 5.3%(+4.13)#4,616 |
| 79. | Bullhead City | 9.3% | 5.7%(+3.65)#79 | 5.3%(+4.03)#4,723 |
| 80. | Mesquite Creek | 9.3% | 5.7%(+3.63)#80 | 5.3%(+4.02)#4,740 |
| 81. | Parker | 9.3% | 5.7%(+3.59)#81 | 5.3%(+3.97)#4,791 |
| 82. | Peach Springs | 9.0% | 5.7%(+3.31)#82 | 5.3%(+3.69)#5,086 |
| 83. | Pinetop Lakeside | 9.0% | 5.7%(+3.29)#83 | 5.3%(+3.67)#5,114 |
| 84. | Kino Springs | 8.7% | 5.7%(+3.03)#84 | 5.3%(+3.41)#5,434 |
| 85. | Flowing Wells | 8.7% | 5.7%(+3.02)#85 | 5.3%(+3.40)#5,452 |
| 86. | Desert Hills | 8.6% | 5.7%(+2.94)#86 | 5.3%(+3.32)#5,542 |
| 87. | Globe | 8.6% | 5.7%(+2.93)#87 | 5.3%(+3.31)#5,546 |
| 88. | Second Mesa | 8.6% | 5.7%(+2.90)#88 | 5.3%(+3.28)#5,585 |
| 89. | El Mirage | 8.5% | 5.7%(+2.83)#89 | 5.3%(+3.21)#5,668 |
| 90. | Flagstaff | 8.4% | 5.7%(+2.76)#90 | 5.3%(+3.14)#5,750 |
| 91. | East Verde Estates | 8.3% | 5.7%(+2.67)#91 | 5.3%(+3.05)#5,888 |
| 92. | Springerville | 8.3% | 5.7%(+2.60)#92 | 5.3%(+2.98)#5,977 |
| 93. | Indian Wells | 8.2% | 5.7%(+2.57)#93 | 5.3%(+2.95)#6,013 |
| 94. | Cameron | 8.2% | 5.7%(+2.52)#94 | 5.3%(+2.90)#6,077 |
| 95. | Sunsites | 8.1% | 5.7%(+2.46)#95 | 5.3%(+2.84)#6,162 |
| 96. | Three Points | 8.0% | 5.7%(+2.35)#96 | 5.3%(+2.73)#6,313 |
| 97. | Cibecue | 8.0% | 5.7%(+2.30)#97 | 5.3%(+2.68)#6,393 |
| 98. | Tucson | 7.9% | 5.7%(+2.23)#98 | 5.3%(+2.61)#6,498 |
| 99. | Casas Adobes | 7.8% | 5.7%(+2.10)#99 | 5.3%(+2.48)#6,724 |
| 100. | Yuma | 7.7% | 5.7%(+2.06)#100 | 5.3%(+2.44)#6,774 |
Common Questions
What are the Top 10 Cities with the Highest Percentage of Population Employed in Food Preparation & Serving in Arizona?
Top 10 Cities with the Highest Percentage of Population Employed in Food Preparation & Serving in Arizona are:
#1
100.0%
#2
71.3%
#3
48.3%
#4
43.8%
#5
41.5%
#6
32.6%
#7
32.0%
#8
31.1%
#9
27.7%
#10
26.9%
What city has the Highest Percentage of Population Employed in Food Preparation & Serving in Arizona?
Pine Lake has the Highest Percentage of Population Employed in Food Preparation & Serving in Arizona with 100.0%.
What is the Percentage of Population Employed in Food Preparation & Serving in the State of Arizona?
Percentage of Population Employed in Food Preparation & Serving in Arizona is 5.7%.
What is the Percentage of Population Employed in Food Preparation & Serving in the United States?
Percentage of Population Employed in Food Preparation & Serving in the United States is 5.3%.