Cities with the Highest Percentage of Population Employed in Food Preparation & Serving in New Mexico
RELATED REPORTS & OPTIONS
Food Preparation & Serving
New Mexico
Compare Cities
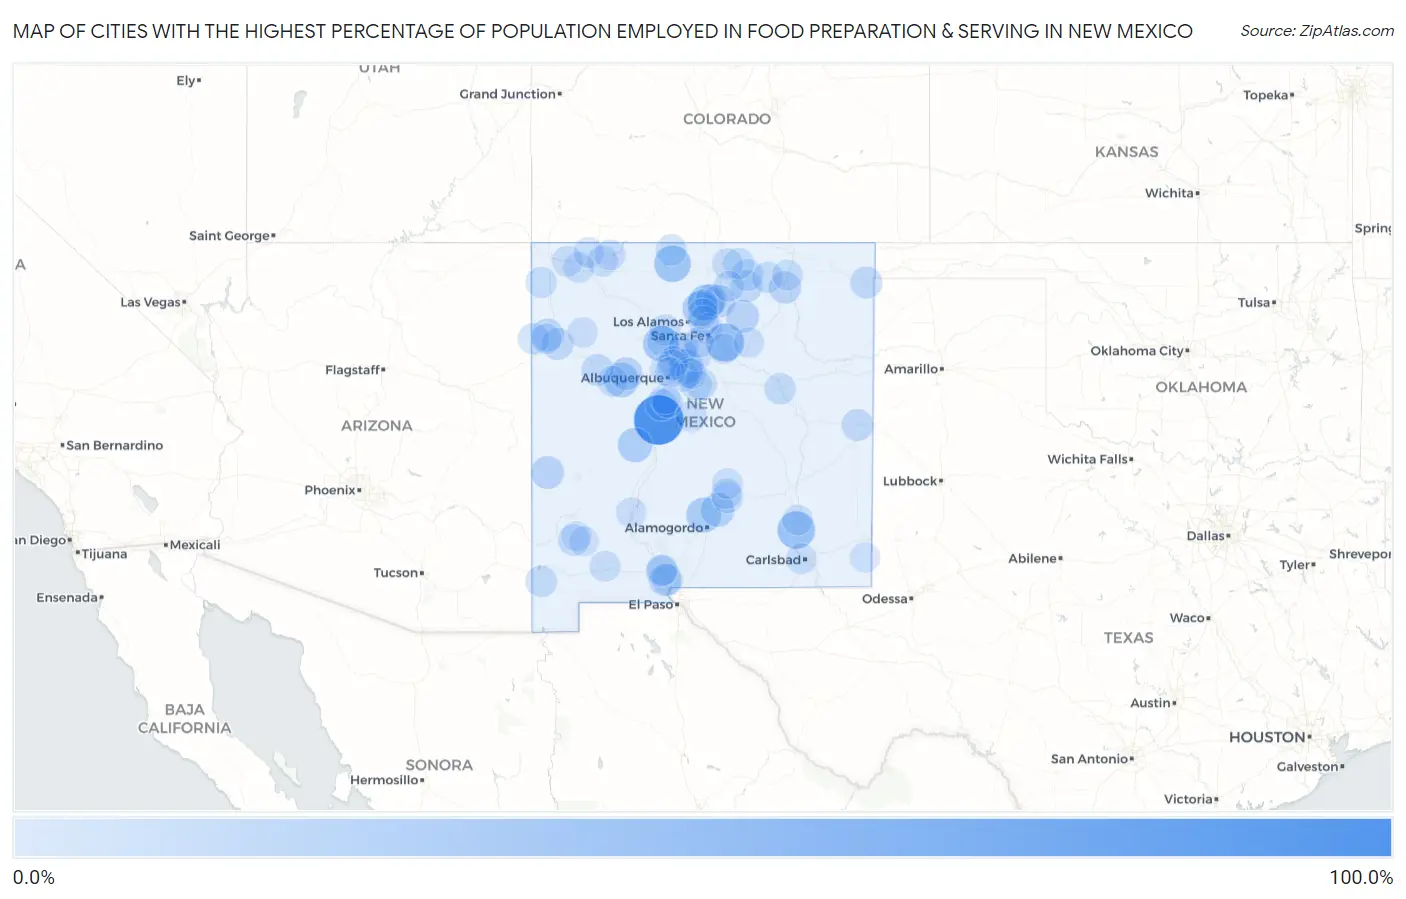
Map of Cities with the Highest Percentage of Population Employed in Food Preparation & Serving in New Mexico
0.0%
100.0%
Cities with the Highest Percentage of Population Employed in Food Preparation & Serving in New Mexico
| City | % Employed | vs State | vs National | |
| 1. | Abeytas | 100.0% | 5.8%(+94.2)#1 | 5.3%(+94.7)#5 |
| 2. | East Pecos | 44.5% | 5.8%(+38.8)#2 | 5.3%(+39.3)#140 |
| 3. | La Tierra | 44.1% | 5.8%(+38.4)#3 | 5.3%(+38.8)#148 |
| 4. | Morningside | 42.1% | 5.8%(+36.3)#4 | 5.3%(+36.8)#166 |
| 5. | Gamerco | 36.9% | 5.8%(+31.1)#5 | 5.3%(+31.6)#221 |
| 6. | Tierra Amarilla | 36.8% | 5.8%(+31.0)#6 | 5.3%(+31.5)#226 |
| 7. | San Ysidro | 35.2% | 5.8%(+29.4)#7 | 5.3%(+29.9)#249 |
| 8. | Canon | 34.3% | 5.8%(+28.5)#8 | 5.3%(+29.0)#266 |
| 9. | Velarde | 33.1% | 5.8%(+27.4)#9 | 5.3%(+27.9)#283 |
| 10. | Hyde Park | 30.5% | 5.8%(+24.7)#10 | 5.3%(+25.2)#335 |
| 11. | Tularosa | 30.0% | 5.8%(+24.3)#11 | 5.3%(+24.7)#343 |
| 12. | Pueblito | 29.6% | 5.8%(+23.9)#12 | 5.3%(+24.3)#358 |
| 13. | Paraje | 28.7% | 5.8%(+23.0)#13 | 5.3%(+23.4)#375 |
| 14. | Magdalena | 27.3% | 5.8%(+21.6)#14 | 5.3%(+22.1)#418 |
| 15. | La Madera | 25.6% | 5.8%(+19.8)#15 | 5.3%(+20.3)#482 |
| 16. | Mescalero | 23.5% | 5.8%(+17.7)#16 | 5.3%(+18.2)#583 |
| 17. | Canada De Los Alamos | 22.1% | 5.8%(+16.4)#17 | 5.3%(+16.9)#675 |
| 18. | Reserve | 20.4% | 5.8%(+14.6)#18 | 5.3%(+15.1)#797 |
| 19. | Chamisal | 19.7% | 5.8%(+14.0)#19 | 5.3%(+14.5)#868 |
| 20. | Mora | 19.7% | 5.8%(+13.9)#20 | 5.3%(+14.4)#878 |
| 21. | Paguate | 19.6% | 5.8%(+13.9)#21 | 5.3%(+14.3)#882 |
| 22. | Totah Vista | 19.2% | 5.8%(+13.4)#22 | 5.3%(+13.9)#929 |
| 23. | Butterfield Park | 18.8% | 5.8%(+13.0)#23 | 5.3%(+13.5)#969 |
| 24. | Twin Lakes | 18.7% | 5.8%(+12.9)#24 | 5.3%(+13.4)#984 |
| 25. | La Mesa | 17.6% | 5.8%(+11.8)#25 | 5.3%(+12.3)#1,118 |
| 26. | Springer | 17.4% | 5.8%(+11.6)#26 | 5.3%(+12.1)#1,162 |
| 27. | Dixon | 17.0% | 5.8%(+11.2)#27 | 5.3%(+11.7)#1,207 |
| 28. | Ojo Encino | 16.4% | 5.8%(+10.6)#28 | 5.3%(+11.1)#1,319 |
| 29. | Church Rock | 16.3% | 5.8%(+10.5)#29 | 5.3%(+11.0)#1,333 |
| 30. | Clayton | 16.2% | 5.8%(+10.4)#30 | 5.3%(+10.9)#1,362 |
| 31. | Milan | 16.2% | 5.8%(+10.4)#31 | 5.3%(+10.9)#1,371 |
| 32. | Angel Fire | 16.1% | 5.8%(+10.3)#32 | 5.3%(+10.8)#1,386 |
| 33. | San Felipe Pueblo | 15.9% | 5.8%(+10.1)#33 | 5.3%(+10.6)#1,434 |
| 34. | Cannon Afb | 15.8% | 5.8%(+10.1)#34 | 5.3%(+10.6)#1,439 |
| 35. | Tyrone | 14.4% | 5.8%(+8.64)#35 | 5.3%(+9.11)#1,795 |
| 36. | Tse Bonito | 14.3% | 5.8%(+8.53)#36 | 5.3%(+9.00)#1,822 |
| 37. | Eagle Nest | 14.1% | 5.8%(+8.33)#37 | 5.3%(+8.80)#1,890 |
| 38. | Valle Vista | 14.0% | 5.8%(+8.24)#38 | 5.3%(+8.71)#1,918 |
| 39. | Cotton City | 14.0% | 5.8%(+8.22)#39 | 5.3%(+8.69)#1,925 |
| 40. | Santa Rosa | 13.7% | 5.8%(+7.98)#40 | 5.3%(+8.45)#1,989 |
| 41. | Sausal | 13.7% | 5.8%(+7.93)#41 | 5.3%(+8.40)#2,009 |
| 42. | Moriarty | 13.1% | 5.8%(+7.32)#42 | 5.3%(+7.79)#2,225 |
| 43. | Jemez Springs | 12.9% | 5.8%(+7.19)#43 | 5.3%(+7.66)#2,280 |
| 44. | Ruidoso Downs | 12.9% | 5.8%(+7.10)#44 | 5.3%(+7.57)#2,319 |
| 45. | Iyanbito | 12.8% | 5.8%(+7.02)#45 | 5.3%(+7.49)#2,360 |
| 46. | Cimarron | 12.7% | 5.8%(+6.98)#46 | 5.3%(+7.45)#2,379 |
| 47. | Chama | 12.7% | 5.8%(+6.92)#47 | 5.3%(+7.39)#2,417 |
| 48. | Indian Hills | 12.6% | 5.8%(+6.83)#48 | 5.3%(+7.30)#2,449 |
| 49. | Vado | 12.4% | 5.8%(+6.68)#49 | 5.3%(+7.15)#2,546 |
| 50. | San Pablo | 12.3% | 5.8%(+6.57)#50 | 5.3%(+7.04)#2,590 |
| 51. | Red River | 12.3% | 5.8%(+6.55)#51 | 5.3%(+7.02)#2,598 |
| 52. | Los Luceros | 12.1% | 5.8%(+6.37)#52 | 5.3%(+6.84)#2,689 |
| 53. | University Park | 11.9% | 5.8%(+6.15)#53 | 5.3%(+6.62)#2,819 |
| 54. | Sanostee | 11.9% | 5.8%(+6.11)#54 | 5.3%(+6.58)#2,842 |
| 55. | Peak Place | 11.6% | 5.8%(+5.80)#55 | 5.3%(+6.27)#3,033 |
| 56. | Mountainair | 11.4% | 5.8%(+5.64)#56 | 5.3%(+6.11)#3,134 |
| 57. | Sandia Knolls | 11.4% | 5.8%(+5.63)#57 | 5.3%(+6.10)#3,137 |
| 58. | Conejo | 11.3% | 5.8%(+5.50)#58 | 5.3%(+5.97)#3,225 |
| 59. | Blanco | 11.2% | 5.8%(+5.45)#59 | 5.3%(+5.92)#3,254 |
| 60. | Cedar Crest | 11.1% | 5.8%(+5.38)#60 | 5.3%(+5.85)#3,296 |
| 61. | Questa | 11.1% | 5.8%(+5.34)#61 | 5.3%(+5.81)#3,334 |
| 62. | Maxwell | 10.9% | 5.8%(+5.17)#62 | 5.3%(+5.64)#3,429 |
| 63. | Napi Headquarters | 10.9% | 5.8%(+5.15)#63 | 5.3%(+5.62)#3,437 |
| 64. | Skyline Ganipa | 10.9% | 5.8%(+5.13)#64 | 5.3%(+5.60)#3,449 |
| 65. | Keeler Farm | 10.9% | 5.8%(+5.10)#65 | 5.3%(+5.57)#3,477 |
| 66. | Happy Valley | 10.8% | 5.8%(+5.07)#66 | 5.3%(+5.54)#3,496 |
| 67. | Jemez Pueblo | 10.7% | 5.8%(+4.96)#67 | 5.3%(+5.43)#3,569 |
| 68. | Nenahnezad | 10.6% | 5.8%(+4.87)#68 | 5.3%(+5.34)#3,641 |
| 69. | Taos | 10.6% | 5.8%(+4.82)#69 | 5.3%(+5.29)#3,666 |
| 70. | Madrid | 10.5% | 5.8%(+4.77)#70 | 5.3%(+5.24)#3,696 |
| 71. | Bernalillo | 10.3% | 5.8%(+4.51)#71 | 5.3%(+4.98)#3,882 |
| 72. | Sundance | 10.2% | 5.8%(+4.43)#72 | 5.3%(+4.90)#3,954 |
| 73. | Navajo Dam | 10.1% | 5.8%(+4.37)#73 | 5.3%(+4.84)#3,999 |
| 74. | Ruidoso | 10.1% | 5.8%(+4.36)#74 | 5.3%(+4.83)#4,004 |
| 75. | Pueblo Of Sandia Village | 10.1% | 5.8%(+4.30)#75 | 5.3%(+4.77)#4,057 |
| 76. | Pojoaque | 10.0% | 5.8%(+4.29)#76 | 5.3%(+4.76)#4,060 |
| 77. | North Light Plant | 9.9% | 5.8%(+4.18)#77 | 5.3%(+4.65)#4,166 |
| 78. | Rowe | 9.9% | 5.8%(+4.10)#78 | 5.3%(+4.57)#4,218 |
| 79. | Capitan | 9.8% | 5.8%(+4.08)#79 | 5.3%(+4.55)#4,237 |
| 80. | Lake Arthur | 9.8% | 5.8%(+4.06)#80 | 5.3%(+4.53)#4,249 |
| 81. | Yah Ta Hey | 9.7% | 5.8%(+3.99)#81 | 5.3%(+4.46)#4,323 |
| 82. | Santo Domingo Pueblo | 9.6% | 5.8%(+3.89)#82 | 5.3%(+4.36)#4,394 |
| 83. | Espanola | 9.5% | 5.8%(+3.72)#83 | 5.3%(+4.19)#4,559 |
| 84. | Paradise Hills | 9.3% | 5.8%(+3.56)#84 | 5.3%(+4.03)#4,732 |
| 85. | Tortugas | 9.3% | 5.8%(+3.50)#85 | 5.3%(+3.97)#4,786 |
| 86. | Williamsburg | 9.2% | 5.8%(+3.49)#86 | 5.3%(+3.96)#4,798 |
| 87. | El Cerro | 9.2% | 5.8%(+3.44)#87 | 5.3%(+3.91)#4,841 |
| 88. | Las Vegas | 9.1% | 5.8%(+3.39)#88 | 5.3%(+3.86)#4,896 |
| 89. | North Valley | 9.1% | 5.8%(+3.37)#89 | 5.3%(+3.84)#4,906 |
| 90. | La Cienega | 9.1% | 5.8%(+3.33)#90 | 5.3%(+3.80)#4,977 |
| 91. | Edgewood | 9.0% | 5.8%(+3.23)#91 | 5.3%(+3.70)#5,083 |
| 92. | Crownpoint | 9.0% | 5.8%(+3.20)#92 | 5.3%(+3.67)#5,132 |
| 93. | Santa Cruz | 8.8% | 5.8%(+3.04)#93 | 5.3%(+3.51)#5,325 |
| 94. | Las Maravillas | 8.7% | 5.8%(+2.96)#94 | 5.3%(+3.43)#5,406 |
| 95. | Eunice | 8.5% | 5.8%(+2.71)#95 | 5.3%(+3.18)#5,695 |
| 96. | San Antonito Cdp Bernalillo County | 8.4% | 5.8%(+2.69)#96 | 5.3%(+3.16)#5,732 |
| 97. | Kirtland Afb | 8.4% | 5.8%(+2.65)#97 | 5.3%(+3.12)#5,775 |
| 98. | Silver City | 8.3% | 5.8%(+2.51)#98 | 5.3%(+2.98)#5,976 |
| 99. | Pinedale | 8.0% | 5.8%(+2.22)#99 | 5.3%(+2.69)#6,374 |
| 100. | Hurley | 7.9% | 5.8%(+2.12)#100 | 5.3%(+2.59)#6,526 |
Common Questions
What are the Top 10 Cities with the Highest Percentage of Population Employed in Food Preparation & Serving in New Mexico?
Top 10 Cities with the Highest Percentage of Population Employed in Food Preparation & Serving in New Mexico are:
#1
100.0%
#2
44.5%
#3
42.1%
#4
36.8%
#5
35.2%
#6
33.1%
#7
30.0%
#8
29.6%
#9
28.7%
#10
27.3%
What city has the Highest Percentage of Population Employed in Food Preparation & Serving in New Mexico?
Abeytas has the Highest Percentage of Population Employed in Food Preparation & Serving in New Mexico with 100.0%.
What is the Percentage of Population Employed in Food Preparation & Serving in the State of New Mexico?
Percentage of Population Employed in Food Preparation & Serving in New Mexico is 5.8%.
What is the Percentage of Population Employed in Food Preparation & Serving in the United States?
Percentage of Population Employed in Food Preparation & Serving in the United States is 5.3%.