Zip Codes with the Highest Percentage of Population Employed in Food Preparation & Serving in San Luis Obispo, CA
RELATED REPORTS & OPTIONS
Food Preparation & Serving
San Luis Obispo
Compare Zip Codes
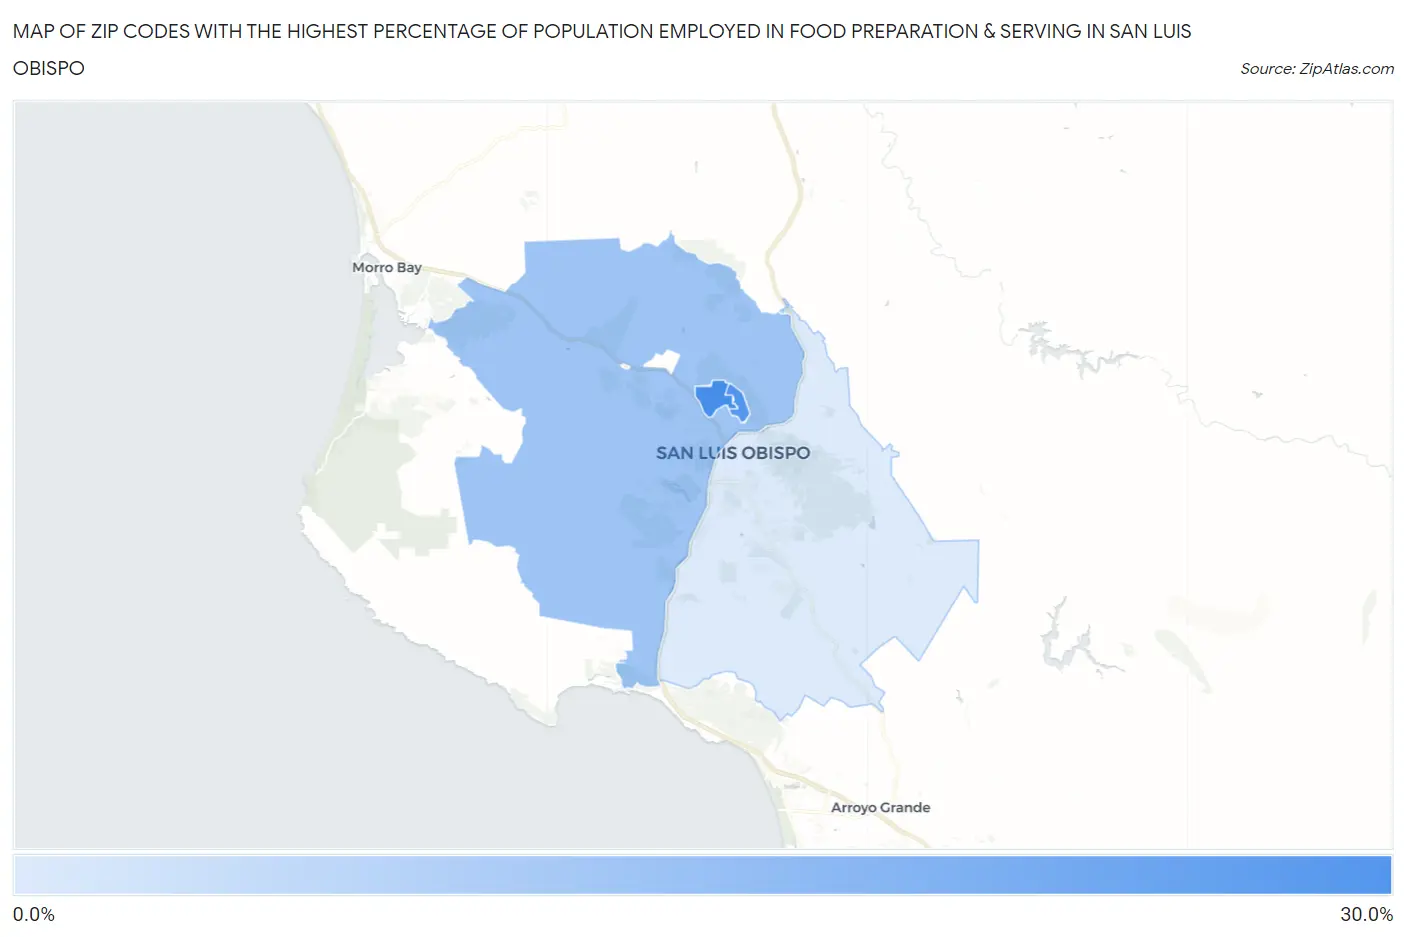
Map of Zip Codes with the Highest Percentage of Population Employed in Food Preparation & Serving in San Luis Obispo
7.2%
29.3%
Zip Codes with the Highest Percentage of Population Employed in Food Preparation & Serving in San Luis Obispo, CA
| Zip Code | % Employed | vs State | vs National | |
| 1. | 93407 | 29.3% | 5.4%(+23.9)#19 | 5.3%(+24.0)#227 |
| 2. | 93410 | 27.1% | 5.4%(+21.7)#20 | 5.3%(+21.8)#261 |
| 3. | 93405 | 15.8% | 5.4%(+10.4)#48 | 5.3%(+10.5)#885 |
| 4. | 93401 | 7.2% | 5.4%(+1.81)#315 | 5.3%(+1.90)#6,156 |
1
Common Questions
What are the Top 3 Zip Codes with the Highest Percentage of Population Employed in Food Preparation & Serving in San Luis Obispo, CA?
Top 3 Zip Codes with the Highest Percentage of Population Employed in Food Preparation & Serving in San Luis Obispo, CA are:
What zip code has the Highest Percentage of Population Employed in Food Preparation & Serving in San Luis Obispo, CA?
93407 has the Highest Percentage of Population Employed in Food Preparation & Serving in San Luis Obispo, CA with 29.3%.
What is the Percentage of Population Employed in Food Preparation & Serving in San Luis Obispo, CA?
Percentage of Population Employed in Food Preparation & Serving in San Luis Obispo is 11.4%.
What is the Percentage of Population Employed in Food Preparation & Serving in California?
Percentage of Population Employed in Food Preparation & Serving in California is 5.4%.
What is the Percentage of Population Employed in Food Preparation & Serving in the United States?
Percentage of Population Employed in Food Preparation & Serving in the United States is 5.3%.