Cities with the Highest Percentage of Population Employed in Food Preparation & Serving in North Dakota
RELATED REPORTS & OPTIONS
Food Preparation & Serving
North Dakota
Compare Cities
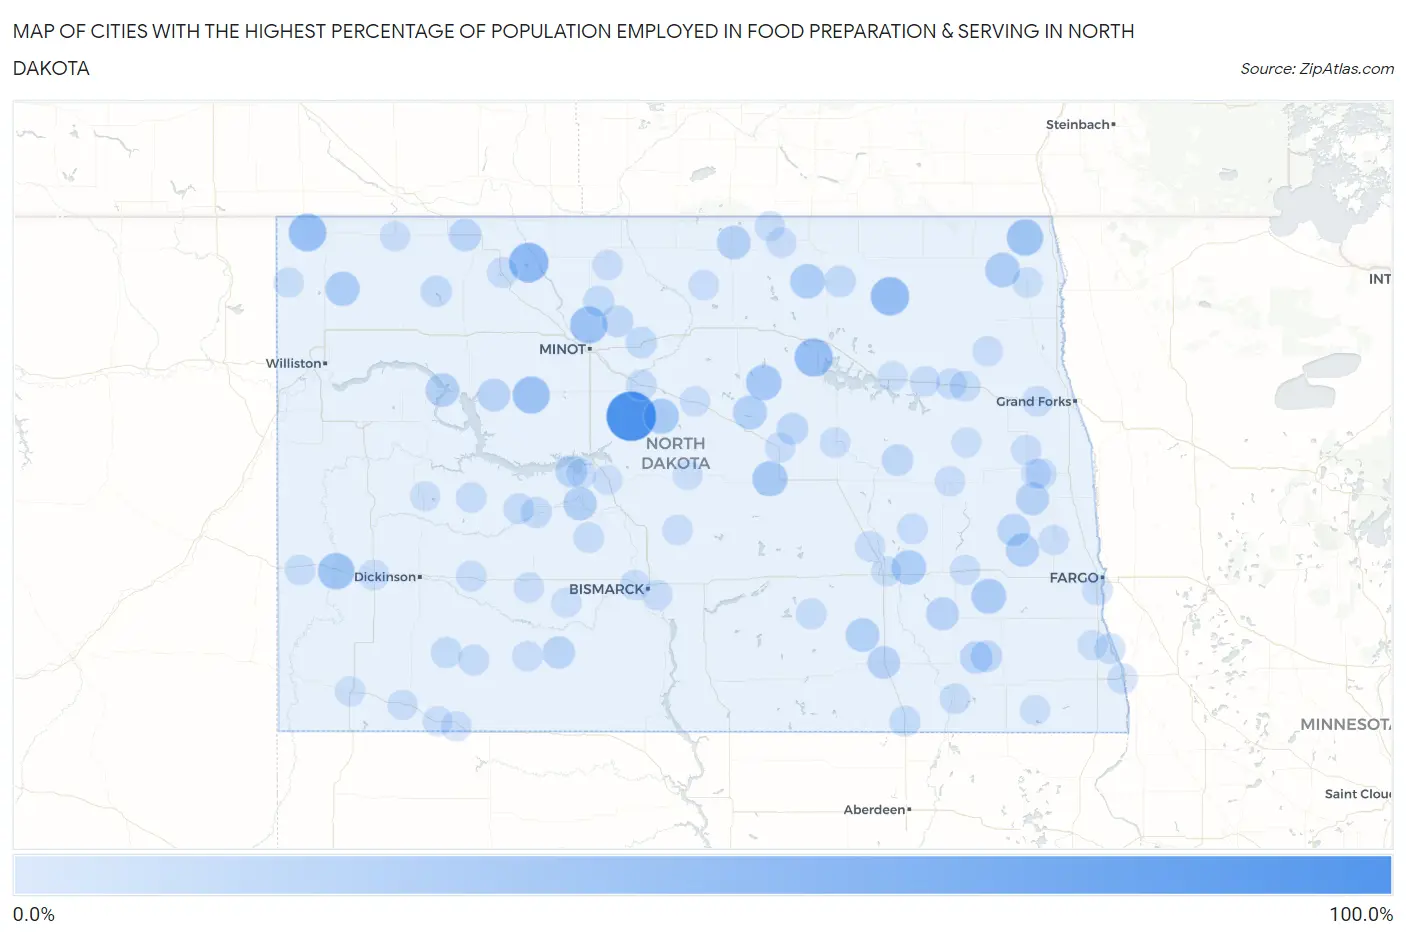
Map of Cities with the Highest Percentage of Population Employed in Food Preparation & Serving in North Dakota
0.0%
100.0%
Cities with the Highest Percentage of Population Employed in Food Preparation & Serving in North Dakota
| City | % Employed | vs State | vs National | |
| 1. | Ruso | 100.0% | 5.2%(+94.8)#1 | 5.3%(+94.7)#33 |
| 2. | Tolley | 50.0% | 5.2%(+44.8)#2 | 5.3%(+44.7)#117 |
| 3. | Hampden | 45.5% | 5.2%(+40.2)#3 | 5.3%(+40.2)#136 |
| 4. | Brinsmade | 44.4% | 5.2%(+39.2)#4 | 5.3%(+39.2)#144 |
| 5. | Fortuna | 41.7% | 5.2%(+36.4)#5 | 5.3%(+36.4)#170 |
| 6. | Makoti | 39.4% | 5.2%(+34.2)#6 | 5.3%(+34.1)#193 |
| 7. | Ruthville | 39.1% | 5.2%(+33.9)#7 | 5.3%(+33.8)#194 |
| 8. | Medora | 36.0% | 5.2%(+30.8)#8 | 5.3%(+30.7)#236 |
| 9. | Bathgate | 36.0% | 5.2%(+30.8)#9 | 5.3%(+30.7)#237 |
| 10. | Esmond | 31.0% | 5.2%(+25.7)#10 | 5.3%(+25.7)#323 |
| 11. | Bowdon | 30.2% | 5.2%(+25.0)#11 | 5.3%(+24.9)#341 |
| 12. | Butte | 30.0% | 5.2%(+24.8)#12 | 5.3%(+24.7)#347 |
| 13. | Fingal | 29.1% | 5.2%(+23.9)#13 | 5.3%(+23.8)#367 |
| 14. | Canton City Hensel | 27.3% | 5.2%(+22.0)#14 | 5.3%(+22.0)#421 |
| 15. | Spiritwood | 27.3% | 5.2%(+22.0)#15 | 5.3%(+22.0)#422 |
| 16. | Bisbee | 26.9% | 5.2%(+21.7)#16 | 5.3%(+21.6)#434 |
| 17. | Alamo | 26.5% | 5.2%(+21.2)#17 | 5.3%(+21.2)#448 |
| 18. | Selz | 24.2% | 5.2%(+19.0)#18 | 5.3%(+18.9)#544 |
| 19. | Jud | 23.8% | 5.2%(+18.6)#19 | 5.3%(+18.5)#560 |
| 20. | East Dunseith | 22.6% | 5.2%(+17.4)#20 | 5.3%(+17.4)#638 |
| 21. | Four Bears Village | 22.5% | 5.2%(+17.3)#21 | 5.3%(+17.2)#641 |
| 22. | Stanton | 21.8% | 5.2%(+16.6)#22 | 5.3%(+16.5)#687 |
| 23. | Ayr | 21.4% | 5.2%(+16.2)#23 | 5.3%(+16.1)#715 |
| 24. | Clifford | 20.0% | 5.2%(+14.8)#24 | 5.3%(+14.7)#847 |
| 25. | Parshall | 19.1% | 5.2%(+13.9)#25 | 5.3%(+13.8)#934 |
| 26. | Edgeley | 19.0% | 5.2%(+13.7)#26 | 5.3%(+13.7)#952 |
| 27. | Litchville | 18.9% | 5.2%(+13.6)#27 | 5.3%(+13.6)#962 |
| 28. | Page | 18.1% | 5.2%(+12.9)#28 | 5.3%(+12.8)#1,052 |
| 29. | Flaxton | 17.6% | 5.2%(+12.4)#29 | 5.3%(+12.4)#1,113 |
| 30. | Englevale | 17.5% | 5.2%(+12.3)#30 | 5.3%(+12.2)#1,136 |
| 31. | Carson | 17.5% | 5.2%(+12.3)#31 | 5.3%(+12.2)#1,139 |
| 32. | Pick City | 16.3% | 5.2%(+11.0)#32 | 5.3%(+11.0)#1,337 |
| 33. | Deering | 14.3% | 5.2%(+9.06)#33 | 5.3%(+9.00)#1,826 |
| 34. | Mchenry | 14.3% | 5.2%(+9.06)#34 | 5.3%(+9.00)#1,830 |
| 35. | Hamberg | 14.3% | 5.2%(+9.06)#35 | 5.3%(+9.00)#1,839 |
| 36. | Elliott | 13.6% | 5.2%(+8.41)#36 | 5.3%(+8.35)#2,028 |
| 37. | Egeland | 13.5% | 5.2%(+8.28)#37 | 5.3%(+8.23)#2,064 |
| 38. | Granville | 13.2% | 5.2%(+7.96)#38 | 5.3%(+7.91)#2,182 |
| 39. | Powers Lake | 12.2% | 5.2%(+6.94)#39 | 5.3%(+6.89)#2,663 |
| 40. | Glenburn | 11.7% | 5.2%(+6.42)#40 | 5.3%(+6.36)#2,969 |
| 41. | Trenton | 11.4% | 5.2%(+6.18)#41 | 5.3%(+6.12)#3,118 |
| 42. | Beulah | 11.3% | 5.2%(+6.12)#42 | 5.3%(+6.06)#3,167 |
| 43. | Ellendale | 11.3% | 5.2%(+6.05)#43 | 5.3%(+5.99)#3,210 |
| 44. | Regent | 11.0% | 5.2%(+5.76)#44 | 5.3%(+5.70)#3,399 |
| 45. | Mott | 10.4% | 5.2%(+5.20)#45 | 5.3%(+5.15)#3,776 |
| 46. | Kenmare | 10.4% | 5.2%(+5.17)#46 | 5.3%(+5.11)#3,795 |
| 47. | Michigan City | 10.3% | 5.2%(+5.10)#47 | 5.3%(+5.04)#3,850 |
| 48. | Center | 10.2% | 5.2%(+5.01)#48 | 5.3%(+4.95)#3,906 |
| 49. | Petersburg | 10.2% | 5.2%(+4.97)#49 | 5.3%(+4.92)#3,937 |
| 50. | Wimbledon | 10.0% | 5.2%(+4.77)#50 | 5.3%(+4.71)#4,111 |
| 51. | Voltaire | 10.0% | 5.2%(+4.77)#51 | 5.3%(+4.71)#4,125 |
| 52. | Zap | 9.8% | 5.2%(+4.61)#52 | 5.3%(+4.55)#4,233 |
| 53. | Streeter | 9.8% | 5.2%(+4.53)#53 | 5.3%(+4.47)#4,308 |
| 54. | Abercrombie | 9.4% | 5.2%(+4.17)#54 | 5.3%(+4.12)#4,638 |
| 55. | Oakes | 9.2% | 5.2%(+4.02)#55 | 5.3%(+3.96)#4,795 |
| 56. | Richardton | 9.2% | 5.2%(+4.01)#56 | 5.3%(+3.96)#4,802 |
| 57. | Mayville | 9.2% | 5.2%(+3.94)#57 | 5.3%(+3.88)#4,869 |
| 58. | Sentinel Butte | 9.1% | 5.2%(+3.86)#58 | 5.3%(+3.80)#4,974 |
| 59. | Halliday | 9.0% | 5.2%(+3.76)#59 | 5.3%(+3.70)#5,071 |
| 60. | Regan | 8.9% | 5.2%(+3.66)#60 | 5.3%(+3.60)#5,213 |
| 61. | Belfield | 8.9% | 5.2%(+3.65)#61 | 5.3%(+3.60)#5,224 |
| 62. | Elgin | 8.9% | 5.2%(+3.64)#62 | 5.3%(+3.59)#5,230 |
| 63. | St Thomas | 8.8% | 5.2%(+3.61)#63 | 5.3%(+3.56)#5,262 |
| 64. | Frontier | 8.8% | 5.2%(+3.59)#64 | 5.3%(+3.54)#5,289 |
| 65. | Emerado | 8.7% | 5.2%(+3.42)#65 | 5.3%(+3.37)#5,487 |
| 66. | Lakota | 8.5% | 5.2%(+3.28)#66 | 5.3%(+3.22)#5,643 |
| 67. | Fessenden | 8.5% | 5.2%(+3.26)#67 | 5.3%(+3.20)#5,674 |
| 68. | New Rockford | 8.5% | 5.2%(+3.24)#68 | 5.3%(+3.18)#5,701 |
| 69. | Fordville | 8.5% | 5.2%(+3.23)#69 | 5.3%(+3.18)#5,712 |
| 70. | Glen Ullin | 8.4% | 5.2%(+3.17)#70 | 5.3%(+3.11)#5,792 |
| 71. | Drake | 8.3% | 5.2%(+3.10)#71 | 5.3%(+3.05)#5,874 |
| 72. | Buchanan | 8.3% | 5.2%(+3.10)#72 | 5.3%(+3.05)#5,898 |
| 73. | Rolla | 8.3% | 5.2%(+3.05)#73 | 5.3%(+2.99)#5,963 |
| 74. | Cooperstown | 8.3% | 5.2%(+3.03)#74 | 5.3%(+2.98)#5,982 |
| 75. | Wahpeton | 8.2% | 5.2%(+3.01)#75 | 5.3%(+2.96)#6,005 |
| 76. | Hatton | 8.2% | 5.2%(+2.95)#76 | 5.3%(+2.90)#6,087 |
| 77. | Willow City | 8.2% | 5.2%(+2.93)#77 | 5.3%(+2.88)#6,122 |
| 78. | Noonan | 8.1% | 5.2%(+2.83)#78 | 5.3%(+2.78)#6,252 |
| 79. | Mandan | 8.1% | 5.2%(+2.83)#79 | 5.3%(+2.78)#6,256 |
| 80. | Haynes | 8.0% | 5.2%(+2.77)#80 | 5.3%(+2.71)#6,346 |
| 81. | Arthur | 7.7% | 5.2%(+2.51)#81 | 5.3%(+2.46)#6,759 |
| 82. | Grenora | 7.7% | 5.2%(+2.51)#82 | 5.3%(+2.46)#6,760 |
| 83. | Reeder | 7.7% | 5.2%(+2.46)#83 | 5.3%(+2.41)#6,852 |
| 84. | Valley City | 7.6% | 5.2%(+2.41)#84 | 5.3%(+2.36)#6,925 |
| 85. | Jamestown | 7.6% | 5.2%(+2.40)#85 | 5.3%(+2.35)#6,944 |
| 86. | Lincoln | 7.6% | 5.2%(+2.40)#86 | 5.3%(+2.34)#6,949 |
| 87. | St John | 7.6% | 5.2%(+2.39)#87 | 5.3%(+2.33)#6,965 |
| 88. | Maxbass | 7.5% | 5.2%(+2.32)#88 | 5.3%(+2.26)#7,068 |
| 89. | Aneta | 7.4% | 5.2%(+2.12)#89 | 5.3%(+2.07)#7,368 |
| 90. | Riverdale | 7.3% | 5.2%(+2.06)#90 | 5.3%(+2.01)#7,457 |
| 91. | Crary | 7.3% | 5.2%(+2.04)#91 | 5.3%(+1.99)#7,487 |
| 92. | Almont | 7.2% | 5.2%(+2.02)#92 | 5.3%(+1.96)#7,531 |
| 93. | Cayuga | 7.1% | 5.2%(+1.91)#93 | 5.3%(+1.86)#7,749 |
| 94. | Bowman | 7.1% | 5.2%(+1.90)#94 | 5.3%(+1.84)#7,773 |
| 95. | Underwood | 7.1% | 5.2%(+1.89)#95 | 5.3%(+1.84)#7,774 |
| 96. | Colfax | 7.0% | 5.2%(+1.77)#96 | 5.3%(+1.71)#8,006 |
| 97. | Portland | 6.9% | 5.2%(+1.68)#97 | 5.3%(+1.62)#8,161 |
| 98. | Killdeer | 6.9% | 5.2%(+1.64)#98 | 5.3%(+1.58)#8,246 |
| 99. | Hettinger | 6.8% | 5.2%(+1.58)#99 | 5.3%(+1.52)#8,393 |
| 100. | Mcclusky | 6.6% | 5.2%(+1.40)#100 | 5.3%(+1.34)#8,789 |
Common Questions
What are the Top 10 Cities with the Highest Percentage of Population Employed in Food Preparation & Serving in North Dakota?
Top 10 Cities with the Highest Percentage of Population Employed in Food Preparation & Serving in North Dakota are:
What city has the Highest Percentage of Population Employed in Food Preparation & Serving in North Dakota?
Ruso has the Highest Percentage of Population Employed in Food Preparation & Serving in North Dakota with 100.0%.
What is the Percentage of Population Employed in Food Preparation & Serving in the State of North Dakota?
Percentage of Population Employed in Food Preparation & Serving in North Dakota is 5.2%.
What is the Percentage of Population Employed in Food Preparation & Serving in the United States?
Percentage of Population Employed in Food Preparation & Serving in the United States is 5.3%.