Zip Codes with the Highest Percentage of Population Employed in Food Preparation & Serving in Malibu, CA
RELATED REPORTS & OPTIONS
Food Preparation & Serving
Malibu
Compare Zip Codes
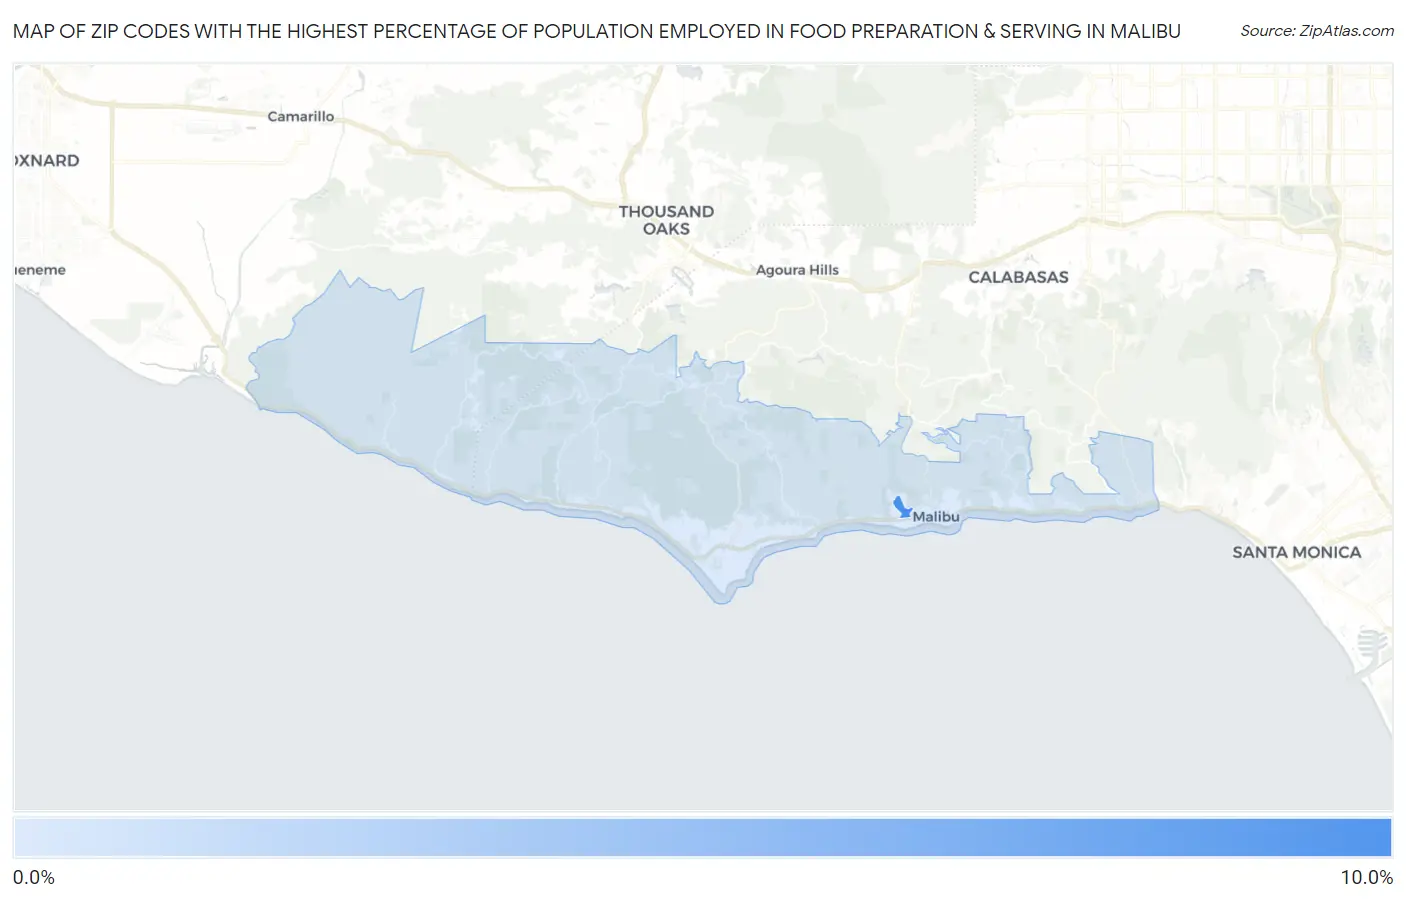
Map of Zip Codes with the Highest Percentage of Population Employed in Food Preparation & Serving in Malibu
1.7%
9.4%
Zip Codes with the Highest Percentage of Population Employed in Food Preparation & Serving in Malibu, CA
| Zip Code | % Employed | vs State | vs National | |
| 1. | 90263 | 9.4% | 5.4%(+4.02)#167 | 5.3%(+4.12)#3,134 |
| 2. | 90265 | 1.7% | 5.4%(-3.66)#1,419 | 5.3%(-3.57)#25,480 |
1
Common Questions
What are the Top Zip Codes with the Highest Percentage of Population Employed in Food Preparation & Serving in Malibu, CA?
Top Zip Codes with the Highest Percentage of Population Employed in Food Preparation & Serving in Malibu, CA are:
What zip code has the Highest Percentage of Population Employed in Food Preparation & Serving in Malibu, CA?
90263 has the Highest Percentage of Population Employed in Food Preparation & Serving in Malibu, CA with 9.4%.
What is the Percentage of Population Employed in Food Preparation & Serving in Malibu, CA?
Percentage of Population Employed in Food Preparation & Serving in Malibu is 1.5%.
What is the Percentage of Population Employed in Food Preparation & Serving in California?
Percentage of Population Employed in Food Preparation & Serving in California is 5.4%.
What is the Percentage of Population Employed in Food Preparation & Serving in the United States?
Percentage of Population Employed in Food Preparation & Serving in the United States is 5.3%.