Zip Codes with the Highest Percentage of Population Employed in Food Preparation & Serving in Alameda, CA
RELATED REPORTS & OPTIONS
Food Preparation & Serving
Alameda
Compare Zip Codes
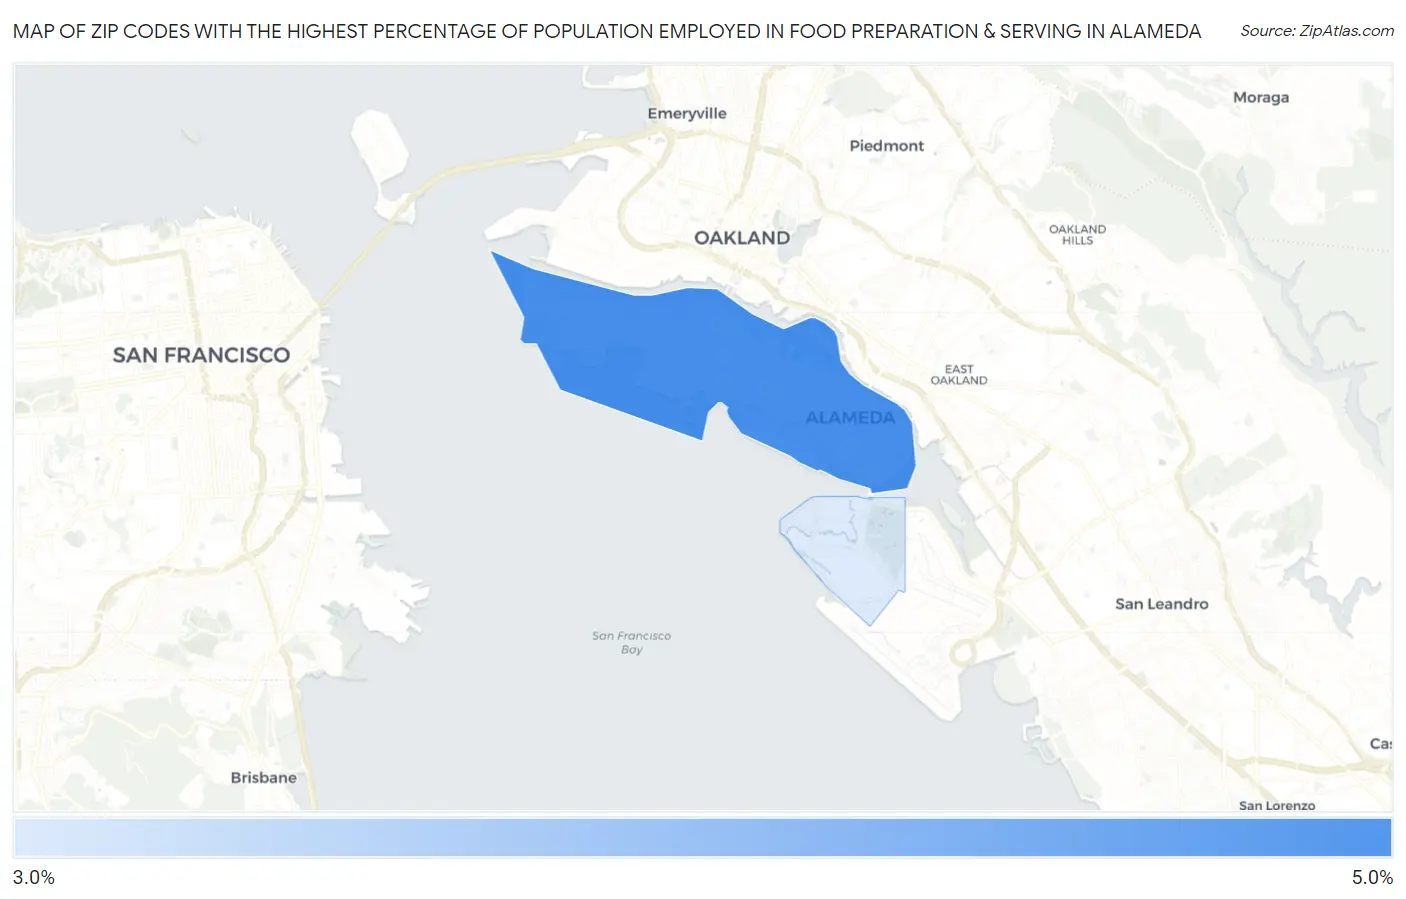
Map of Zip Codes with the Highest Percentage of Population Employed in Food Preparation & Serving in Alameda
3.2%
4.3%
Zip Codes with the Highest Percentage of Population Employed in Food Preparation & Serving in Alameda, CA
| Zip Code | % Employed | vs State | vs National | |
| 1. | 94501 | 4.3% | 5.4%(-1.06)#958 | 5.3%(-0.959)#15,753 |
| 2. | 94502 | 3.2% | 5.4%(-2.16)#1,175 | 5.3%(-2.06)#20,390 |
1
Common Questions
What are the Top Zip Codes with the Highest Percentage of Population Employed in Food Preparation & Serving in Alameda, CA?
Top Zip Codes with the Highest Percentage of Population Employed in Food Preparation & Serving in Alameda, CA are:
What zip code has the Highest Percentage of Population Employed in Food Preparation & Serving in Alameda, CA?
94501 has the Highest Percentage of Population Employed in Food Preparation & Serving in Alameda, CA with 4.3%.
What is the Percentage of Population Employed in Food Preparation & Serving in Alameda, CA?
Percentage of Population Employed in Food Preparation & Serving in Alameda is 4.1%.
What is the Percentage of Population Employed in Food Preparation & Serving in California?
Percentage of Population Employed in Food Preparation & Serving in California is 5.4%.
What is the Percentage of Population Employed in Food Preparation & Serving in the United States?
Percentage of Population Employed in Food Preparation & Serving in the United States is 5.3%.