Cities with the Highest Percentage of Population Employed in Food Preparation & Serving in Missouri
RELATED REPORTS & OPTIONS
Food Preparation & Serving
Missouri
Compare Cities
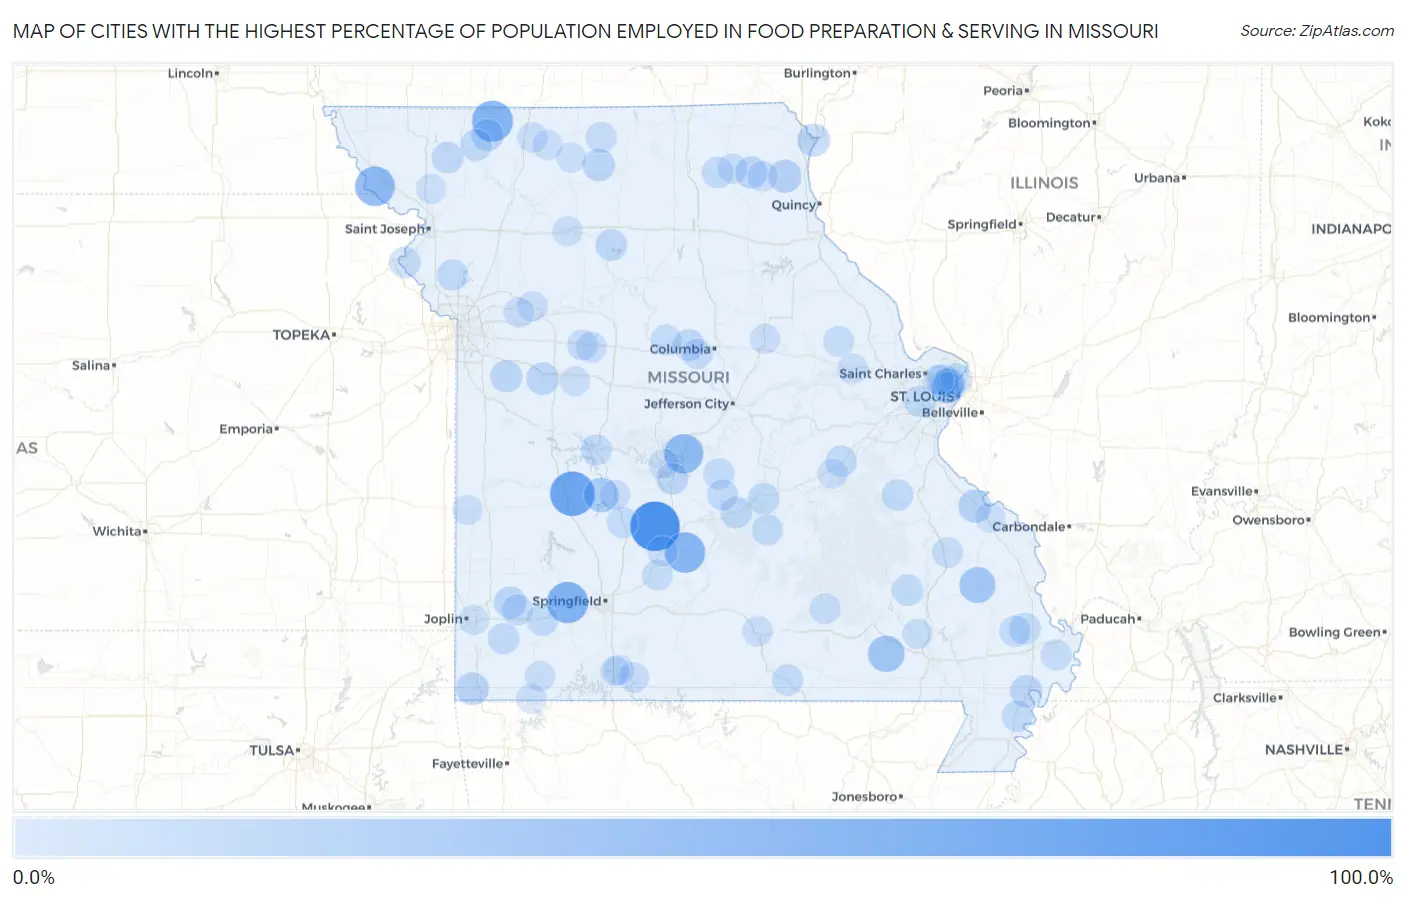
Map of Cities with the Highest Percentage of Population Employed in Food Preparation & Serving in Missouri
0.0%
100.0%
Cities with the Highest Percentage of Population Employed in Food Preparation & Serving in Missouri
| City | % Employed | vs State | vs National | |
| 1. | Bennett Springs | 100.0% | 5.2%(+94.8)#1 | 5.3%(+94.7)#9 |
| 2. | Knob Lick | 100.0% | 5.2%(+94.8)#2 | 5.3%(+94.7)#27 |
| 3. | Gerster | 77.8% | 5.2%(+72.5)#3 | 5.3%(+72.5)#45 |
| 4. | Halltown | 62.5% | 5.2%(+57.3)#4 | 5.3%(+57.2)#65 |
| 5. | Allendale | 61.5% | 5.2%(+56.3)#5 | 5.3%(+56.3)#69 |
| 6. | Evergreen | 59.3% | 5.2%(+54.0)#6 | 5.3%(+54.0)#77 |
| 7. | Middle Grove | 55.6% | 5.2%(+50.3)#7 | 5.3%(+50.3)#85 |
| 8. | Fortescue | 55.6% | 5.2%(+50.3)#8 | 5.3%(+50.3)#86 |
| 9. | Bagnell | 53.1% | 5.2%(+47.9)#9 | 5.3%(+47.8)#96 |
| 10. | Blue Summit | 43.6% | 5.2%(+38.3)#10 | 5.3%(+38.3)#155 |
| 11. | Grandin | 41.3% | 5.2%(+36.1)#11 | 5.3%(+36.0)#175 |
| 12. | Glen Allen | 39.1% | 5.2%(+33.9)#12 | 5.3%(+33.8)#195 |
| 13. | Faucett | 38.5% | 5.2%(+33.3)#13 | 5.3%(+33.3)#202 |
| 14. | Hermitage | 34.2% | 5.2%(+29.0)#14 | 5.3%(+28.9)#267 |
| 15. | Beverly Hills | 31.8% | 5.2%(+26.6)#15 | 5.3%(+26.5)#300 |
| 16. | Ozora | 26.9% | 5.2%(+21.7)#16 | 5.3%(+21.6)#431 |
| 17. | Monticello | 26.8% | 5.2%(+21.5)#17 | 5.3%(+21.5)#442 |
| 18. | Burfordville | 25.0% | 5.2%(+19.8)#18 | 5.3%(+19.7)#506 |
| 19. | Ginger Blue | 25.0% | 5.2%(+19.8)#19 | 5.3%(+19.7)#507 |
| 20. | Alexandria | 25.0% | 5.2%(+19.8)#20 | 5.3%(+19.7)#510 |
| 21. | Centerview | 24.6% | 5.2%(+19.3)#21 | 5.3%(+19.3)#522 |
| 22. | Latham | 23.7% | 5.2%(+18.4)#22 | 5.3%(+18.4)#569 |
| 23. | Osgood | 23.5% | 5.2%(+18.3)#23 | 5.3%(+18.2)#580 |
| 24. | Howardville | 23.2% | 5.2%(+18.0)#24 | 5.3%(+17.9)#603 |
| 25. | Avilla | 23.1% | 5.2%(+17.8)#25 | 5.3%(+17.8)#612 |
| 26. | Knox City | 22.4% | 5.2%(+17.2)#26 | 5.3%(+17.1)#645 |
| 27. | Strasburg | 22.2% | 5.2%(+17.0)#27 | 5.3%(+16.9)#663 |
| 28. | Denver | 22.2% | 5.2%(+17.0)#28 | 5.3%(+16.9)#671 |
| 29. | Rocheport | 20.8% | 5.2%(+15.6)#29 | 5.3%(+15.5)#752 |
| 30. | St Robert | 20.7% | 5.2%(+15.5)#30 | 5.3%(+15.5)#760 |
| 31. | Conception | 20.7% | 5.2%(+15.5)#31 | 5.3%(+15.4)#765 |
| 32. | Sumner | 20.6% | 5.2%(+15.4)#32 | 5.3%(+15.3)#779 |
| 33. | Linn Creek | 20.5% | 5.2%(+15.2)#33 | 5.3%(+15.2)#789 |
| 34. | Lewis And Clark Village | 20.4% | 5.2%(+15.1)#34 | 5.3%(+15.1)#798 |
| 35. | Newburg | 20.0% | 5.2%(+14.8)#35 | 5.3%(+14.7)#836 |
| 36. | Haywood City | 20.0% | 5.2%(+14.8)#36 | 5.3%(+14.7)#841 |
| 37. | Gentry | 20.0% | 5.2%(+14.8)#37 | 5.3%(+14.7)#845 |
| 38. | Hoberg | 20.0% | 5.2%(+14.8)#38 | 5.3%(+14.7)#851 |
| 39. | Hayward | 20.0% | 5.2%(+14.8)#39 | 5.3%(+14.7)#852 |
| 40. | St Cloud | 20.0% | 5.2%(+14.8)#40 | 5.3%(+14.7)#857 |
| 41. | Winchester | 19.9% | 5.2%(+14.6)#41 | 5.3%(+14.6)#861 |
| 42. | Mineral Point | 19.5% | 5.2%(+14.3)#42 | 5.3%(+14.2)#895 |
| 43. | Hurdland | 19.5% | 5.2%(+14.2)#43 | 5.3%(+14.2)#897 |
| 44. | Kinloch | 19.4% | 5.2%(+14.2)#44 | 5.3%(+14.1)#902 |
| 45. | Des Arc | 19.3% | 5.2%(+14.0)#45 | 5.3%(+14.0)#917 |
| 46. | Ridgely | 19.0% | 5.2%(+13.8)#46 | 5.3%(+13.8)#939 |
| 47. | Ritchey | 19.0% | 5.2%(+13.8)#47 | 5.3%(+13.8)#941 |
| 48. | Riverview | 19.0% | 5.2%(+13.8)#48 | 5.3%(+13.7)#942 |
| 49. | Brandsville | 18.8% | 5.2%(+13.5)#49 | 5.3%(+13.5)#973 |
| 50. | Vanduser | 18.8% | 5.2%(+13.5)#50 | 5.3%(+13.5)#974 |
| 51. | Perkins | 18.6% | 5.2%(+13.4)#51 | 5.3%(+13.4)#989 |
| 52. | Hillsdale | 18.6% | 5.2%(+13.4)#52 | 5.3%(+13.4)#991 |
| 53. | Warsaw | 18.6% | 5.2%(+13.4)#53 | 5.3%(+13.3)#994 |
| 54. | Iberia | 18.5% | 5.2%(+13.2)#54 | 5.3%(+13.2)#1,012 |
| 55. | Louisburg | 18.4% | 5.2%(+13.2)#55 | 5.3%(+13.1)#1,018 |
| 56. | Flordell Hills | 18.3% | 5.2%(+13.1)#56 | 5.3%(+13.0)#1,027 |
| 57. | Vibbard | 18.2% | 5.2%(+13.0)#57 | 5.3%(+12.9)#1,036 |
| 58. | Crocker | 18.1% | 5.2%(+12.8)#58 | 5.3%(+12.8)#1,056 |
| 59. | La Russell | 17.9% | 5.2%(+12.6)#59 | 5.3%(+12.6)#1,089 |
| 60. | Edgar Springs | 17.6% | 5.2%(+12.4)#60 | 5.3%(+12.4)#1,109 |
| 61. | Niangua | 17.5% | 5.2%(+12.3)#61 | 5.3%(+12.2)#1,124 |
| 62. | Newtown | 17.5% | 5.2%(+12.3)#62 | 5.3%(+12.2)#1,134 |
| 63. | Connelsville | 17.5% | 5.2%(+12.3)#63 | 5.3%(+12.2)#1,135 |
| 64. | Anniston | 17.5% | 5.2%(+12.2)#64 | 5.3%(+12.2)#1,141 |
| 65. | Franklin | 17.4% | 5.2%(+12.2)#65 | 5.3%(+12.1)#1,149 |
| 66. | Eminence | 16.8% | 5.2%(+11.5)#66 | 5.3%(+11.5)#1,232 |
| 67. | Sweet Springs | 16.7% | 5.2%(+11.4)#67 | 5.3%(+11.4)#1,247 |
| 68. | Cobalt | 16.7% | 5.2%(+11.4)#68 | 5.3%(+11.4)#1,255 |
| 69. | Truxton | 16.7% | 5.2%(+11.4)#69 | 5.3%(+11.4)#1,270 |
| 70. | Huntsdale | 16.7% | 5.2%(+11.4)#70 | 5.3%(+11.4)#1,276 |
| 71. | Emma | 16.5% | 5.2%(+11.3)#71 | 5.3%(+11.3)#1,290 |
| 72. | Kissee Mills | 16.2% | 5.2%(+10.9)#72 | 5.3%(+10.9)#1,370 |
| 73. | Preston | 16.1% | 5.2%(+10.8)#73 | 5.3%(+10.8)#1,389 |
| 74. | Willow Springs | 16.0% | 5.2%(+10.8)#74 | 5.3%(+10.8)#1,399 |
| 75. | Henrietta | 15.9% | 5.2%(+10.7)#75 | 5.3%(+10.6)#1,417 |
| 76. | Phillipsburg | 15.8% | 5.2%(+10.6)#76 | 5.3%(+10.5)#1,445 |
| 77. | Merriam Woods | 15.7% | 5.2%(+10.5)#77 | 5.3%(+10.5)#1,464 |
| 78. | La Belle | 15.4% | 5.2%(+10.2)#78 | 5.3%(+10.2)#1,518 |
| 79. | Truesdale | 15.3% | 5.2%(+10.1)#79 | 5.3%(+10.1)#1,543 |
| 80. | Cassville | 15.1% | 5.2%(+9.86)#80 | 5.3%(+9.81)#1,601 |
| 81. | Edina | 14.9% | 5.2%(+9.63)#81 | 5.3%(+9.58)#1,672 |
| 82. | Fleming | 14.8% | 5.2%(+9.58)#82 | 5.3%(+9.53)#1,685 |
| 83. | Williamsville | 14.8% | 5.2%(+9.54)#83 | 5.3%(+9.49)#1,692 |
| 84. | Ridgeway | 14.8% | 5.2%(+9.53)#84 | 5.3%(+9.48)#1,694 |
| 85. | Auxvasse | 14.7% | 5.2%(+9.50)#85 | 5.3%(+9.45)#1,703 |
| 86. | Mount Moriah | 14.6% | 5.2%(+9.35)#86 | 5.3%(+9.30)#1,744 |
| 87. | Sunrise Beach | 14.6% | 5.2%(+9.34)#87 | 5.3%(+9.29)#1,747 |
| 88. | Leasburg | 14.5% | 5.2%(+9.23)#88 | 5.3%(+9.18)#1,775 |
| 89. | Edmundson | 14.3% | 5.2%(+9.07)#89 | 5.3%(+9.02)#1,808 |
| 90. | Seligman | 14.3% | 5.2%(+9.05)#90 | 5.3%(+9.00)#1,809 |
| 91. | Spickard | 14.3% | 5.2%(+9.05)#91 | 5.3%(+9.00)#1,813 |
| 92. | Briarwood Estates | 14.3% | 5.2%(+9.05)#92 | 5.3%(+9.00)#1,814 |
| 93. | Utica | 14.3% | 5.2%(+9.05)#93 | 5.3%(+9.00)#1,818 |
| 94. | Saverton | 14.3% | 5.2%(+9.05)#94 | 5.3%(+9.00)#1,827 |
| 95. | Deerfield | 14.3% | 5.2%(+9.05)#95 | 5.3%(+9.00)#1,833 |
| 96. | Brewer | 14.2% | 5.2%(+8.99)#96 | 5.3%(+8.94)#1,852 |
| 97. | Rosendale | 14.1% | 5.2%(+8.87)#97 | 5.3%(+8.82)#1,883 |
| 98. | Bull Creek | 14.0% | 5.2%(+8.79)#98 | 5.3%(+8.74)#1,912 |
| 99. | Duquesne | 14.0% | 5.2%(+8.79)#99 | 5.3%(+8.74)#1,913 |
| 100. | Whiteman Afb | 14.0% | 5.2%(+8.77)#100 | 5.3%(+8.72)#1,916 |
Common Questions
What are the Top 10 Cities with the Highest Percentage of Population Employed in Food Preparation & Serving in Missouri?
Top 10 Cities with the Highest Percentage of Population Employed in Food Preparation & Serving in Missouri are:
#1
100.0%
#2
77.8%
#3
62.5%
#4
61.5%
#5
59.3%
#6
55.6%
#7
53.1%
#8
41.3%
#9
39.1%
#10
34.2%
What city has the Highest Percentage of Population Employed in Food Preparation & Serving in Missouri?
Bennett Springs has the Highest Percentage of Population Employed in Food Preparation & Serving in Missouri with 100.0%.
What is the Percentage of Population Employed in Food Preparation & Serving in the State of Missouri?
Percentage of Population Employed in Food Preparation & Serving in Missouri is 5.2%.
What is the Percentage of Population Employed in Food Preparation & Serving in the United States?
Percentage of Population Employed in Food Preparation & Serving in the United States is 5.3%.