Cities with the Highest Percentage of Population Employed in Food Preparation & Serving in Nebraska
RELATED REPORTS & OPTIONS
Food Preparation & Serving
Nebraska
Compare Cities
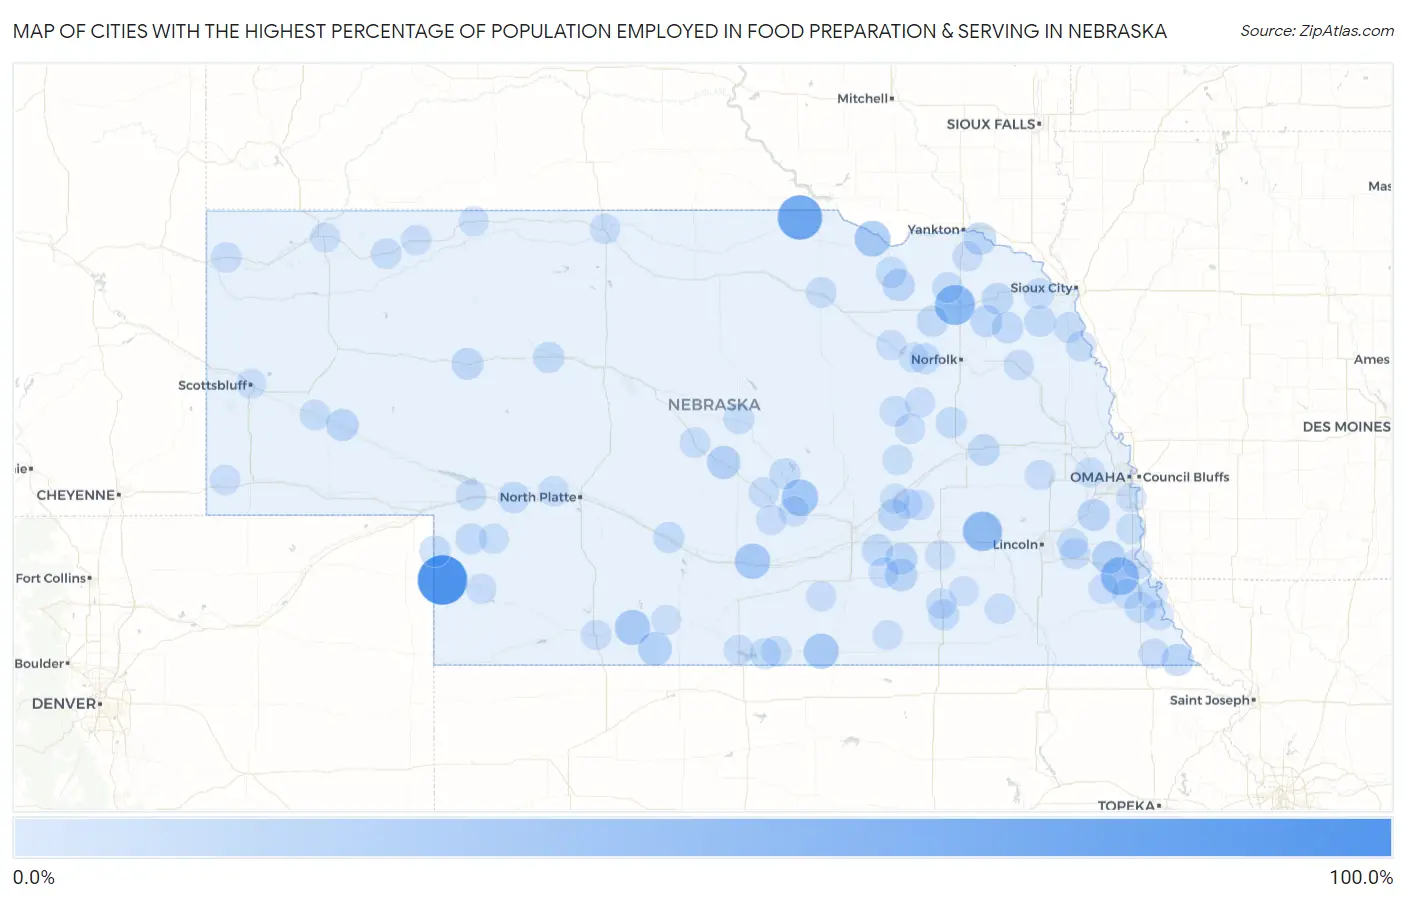
Map of Cities with the Highest Percentage of Population Employed in Food Preparation & Serving in Nebraska
0.0%
100.0%
Cities with the Highest Percentage of Population Employed in Food Preparation & Serving in Nebraska
| City | % Employed | vs State | vs National | |
| 1. | Lamar | 100.0% | 5.1%(+94.9)#1 | 5.3%(+94.7)#31 |
| 2. | Anoka | 75.0% | 5.1%(+69.9)#2 | 5.3%(+69.7)#49 |
| 3. | Mclean | 53.9% | 5.1%(+48.9)#3 | 5.3%(+48.7)#92 |
| 4. | Tamora | 50.0% | 5.1%(+44.9)#4 | 5.3%(+44.7)#119 |
| 5. | Lorton | 44.1% | 5.1%(+39.0)#5 | 5.3%(+38.8)#149 |
| 6. | Linoma Beach | 38.5% | 5.1%(+33.4)#6 | 5.3%(+33.2)#205 |
| 7. | Rockville | 36.2% | 5.1%(+31.1)#7 | 5.3%(+30.9)#233 |
| 8. | Verdel | 33.3% | 5.1%(+28.3)#8 | 5.3%(+28.0)#279 |
| 9. | Odessa | 32.0% | 5.1%(+26.9)#9 | 5.3%(+26.7)#297 |
| 10. | Inavale | 31.2% | 5.1%(+26.2)#10 | 5.3%(+26.0)#313 |
| 11. | Bartley | 31.0% | 5.1%(+25.9)#11 | 5.3%(+25.7)#319 |
| 12. | Wilsonville | 24.4% | 5.1%(+19.3)#12 | 5.3%(+19.1)#530 |
| 13. | Berwyn | 22.9% | 5.1%(+17.8)#13 | 5.3%(+17.6)#622 |
| 14. | Otoe | 22.5% | 5.1%(+17.4)#14 | 5.3%(+17.2)#640 |
| 15. | Saronville | 19.2% | 5.1%(+14.2)#15 | 5.3%(+13.9)#923 |
| 16. | St Helena | 18.5% | 5.1%(+13.4)#16 | 5.3%(+13.2)#1,011 |
| 17. | Broadwater | 18.2% | 5.1%(+13.1)#17 | 5.3%(+12.9)#1,042 |
| 18. | Winnetoon | 17.6% | 5.1%(+12.6)#18 | 5.3%(+12.4)#1,112 |
| 19. | Preston | 16.7% | 5.1%(+11.6)#19 | 5.3%(+11.4)#1,272 |
| 20. | Stockham | 16.7% | 5.1%(+11.6)#20 | 5.3%(+11.4)#1,277 |
| 21. | South Bend | 16.3% | 5.1%(+11.2)#21 | 5.3%(+11.0)#1,328 |
| 22. | Richland | 15.8% | 5.1%(+10.7)#22 | 5.3%(+10.5)#1,451 |
| 23. | Carroll | 15.7% | 5.1%(+10.7)#23 | 5.3%(+10.5)#1,461 |
| 24. | Hyannis | 15.7% | 5.1%(+10.6)#24 | 5.3%(+10.4)#1,477 |
| 25. | Laurel | 14.9% | 5.1%(+9.83)#25 | 5.3%(+9.62)#1,663 |
| 26. | Marquette | 14.8% | 5.1%(+9.68)#26 | 5.3%(+9.47)#1,700 |
| 27. | Giltner | 14.7% | 5.1%(+9.66)#27 | 5.3%(+9.45)#1,702 |
| 28. | Foster | 14.3% | 5.1%(+9.21)#28 | 5.3%(+9.00)#1,836 |
| 29. | Emerson | 14.1% | 5.1%(+9.07)#29 | 5.3%(+8.86)#1,871 |
| 30. | Wayne | 14.1% | 5.1%(+9.06)#30 | 5.3%(+8.85)#1,872 |
| 31. | Paxton | 13.8% | 5.1%(+8.76)#31 | 5.3%(+8.55)#1,959 |
| 32. | Mullen | 13.6% | 5.1%(+8.48)#32 | 5.3%(+8.27)#2,050 |
| 33. | Venango | 13.3% | 5.1%(+8.26)#33 | 5.3%(+8.05)#2,129 |
| 34. | Grant | 13.2% | 5.1%(+8.10)#34 | 5.3%(+7.89)#2,197 |
| 35. | Cozad | 12.5% | 5.1%(+7.46)#35 | 5.3%(+7.25)#2,468 |
| 36. | Tarnov | 12.5% | 5.1%(+7.42)#36 | 5.3%(+7.21)#2,528 |
| 37. | Auburn | 12.4% | 5.1%(+7.35)#37 | 5.3%(+7.14)#2,552 |
| 38. | Verdigre | 12.4% | 5.1%(+7.27)#38 | 5.3%(+7.06)#2,583 |
| 39. | Loup City | 12.2% | 5.1%(+7.11)#39 | 5.3%(+6.90)#2,656 |
| 40. | Bruning | 11.9% | 5.1%(+6.87)#40 | 5.3%(+6.66)#2,793 |
| 41. | Meadow Grove | 11.9% | 5.1%(+6.83)#41 | 5.3%(+6.62)#2,823 |
| 42. | Naponee | 11.7% | 5.1%(+6.61)#42 | 5.3%(+6.40)#2,954 |
| 43. | Wausa | 11.6% | 5.1%(+6.56)#43 | 5.3%(+6.36)#2,979 |
| 44. | Sargent | 11.4% | 5.1%(+6.34)#44 | 5.3%(+6.13)#3,114 |
| 45. | Woodland Hills | 11.3% | 5.1%(+6.24)#45 | 5.3%(+6.03)#3,182 |
| 46. | Albion | 11.1% | 5.1%(+6.05)#46 | 5.3%(+5.84)#3,299 |
| 47. | Cheney | 11.0% | 5.1%(+5.91)#47 | 5.3%(+5.70)#3,398 |
| 48. | Waterbury | 10.9% | 5.1%(+5.79)#48 | 5.3%(+5.58)#3,473 |
| 49. | Rushville | 10.8% | 5.1%(+5.73)#49 | 5.3%(+5.52)#3,504 |
| 50. | O Neill | 10.8% | 5.1%(+5.73)#50 | 5.3%(+5.52)#3,512 |
| 51. | Ogallala | 10.8% | 5.1%(+5.71)#51 | 5.3%(+5.50)#3,523 |
| 52. | Winnebago | 10.7% | 5.1%(+5.62)#52 | 5.3%(+5.42)#3,584 |
| 53. | Eagle | 10.7% | 5.1%(+5.60)#53 | 5.3%(+5.39)#3,598 |
| 54. | Merna | 10.5% | 5.1%(+5.45)#54 | 5.3%(+5.24)#3,695 |
| 55. | Macy | 10.5% | 5.1%(+5.39)#55 | 5.3%(+5.19)#3,743 |
| 56. | Bridgeport | 10.4% | 5.1%(+5.36)#56 | 5.3%(+5.15)#3,775 |
| 57. | Litchfield | 10.3% | 5.1%(+5.21)#57 | 5.3%(+5.00)#3,873 |
| 58. | Brock | 10.3% | 5.1%(+5.18)#58 | 5.3%(+4.97)#3,892 |
| 59. | Bloomington | 10.2% | 5.1%(+5.13)#59 | 5.3%(+4.92)#3,938 |
| 60. | Peru | 10.1% | 5.1%(+4.98)#60 | 5.3%(+4.77)#4,055 |
| 61. | Nebraska City | 10.0% | 5.1%(+4.94)#61 | 5.3%(+4.73)#4,087 |
| 62. | Strang | 10.0% | 5.1%(+4.92)#62 | 5.3%(+4.71)#4,127 |
| 63. | St Edward | 9.9% | 5.1%(+4.85)#63 | 5.3%(+4.64)#4,168 |
| 64. | Harrison | 9.9% | 5.1%(+4.81)#64 | 5.3%(+4.60)#4,197 |
| 65. | Mccook | 9.8% | 5.1%(+4.67)#65 | 5.3%(+4.46)#4,314 |
| 66. | Gordon | 9.6% | 5.1%(+4.55)#66 | 5.3%(+4.34)#4,417 |
| 67. | Ravenna | 9.6% | 5.1%(+4.49)#67 | 5.3%(+4.28)#4,473 |
| 68. | Harvard | 9.6% | 5.1%(+4.47)#68 | 5.3%(+4.27)#4,493 |
| 69. | Pleasanton | 9.5% | 5.1%(+4.47)#69 | 5.3%(+4.26)#4,498 |
| 70. | Salem | 9.5% | 5.1%(+4.45)#70 | 5.3%(+4.24)#4,517 |
| 71. | Fullerton | 9.5% | 5.1%(+4.44)#71 | 5.3%(+4.23)#4,524 |
| 72. | Valentine | 9.4% | 5.1%(+4.33)#72 | 5.3%(+4.12)#4,630 |
| 73. | Bushnell | 9.4% | 5.1%(+4.30)#73 | 5.3%(+4.09)#4,666 |
| 74. | Cook | 9.3% | 5.1%(+4.27)#74 | 5.3%(+4.06)#4,691 |
| 75. | Swanton | 9.3% | 5.1%(+4.26)#75 | 5.3%(+4.05)#4,711 |
| 76. | Malmo | 9.2% | 5.1%(+4.13)#76 | 5.3%(+3.92)#4,832 |
| 77. | Imperial | 9.2% | 5.1%(+4.10)#77 | 5.3%(+3.89)#4,859 |
| 78. | Neligh | 9.2% | 5.1%(+4.09)#78 | 5.3%(+3.88)#4,874 |
| 79. | Wisner | 9.1% | 5.1%(+4.06)#79 | 5.3%(+3.85)#4,902 |
| 80. | Hershey | 9.1% | 5.1%(+4.04)#80 | 5.3%(+3.83)#4,913 |
| 81. | Fordyce | 9.1% | 5.1%(+4.01)#81 | 5.3%(+3.80)#4,957 |
| 82. | Holstein | 9.1% | 5.1%(+4.01)#82 | 5.3%(+3.80)#4,959 |
| 83. | Nemaha | 9.1% | 5.1%(+4.01)#83 | 5.3%(+3.80)#4,967 |
| 84. | Alma | 9.0% | 5.1%(+3.91)#84 | 5.3%(+3.70)#5,080 |
| 85. | Polk | 8.9% | 5.1%(+3.87)#85 | 5.3%(+3.66)#5,144 |
| 86. | Murray | 8.9% | 5.1%(+3.79)#86 | 5.3%(+3.58)#5,236 |
| 87. | Hordville | 8.8% | 5.1%(+3.72)#87 | 5.3%(+3.51)#5,314 |
| 88. | Madrid | 8.7% | 5.1%(+3.66)#88 | 5.3%(+3.45)#5,382 |
| 89. | Newman Grove | 8.6% | 5.1%(+3.53)#89 | 5.3%(+3.32)#5,540 |
| 90. | Central City | 8.6% | 5.1%(+3.50)#90 | 5.3%(+3.29)#5,569 |
| 91. | Chadron | 8.3% | 5.1%(+3.26)#91 | 5.3%(+3.06)#5,850 |
| 92. | Merriman | 8.3% | 5.1%(+3.26)#92 | 5.3%(+3.05)#5,895 |
| 93. | Nelson | 8.2% | 5.1%(+3.10)#93 | 5.3%(+2.89)#6,098 |
| 94. | Scottsbluff | 8.2% | 5.1%(+3.08)#94 | 5.3%(+2.87)#6,133 |
| 95. | Holbrook | 8.1% | 5.1%(+3.03)#95 | 5.3%(+2.82)#6,186 |
| 96. | Mccool Junction | 8.0% | 5.1%(+2.88)#96 | 5.3%(+2.67)#6,403 |
| 97. | Offutt Afb | 7.9% | 5.1%(+2.87)#97 | 5.3%(+2.66)#6,421 |
| 98. | Waterloo | 7.9% | 5.1%(+2.85)#98 | 5.3%(+2.64)#6,453 |
| 99. | Milligan | 7.9% | 5.1%(+2.80)#99 | 5.3%(+2.59)#6,530 |
| 100. | Tilden | 7.8% | 5.1%(+2.75)#100 | 5.3%(+2.54)#6,615 |
Common Questions
What are the Top 10 Cities with the Highest Percentage of Population Employed in Food Preparation & Serving in Nebraska?
Top 10 Cities with the Highest Percentage of Population Employed in Food Preparation & Serving in Nebraska are:
What city has the Highest Percentage of Population Employed in Food Preparation & Serving in Nebraska?
Lamar has the Highest Percentage of Population Employed in Food Preparation & Serving in Nebraska with 100.0%.
What is the Percentage of Population Employed in Food Preparation & Serving in the State of Nebraska?
Percentage of Population Employed in Food Preparation & Serving in Nebraska is 5.1%.
What is the Percentage of Population Employed in Food Preparation & Serving in the United States?
Percentage of Population Employed in Food Preparation & Serving in the United States is 5.3%.