Hayfork, CA Map & Demographics
Hayfork Map
Hayfork Overview
$25,870
PER CAPITA INCOME
$56,755
AVG FAMILY INCOME
$40,653
AVG HOUSEHOLD INCOME
5.7%
WAGE / INCOME GAP [ % ]
94.3¢/ $1
WAGE / INCOME GAP [ $ ]
0.54
INEQUALITY / GINI INDEX
3,227
TOTAL POPULATION
1,630
MALE POPULATION
1,597
FEMALE POPULATION
102.07
MALES / 100 FEMALES
97.98
FEMALES / 100 MALES
56.9
MEDIAN AGE
3.9
AVG FAMILY SIZE
3.4
AVG HOUSEHOLD SIZE
512
LABOR FORCE [ PEOPLE ]
17.5%
PERCENT IN LABOR FORCE
Hayfork Zip Codes
Hayfork Area Codes
Income in Hayfork
Income Overview in Hayfork
Per Capita Income in Hayfork is $25,870, while median incomes of families and households are $56,755 and $40,653 respectively.
| Characteristic | Number | Measure |
| Per Capita Income | 3,227 | $25,870 |
| Median Family Income | 358 | $56,755 |
| Mean Family Income | 358 | $85,232 |
| Median Household Income | 947 | $40,653 |
| Mean Household Income | 947 | $65,800 |
| Income Deficit | 358 | $0 |
| Wage / Income Gap (%) | 3,227 | 5.66% |
| Wage / Income Gap ($) | 3,227 | 94.34¢ per $1 |
| Gini / Inequality Index | 3,227 | 0.54 |
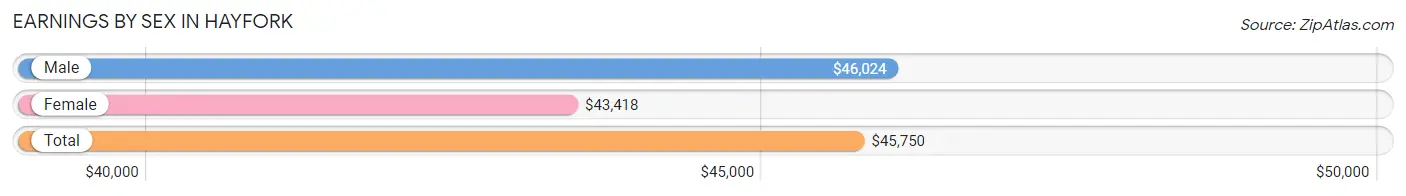
Earnings by Sex in Hayfork
Average Earnings in Hayfork are $45,750, $46,024 for men and $43,418 for women, a difference of 5.7%.
| Sex | Number | Average Earnings |
| Male | 577 (61.8%) | $46,024 |
| Female | 357 (38.2%) | $43,418 |
| Total | 934 (100.0%) | $45,750 |
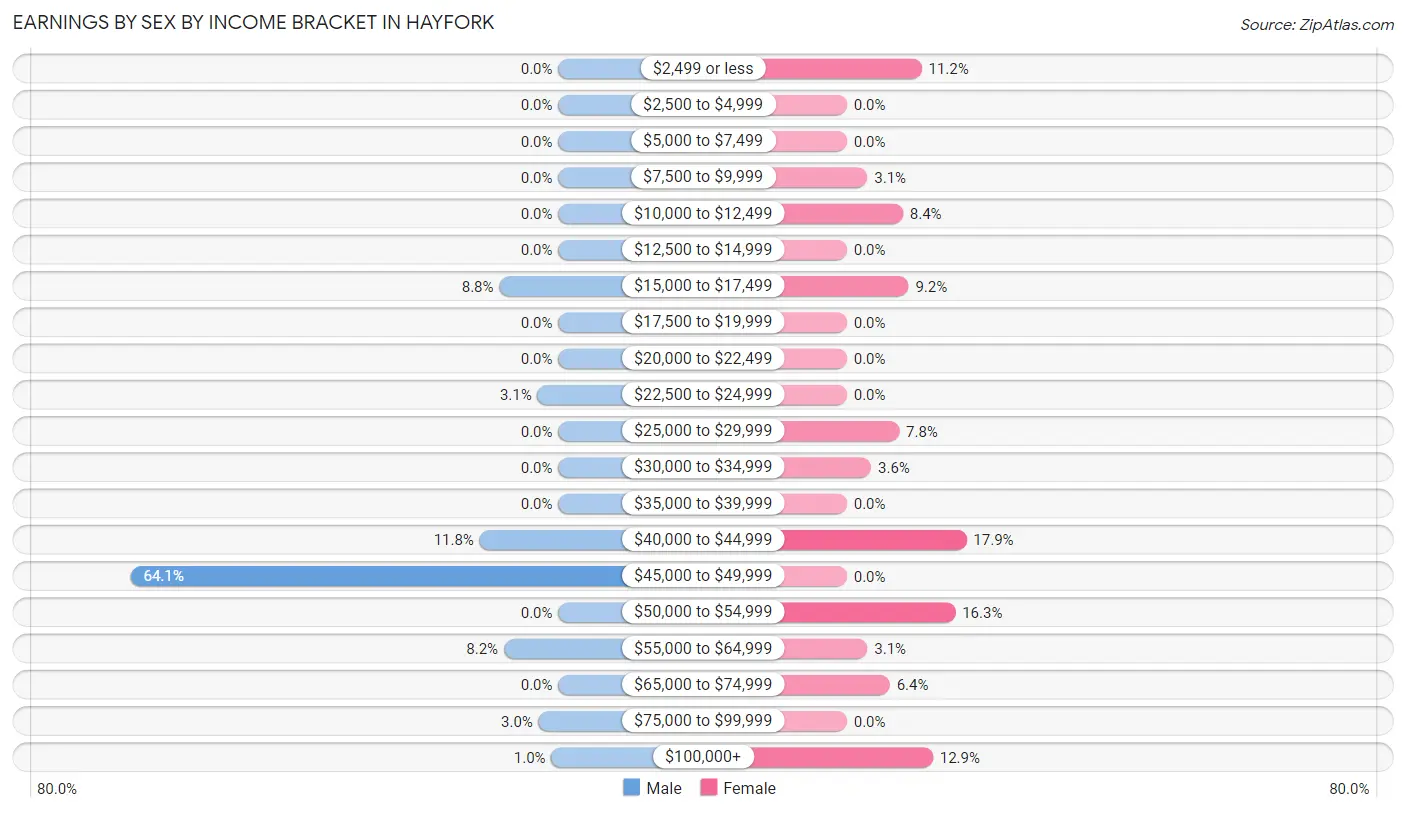
Earnings by Sex by Income Bracket in Hayfork
The most common earnings brackets in Hayfork are $45,000 to $49,999 for men (370 | 64.1%) and $40,000 to $44,999 for women (64 | 17.9%).
| Income | Male | Female |
| $2,499 or less | 0 (0.0%) | 40 (11.2%) |
| $2,500 to $4,999 | 0 (0.0%) | 0 (0.0%) |
| $5,000 to $7,499 | 0 (0.0%) | 0 (0.0%) |
| $7,500 to $9,999 | 0 (0.0%) | 11 (3.1%) |
| $10,000 to $12,499 | 0 (0.0%) | 30 (8.4%) |
| $12,500 to $14,999 | 0 (0.0%) | 0 (0.0%) |
| $15,000 to $17,499 | 51 (8.8%) | 33 (9.2%) |
| $17,500 to $19,999 | 0 (0.0%) | 0 (0.0%) |
| $20,000 to $22,499 | 0 (0.0%) | 0 (0.0%) |
| $22,500 to $24,999 | 18 (3.1%) | 0 (0.0%) |
| $25,000 to $29,999 | 0 (0.0%) | 28 (7.8%) |
| $30,000 to $34,999 | 0 (0.0%) | 13 (3.6%) |
| $35,000 to $39,999 | 0 (0.0%) | 0 (0.0%) |
| $40,000 to $44,999 | 68 (11.8%) | 64 (17.9%) |
| $45,000 to $49,999 | 370 (64.1%) | 0 (0.0%) |
| $50,000 to $54,999 | 0 (0.0%) | 58 (16.3%) |
| $55,000 to $64,999 | 47 (8.2%) | 11 (3.1%) |
| $65,000 to $74,999 | 0 (0.0%) | 23 (6.4%) |
| $75,000 to $99,999 | 17 (2.9%) | 0 (0.0%) |
| $100,000+ | 6 (1.0%) | 46 (12.9%) |
| Total | 577 (100.0%) | 357 (100.0%) |
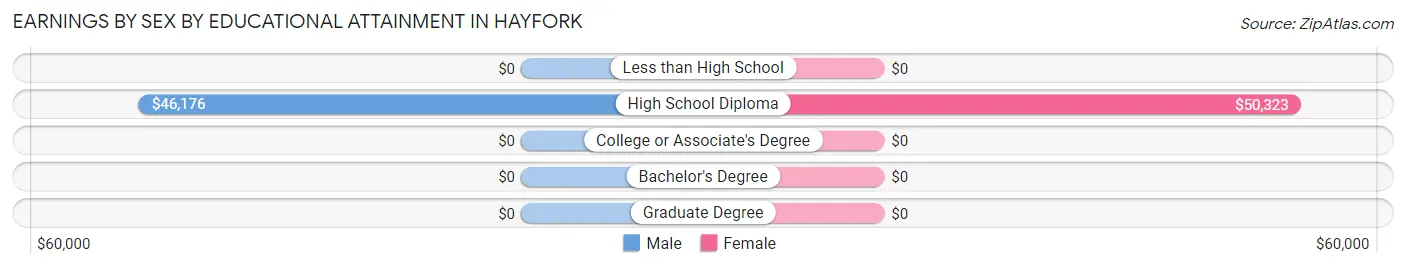
Earnings by Sex by Educational Attainment in Hayfork
Average earnings in Hayfork are $46,253 for men and $44,199 for women, a difference of 4.4%. Men with an educational attainment of high school diploma enjoy the highest average annual earnings of $46,176, while those with high school diploma education earn the least with $46,176. Women with an educational attainment of high school diploma earn the most with the average annual earnings of $50,323, while those with high school diploma education have the smallest earnings of $50,323.
| Educational Attainment | Male Income | Female Income |
| Less than High School | - | - |
| High School Diploma | $46,176 | $50,323 |
| College or Associate's Degree | - | - |
| Bachelor's Degree | - | - |
| Graduate Degree | - | - |
| Total | $46,253 | $44,199 |
Family Income in Hayfork
Family Income Brackets in Hayfork
According to the Hayfork family income data, there are 94 families falling into the $50,000 to $74,999 income range, which is the most common income bracket and makes up 26.3% of all families.
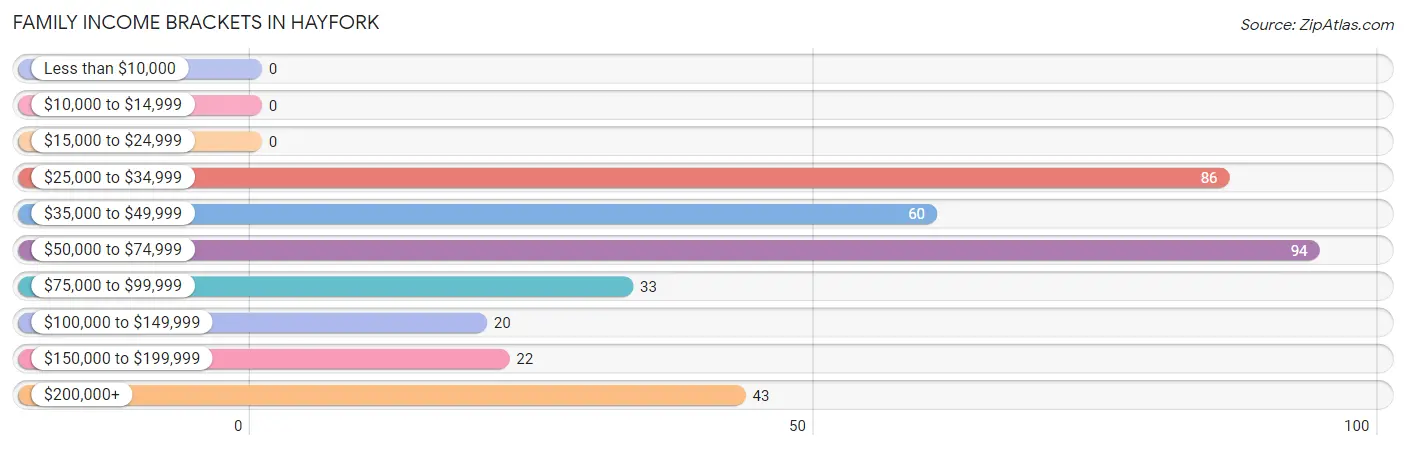
| Income Bracket | # Families | % Families |
| Less than $10,000 | 0 | 0.0% |
| $10,000 to $14,999 | 0 | 0.0% |
| $15,000 to $24,999 | 0 | 0.0% |
| $25,000 to $34,999 | 86 | 24.0% |
| $35,000 to $49,999 | 60 | 16.8% |
| $50,000 to $74,999 | 94 | 26.3% |
| $75,000 to $99,999 | 33 | 9.2% |
| $100,000 to $149,999 | 20 | 5.6% |
| $150,000 to $199,999 | 22 | 6.1% |
| $200,000+ | 43 | 12.0% |
Family Income by Famaliy Size in Hayfork
| Income Bracket | # Families | Median Income |
| 2-Person Families | 285 (79.6%) | $0 |
| 3-Person Families | 0 (0.0%) | $0 |
| 4-Person Families | 20 (5.6%) | $0 |
| 5-Person Families | 53 (14.8%) | $0 |
| 6-Person Families | 0 (0.0%) | $0 |
| 7+ Person Families | 0 (0.0%) | $0 |
| Total | 358 (100.0%) | $56,755 |
Family Income by Number of Earners in Hayfork
| Number of Earners | # Families | Median Income |
| No Earners | 239 (66.8%) | $0 |
| 1 Earner | 60 (16.8%) | $0 |
| 2 Earners | 39 (10.9%) | $0 |
| 3+ Earners | 20 (5.6%) | $0 |
| Total | 358 (100.0%) | $56,755 |
Household Income in Hayfork
Household Income Brackets in Hayfork
With 192 households falling in the category, the $35,000 to $49,999 income range is the most frequent in Hayfork, accounting for 20.3% of all households. In contrast, only 22 households (2.3%) fall into the $150,000 to $199,999 income bracket, making it the least populous group.
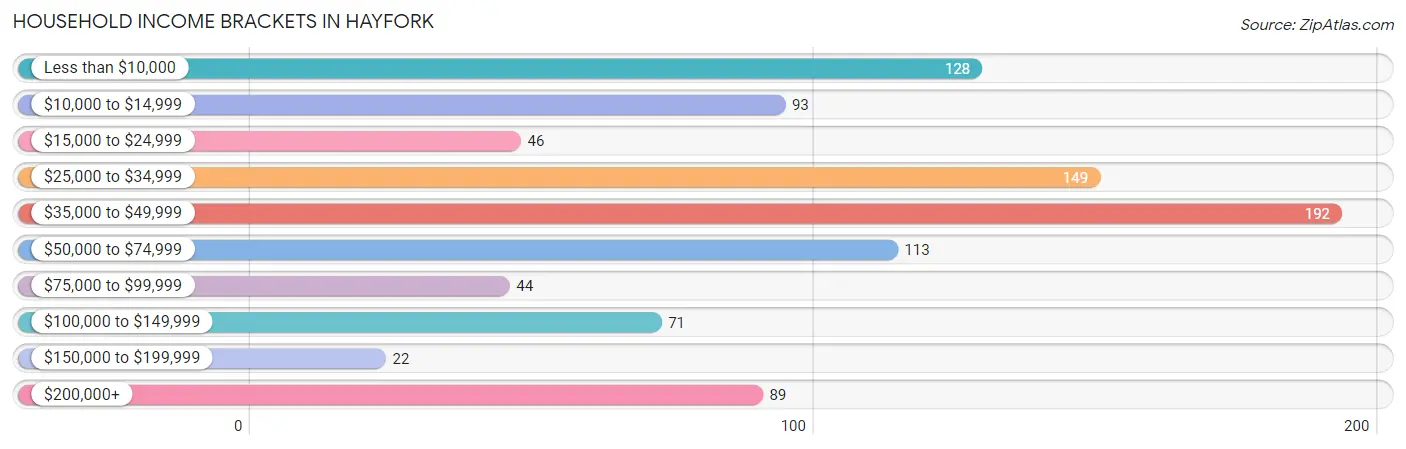
| Income Bracket | # Households | % Households |
| Less than $10,000 | 128 | 13.5% |
| $10,000 to $14,999 | 93 | 9.8% |
| $15,000 to $24,999 | 46 | 4.9% |
| $25,000 to $34,999 | 149 | 15.7% |
| $35,000 to $49,999 | 192 | 20.3% |
| $50,000 to $74,999 | 113 | 11.9% |
| $75,000 to $99,999 | 44 | 4.6% |
| $100,000 to $149,999 | 71 | 7.5% |
| $150,000 to $199,999 | 22 | 2.3% |
| $200,000+ | 89 | 9.4% |
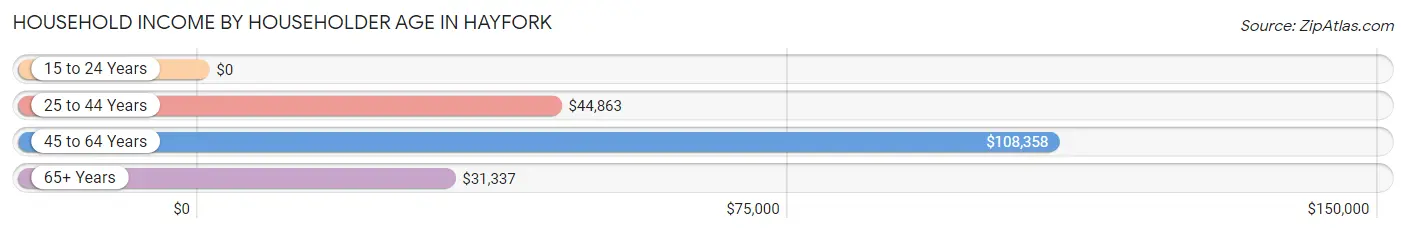
Household Income by Householder Age in Hayfork
The median household income in Hayfork is $40,653, with the highest median household income of $108,358 found in the 45 to 64 years age bracket for the primary householder. A total of 107 households (11.3%) fall into this category.
| Income Bracket | # Households | Median Income |
| 15 to 24 Years | 0 (0.0%) | $0 |
| 25 to 44 Years | 265 (28.0%) | $44,863 |
| 45 to 64 Years | 107 (11.3%) | $108,358 |
| 65+ Years | 575 (60.7%) | $31,337 |
| Total | 947 (100.0%) | $40,653 |
Poverty in Hayfork
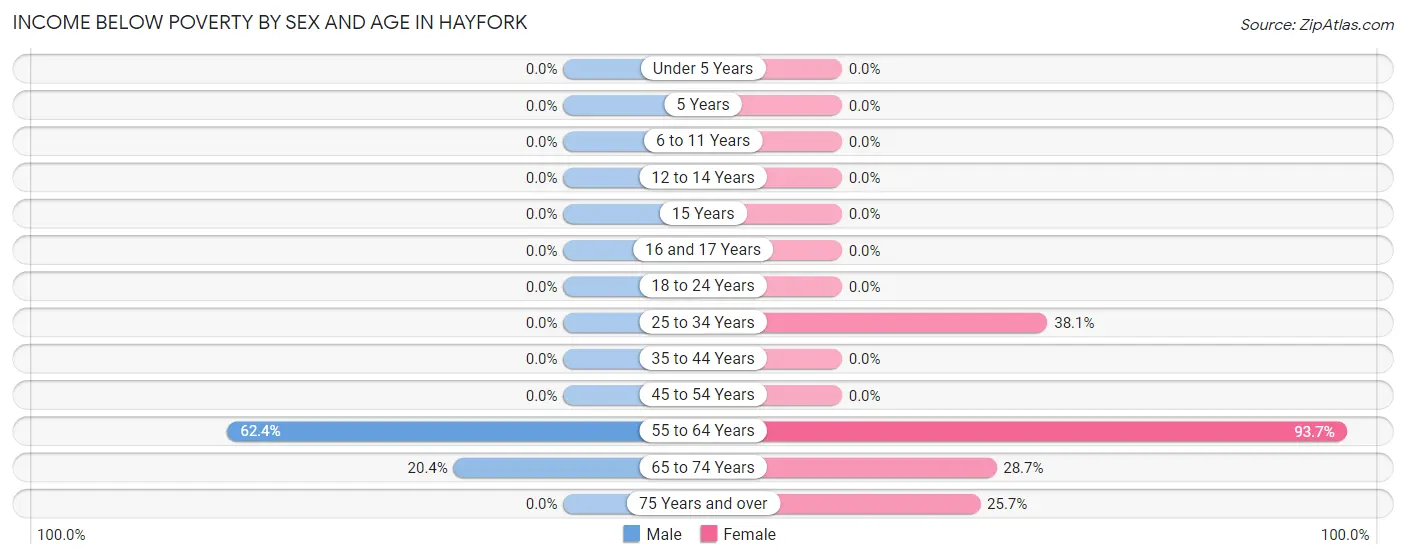
Income Below Poverty by Sex and Age in Hayfork
With 5.6% poverty level for males and 56.4% for females among the residents of Hayfork, 55 to 64 year old males and 55 to 64 year old females are the most vulnerable to poverty, with 58 males (62.4%) and 696 females (93.7%) in their respective age groups living below the poverty level.
| Age Bracket | Male | Female |
| Under 5 Years | 0 (0.0%) | 0 (0.0%) |
| 5 Years | 0 (0.0%) | 0 (0.0%) |
| 6 to 11 Years | 0 (0.0%) | 0 (0.0%) |
| 12 to 14 Years | 0 (0.0%) | 0 (0.0%) |
| 15 Years | 0 (0.0%) | 0 (0.0%) |
| 16 and 17 Years | 0 (0.0%) | 0 (0.0%) |
| 18 to 24 Years | 0 (0.0%) | 0 (0.0%) |
| 25 to 34 Years | 0 (0.0%) | 82 (38.1%) |
| 35 to 44 Years | 0 (0.0%) | 0 (0.0%) |
| 45 to 54 Years | 0 (0.0%) | 0 (0.0%) |
| 55 to 64 Years | 58 (62.4%) | 696 (93.7%) |
| 65 to 74 Years | 33 (20.4%) | 74 (28.7%) |
| 75 Years and over | 0 (0.0%) | 48 (25.7%) |
| Total | 91 (5.6%) | 900 (56.4%) |
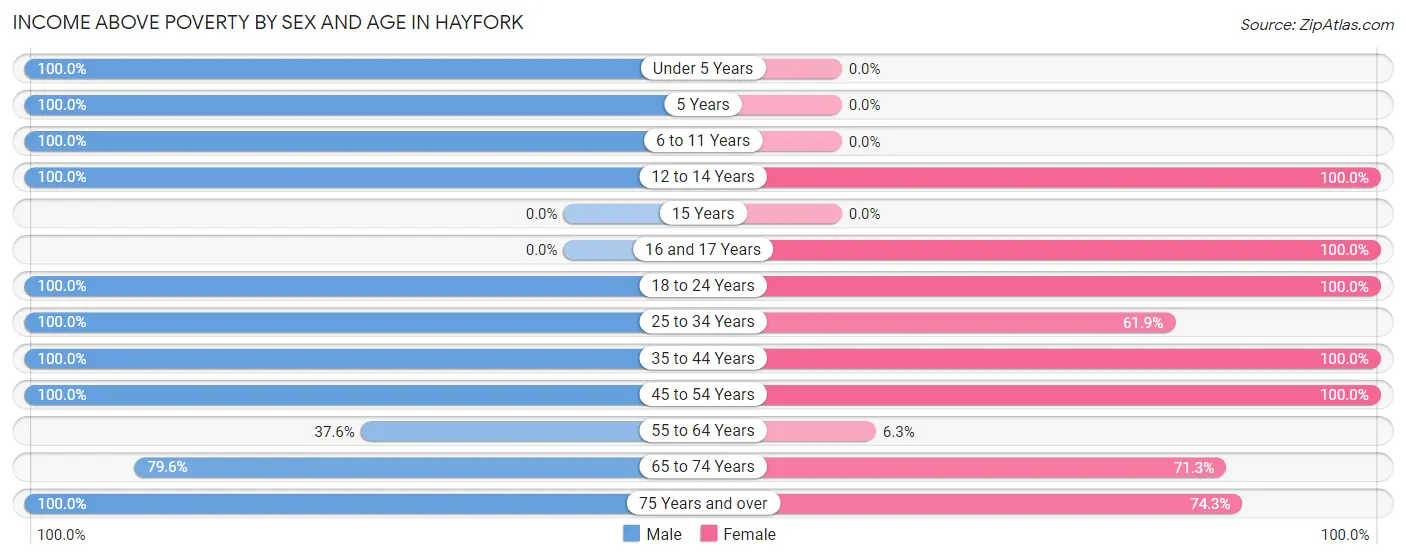
Income Above Poverty by Sex and Age in Hayfork
According to the poverty statistics in Hayfork, males aged under 5 years and females aged 12 to 14 years are the age groups that are most secure financially, with 100.0% of males and 100.0% of females in these age groups living above the poverty line.
| Age Bracket | Male | Female |
| Under 5 Years | 68 (100.0%) | 0 (0.0%) |
| 5 Years | 43 (100.0%) | 0 (0.0%) |
| 6 to 11 Years | 81 (100.0%) | 0 (0.0%) |
| 12 to 14 Years | 75 (100.0%) | 32 (100.0%) |
| 15 Years | 0 (0.0%) | 0 (0.0%) |
| 16 and 17 Years | 0 (0.0%) | 33 (100.0%) |
| 18 to 24 Years | 68 (100.0%) | 40 (100.0%) |
| 25 to 34 Years | 407 (100.0%) | 133 (61.9%) |
| 35 to 44 Years | 53 (100.0%) | 69 (100.0%) |
| 45 to 54 Years | 322 (100.0%) | 20 (100.0%) |
| 55 to 64 Years | 35 (37.6%) | 47 (6.3%) |
| 65 to 74 Years | 129 (79.6%) | 184 (71.3%) |
| 75 Years and over | 258 (100.0%) | 139 (74.3%) |
| Total | 1,539 (94.4%) | 697 (43.6%) |
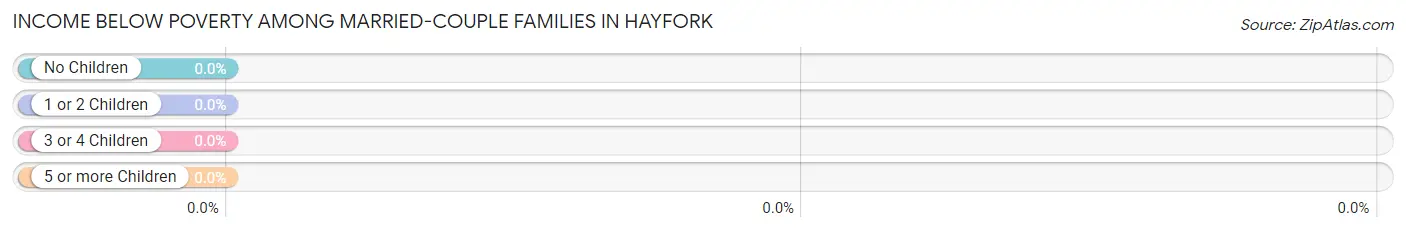
Income Below Poverty Among Married-Couple Families in Hayfork
| Children | Above Poverty | Below Poverty |
| No Children | 203 (100.0%) | 0 (0.0%) |
| 1 or 2 Children | 20 (100.0%) | 0 (0.0%) |
| 3 or 4 Children | 6 (100.0%) | 0 (0.0%) |
| 5 or more Children | 0 (0.0%) | 0 (0.0%) |
| Total | 229 (100.0%) | 0 (0.0%) |
Income Below Poverty Among Single-Parent Households in Hayfork
| Children | Single Father | Single Mother |
| No Children | 0 (0.0%) | 0 (0.0%) |
| 1 or 2 Children | 0 (0.0%) | 0 (0.0%) |
| 3 or 4 Children | 0 (0.0%) | 0 (0.0%) |
| 5 or more Children | 0 (0.0%) | 0 (0.0%) |
| Total | 0 (0.0%) | 0 (0.0%) |
Income Below Poverty Among Married-Couple vs Single-Parent Households in Hayfork
| Children | Married-Couple Families | Single-Parent Households |
| No Children | 0 (0.0%) | 0 (0.0%) |
| 1 or 2 Children | 0 (0.0%) | 0 (0.0%) |
| 3 or 4 Children | 0 (0.0%) | 0 (0.0%) |
| 5 or more Children | 0 (0.0%) | 0 (0.0%) |
| Total | 0 (0.0%) | 0 (0.0%) |
Race in Hayfork
The most populous races in Hayfork are White / Caucasian (2,538 | 78.6%), Hispanic or Latino (555 | 17.2%), and Some other Race (520 | 16.1%).
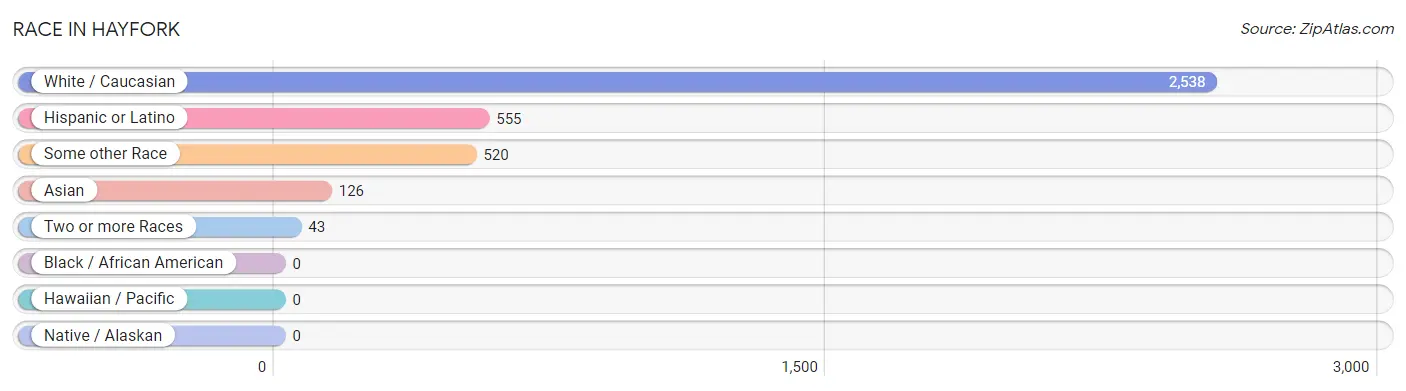
| Race | # Population | % Population |
| Asian | 126 | 3.9% |
| Black / African American | 0 | 0.0% |
| Hawaiian / Pacific | 0 | 0.0% |
| Hispanic or Latino | 555 | 17.2% |
| Native / Alaskan | 0 | 0.0% |
| White / Caucasian | 2,538 | 78.6% |
| Two or more Races | 43 | 1.3% |
| Some other Race | 520 | 16.1% |
| Total | 3,227 | 100.0% |
Ancestry in Hayfork
The most populous ancestries reported in Hayfork are Dominican (421 | 13.1%), American (415 | 12.9%), Hungarian (290 | 9.0%), English (216 | 6.7%), and Irish (193 | 6.0%), together accounting for 47.6% of all Hayfork residents.
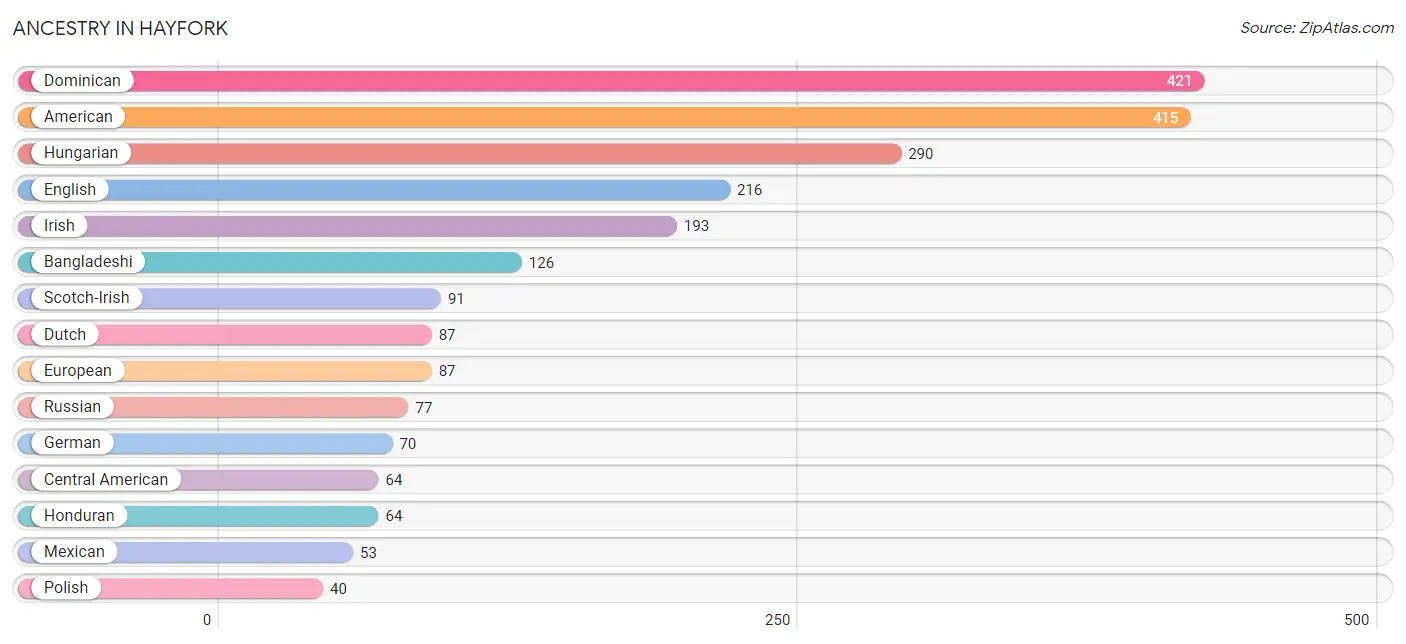
| Ancestry | # Population | % Population |
| American | 415 | 12.9% |
| Bangladeshi | 126 | 3.9% |
| Central American | 64 | 2.0% |
| Cuban | 17 | 0.5% |
| Czechoslovakian | 33 | 1.0% |
| Dominican | 421 | 13.1% |
| Dutch | 87 | 2.7% |
| English | 216 | 6.7% |
| European | 87 | 2.7% |
| French Canadian | 28 | 0.9% |
| German | 70 | 2.2% |
| Honduran | 64 | 2.0% |
| Hungarian | 290 | 9.0% |
| Irish | 193 | 6.0% |
| Mexican | 53 | 1.6% |
| Polish | 40 | 1.2% |
| Portuguese | 39 | 1.2% |
| Russian | 77 | 2.4% |
| Scotch-Irish | 91 | 2.8% |
| Scottish | 11 | 0.3% |
| Swedish | 22 | 0.7% |
| Welsh | 22 | 0.7% | View All 22 Rows |
Immigrants in Hayfork
The most numerous immigrant groups reported in Hayfork came from Latin America (502 | 15.6%), Caribbean (438 | 13.6%), Dominican Republic (421 | 13.1%), Europe (102 | 3.2%), and Eastern Europe (82 | 2.5%), together accounting for 47.9% of all Hayfork residents.
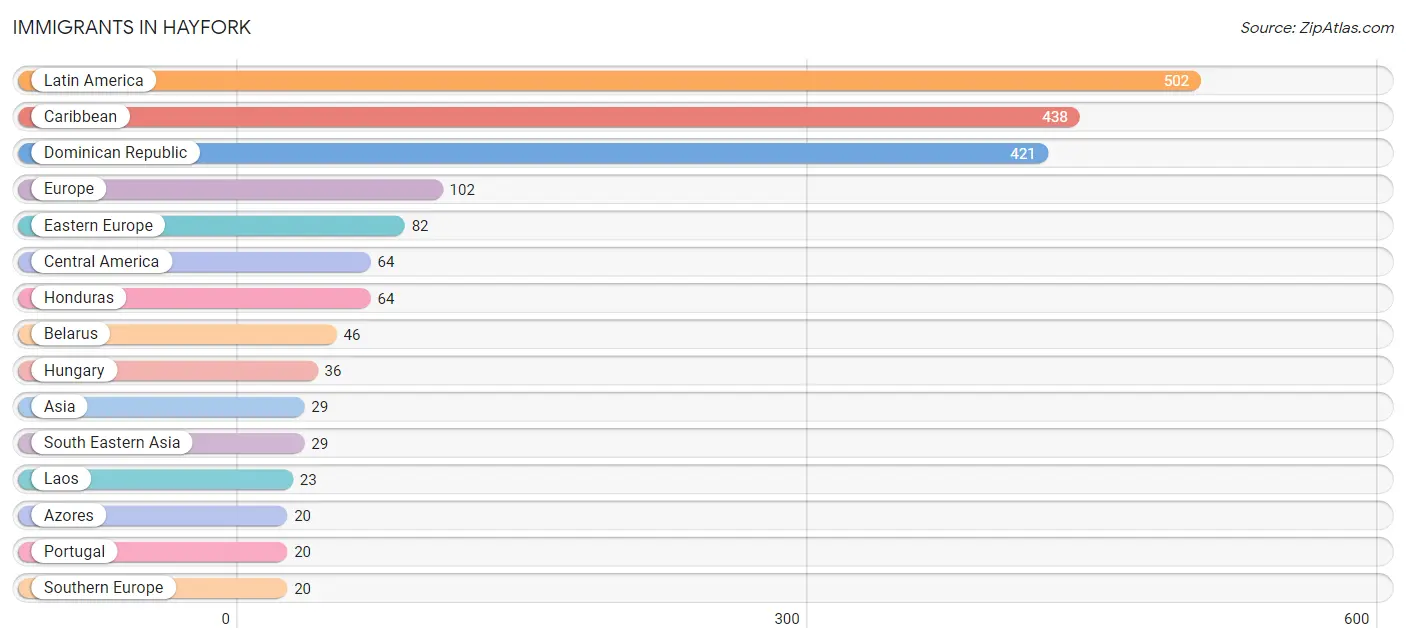
| Immigration Origin | # Population | % Population |
| Asia | 29 | 0.9% |
| Azores | 20 | 0.6% |
| Belarus | 46 | 1.4% |
| Caribbean | 438 | 13.6% |
| Central America | 64 | 2.0% |
| Cuba | 17 | 0.5% |
| Dominican Republic | 421 | 13.1% |
| Eastern Europe | 82 | 2.5% |
| Europe | 102 | 3.2% |
| Honduras | 64 | 2.0% |
| Hungary | 36 | 1.1% |
| Laos | 23 | 0.7% |
| Latin America | 502 | 15.6% |
| Portugal | 20 | 0.6% |
| South Eastern Asia | 29 | 0.9% |
| Southern Europe | 20 | 0.6% |
| Thailand | 6 | 0.2% | View All 17 Rows |
Sex and Age in Hayfork
Sex and Age in Hayfork
The most populous age groups in Hayfork are 25 to 29 Years (370 | 22.7%) for men and 60 to 64 Years (707 | 44.3%) for women.
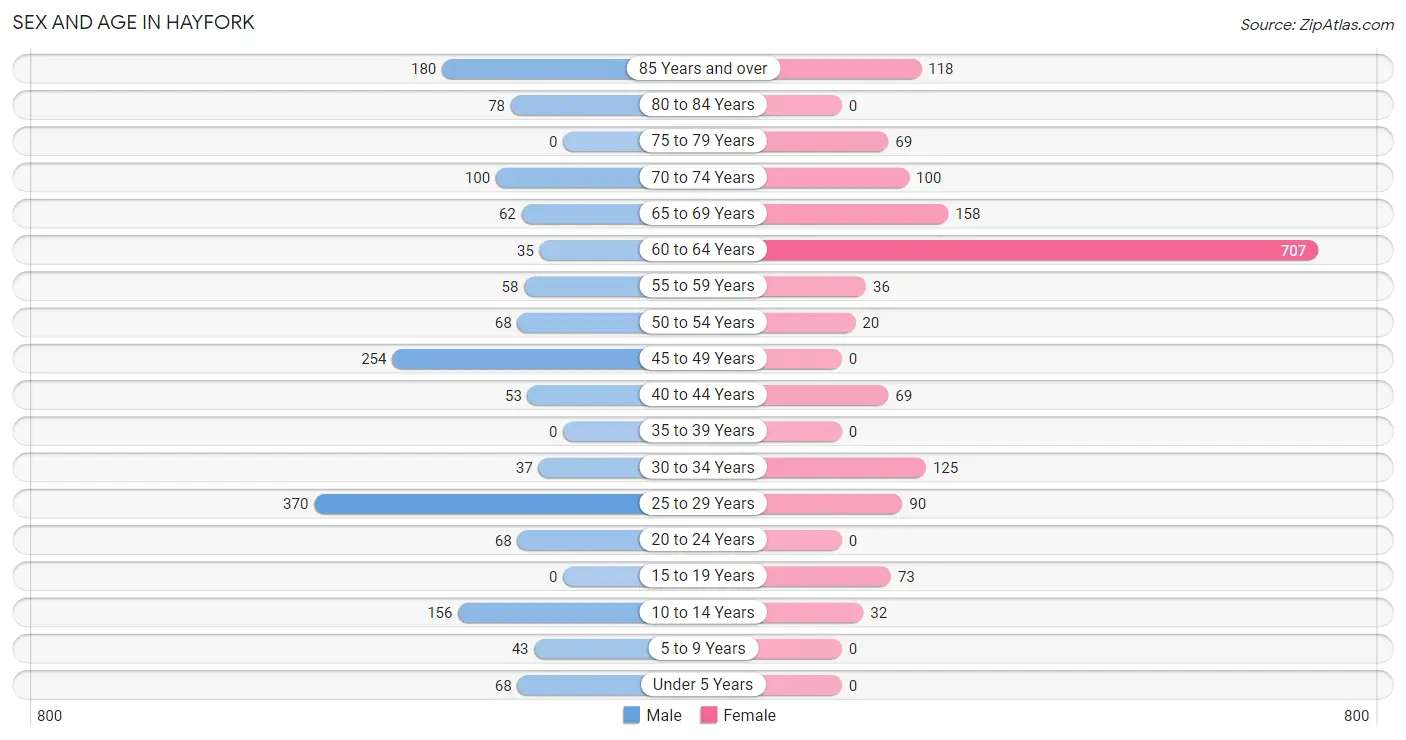
| Age Bracket | Male | Female |
| Under 5 Years | 68 (4.2%) | 0 (0.0%) |
| 5 to 9 Years | 43 (2.6%) | 0 (0.0%) |
| 10 to 14 Years | 156 (9.6%) | 32 (2.0%) |
| 15 to 19 Years | 0 (0.0%) | 73 (4.6%) |
| 20 to 24 Years | 68 (4.2%) | 0 (0.0%) |
| 25 to 29 Years | 370 (22.7%) | 90 (5.6%) |
| 30 to 34 Years | 37 (2.3%) | 125 (7.8%) |
| 35 to 39 Years | 0 (0.0%) | 0 (0.0%) |
| 40 to 44 Years | 53 (3.3%) | 69 (4.3%) |
| 45 to 49 Years | 254 (15.6%) | 0 (0.0%) |
| 50 to 54 Years | 68 (4.2%) | 20 (1.3%) |
| 55 to 59 Years | 58 (3.6%) | 36 (2.2%) |
| 60 to 64 Years | 35 (2.1%) | 707 (44.3%) |
| 65 to 69 Years | 62 (3.8%) | 158 (9.9%) |
| 70 to 74 Years | 100 (6.1%) | 100 (6.3%) |
| 75 to 79 Years | 0 (0.0%) | 69 (4.3%) |
| 80 to 84 Years | 78 (4.8%) | 0 (0.0%) |
| 85 Years and over | 180 (11.0%) | 118 (7.4%) |
| Total | 1,630 (100.0%) | 1,597 (100.0%) |
Families and Households in Hayfork
Median Family Size in Hayfork
The median family size in Hayfork is 3.91 persons per family, with single female/mother families (82 | 22.9%) accounting for the largest median family size of 6.07 persons per family. On the other hand, married-couple families (229 | 64.0%) represent the smallest median family size with 2.83 persons per family.
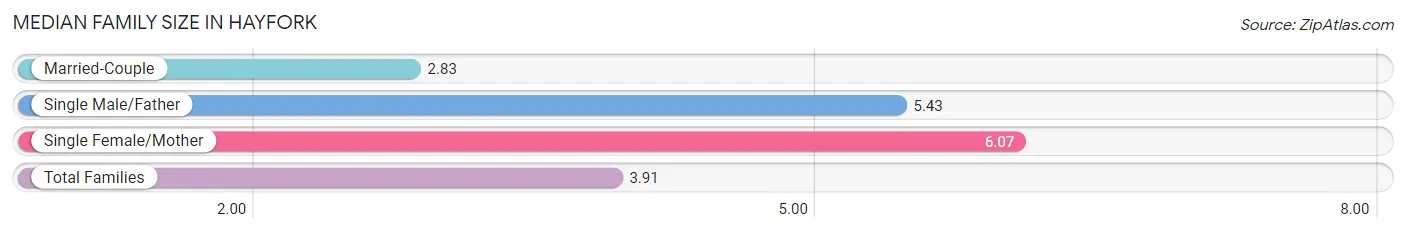
| Family Type | # Families | Family Size |
| Married-Couple | 229 (64.0%) | 2.83 |
| Single Male/Father | 47 (13.1%) | 5.43 |
| Single Female/Mother | 82 (22.9%) | 6.07 |
| Total Families | 358 (100.0%) | 3.91 |
Median Household Size in Hayfork
The median household size in Hayfork is 3.37 persons per household, with single female/mother households (82 | 8.7%) accounting for the largest median household size of 6.07 persons per household. married-couple households (229 | 24.2%) represent the smallest median household size with 2.83 persons per household.
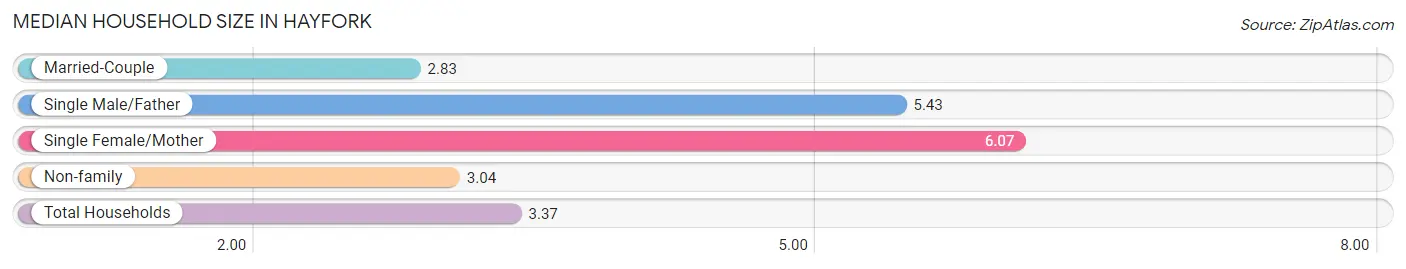
| Household Type | # Households | Household Size |
| Married-Couple | 229 (24.2%) | 2.83 |
| Single Male/Father | 47 (5.0%) | 5.43 |
| Single Female/Mother | 82 (8.7%) | 6.07 |
| Non-family | 589 (62.2%) | 3.04 |
| Total Households | 947 (100.0%) | 3.37 |
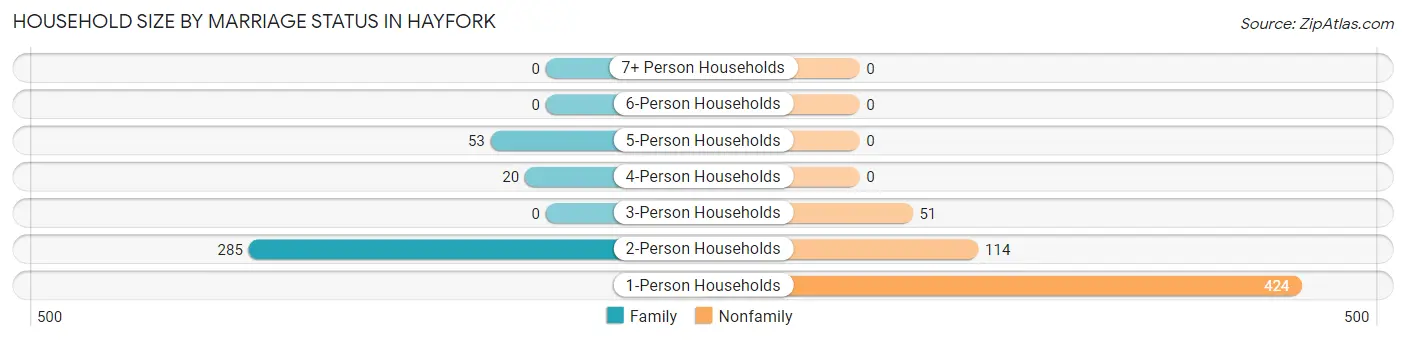
Household Size by Marriage Status in Hayfork
Out of a total of 947 households in Hayfork, 358 (37.8%) are family households, while 589 (62.2%) are nonfamily households. The most numerous type of family households are 2-person households, comprising 285, and the most common type of nonfamily households are 1-person households, comprising 424.
| Household Size | Family Households | Nonfamily Households |
| 1-Person Households | - | 424 (44.8%) |
| 2-Person Households | 285 (30.1%) | 114 (12.0%) |
| 3-Person Households | 0 (0.0%) | 51 (5.4%) |
| 4-Person Households | 20 (2.1%) | 0 (0.0%) |
| 5-Person Households | 53 (5.6%) | 0 (0.0%) |
| 6-Person Households | 0 (0.0%) | 0 (0.0%) |
| 7+ Person Households | 0 (0.0%) | 0 (0.0%) |
| Total | 358 (37.8%) | 589 (62.2%) |
Female Fertility in Hayfork
Fertility by Age in Hayfork
| Age Bracket | Women with Births | Births / 1,000 Women |
| 15 to 19 years | 0 (0.0%) | 0.0 |
| 20 to 34 years | 0 (0.0%) | 0.0 |
| 35 to 50 years | 0 (0.0%) | 0.0 |
| Total | 0 (0.0%) | 0.0 |
Fertility by Age by Marriage Status in Hayfork
| Age Bracket | Married | Unmarried |
| 15 to 19 years | 0 (0.0%) | 0 (0.0%) |
| 20 to 34 years | 0 (0.0%) | 0 (0.0%) |
| 35 to 50 years | 0 (0.0%) | 0 (0.0%) |
| Total | 0 (0.0%) | 0 (0.0%) |
Fertility by Education in Hayfork
| Educational Attainment | Women with Births | Births / 1,000 Women |
| Less than High School | 0 (0.0%) | 0.0 |
| High School Diploma | 0 (0.0%) | 0.0 |
| College or Associate's Degree | 0 (0.0%) | 0.0 |
| Bachelor's Degree | 0 (0.0%) | 0.0 |
| Graduate Degree | 0 (0.0%) | 0.0 |
| Total | 0 (0.0%) | 0.0 |
Fertility by Education by Marriage Status in Hayfork
| Educational Attainment | Married | Unmarried |
| Less than High School | 0 (0.0%) | 0 (0.0%) |
| High School Diploma | 0 (0.0%) | 0 (0.0%) |
| College or Associate's Degree | 0 (0.0%) | 0 (0.0%) |
| Bachelor's Degree | 0 (0.0%) | 0 (0.0%) |
| Graduate Degree | 0 (0.0%) | 0 (0.0%) |
| Total | 0 (0.0%) | 0 (0.0%) |
Employment Characteristics in Hayfork
Employment by Class of Employer in Hayfork
Among the 503 employed individuals in Hayfork, private company employees (208 | 41.3%), self-employed (not incorporated) (204 | 40.6%), and self-employed (incorporated) (46 | 9.1%) make up the most common classes of employment.
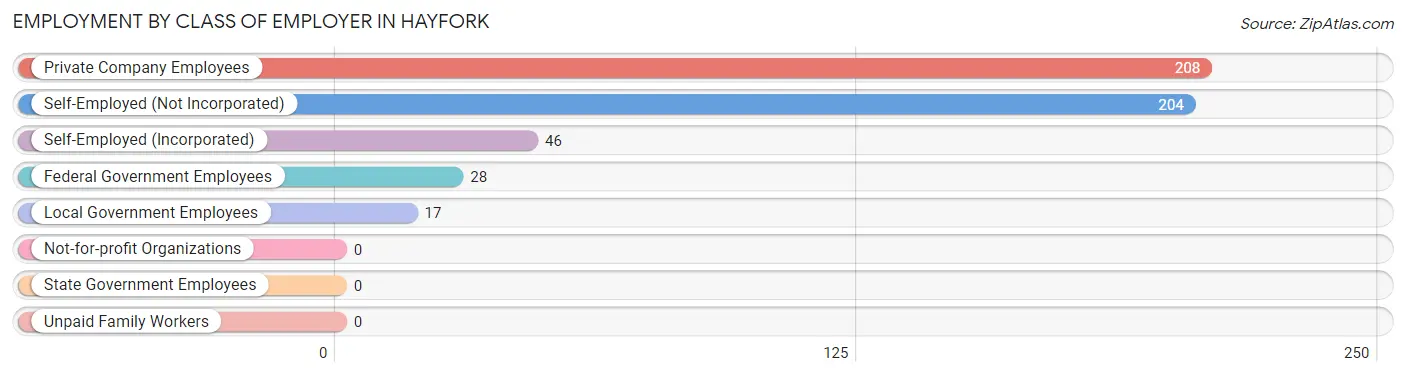
| Employer Class | # Employees | % Employees |
| Private Company Employees | 208 | 41.3% |
| Self-Employed (Incorporated) | 46 | 9.1% |
| Self-Employed (Not Incorporated) | 204 | 40.6% |
| Not-for-profit Organizations | 0 | 0.0% |
| Local Government Employees | 17 | 3.4% |
| State Government Employees | 0 | 0.0% |
| Federal Government Employees | 28 | 5.6% |
| Unpaid Family Workers | 0 | 0.0% |
| Total | 503 | 100.0% |
Employment Status by Age in Hayfork
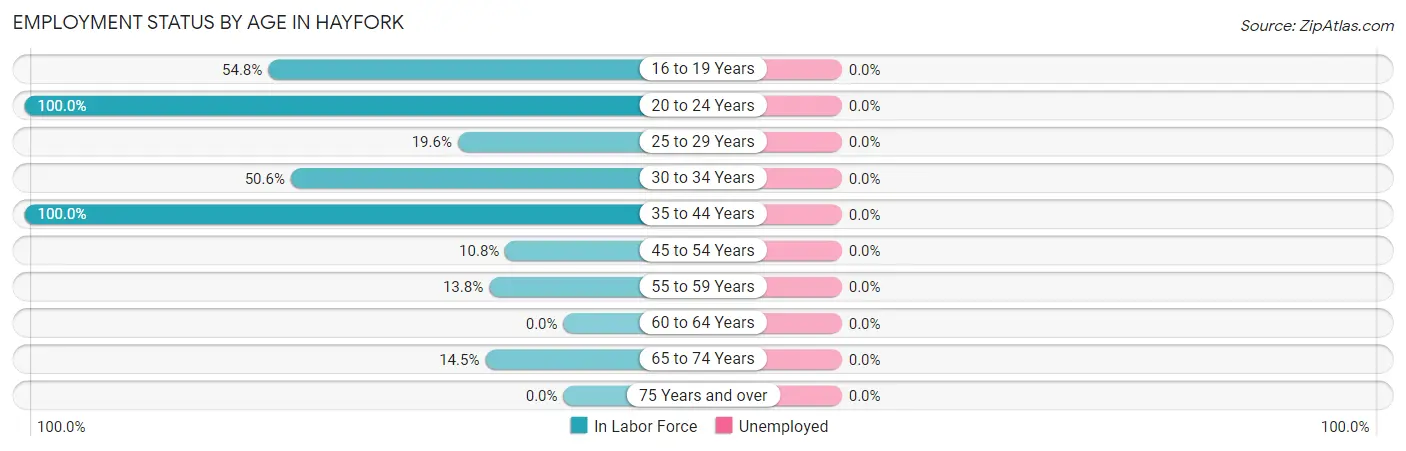
| Age Bracket | In Labor Force | Unemployed |
| 16 to 19 Years | 40 (54.8%) | 0 (0.0%) |
| 20 to 24 Years | 68 (100.0%) | 0 (0.0%) |
| 25 to 29 Years | 90 (19.6%) | 0 (0.0%) |
| 30 to 34 Years | 82 (50.6%) | 0 (0.0%) |
| 35 to 44 Years | 122 (100.0%) | 0 (0.0%) |
| 45 to 54 Years | 37 (10.8%) | 0 (0.0%) |
| 55 to 59 Years | 13 (13.8%) | 0 (0.0%) |
| 60 to 64 Years | 0 (0.0%) | 0 (0.0%) |
| 65 to 74 Years | 61 (14.5%) | 0 (0.0%) |
| 75 Years and over | 0 (0.0%) | 0 (0.0%) |
| Total | 512 (17.5%) | 0 (0.0%) |
Employment Status by Educational Attainment in Hayfork
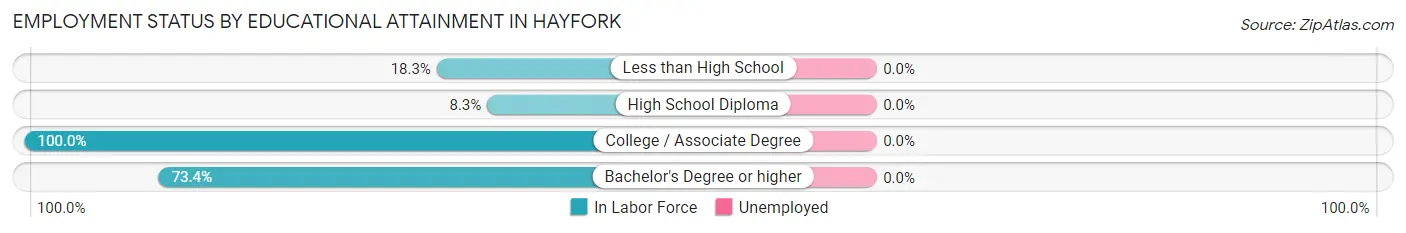
| Educational Attainment | In Labor Force | Unemployed |
| Less than High School | 13 (18.3%) | 0 (0.0%) |
| High School Diploma | 133 (8.3%) | 0 (0.0%) |
| College / Associate Degree | 71 (100.0%) | 0 (0.0%) |
| Bachelor's Degree or higher | 127 (73.4%) | 0 (0.0%) |
| Total | 344 (17.9%) | 0 (0.0%) |
Employment Occupations by Sex in Hayfork
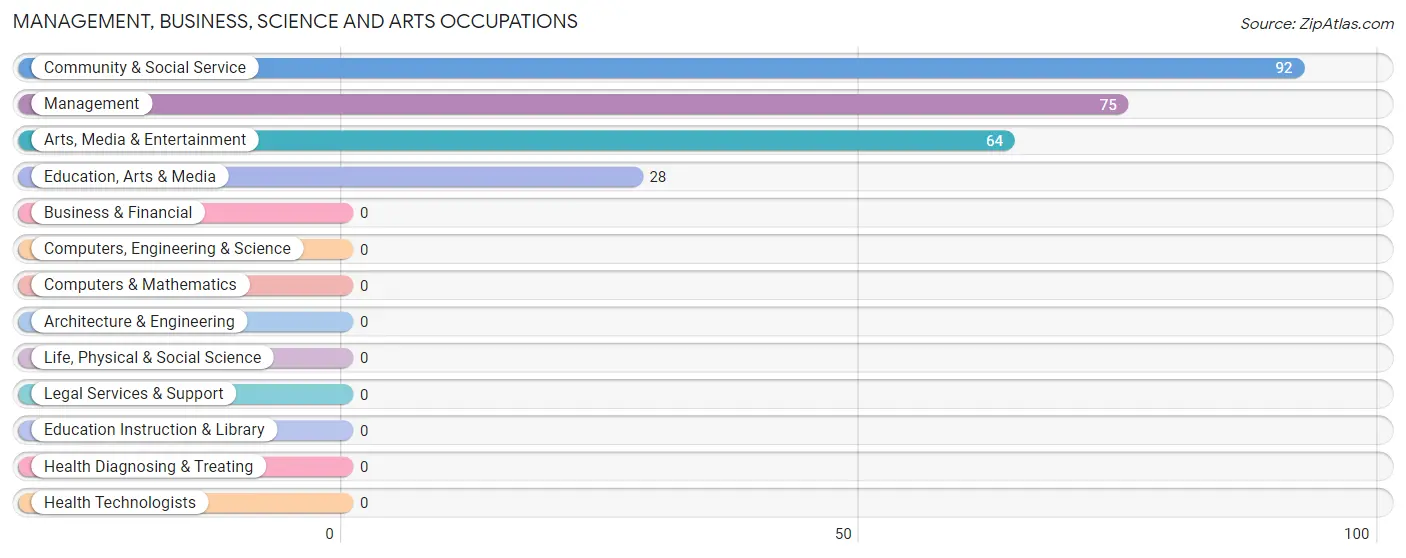
Management, Business, Science and Arts Occupations
The most common Management, Business, Science and Arts occupations in Hayfork are Community & Social Service (92 | 17.9%), Management (75 | 14.6%), Arts, Media & Entertainment (64 | 12.5%), and Education, Arts & Media (28 | 5.5%).
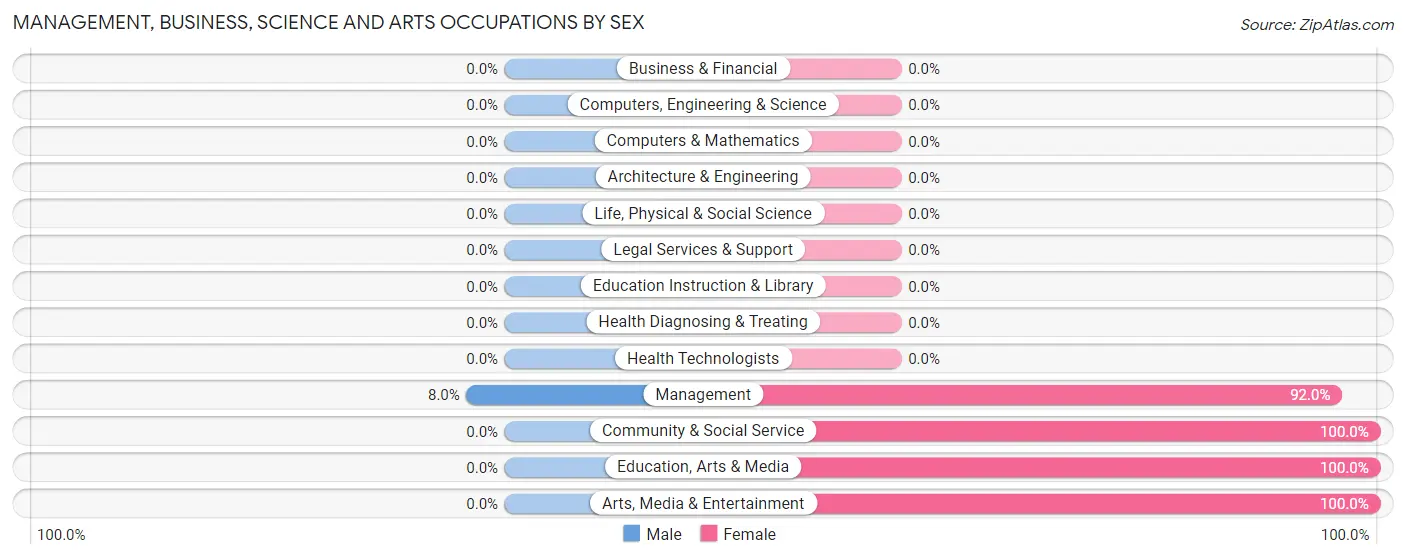
Management, Business, Science and Arts Occupations by Sex
| Occupation | Male | Female |
| Management | 6 (8.0%) | 69 (92.0%) |
| Business & Financial | 0 (0.0%) | 0 (0.0%) |
| Computers, Engineering & Science | 0 (0.0%) | 0 (0.0%) |
| Computers & Mathematics | 0 (0.0%) | 0 (0.0%) |
| Architecture & Engineering | 0 (0.0%) | 0 (0.0%) |
| Life, Physical & Social Science | 0 (0.0%) | 0 (0.0%) |
| Community & Social Service | 0 (0.0%) | 92 (100.0%) |
| Education, Arts & Media | 0 (0.0%) | 28 (100.0%) |
| Legal Services & Support | 0 (0.0%) | 0 (0.0%) |
| Education Instruction & Library | 0 (0.0%) | 0 (0.0%) |
| Arts, Media & Entertainment | 0 (0.0%) | 64 (100.0%) |
| Health Diagnosing & Treating | 0 (0.0%) | 0 (0.0%) |
| Health Technologists | 0 (0.0%) | 0 (0.0%) |
| Total (Category) | 6 (3.6%) | 161 (96.4%) |
| Total (Overall) | 156 (30.4%) | 357 (69.6%) |
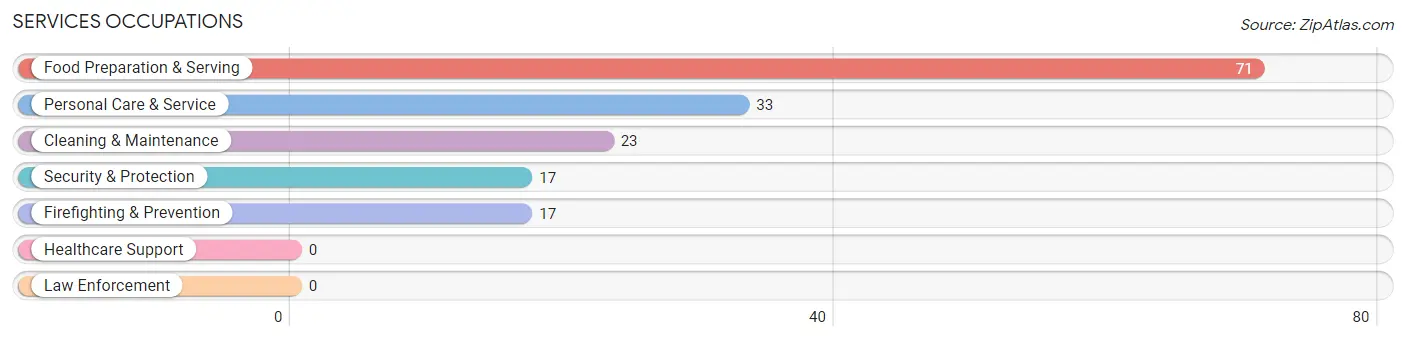
Services Occupations
The most common Services occupations in Hayfork are Food Preparation & Serving (71 | 13.8%), Personal Care & Service (33 | 6.4%), Cleaning & Maintenance (23 | 4.5%), Security & Protection (17 | 3.3%), and Firefighting & Prevention (17 | 3.3%).
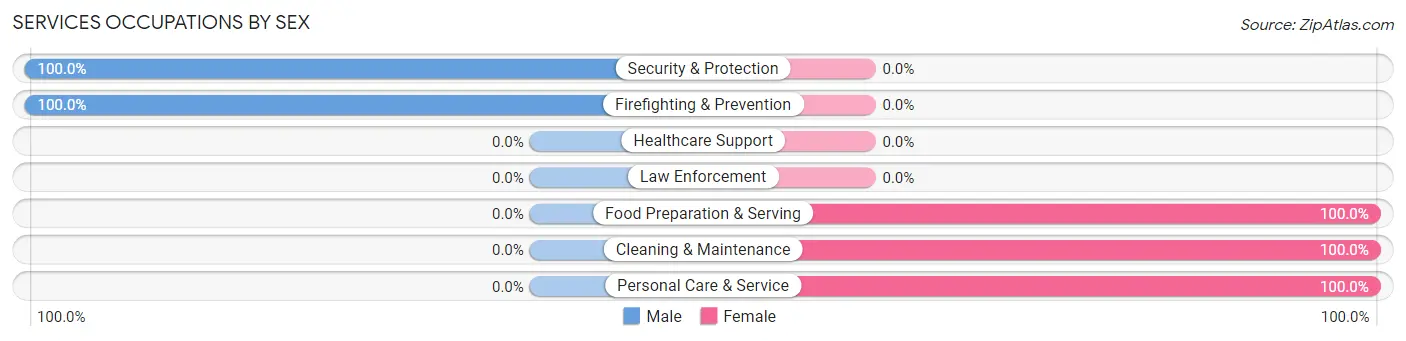
Services Occupations by Sex
Within the Services occupations in Hayfork, the most male-oriented occupations are Security & Protection (100.0%), and Firefighting & Prevention (100.0%), while the most female-oriented occupations are Food Preparation & Serving (100.0%), Cleaning & Maintenance (100.0%), and Personal Care & Service (100.0%).
| Occupation | Male | Female |
| Healthcare Support | 0 (0.0%) | 0 (0.0%) |
| Security & Protection | 17 (100.0%) | 0 (0.0%) |
| Firefighting & Prevention | 17 (100.0%) | 0 (0.0%) |
| Law Enforcement | 0 (0.0%) | 0 (0.0%) |
| Food Preparation & Serving | 0 (0.0%) | 71 (100.0%) |
| Cleaning & Maintenance | 0 (0.0%) | 23 (100.0%) |
| Personal Care & Service | 0 (0.0%) | 33 (100.0%) |
| Total (Category) | 17 (11.8%) | 127 (88.2%) |
| Total (Overall) | 156 (30.4%) | 357 (69.6%) |
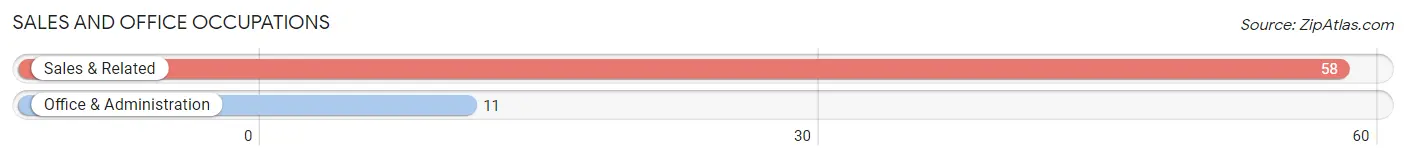
Sales and Office Occupations
The most common Sales and Office occupations in Hayfork are Sales & Related (58 | 11.3%), and Office & Administration (11 | 2.1%).
Sales and Office Occupations by Sex
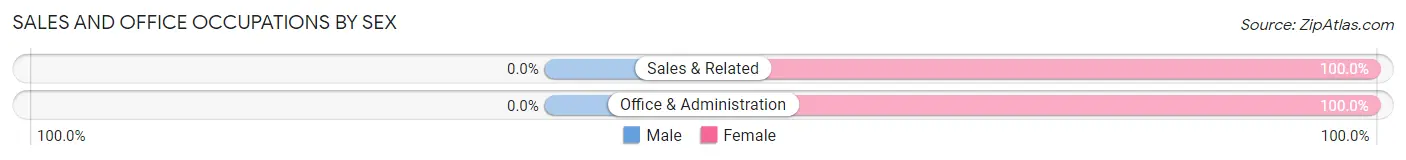
| Occupation | Male | Female |
| Sales & Related | 0 (0.0%) | 58 (100.0%) |
| Office & Administration | 0 (0.0%) | 11 (100.0%) |
| Total (Category) | 0 (0.0%) | 69 (100.0%) |
| Total (Overall) | 156 (30.4%) | 357 (69.6%) |
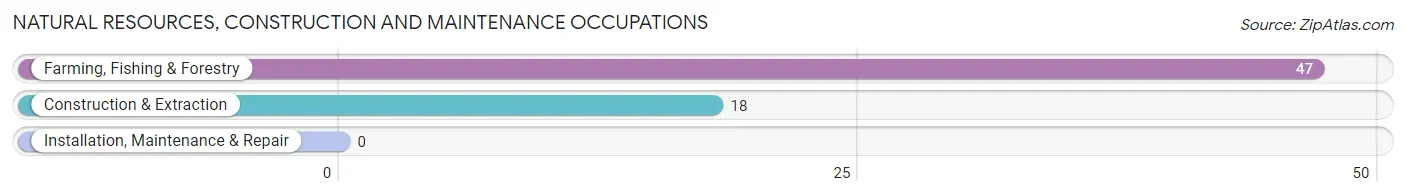
Natural Resources, Construction and Maintenance Occupations
The most common Natural Resources, Construction and Maintenance occupations in Hayfork are Farming, Fishing & Forestry (47 | 9.2%), and Construction & Extraction (18 | 3.5%).
Natural Resources, Construction and Maintenance Occupations by Sex
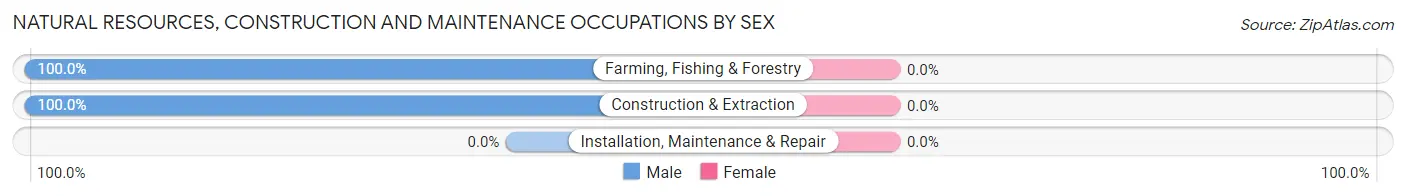
| Occupation | Male | Female |
| Farming, Fishing & Forestry | 47 (100.0%) | 0 (0.0%) |
| Construction & Extraction | 18 (100.0%) | 0 (0.0%) |
| Installation, Maintenance & Repair | 0 (0.0%) | 0 (0.0%) |
| Total (Category) | 65 (100.0%) | 0 (0.0%) |
| Total (Overall) | 156 (30.4%) | 357 (69.6%) |
Production, Transportation and Moving Occupations
The most common Production, Transportation and Moving occupations in Hayfork are , and Material Moving (68 | 13.3%).
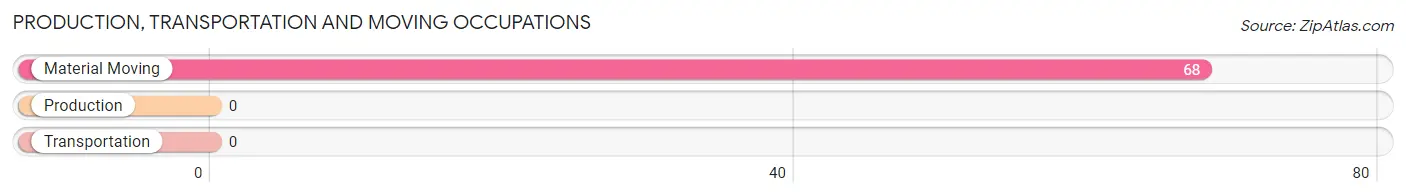
Production, Transportation and Moving Occupations by Sex
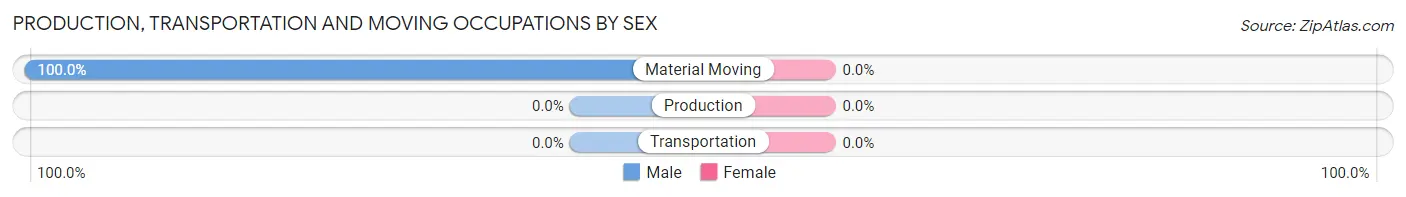
| Occupation | Male | Female |
| Production | 0 (0.0%) | 0 (0.0%) |
| Transportation | 0 (0.0%) | 0 (0.0%) |
| Material Moving | 68 (100.0%) | 0 (0.0%) |
| Total (Category) | 68 (100.0%) | 0 (0.0%) |
| Total (Overall) | 156 (30.4%) | 357 (69.6%) |
Employment Industries by Sex in Hayfork
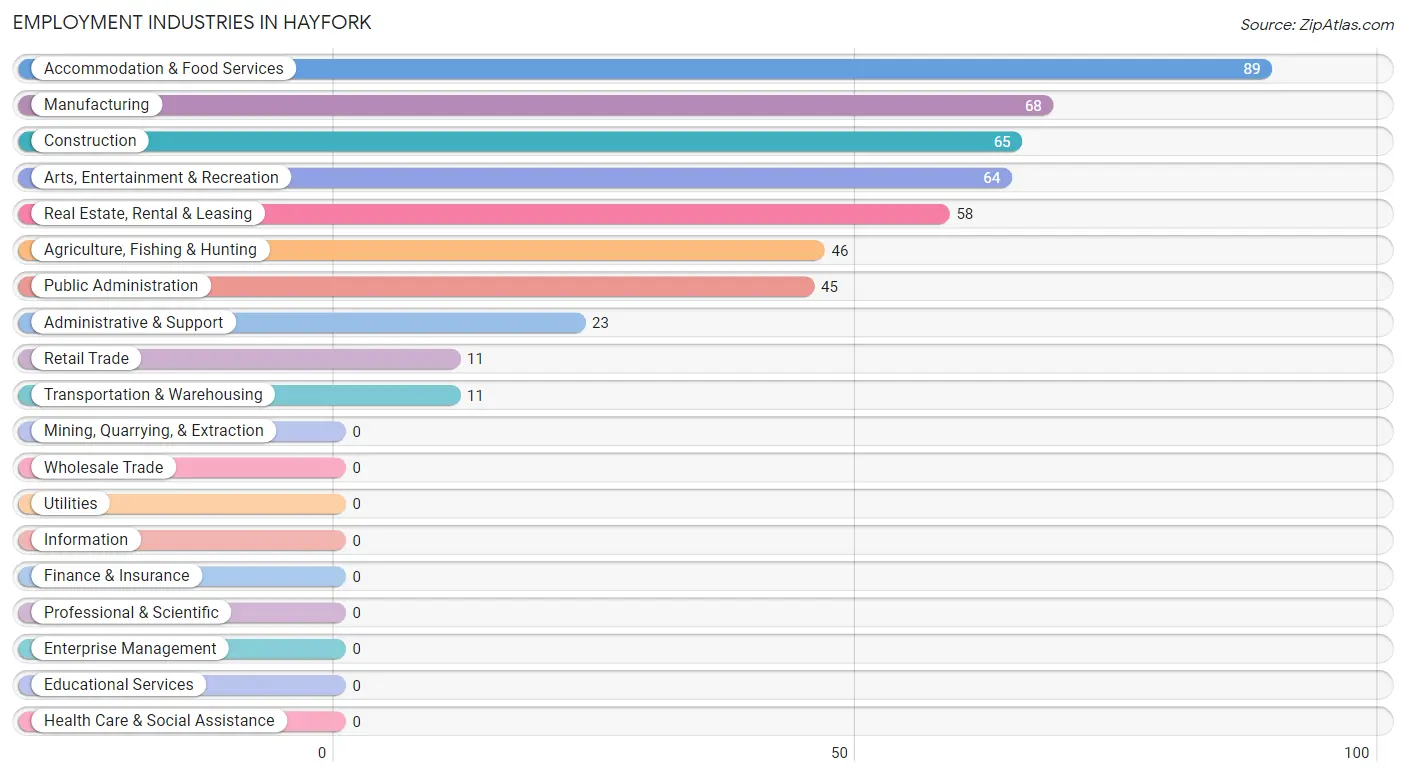
Employment Industries in Hayfork
The major employment industries in Hayfork include Accommodation & Food Services (89 | 17.3%), Manufacturing (68 | 13.3%), Construction (65 | 12.7%), Arts, Entertainment & Recreation (64 | 12.5%), and Real Estate, Rental & Leasing (58 | 11.3%).
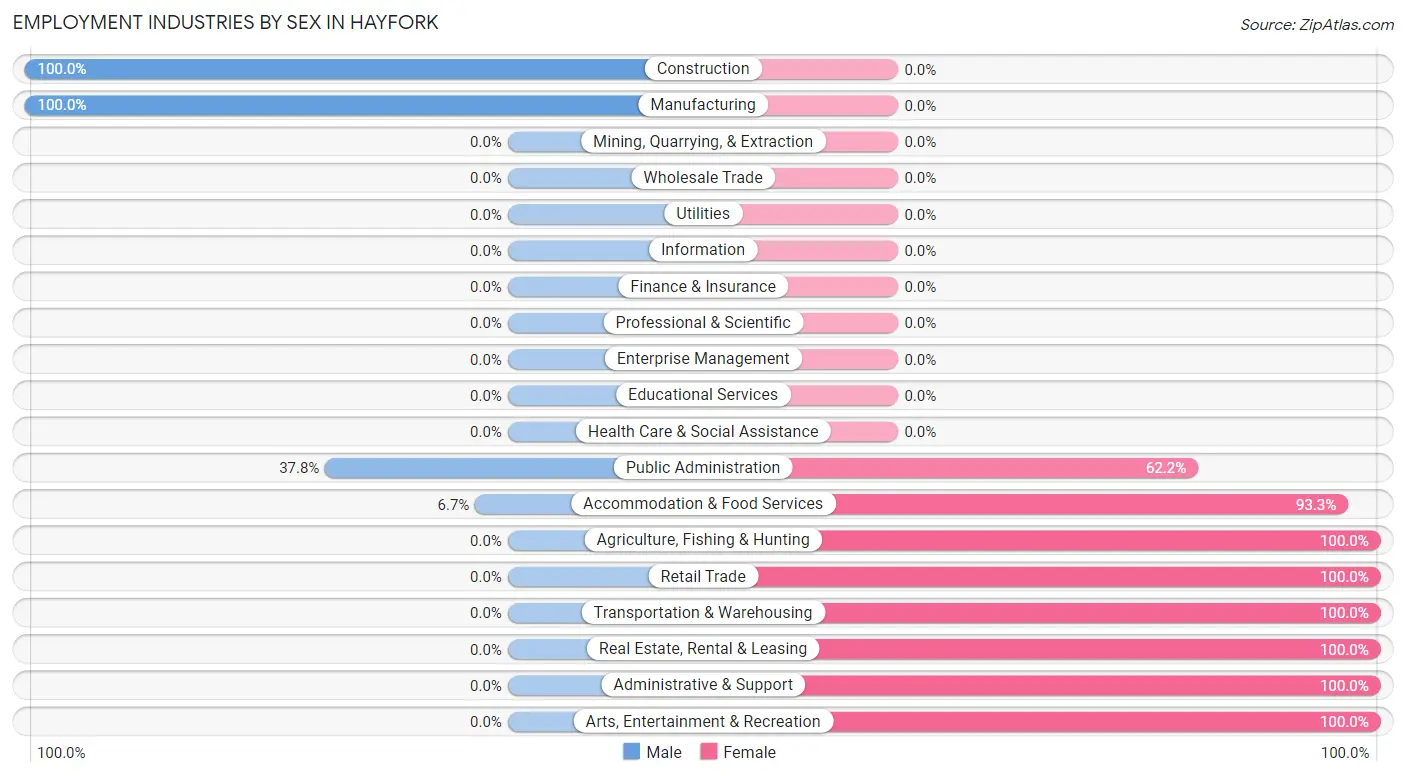
Employment Industries by Sex in Hayfork
The Hayfork industries that see more men than women are Construction (100.0%), Manufacturing (100.0%), and Public Administration (37.8%), whereas the industries that tend to have a higher number of women are Agriculture, Fishing & Hunting (100.0%), Retail Trade (100.0%), and Transportation & Warehousing (100.0%).
| Industry | Male | Female |
| Agriculture, Fishing & Hunting | 0 (0.0%) | 46 (100.0%) |
| Mining, Quarrying, & Extraction | 0 (0.0%) | 0 (0.0%) |
| Construction | 65 (100.0%) | 0 (0.0%) |
| Manufacturing | 68 (100.0%) | 0 (0.0%) |
| Wholesale Trade | 0 (0.0%) | 0 (0.0%) |
| Retail Trade | 0 (0.0%) | 11 (100.0%) |
| Transportation & Warehousing | 0 (0.0%) | 11 (100.0%) |
| Utilities | 0 (0.0%) | 0 (0.0%) |
| Information | 0 (0.0%) | 0 (0.0%) |
| Finance & Insurance | 0 (0.0%) | 0 (0.0%) |
| Real Estate, Rental & Leasing | 0 (0.0%) | 58 (100.0%) |
| Professional & Scientific | 0 (0.0%) | 0 (0.0%) |
| Enterprise Management | 0 (0.0%) | 0 (0.0%) |
| Administrative & Support | 0 (0.0%) | 23 (100.0%) |
| Educational Services | 0 (0.0%) | 0 (0.0%) |
| Health Care & Social Assistance | 0 (0.0%) | 0 (0.0%) |
| Arts, Entertainment & Recreation | 0 (0.0%) | 64 (100.0%) |
| Accommodation & Food Services | 6 (6.7%) | 83 (93.3%) |
| Public Administration | 17 (37.8%) | 28 (62.2%) |
| Total | 156 (30.4%) | 357 (69.6%) |
Education in Hayfork
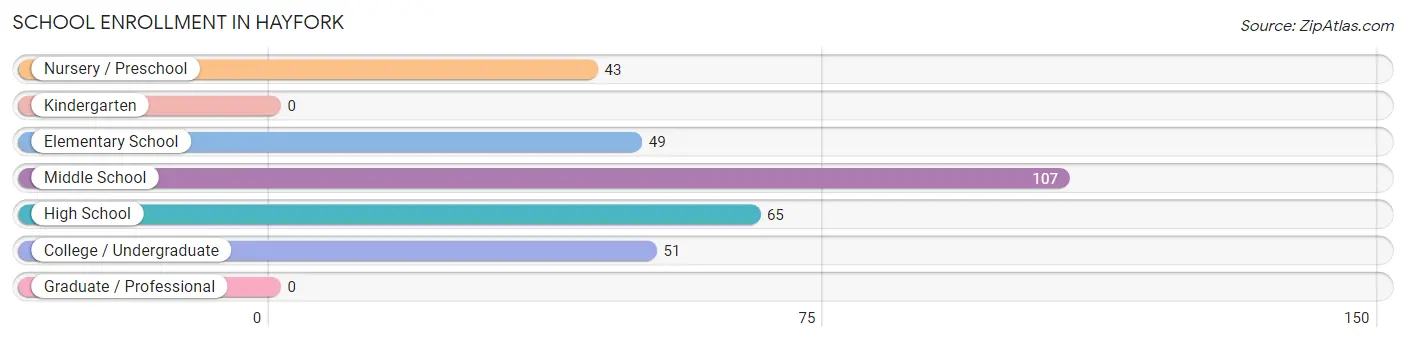
School Enrollment in Hayfork
The most common levels of schooling among the 315 students in Hayfork are middle school (107 | 34.0%), high school (65 | 20.6%), and college / undergraduate (51 | 16.2%).
| School Level | # Students | % Students |
| Nursery / Preschool | 43 | 13.7% |
| Kindergarten | 0 | 0.0% |
| Elementary School | 49 | 15.6% |
| Middle School | 107 | 34.0% |
| High School | 65 | 20.6% |
| College / Undergraduate | 51 | 16.2% |
| Graduate / Professional | 0 | 0.0% |
| Total | 315 | 100.0% |
School Enrollment by Age by Funding Source in Hayfork
Out of a total of 315 students who are enrolled in schools in Hayfork, 11 (3.5%) attend a private institution, while the remaining 304 (96.5%) are enrolled in public schools. The age group of 25 to 34 year olds has the highest likelihood of being enrolled in private schools, with 11 (100.0% in the age bracket) enrolled. Conversely, the age group of 5 to 9 year old has the lowest likelihood of being enrolled in a private school, with 43 (100.0% in the age bracket) attending a public institution.
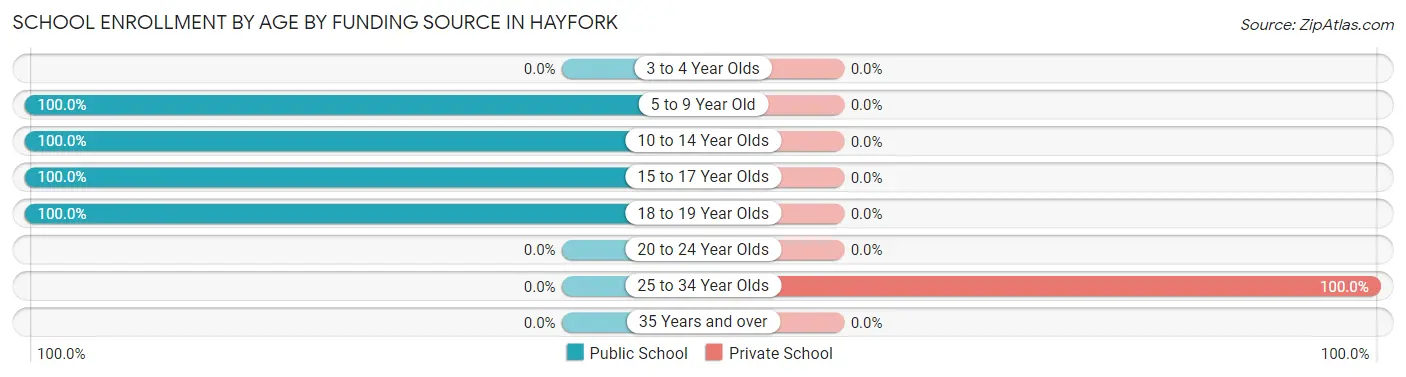
| Age Bracket | Public School | Private School |
| 3 to 4 Year Olds | 0 (0.0%) | 0 (0.0%) |
| 5 to 9 Year Old | 43 (100.0%) | 0 (0.0%) |
| 10 to 14 Year Olds | 188 (100.0%) | 0 (0.0%) |
| 15 to 17 Year Olds | 33 (100.0%) | 0 (0.0%) |
| 18 to 19 Year Olds | 40 (100.0%) | 0 (0.0%) |
| 20 to 24 Year Olds | 0 (0.0%) | 0 (0.0%) |
| 25 to 34 Year Olds | 0 (0.0%) | 11 (100.0%) |
| 35 Years and over | 0 (0.0%) | 0 (0.0%) |
| Total | 304 (96.5%) | 11 (3.5%) |
Educational Attainment by Field of Study in Hayfork
Science & technology (64 | 20.2%), liberal arts & history (63 | 19.9%), psychology (48 | 15.1%), education (48 | 15.1%), and arts & humanities (46 | 14.5%) are the most common fields of study among 317 individuals in Hayfork who have obtained a bachelor's degree or higher.
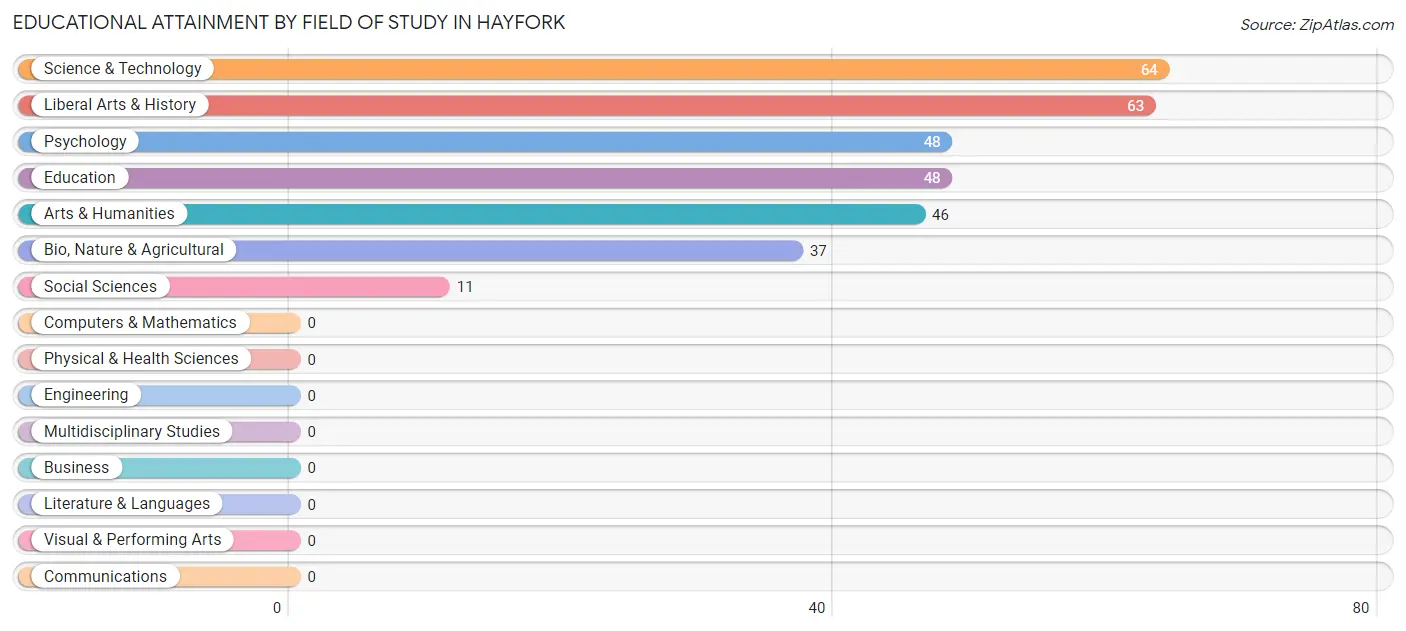
| Field of Study | # Graduates | % Graduates |
| Computers & Mathematics | 0 | 0.0% |
| Bio, Nature & Agricultural | 37 | 11.7% |
| Physical & Health Sciences | 0 | 0.0% |
| Psychology | 48 | 15.1% |
| Social Sciences | 11 | 3.5% |
| Engineering | 0 | 0.0% |
| Multidisciplinary Studies | 0 | 0.0% |
| Science & Technology | 64 | 20.2% |
| Business | 0 | 0.0% |
| Education | 48 | 15.1% |
| Literature & Languages | 0 | 0.0% |
| Liberal Arts & History | 63 | 19.9% |
| Visual & Performing Arts | 0 | 0.0% |
| Communications | 0 | 0.0% |
| Arts & Humanities | 46 | 14.5% |
| Total | 317 | 100.0% |
Transportation & Commute in Hayfork
Vehicle Availability by Sex in Hayfork
The most prevalent vehicle ownership categories in Hayfork are males with 1 vehicle (133, accounting for 85.3%) and females with 1 vehicle (39, making up 38.3%).
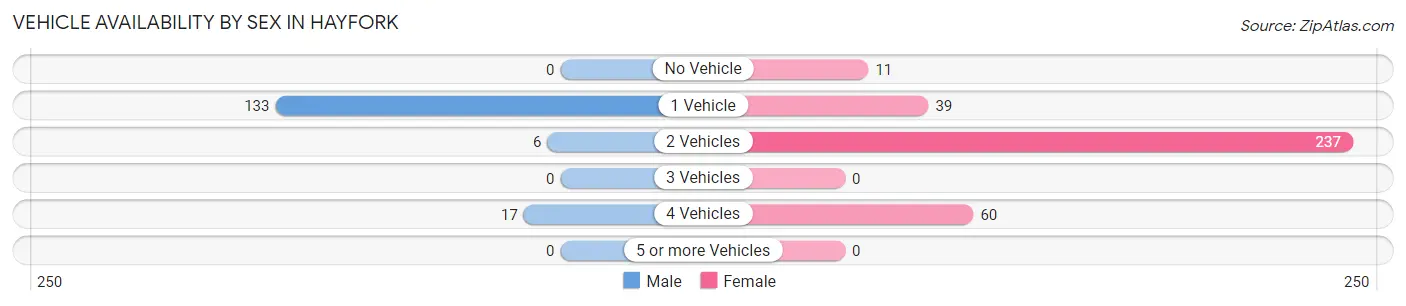
| Vehicles Available | Male | Female |
| No Vehicle | 0 (0.0%) | 11 (3.2%) |
| 1 Vehicle | 133 (85.3%) | 39 (11.2%) |
| 2 Vehicles | 6 (3.8%) | 237 (68.3%) |
| 3 Vehicles | 0 (0.0%) | 0 (0.0%) |
| 4 Vehicles | 17 (10.9%) | 60 (17.3%) |
| 5 or more Vehicles | 0 (0.0%) | 0 (0.0%) |
| Total | 156 (100.0%) | 347 (100.0%) |
Commute Time in Hayfork
The most frequently occuring commute durations in Hayfork are 5 to 9 minutes (123 commuters, 36.2%), 40 to 44 minutes (79 commuters, 23.2%), and 90 or more minutes (47 commuters, 13.8%).
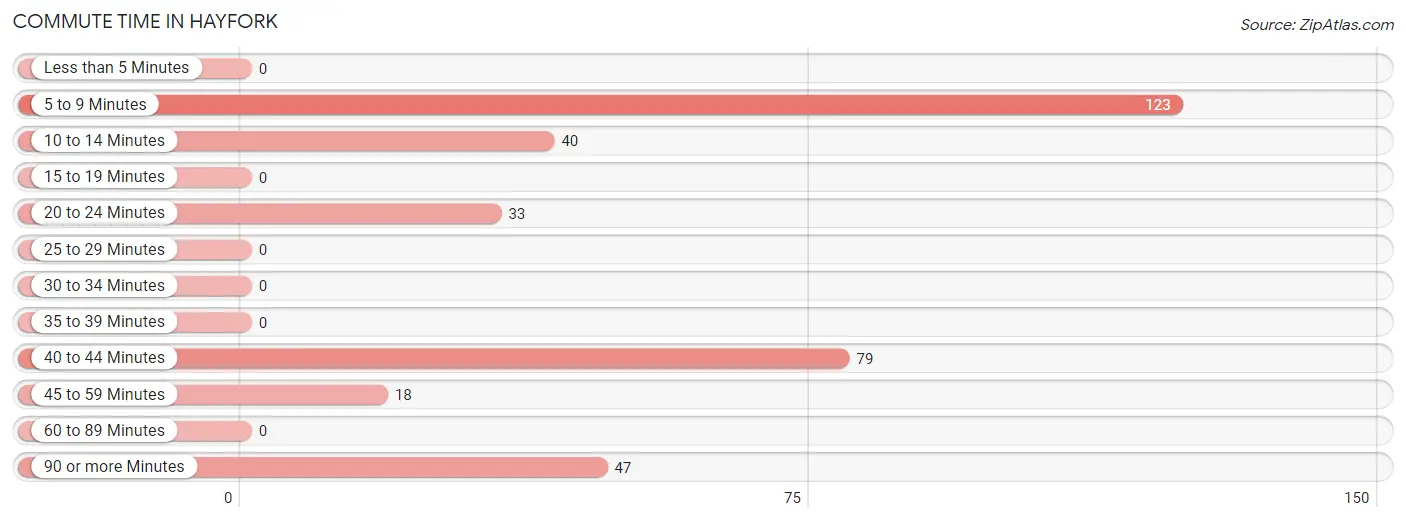
| Commute Time | # Commuters | % Commuters |
| Less than 5 Minutes | 0 | 0.0% |
| 5 to 9 Minutes | 123 | 36.2% |
| 10 to 14 Minutes | 40 | 11.8% |
| 15 to 19 Minutes | 0 | 0.0% |
| 20 to 24 Minutes | 33 | 9.7% |
| 25 to 29 Minutes | 0 | 0.0% |
| 30 to 34 Minutes | 0 | 0.0% |
| 35 to 39 Minutes | 0 | 0.0% |
| 40 to 44 Minutes | 79 | 23.2% |
| 45 to 59 Minutes | 18 | 5.3% |
| 60 to 89 Minutes | 0 | 0.0% |
| 90 or more Minutes | 47 | 13.8% |
Commute Time by Sex in Hayfork
The most common commute times in Hayfork are 40 to 44 minutes (68 commuters, 43.6%) for males and 5 to 9 minutes (106 commuters, 57.6%) for females.
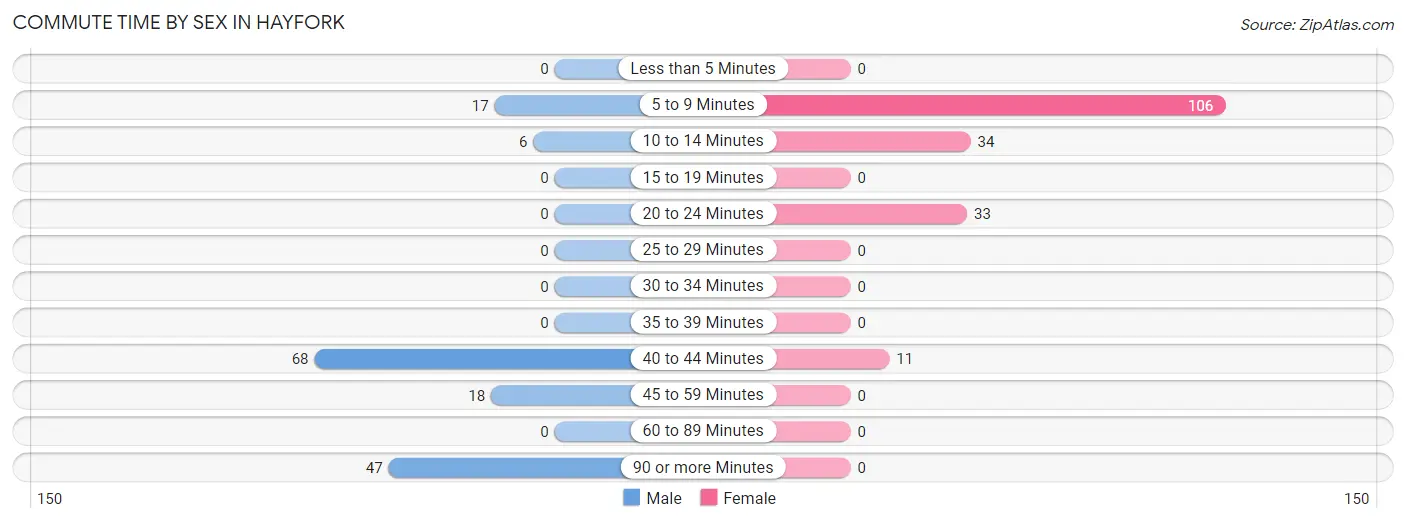
| Commute Time | Male | Female |
| Less than 5 Minutes | 0 (0.0%) | 0 (0.0%) |
| 5 to 9 Minutes | 17 (10.9%) | 106 (57.6%) |
| 10 to 14 Minutes | 6 (3.8%) | 34 (18.5%) |
| 15 to 19 Minutes | 0 (0.0%) | 0 (0.0%) |
| 20 to 24 Minutes | 0 (0.0%) | 33 (17.9%) |
| 25 to 29 Minutes | 0 (0.0%) | 0 (0.0%) |
| 30 to 34 Minutes | 0 (0.0%) | 0 (0.0%) |
| 35 to 39 Minutes | 0 (0.0%) | 0 (0.0%) |
| 40 to 44 Minutes | 68 (43.6%) | 11 (6.0%) |
| 45 to 59 Minutes | 18 (11.5%) | 0 (0.0%) |
| 60 to 89 Minutes | 0 (0.0%) | 0 (0.0%) |
| 90 or more Minutes | 47 (30.1%) | 0 (0.0%) |
Time of Departure to Work by Sex in Hayfork
The most frequent times of departure to work in Hayfork are 12:00 AM to 4:59 AM (115, 73.7%) for males and 6:00 AM to 6:29 AM (71, 38.6%) for females.
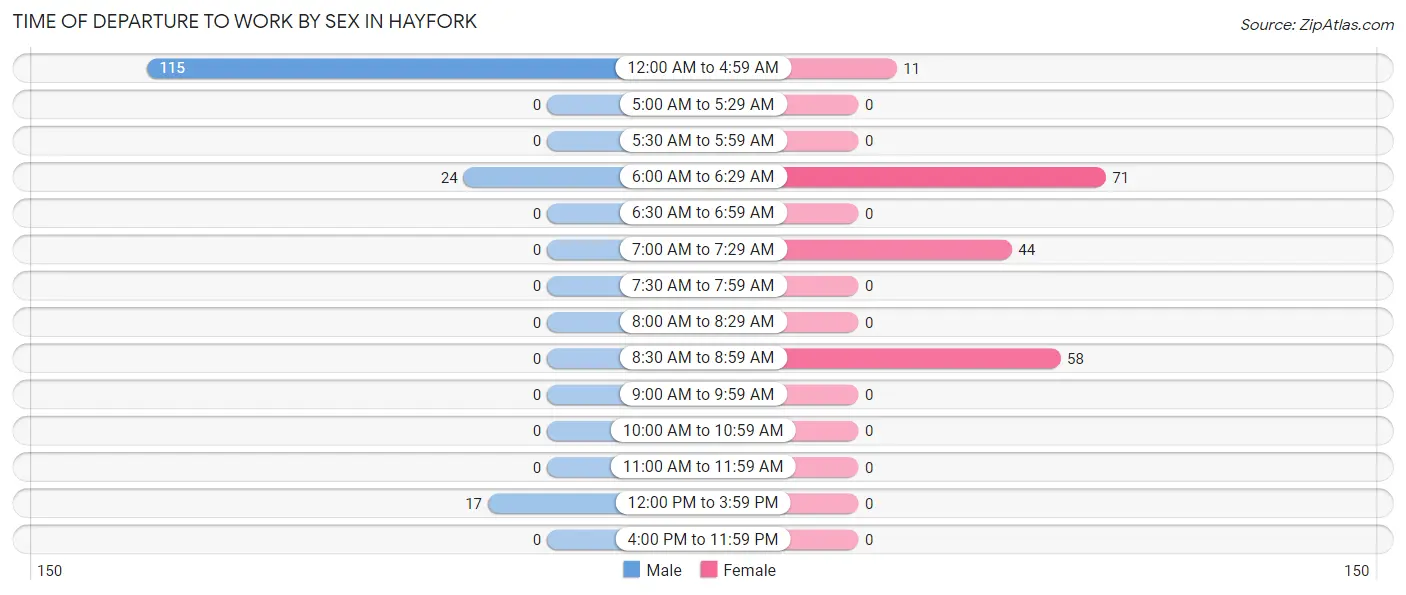
| Time of Departure | Male | Female |
| 12:00 AM to 4:59 AM | 115 (73.7%) | 11 (6.0%) |
| 5:00 AM to 5:29 AM | 0 (0.0%) | 0 (0.0%) |
| 5:30 AM to 5:59 AM | 0 (0.0%) | 0 (0.0%) |
| 6:00 AM to 6:29 AM | 24 (15.4%) | 71 (38.6%) |
| 6:30 AM to 6:59 AM | 0 (0.0%) | 0 (0.0%) |
| 7:00 AM to 7:29 AM | 0 (0.0%) | 44 (23.9%) |
| 7:30 AM to 7:59 AM | 0 (0.0%) | 0 (0.0%) |
| 8:00 AM to 8:29 AM | 0 (0.0%) | 0 (0.0%) |
| 8:30 AM to 8:59 AM | 0 (0.0%) | 58 (31.5%) |
| 9:00 AM to 9:59 AM | 0 (0.0%) | 0 (0.0%) |
| 10:00 AM to 10:59 AM | 0 (0.0%) | 0 (0.0%) |
| 11:00 AM to 11:59 AM | 0 (0.0%) | 0 (0.0%) |
| 12:00 PM to 3:59 PM | 17 (10.9%) | 0 (0.0%) |
| 4:00 PM to 11:59 PM | 0 (0.0%) | 0 (0.0%) |
| Total | 156 (100.0%) | 184 (100.0%) |
Housing Occupancy in Hayfork
Occupancy by Ownership in Hayfork
Of the total 947 dwellings in Hayfork, owner-occupied units account for 555 (58.6%), while renter-occupied units make up 392 (41.4%).
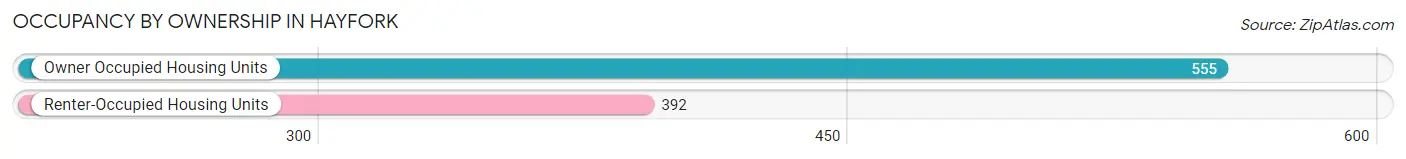
| Occupancy | # Housing Units | % Housing Units |
| Owner Occupied Housing Units | 555 | 58.6% |
| Renter-Occupied Housing Units | 392 | 41.4% |
| Total Occupied Housing Units | 947 | 100.0% |
Occupancy by Household Size in Hayfork
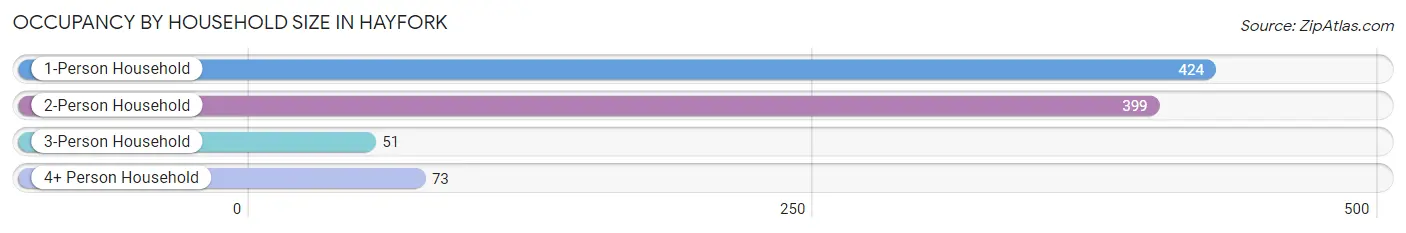
| Household Size | # Housing Units | % Housing Units |
| 1-Person Household | 424 | 44.8% |
| 2-Person Household | 399 | 42.1% |
| 3-Person Household | 51 | 5.4% |
| 4+ Person Household | 73 | 7.7% |
| Total Housing Units | 947 | 100.0% |
Occupancy by Ownership by Household Size in Hayfork
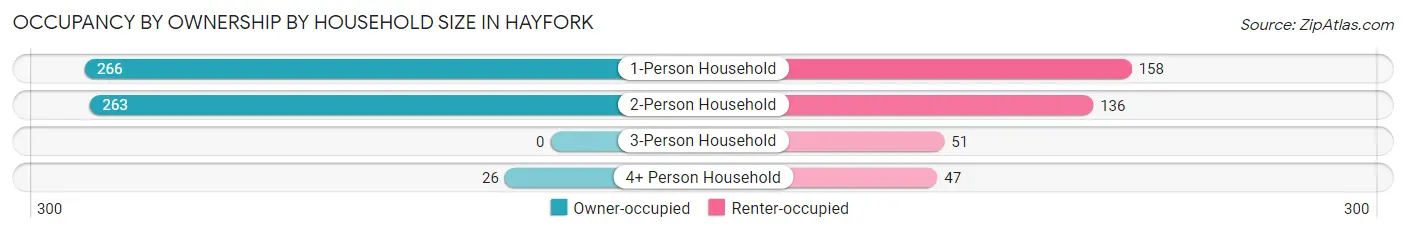
| Household Size | Owner-occupied | Renter-occupied |
| 1-Person Household | 266 (62.7%) | 158 (37.3%) |
| 2-Person Household | 263 (65.9%) | 136 (34.1%) |
| 3-Person Household | 0 (0.0%) | 51 (100.0%) |
| 4+ Person Household | 26 (35.6%) | 47 (64.4%) |
| Total Housing Units | 555 (58.6%) | 392 (41.4%) |
Occupancy by Educational Attainment in Hayfork
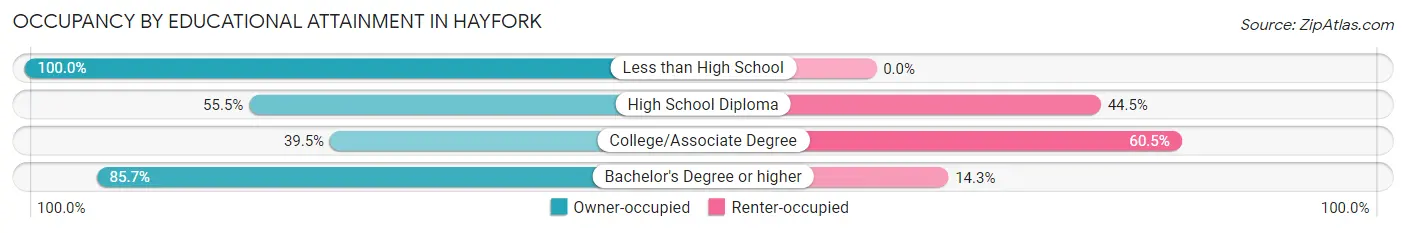
| Household Size | Owner-occupied | Renter-occupied |
| Less than High School | 13 (100.0%) | 0 (0.0%) |
| High School Diploma | 253 (55.5%) | 203 (44.5%) |
| College/Associate Degree | 103 (39.5%) | 158 (60.5%) |
| Bachelor's Degree or higher | 186 (85.7%) | 31 (14.3%) |
Occupancy by Age of Householder in Hayfork
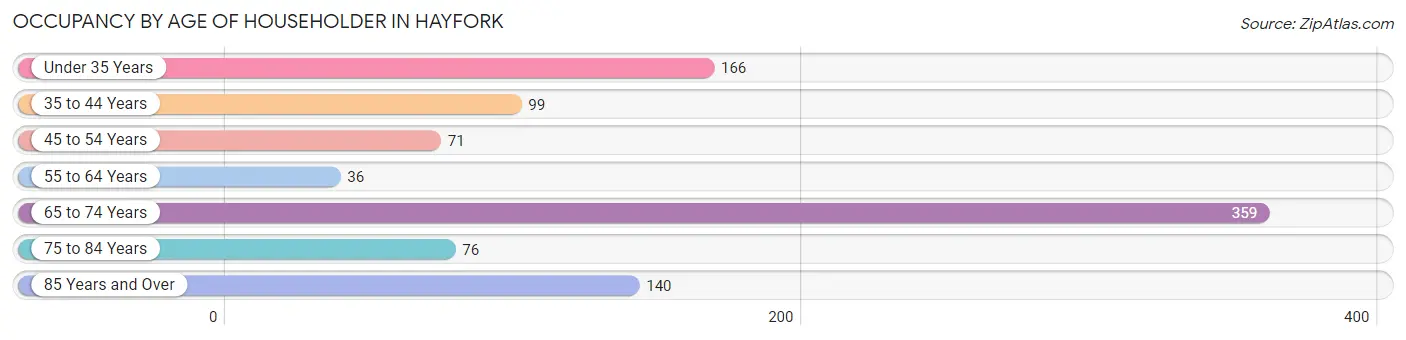
| Age Bracket | # Households | % Households |
| Under 35 Years | 166 | 17.5% |
| 35 to 44 Years | 99 | 10.4% |
| 45 to 54 Years | 71 | 7.5% |
| 55 to 64 Years | 36 | 3.8% |
| 65 to 74 Years | 359 | 37.9% |
| 75 to 84 Years | 76 | 8.0% |
| 85 Years and Over | 140 | 14.8% |
| Total | 947 | 100.0% |
Housing Finances in Hayfork
Median Income by Occupancy in Hayfork
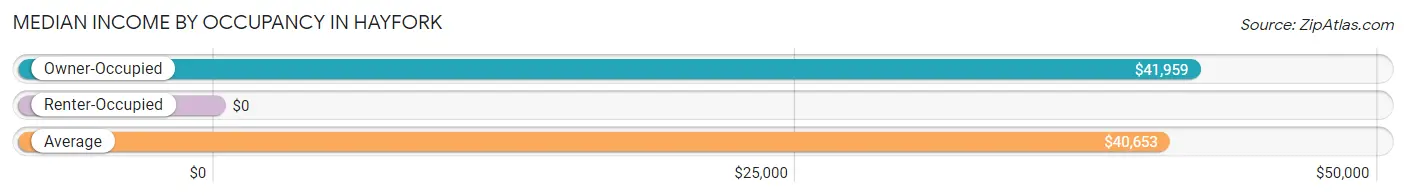
| Occupancy Type | # Households | Median Income |
| Owner-Occupied | 555 (58.6%) | $41,959 |
| Renter-Occupied | 392 (41.4%) | $0 |
| Average | 947 (100.0%) | $40,653 |
Occupancy by Householder Income Bracket in Hayfork
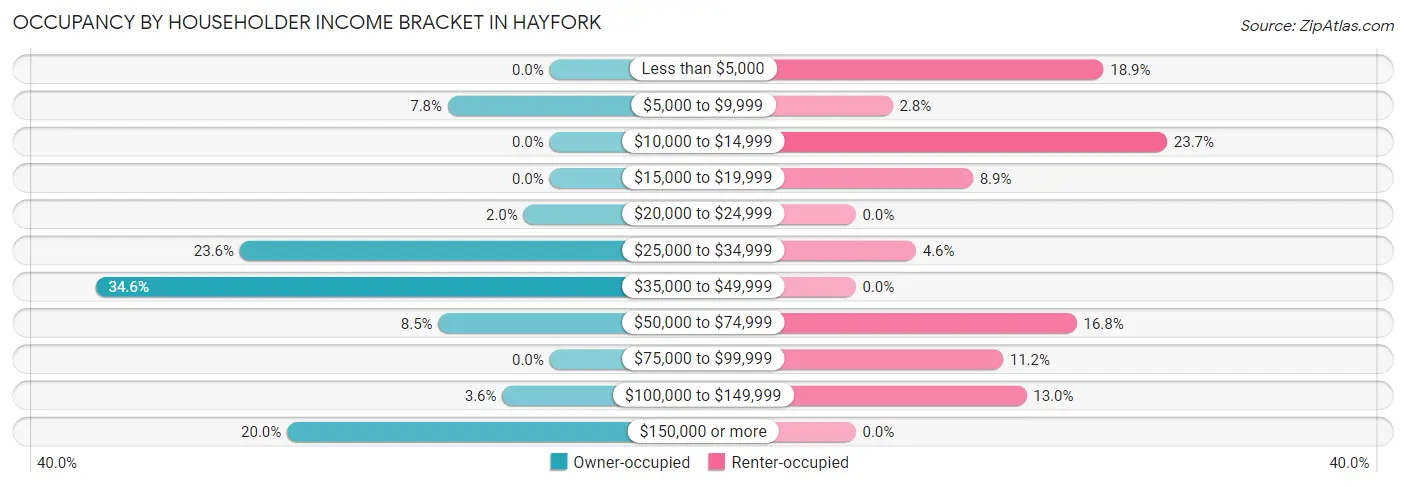
| Income Bracket | Owner-occupied | Renter-occupied |
| Less than $5,000 | 0 (0.0%) | 74 (18.9%) |
| $5,000 to $9,999 | 43 (7.7%) | 11 (2.8%) |
| $10,000 to $14,999 | 0 (0.0%) | 93 (23.7%) |
| $15,000 to $19,999 | 0 (0.0%) | 35 (8.9%) |
| $20,000 to $24,999 | 11 (2.0%) | 0 (0.0%) |
| $25,000 to $34,999 | 131 (23.6%) | 18 (4.6%) |
| $35,000 to $49,999 | 192 (34.6%) | 0 (0.0%) |
| $50,000 to $74,999 | 47 (8.5%) | 66 (16.8%) |
| $75,000 to $99,999 | 0 (0.0%) | 44 (11.2%) |
| $100,000 to $149,999 | 20 (3.6%) | 51 (13.0%) |
| $150,000 or more | 111 (20.0%) | 0 (0.0%) |
| Total | 555 (100.0%) | 392 (100.0%) |
Monthly Housing Cost Tiers in Hayfork
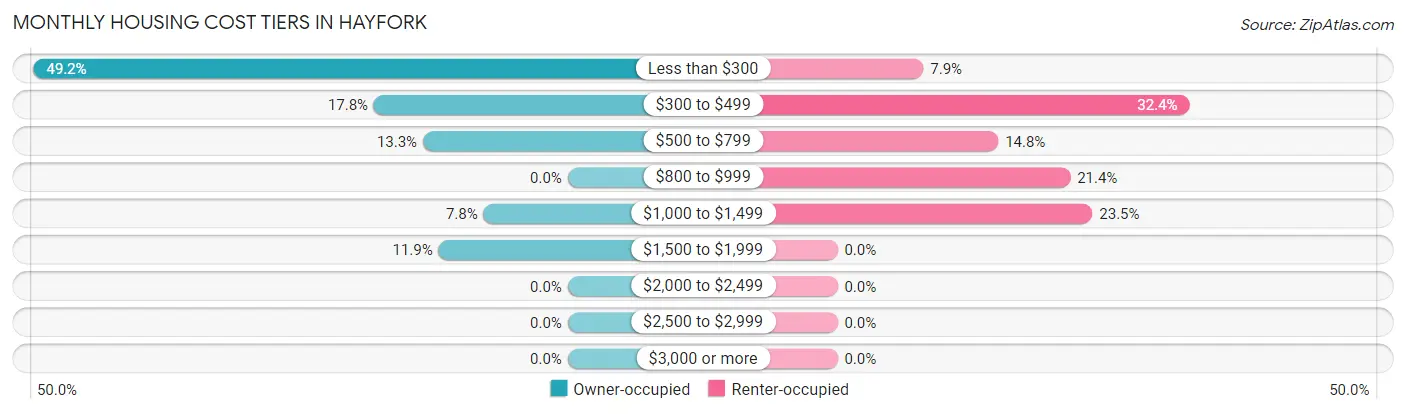
| Monthly Cost | Owner-occupied | Renter-occupied |
| Less than $300 | 273 (49.2%) | 31 (7.9%) |
| $300 to $499 | 99 (17.8%) | 127 (32.4%) |
| $500 to $799 | 74 (13.3%) | 58 (14.8%) |
| $800 to $999 | 0 (0.0%) | 84 (21.4%) |
| $1,000 to $1,499 | 43 (7.7%) | 92 (23.5%) |
| $1,500 to $1,999 | 66 (11.9%) | 0 (0.0%) |
| $2,000 to $2,499 | 0 (0.0%) | 0 (0.0%) |
| $2,500 to $2,999 | 0 (0.0%) | 0 (0.0%) |
| $3,000 or more | 0 (0.0%) | 0 (0.0%) |
| Total | 555 (100.0%) | 392 (100.0%) |
Physical Housing Characteristics in Hayfork
Housing Structures in Hayfork
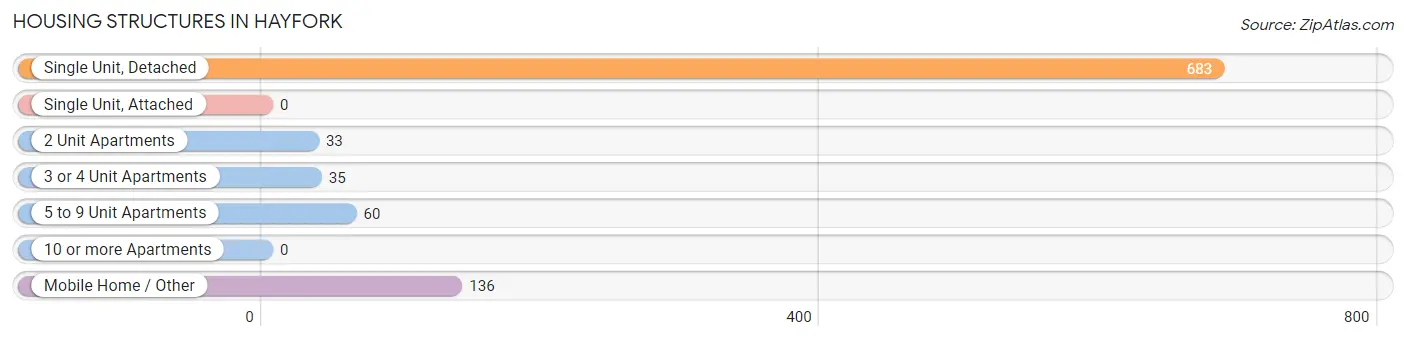
| Structure Type | # Housing Units | % Housing Units |
| Single Unit, Detached | 683 | 72.1% |
| Single Unit, Attached | 0 | 0.0% |
| 2 Unit Apartments | 33 | 3.5% |
| 3 or 4 Unit Apartments | 35 | 3.7% |
| 5 to 9 Unit Apartments | 60 | 6.3% |
| 10 or more Apartments | 0 | 0.0% |
| Mobile Home / Other | 136 | 14.4% |
| Total | 947 | 100.0% |
Housing Structures by Occupancy in Hayfork
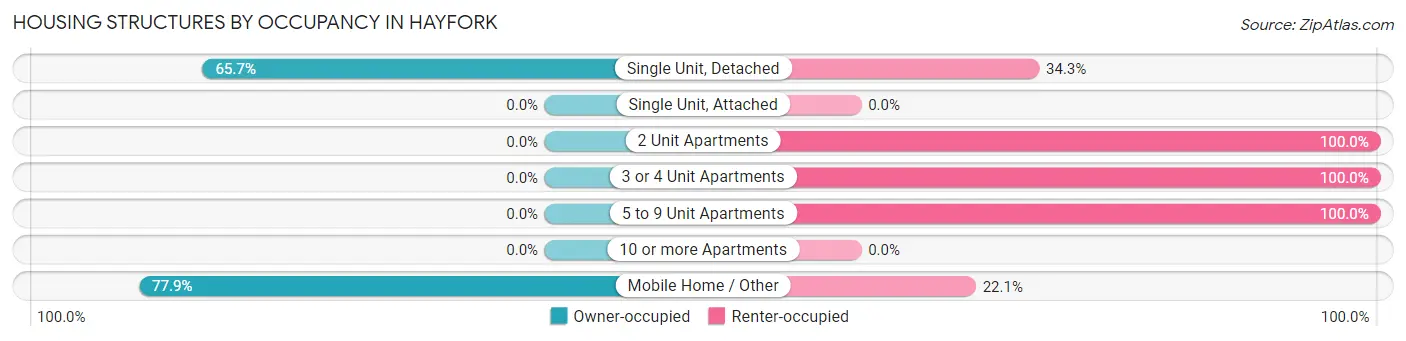
| Structure Type | Owner-occupied | Renter-occupied |
| Single Unit, Detached | 449 (65.7%) | 234 (34.3%) |
| Single Unit, Attached | 0 (0.0%) | 0 (0.0%) |
| 2 Unit Apartments | 0 (0.0%) | 33 (100.0%) |
| 3 or 4 Unit Apartments | 0 (0.0%) | 35 (100.0%) |
| 5 to 9 Unit Apartments | 0 (0.0%) | 60 (100.0%) |
| 10 or more Apartments | 0 (0.0%) | 0 (0.0%) |
| Mobile Home / Other | 106 (77.9%) | 30 (22.1%) |
| Total | 555 (58.6%) | 392 (41.4%) |
Housing Structures by Number of Rooms in Hayfork
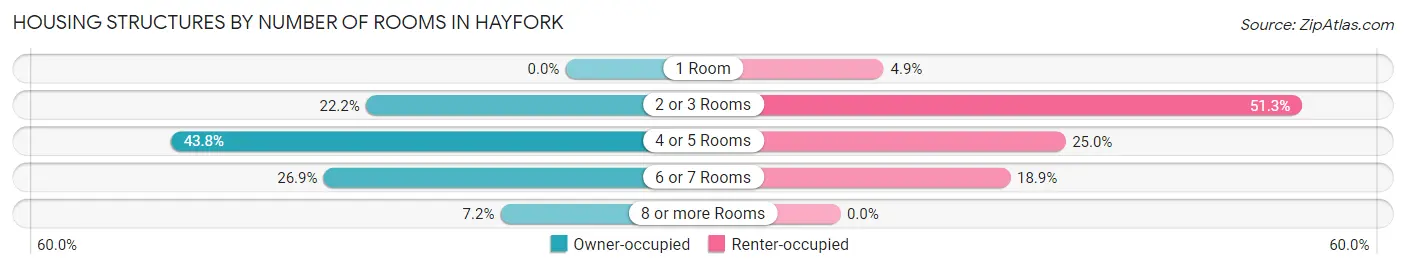
| Number of Rooms | Owner-occupied | Renter-occupied |
| 1 Room | 0 (0.0%) | 19 (4.9%) |
| 2 or 3 Rooms | 123 (22.2%) | 201 (51.3%) |
| 4 or 5 Rooms | 243 (43.8%) | 98 (25.0%) |
| 6 or 7 Rooms | 149 (26.9%) | 74 (18.9%) |
| 8 or more Rooms | 40 (7.2%) | 0 (0.0%) |
| Total | 555 (100.0%) | 392 (100.0%) |
Housing Structure by Heating Type in Hayfork
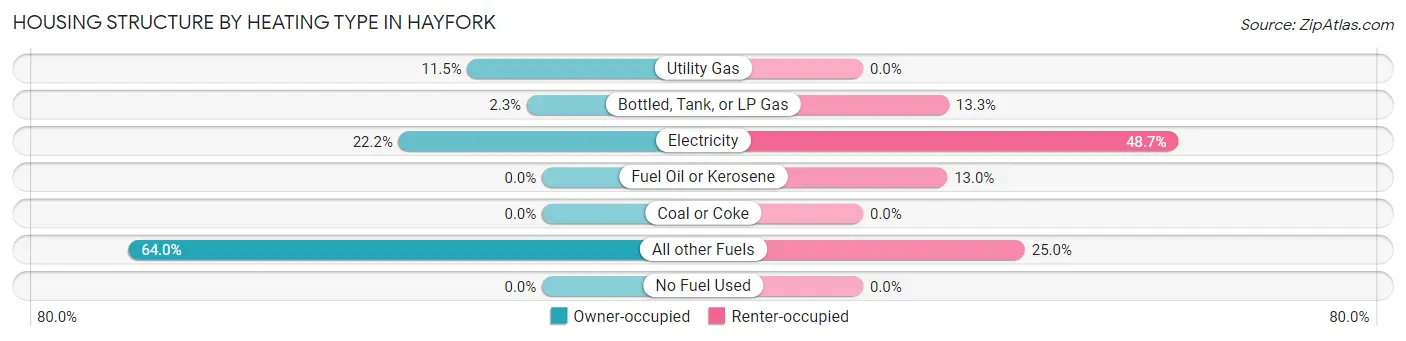
| Heating Type | Owner-occupied | Renter-occupied |
| Utility Gas | 64 (11.5%) | 0 (0.0%) |
| Bottled, Tank, or LP Gas | 13 (2.3%) | 52 (13.3%) |
| Electricity | 123 (22.2%) | 191 (48.7%) |
| Fuel Oil or Kerosene | 0 (0.0%) | 51 (13.0%) |
| Coal or Coke | 0 (0.0%) | 0 (0.0%) |
| All other Fuels | 355 (64.0%) | 98 (25.0%) |
| No Fuel Used | 0 (0.0%) | 0 (0.0%) |
| Total | 555 (100.0%) | 392 (100.0%) |
Household Vehicle Usage in Hayfork
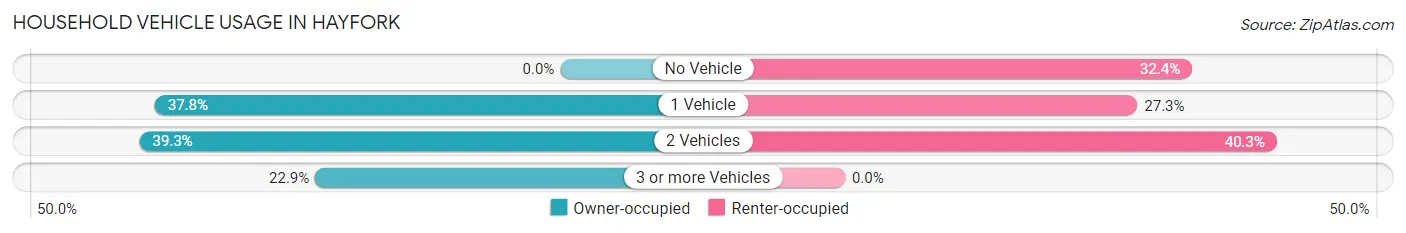
| Vehicles per Household | Owner-occupied | Renter-occupied |
| No Vehicle | 0 (0.0%) | 127 (32.4%) |
| 1 Vehicle | 210 (37.8%) | 107 (27.3%) |
| 2 Vehicles | 218 (39.3%) | 158 (40.3%) |
| 3 or more Vehicles | 127 (22.9%) | 0 (0.0%) |
| Total | 555 (100.0%) | 392 (100.0%) |
Real Estate & Mortgages in Hayfork
Real Estate and Mortgage Overview in Hayfork
| Characteristic | Without Mortgage | With Mortgage |
| Housing Units | 492 | 63 |
| Median Property Value | $249,500 | $0 |
| Median Household Income | $42,388 | $0 |
| Monthly Housing Costs | $290 | $0 |
| Real Estate Taxes | - | - |
Property Value by Mortgage Status in Hayfork
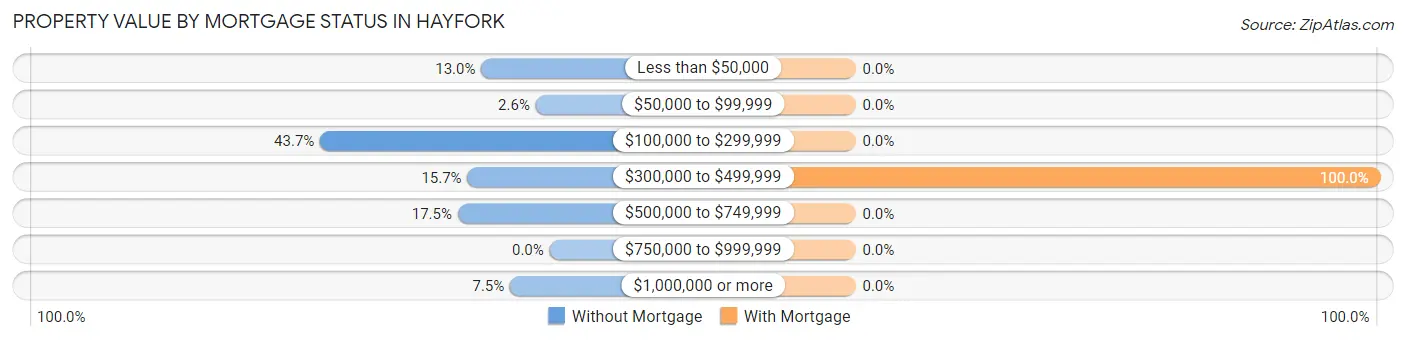
| Property Value | Without Mortgage | With Mortgage |
| Less than $50,000 | 64 (13.0%) | 0 (0.0%) |
| $50,000 to $99,999 | 13 (2.6%) | 0 (0.0%) |
| $100,000 to $299,999 | 215 (43.7%) | 0 (0.0%) |
| $300,000 to $499,999 | 77 (15.7%) | 63 (100.0%) |
| $500,000 to $749,999 | 86 (17.5%) | 0 (0.0%) |
| $750,000 to $999,999 | 0 (0.0%) | 0 (0.0%) |
| $1,000,000 or more | 37 (7.5%) | 0 (0.0%) |
| Total | 492 (100.0%) | 63 (100.0%) |
Household Income by Mortgage Status in Hayfork
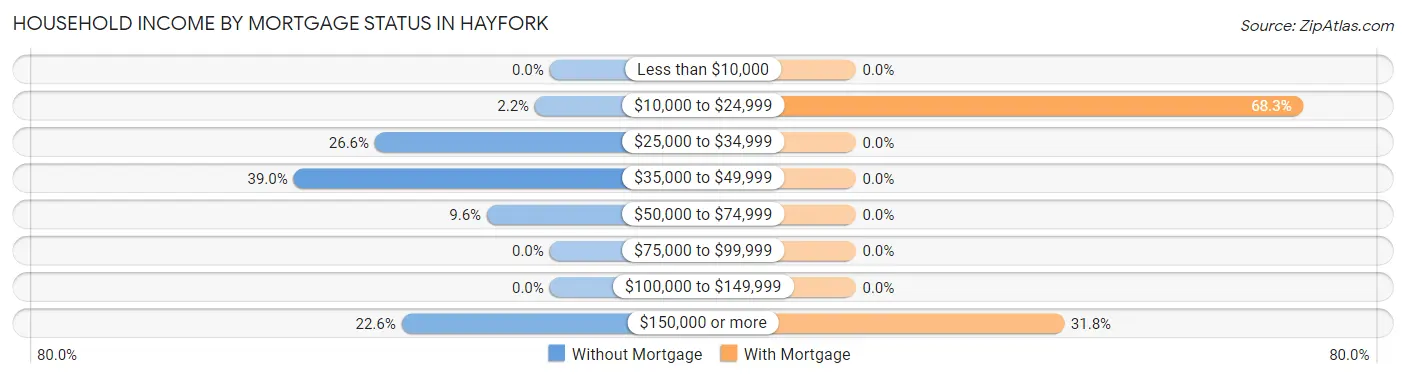
| Household Income | Without Mortgage | With Mortgage |
| Less than $10,000 | 0 (0.0%) | 0 (0.0%) |
| $10,000 to $24,999 | 11 (2.2%) | 43 (68.2%) |
| $25,000 to $34,999 | 131 (26.6%) | 0 (0.0%) |
| $35,000 to $49,999 | 192 (39.0%) | 0 (0.0%) |
| $50,000 to $74,999 | 47 (9.6%) | 0 (0.0%) |
| $75,000 to $99,999 | 0 (0.0%) | 0 (0.0%) |
| $100,000 to $149,999 | 0 (0.0%) | 0 (0.0%) |
| $150,000 or more | 111 (22.6%) | 20 (31.8%) |
| Total | 492 (100.0%) | 63 (100.0%) |
Property Value to Household Income Ratio in Hayfork
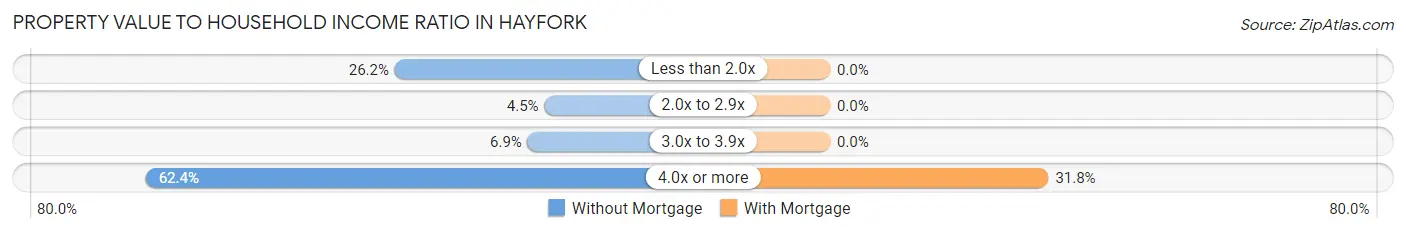
| Value-to-Income Ratio | Without Mortgage | With Mortgage |
| Less than 2.0x | 129 (26.2%) | 0 (0.0%) |
| 2.0x to 2.9x | 22 (4.5%) | 0 (0.0%) |
| 3.0x to 3.9x | 34 (6.9%) | 0 (0.0%) |
| 4.0x or more | 307 (62.4%) | 20 (31.8%) |
| Total | 492 (100.0%) | 63 (100.0%) |
Real Estate Taxes by Mortgage Status in Hayfork
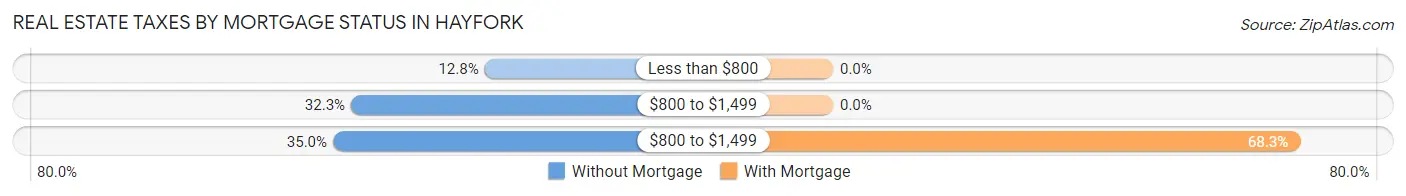
| Property Taxes | Without Mortgage | With Mortgage |
| Less than $800 | 63 (12.8%) | 0 (0.0%) |
| $800 to $1,499 | 159 (32.3%) | 0 (0.0%) |
| $800 to $1,499 | 172 (35.0%) | 43 (68.2%) |
| Total | 492 (100.0%) | 63 (100.0%) |
Health & Disability in Hayfork
Health Insurance Coverage by Age in Hayfork
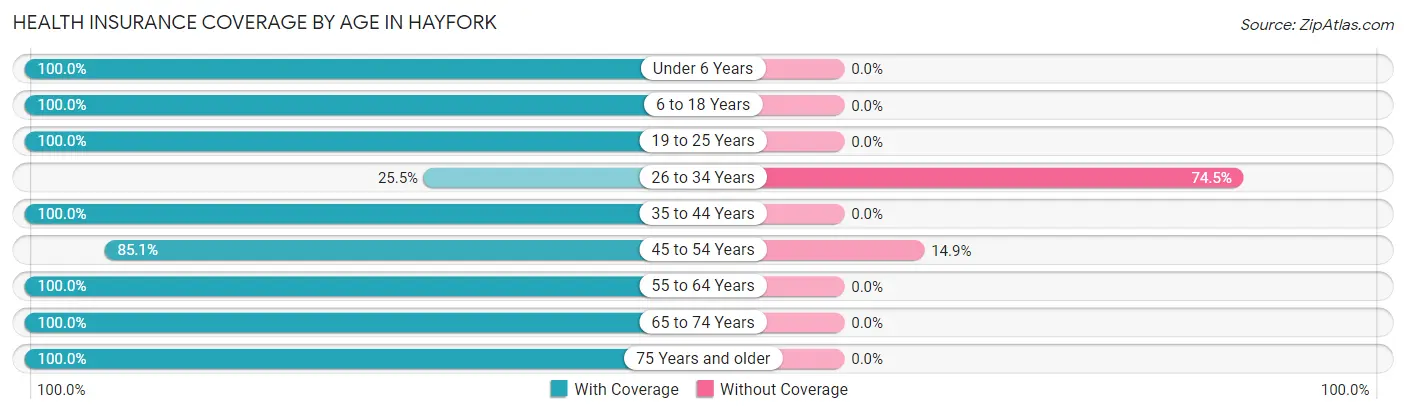
| Age Bracket | With Coverage | Without Coverage |
| Under 6 Years | 111 (100.0%) | 0 (0.0%) |
| 6 to 18 Years | 261 (100.0%) | 0 (0.0%) |
| 19 to 25 Years | 79 (100.0%) | 0 (0.0%) |
| 26 to 34 Years | 156 (25.5%) | 455 (74.5%) |
| 35 to 44 Years | 122 (100.0%) | 0 (0.0%) |
| 45 to 54 Years | 291 (85.1%) | 51 (14.9%) |
| 55 to 64 Years | 836 (100.0%) | 0 (0.0%) |
| 65 to 74 Years | 420 (100.0%) | 0 (0.0%) |
| 75 Years and older | 445 (100.0%) | 0 (0.0%) |
| Total | 2,721 (84.3%) | 506 (15.7%) |
Health Insurance Coverage by Citizenship Status in Hayfork

| Citizenship Status | With Coverage | Without Coverage |
| Native Born | 111 (100.0%) | 0 (0.0%) |
| Foreign Born, Citizen | 261 (100.0%) | 0 (0.0%) |
| Foreign Born, not a Citizen | 79 (100.0%) | 0 (0.0%) |
Health Insurance Coverage by Household Income in Hayfork
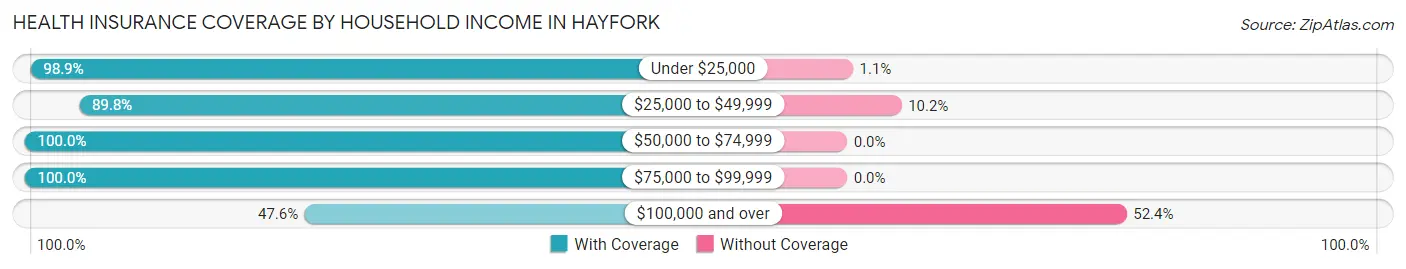
| Household Income | With Coverage | Without Coverage |
| Under $25,000 | 1,010 (98.9%) | 11 (1.1%) |
| $25,000 to $49,999 | 652 (89.8%) | 74 (10.2%) |
| $50,000 to $74,999 | 471 (100.0%) | 0 (0.0%) |
| $75,000 to $99,999 | 170 (100.0%) | 0 (0.0%) |
| $100,000 and over | 383 (47.6%) | 421 (52.4%) |
Public vs Private Health Insurance Coverage by Age in Hayfork
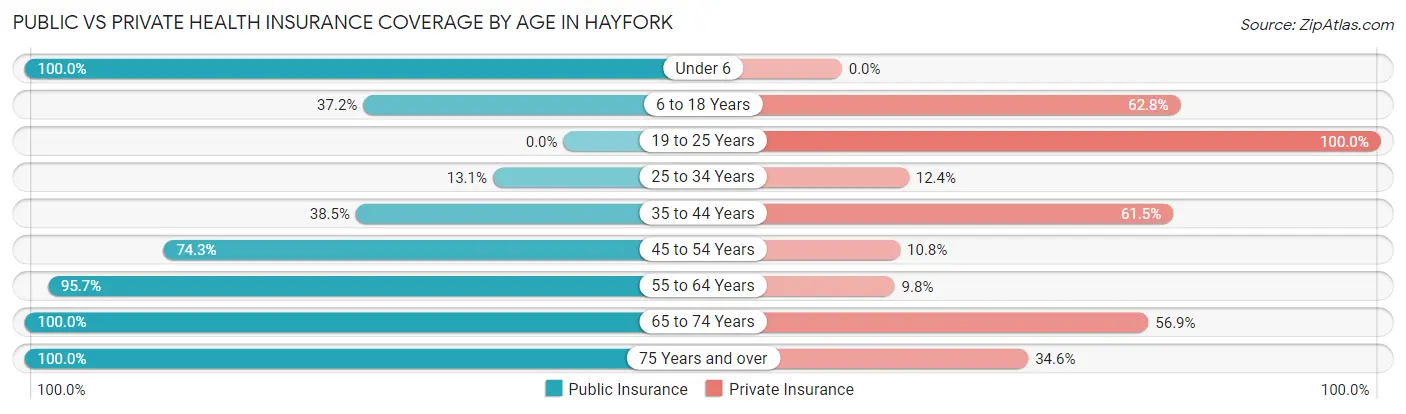
| Age Bracket | Public Insurance | Private Insurance |
| Under 6 | 111 (100.0%) | 0 (0.0%) |
| 6 to 18 Years | 97 (37.2%) | 164 (62.8%) |
| 19 to 25 Years | 0 (0.0%) | 79 (100.0%) |
| 25 to 34 Years | 80 (13.1%) | 76 (12.4%) |
| 35 to 44 Years | 47 (38.5%) | 75 (61.5%) |
| 45 to 54 Years | 254 (74.3%) | 37 (10.8%) |
| 55 to 64 Years | 800 (95.7%) | 82 (9.8%) |
| 65 to 74 Years | 420 (100.0%) | 239 (56.9%) |
| 75 Years and over | 445 (100.0%) | 154 (34.6%) |
| Total | 2,254 (69.9%) | 906 (28.1%) |
Disability Status by Sex by Age in Hayfork
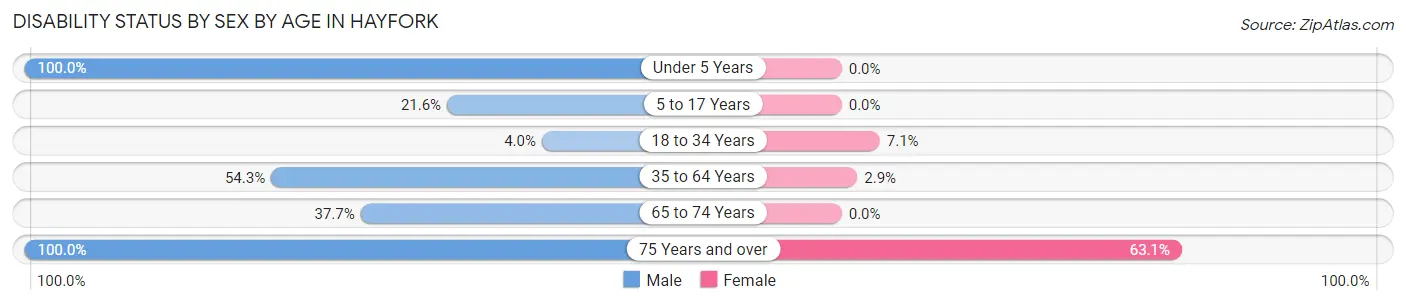
| Age Bracket | Male | Female |
| Under 5 Years | 68 (100.0%) | 0 (0.0%) |
| 5 to 17 Years | 43 (21.6%) | 0 (0.0%) |
| 18 to 34 Years | 19 (4.0%) | 18 (7.1%) |
| 35 to 64 Years | 254 (54.3%) | 24 (2.9%) |
| 65 to 74 Years | 61 (37.7%) | 0 (0.0%) |
| 75 Years and over | 258 (100.0%) | 118 (63.1%) |
Disability Class by Sex by Age in Hayfork
Disability Class: Hearing Difficulty
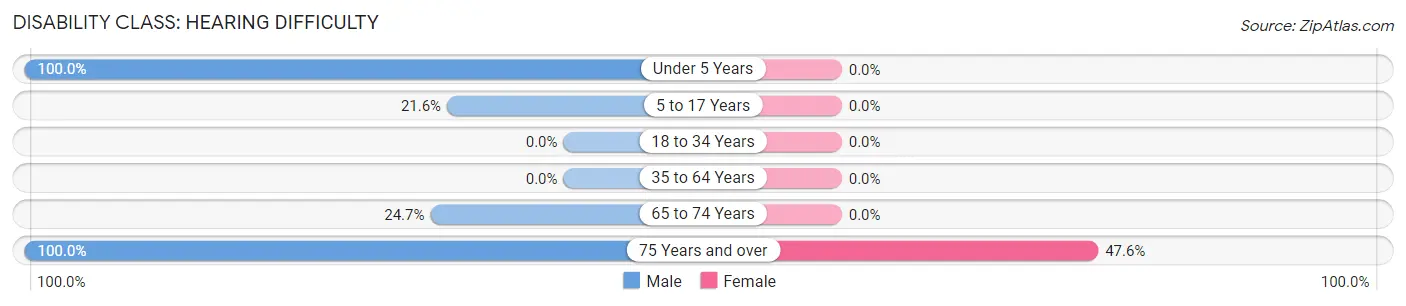
| Age Bracket | Male | Female |
| Under 5 Years | 68 (100.0%) | 0 (0.0%) |
| 5 to 17 Years | 43 (21.6%) | 0 (0.0%) |
| 18 to 34 Years | 0 (0.0%) | 0 (0.0%) |
| 35 to 64 Years | 0 (0.0%) | 0 (0.0%) |
| 65 to 74 Years | 40 (24.7%) | 0 (0.0%) |
| 75 Years and over | 258 (100.0%) | 89 (47.6%) |
Disability Class: Vision Difficulty
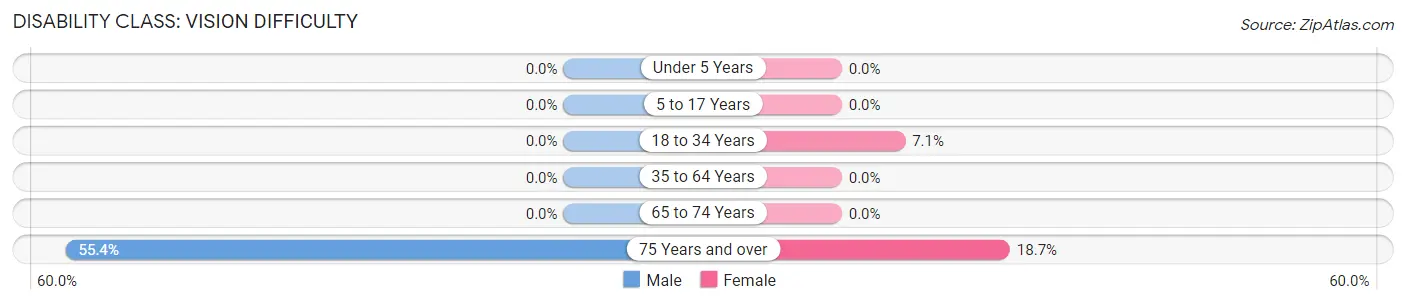
| Age Bracket | Male | Female |
| Under 5 Years | 0 (0.0%) | 0 (0.0%) |
| 5 to 17 Years | 0 (0.0%) | 0 (0.0%) |
| 18 to 34 Years | 0 (0.0%) | 18 (7.1%) |
| 35 to 64 Years | 0 (0.0%) | 0 (0.0%) |
| 65 to 74 Years | 0 (0.0%) | 0 (0.0%) |
| 75 Years and over | 143 (55.4%) | 35 (18.7%) |
Disability Class: Cognitive Difficulty
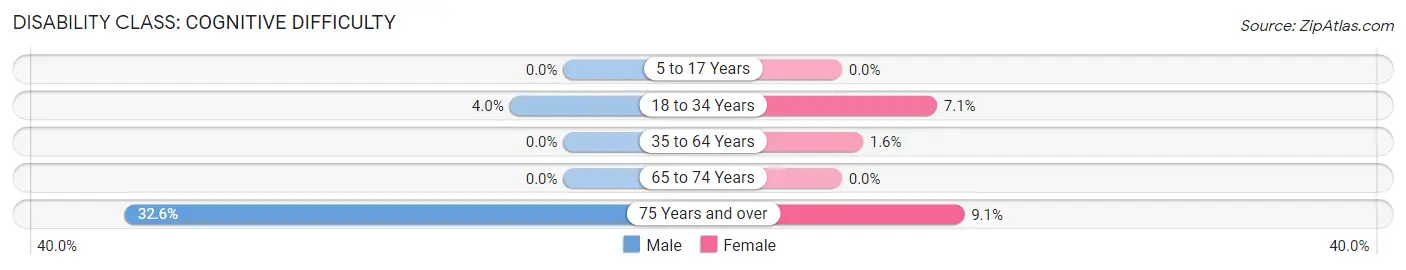
| Age Bracket | Male | Female |
| 5 to 17 Years | 0 (0.0%) | 0 (0.0%) |
| 18 to 34 Years | 19 (4.0%) | 18 (7.1%) |
| 35 to 64 Years | 0 (0.0%) | 13 (1.6%) |
| 65 to 74 Years | 0 (0.0%) | 0 (0.0%) |
| 75 Years and over | 84 (32.6%) | 17 (9.1%) |
Disability Class: Ambulatory Difficulty
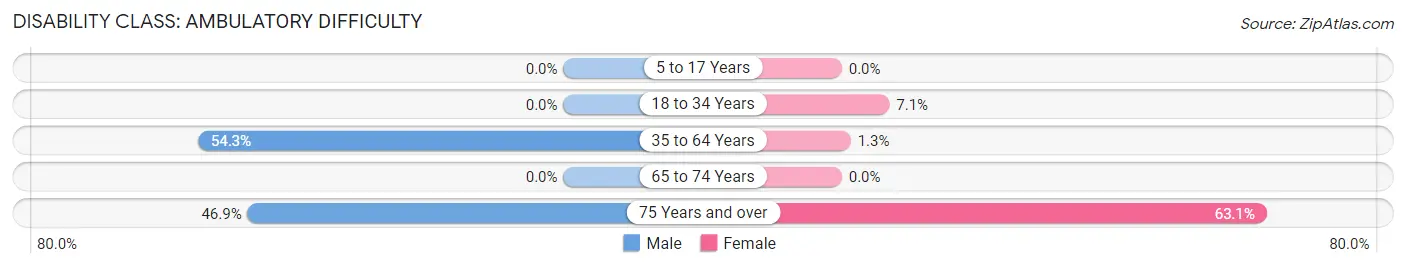
| Age Bracket | Male | Female |
| 5 to 17 Years | 0 (0.0%) | 0 (0.0%) |
| 18 to 34 Years | 0 (0.0%) | 18 (7.1%) |
| 35 to 64 Years | 254 (54.3%) | 11 (1.3%) |
| 65 to 74 Years | 0 (0.0%) | 0 (0.0%) |
| 75 Years and over | 121 (46.9%) | 118 (63.1%) |
Disability Class: Self-Care Difficulty
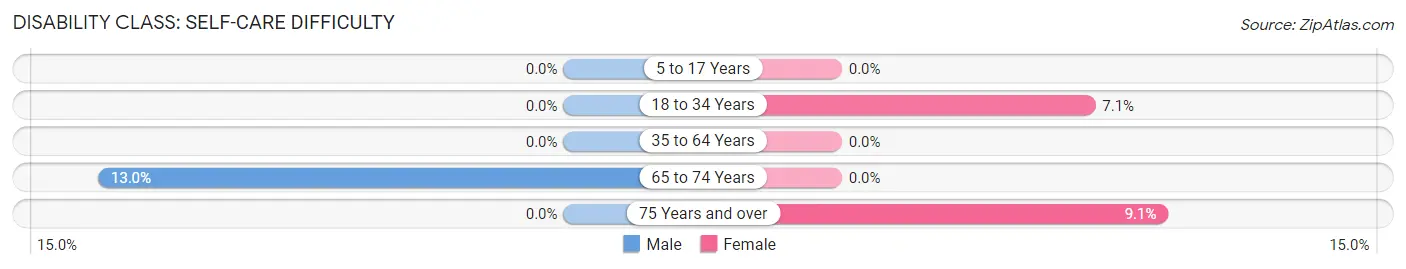
| Age Bracket | Male | Female |
| 5 to 17 Years | 0 (0.0%) | 0 (0.0%) |
| 18 to 34 Years | 0 (0.0%) | 18 (7.1%) |
| 35 to 64 Years | 0 (0.0%) | 0 (0.0%) |
| 65 to 74 Years | 21 (13.0%) | 0 (0.0%) |
| 75 Years and over | 0 (0.0%) | 17 (9.1%) |
Technology Access in Hayfork
Computing Device Access in Hayfork
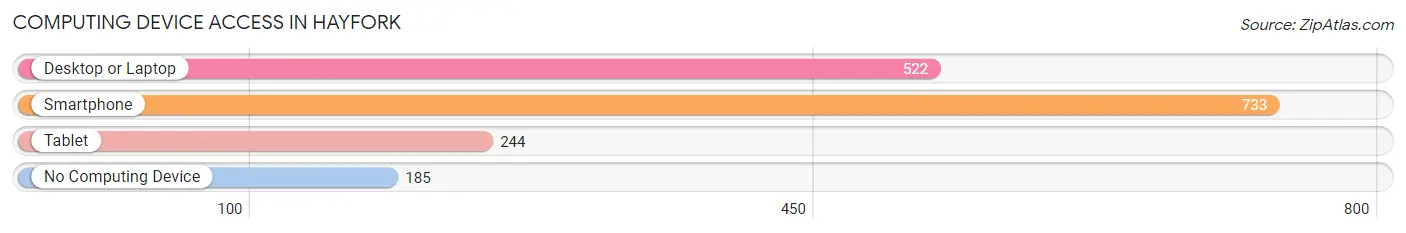
| Device Type | # Households | % Households |
| Desktop or Laptop | 522 | 55.1% |
| Smartphone | 733 | 77.4% |
| Tablet | 244 | 25.8% |
| No Computing Device | 185 | 19.5% |
| Total | 947 | 100.0% |
Internet Access in Hayfork
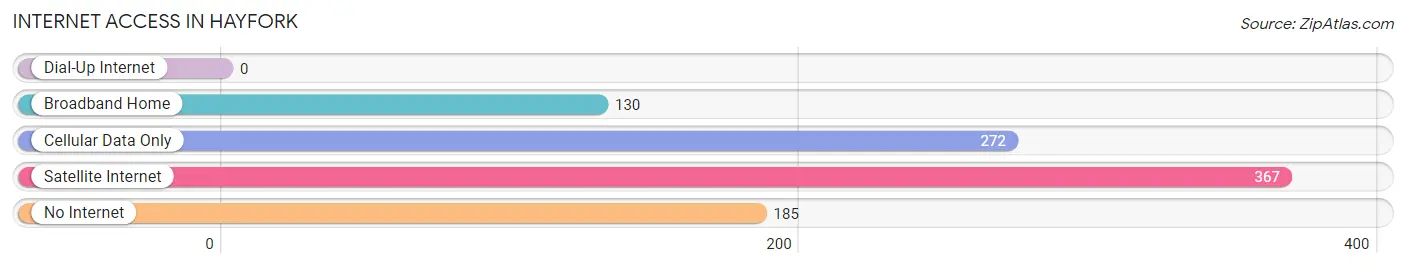
| Internet Type | # Households | % Households |
| Dial-Up Internet | 0 | 0.0% |
| Broadband Home | 130 | 13.7% |
| Cellular Data Only | 272 | 28.7% |
| Satellite Internet | 367 | 38.8% |
| No Internet | 185 | 19.5% |
| Total | 947 | 100.0% |
Hayfork Summary
Hayfork is a small town located in Trinity County, California, United States. It is situated in the northern part of the state, about 40 miles east of Redding. The population of Hayfork was 1,717 at the 2010 census.
History
The area that is now Hayfork was originally inhabited by the Wintu people, who lived in the area for thousands of years before the arrival of European settlers. The first Europeans to settle in the area were miners, who arrived in the 1850s in search of gold. The town of Hayfork was established in 1852, and was named after the nearby Hayfork Creek.
The town grew slowly over the next few decades, and by the early 1900s, it had become a bustling logging and ranching community. The town was incorporated in 1911, and the first post office was established in 1912.
Geography
Hayfork is located in the northern part of California, about 40 miles east of Redding. It is situated in the Trinity Mountains, at an elevation of 2,845 feet. The town is surrounded by forests of pine, fir, and cedar, and is located near the headwaters of the Trinity River.
The climate in Hayfork is generally mild, with warm summers and cool winters. The average annual temperature is around 50°F, and the average annual precipitation is around 30 inches.
Economy
The economy of Hayfork is largely based on logging and ranching. The town is home to several sawmills and lumber companies, as well as several cattle ranches. Hayfork is also home to several small businesses, including restaurants, stores, and service providers.
The town is also home to several recreational activities, including camping, fishing, hunting, and hiking. The nearby Trinity Alps Wilderness Area offers a variety of outdoor activities, including backpacking, horseback riding, and mountain biking.
Demographics
As of the 2010 census, the population of Hayfork was 1,717. The racial makeup of the town was 87.3% White, 0.7% African American, 2.2% Native American, 0.3% Asian, 0.1% Pacific Islander, 6.2% from other races, and 3.4% from two or more races. Hispanic or Latino of any race were 11.2% of the population.
The median income for a household in Hayfork was $30,938, and the median income for a family was $35,625. The per capita income for the town was $15,945. About 17.2% of families and 20.2% of the population were below the poverty line, including 28.3% of those under age 18 and 8.2% of those age 65 or over.
Common Questions
What is Per Capita Income in Hayfork?
Per Capita income in Hayfork is $25,870.
What is the Median Family Income in Hayfork?
Median Family Income in Hayfork is $56,755.
What is the Median Household income in Hayfork?
Median Household Income in Hayfork is $40,653.
What is Income or Wage Gap in Hayfork?
Income or Wage Gap in Hayfork is 5.7%.
Women in Hayfork earn 94.3 cents for every dollar earned by a man.
What is Inequality or Gini Index in Hayfork?
Inequality or Gini Index in Hayfork is 0.54.
What is the Total Population of Hayfork?
Total Population of Hayfork is 3,227.
What is the Total Male Population of Hayfork?
Total Male Population of Hayfork is 1,630.
What is the Total Female Population of Hayfork?
Total Female Population of Hayfork is 1,597.
What is the Ratio of Males per 100 Females in Hayfork?
There are 102.07 Males per 100 Females in Hayfork.
What is the Ratio of Females per 100 Males in Hayfork?
There are 97.98 Females per 100 Males in Hayfork.
What is the Median Population Age in Hayfork?
Median Population Age in Hayfork is 56.9 Years.
What is the Average Family Size in Hayfork
Average Family Size in Hayfork is 3.9 People.
What is the Average Household Size in Hayfork
Average Household Size in Hayfork is 3.4 People.
How Large is the Labor Force in Hayfork?
There are 512 People in the Labor Forcein in Hayfork.
What is the Percentage of People in the Labor Force in Hayfork?
17.5% of People are in the Labor Force in Hayfork.