Furnace Creek, CA Map & Demographics
Furnace Creek Map
Furnace Creek Overview
$29,785
PER CAPITA INCOME
$90,917
AVG FAMILY INCOME
$41,583
AVG HOUSEHOLD INCOME
0.34
INEQUALITY / GINI INDEX
130
TOTAL POPULATION
57
MALE POPULATION
73
FEMALE POPULATION
78.08
MALES / 100 FEMALES
128.07
FEMALES / 100 MALES
54.4
MEDIAN AGE
2.2
AVG FAMILY SIZE
1.6
AVG HOUSEHOLD SIZE
118
LABOR FORCE [ PEOPLE ]
90.8%
PERCENT IN LABOR FORCE
1.7%
UNEMPLOYMENT RATE
Income in Furnace Creek
Income Overview in Furnace Creek
Per Capita Income in Furnace Creek is $29,785, while median incomes of families and households are $90,917 and $41,583 respectively.
| Characteristic | Number | Measure |
| Per Capita Income | 130 | $29,785 |
| Median Family Income | 19 | $90,917 |
| Mean Family Income | 19 | $85,605 |
| Median Household Income | 83 | $41,583 |
| Mean Household Income | 83 | $43,054 |
| Income Deficit | 19 | $0 |
| Wage / Income Gap (%) | 130 | 0.00% |
| Wage / Income Gap ($) | 130 | 100.00¢ per $1 |
| Gini / Inequality Index | 130 | 0.34 |
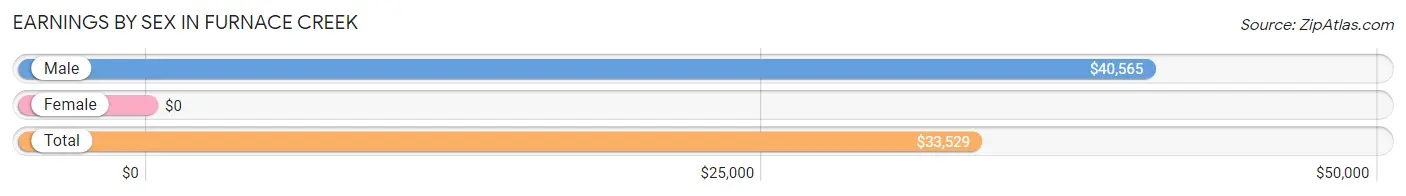
Earnings by Sex in Furnace Creek
| Sex | Number | Average Earnings |
| Male | 48 (41.4%) | $40,565 |
| Female | 68 (58.6%) | $0 |
| Total | 116 (100.0%) | $33,529 |
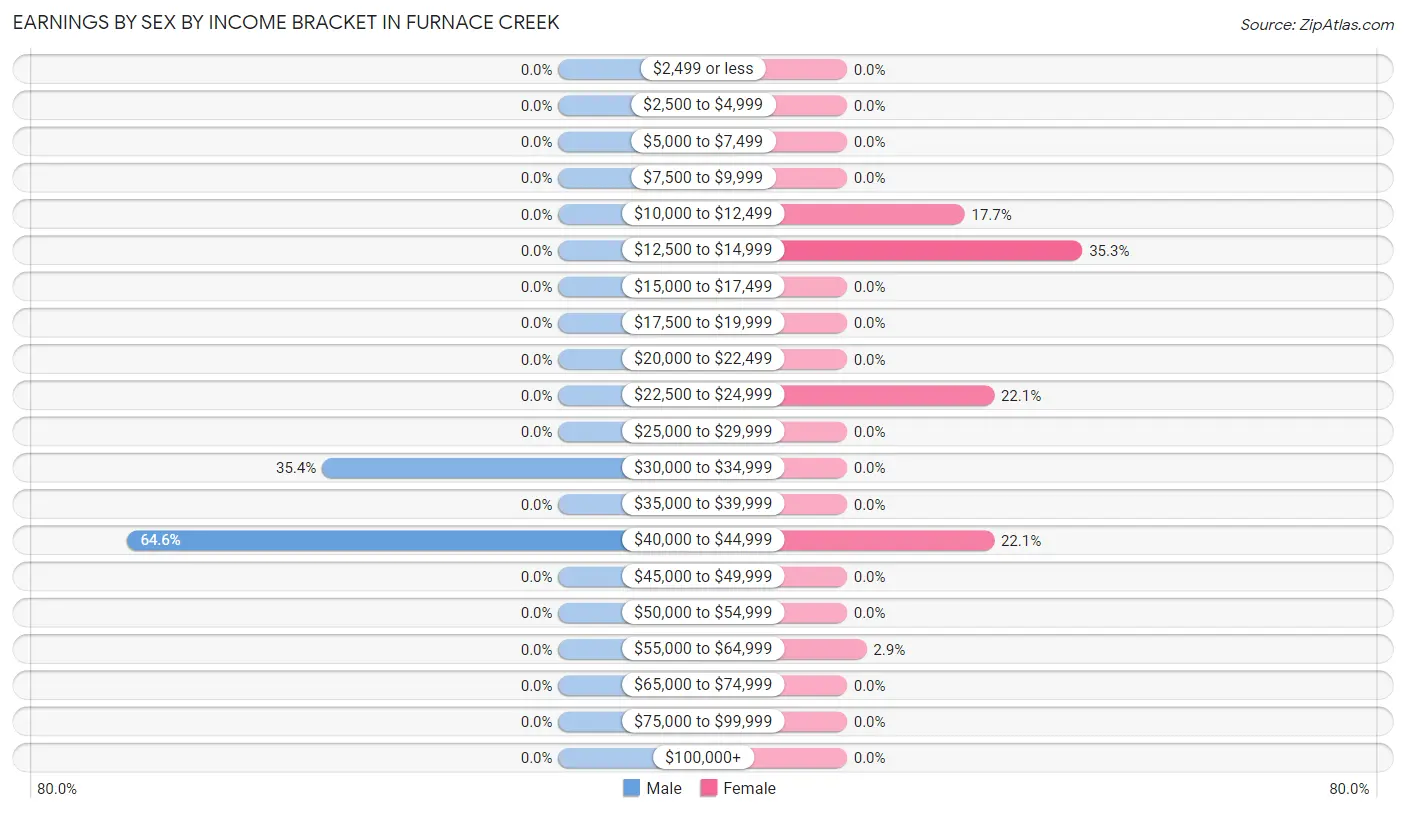
Earnings by Sex by Income Bracket in Furnace Creek
The most common earnings brackets in Furnace Creek are $40,000 to $44,999 for men (31 | 64.6%) and $12,500 to $14,999 for women (24 | 35.3%).
| Income | Male | Female |
| $2,499 or less | 0 (0.0%) | 0 (0.0%) |
| $2,500 to $4,999 | 0 (0.0%) | 0 (0.0%) |
| $5,000 to $7,499 | 0 (0.0%) | 0 (0.0%) |
| $7,500 to $9,999 | 0 (0.0%) | 0 (0.0%) |
| $10,000 to $12,499 | 0 (0.0%) | 12 (17.6%) |
| $12,500 to $14,999 | 0 (0.0%) | 24 (35.3%) |
| $15,000 to $17,499 | 0 (0.0%) | 0 (0.0%) |
| $17,500 to $19,999 | 0 (0.0%) | 0 (0.0%) |
| $20,000 to $22,499 | 0 (0.0%) | 0 (0.0%) |
| $22,500 to $24,999 | 0 (0.0%) | 15 (22.1%) |
| $25,000 to $29,999 | 0 (0.0%) | 0 (0.0%) |
| $30,000 to $34,999 | 17 (35.4%) | 0 (0.0%) |
| $35,000 to $39,999 | 0 (0.0%) | 0 (0.0%) |
| $40,000 to $44,999 | 31 (64.6%) | 15 (22.1%) |
| $45,000 to $49,999 | 0 (0.0%) | 0 (0.0%) |
| $50,000 to $54,999 | 0 (0.0%) | 0 (0.0%) |
| $55,000 to $64,999 | 0 (0.0%) | 2 (2.9%) |
| $65,000 to $74,999 | 0 (0.0%) | 0 (0.0%) |
| $75,000 to $99,999 | 0 (0.0%) | 0 (0.0%) |
| $100,000+ | 0 (0.0%) | 0 (0.0%) |
| Total | 48 (100.0%) | 68 (100.0%) |
Earnings by Sex by Educational Attainment in Furnace Creek
| Educational Attainment | Male Income | Female Income |
| Less than High School | - | - |
| High School Diploma | - | - |
| College or Associate's Degree | - | - |
| Bachelor's Degree | - | - |
| Graduate Degree | - | - |
| Total | $40,565 | $0 |
Family Income in Furnace Creek
Family Income Brackets in Furnace Creek
According to the Furnace Creek family income data, there are 15 families falling into the $75,000 to $99,999 income range, which is the most common income bracket and makes up 78.9% of all families.
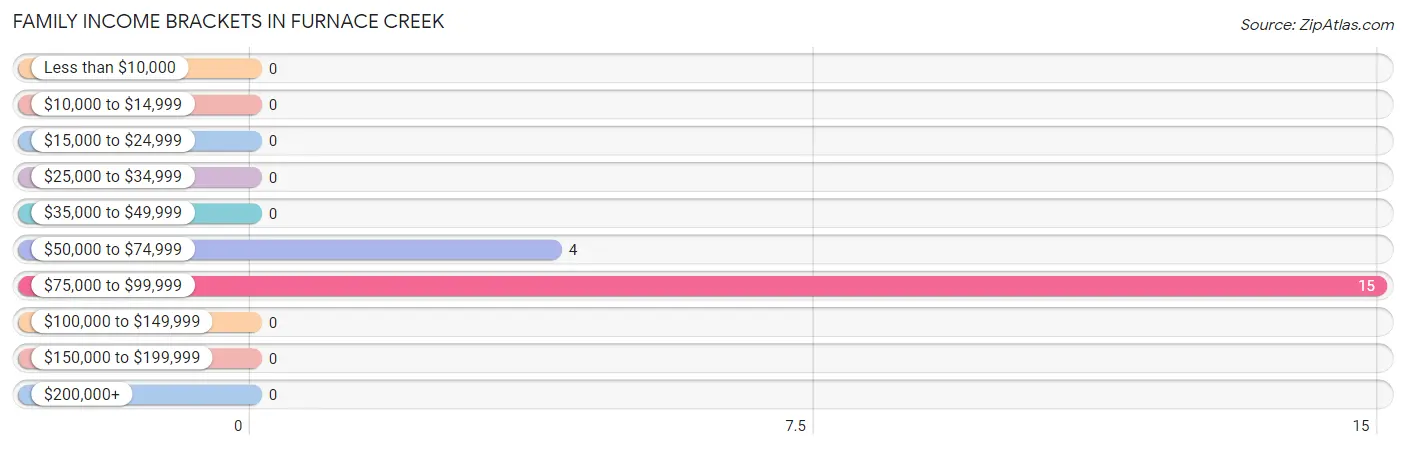
| Income Bracket | # Families | % Families |
| Less than $10,000 | 0 | 0.0% |
| $10,000 to $14,999 | 0 | 0.0% |
| $15,000 to $24,999 | 0 | 0.0% |
| $25,000 to $34,999 | 0 | 0.0% |
| $35,000 to $49,999 | 0 | 0.0% |
| $50,000 to $74,999 | 4 | 21.1% |
| $75,000 to $99,999 | 15 | 78.9% |
| $100,000 to $149,999 | 0 | 0.0% |
| $150,000 to $199,999 | 0 | 0.0% |
| $200,000+ | 0 | 0.0% |
Family Income by Famaliy Size in Furnace Creek
2-person families (19 | 100.0%) account for the highest median family income in Furnace Creek with $90,917 per family, while 2-person families (19 | 100.0%) have the highest median income of $45,458 per family member.
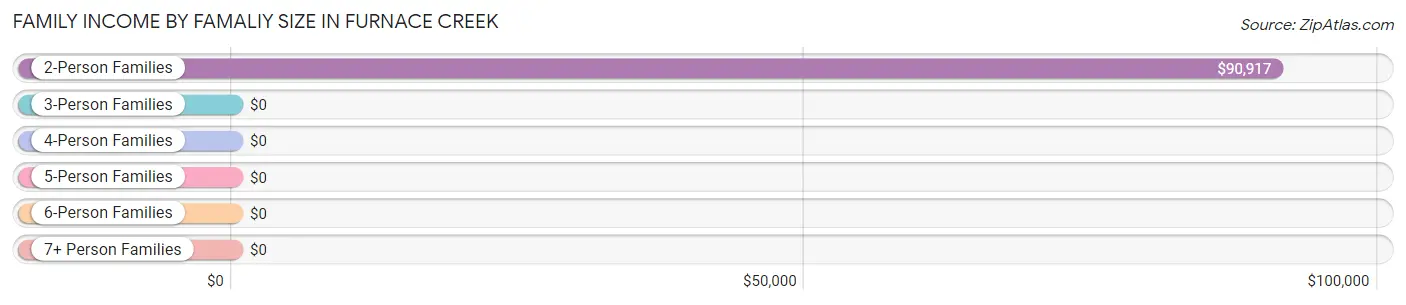
| Income Bracket | # Families | Median Income |
| 2-Person Families | 19 (100.0%) | $90,917 |
| 3-Person Families | 0 (0.0%) | $0 |
| 4-Person Families | 0 (0.0%) | $0 |
| 5-Person Families | 0 (0.0%) | $0 |
| 6-Person Families | 0 (0.0%) | $0 |
| 7+ Person Families | 0 (0.0%) | $0 |
| Total | 19 (100.0%) | $90,917 |
Family Income by Number of Earners in Furnace Creek
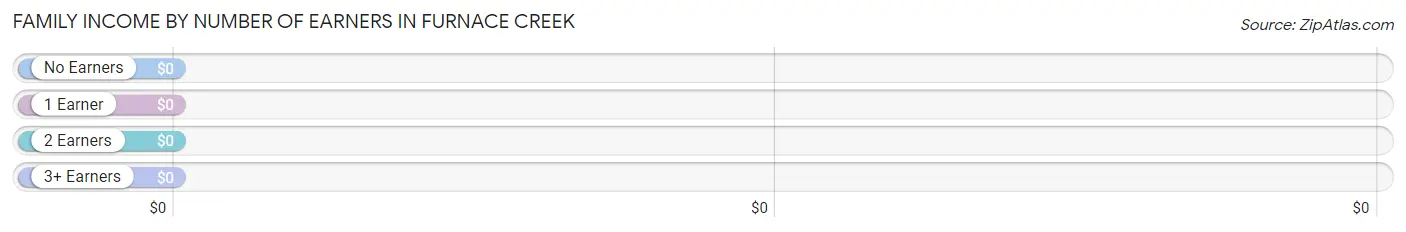
| Number of Earners | # Families | Median Income |
| No Earners | 2 (10.5%) | $0 |
| 1 Earner | 2 (10.5%) | $0 |
| 2 Earners | 15 (78.9%) | $0 |
| 3+ Earners | 0 (0.0%) | $0 |
| Total | 19 (100.0%) | $90,917 |
Household Income in Furnace Creek
Household Income Brackets in Furnace Creek
With 32 households falling in the category, the $35,000 to $49,999 income range is the most frequent in Furnace Creek, accounting for 38.6% of all households.
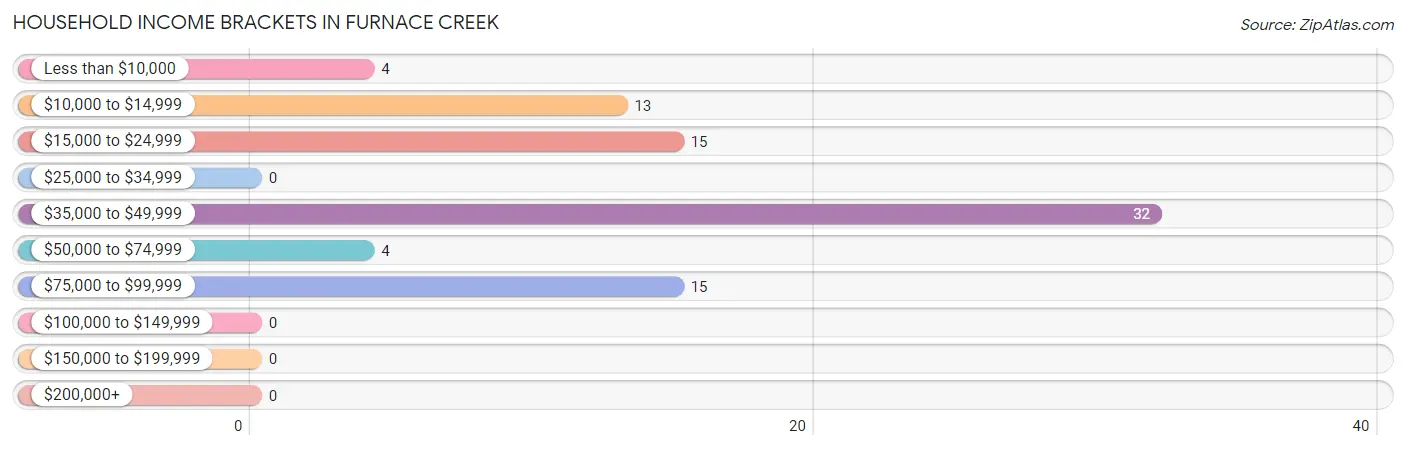
| Income Bracket | # Households | % Households |
| Less than $10,000 | 4 | 4.8% |
| $10,000 to $14,999 | 13 | 15.7% |
| $15,000 to $24,999 | 15 | 18.1% |
| $25,000 to $34,999 | 0 | 0.0% |
| $35,000 to $49,999 | 32 | 38.6% |
| $50,000 to $74,999 | 4 | 4.8% |
| $75,000 to $99,999 | 15 | 18.1% |
| $100,000 to $149,999 | 0 | 0.0% |
| $150,000 to $199,999 | 0 | 0.0% |
| $200,000+ | 0 | 0.0% |
Household Income by Householder Age in Furnace Creek
The median household income in Furnace Creek is $41,583, with the highest median household income of $45,294 found in the 25 to 44 years age bracket for the primary householder. A total of 34 households (41.0%) fall into this category.
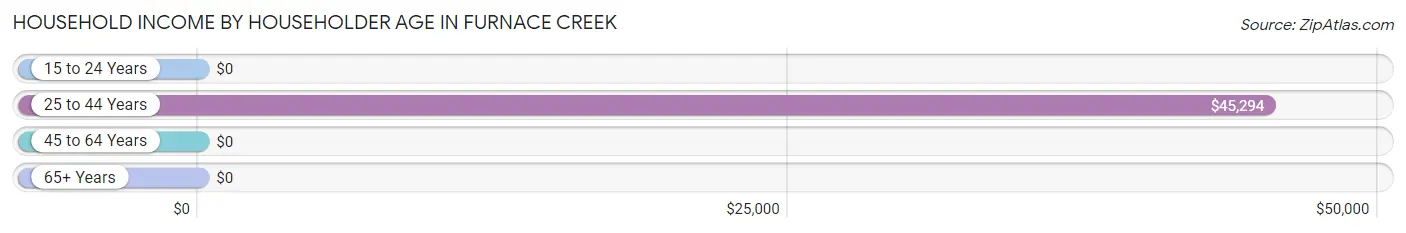
| Income Bracket | # Households | Median Income |
| 15 to 24 Years | 0 (0.0%) | $0 |
| 25 to 44 Years | 34 (41.0%) | $45,294 |
| 45 to 64 Years | 44 (53.0%) | $0 |
| 65+ Years | 5 (6.0%) | $0 |
| Total | 83 (100.0%) | $41,583 |
Poverty in Furnace Creek
Income Below Poverty by Sex and Age in Furnace Creek
With 3.5% poverty level for males and 53.4% for females among the residents of Furnace Creek, 55 to 64 year old males and 45 to 54 year old females are the most vulnerable to poverty, with 2 males (11.1%) and 12 females (100.0%) in their respective age groups living below the poverty level.
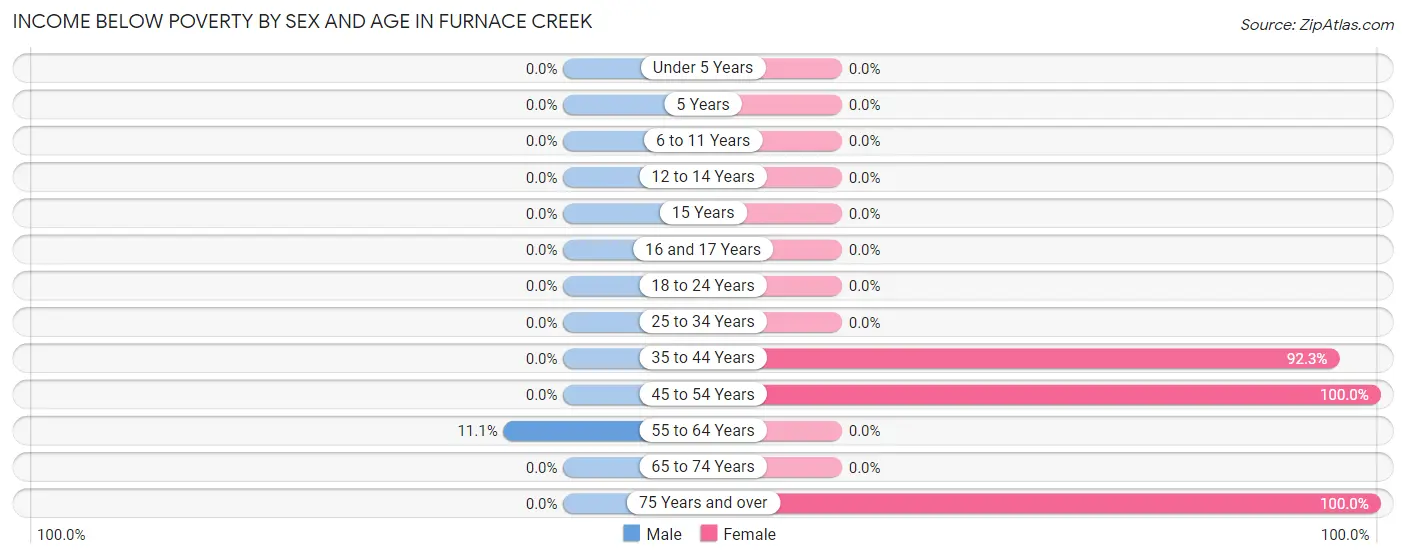
| Age Bracket | Male | Female |
| Under 5 Years | 0 (0.0%) | 0 (0.0%) |
| 5 Years | 0 (0.0%) | 0 (0.0%) |
| 6 to 11 Years | 0 (0.0%) | 0 (0.0%) |
| 12 to 14 Years | 0 (0.0%) | 0 (0.0%) |
| 15 Years | 0 (0.0%) | 0 (0.0%) |
| 16 and 17 Years | 0 (0.0%) | 0 (0.0%) |
| 18 to 24 Years | 0 (0.0%) | 0 (0.0%) |
| 25 to 34 Years | 0 (0.0%) | 0 (0.0%) |
| 35 to 44 Years | 0 (0.0%) | 24 (92.3%) |
| 45 to 54 Years | 0 (0.0%) | 12 (100.0%) |
| 55 to 64 Years | 2 (11.1%) | 0 (0.0%) |
| 65 to 74 Years | 0 (0.0%) | 0 (0.0%) |
| 75 Years and over | 0 (0.0%) | 3 (100.0%) |
| Total | 2 (3.5%) | 39 (53.4%) |
Income Above Poverty by Sex and Age in Furnace Creek
According to the poverty statistics in Furnace Creek, males aged 18 to 24 years and females aged 55 to 64 years are the age groups that are most secure financially, with 100.0% of males and 100.0% of females in these age groups living above the poverty line.
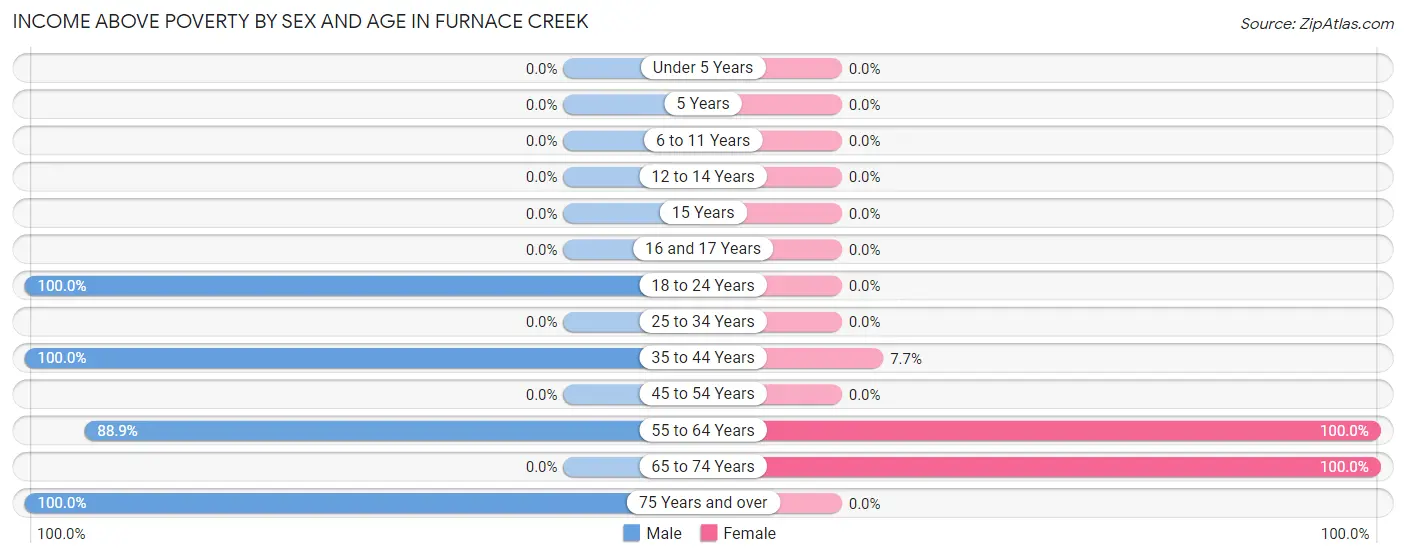
| Age Bracket | Male | Female |
| Under 5 Years | 0 (0.0%) | 0 (0.0%) |
| 5 Years | 0 (0.0%) | 0 (0.0%) |
| 6 to 11 Years | 0 (0.0%) | 0 (0.0%) |
| 12 to 14 Years | 0 (0.0%) | 0 (0.0%) |
| 15 Years | 0 (0.0%) | 0 (0.0%) |
| 16 and 17 Years | 0 (0.0%) | 0 (0.0%) |
| 18 to 24 Years | 2 (100.0%) | 0 (0.0%) |
| 25 to 34 Years | 0 (0.0%) | 0 (0.0%) |
| 35 to 44 Years | 32 (100.0%) | 2 (7.7%) |
| 45 to 54 Years | 0 (0.0%) | 0 (0.0%) |
| 55 to 64 Years | 16 (88.9%) | 30 (100.0%) |
| 65 to 74 Years | 0 (0.0%) | 2 (100.0%) |
| 75 Years and over | 5 (100.0%) | 0 (0.0%) |
| Total | 55 (96.5%) | 34 (46.6%) |
Income Below Poverty Among Married-Couple Families in Furnace Creek
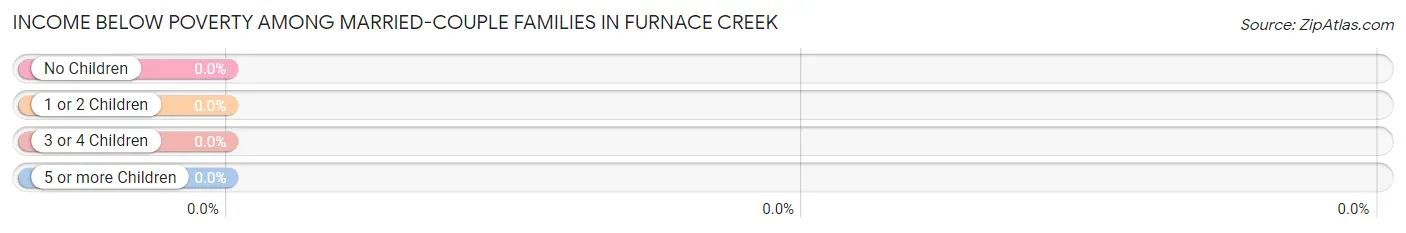
| Children | Above Poverty | Below Poverty |
| No Children | 17 (100.0%) | 0 (0.0%) |
| 1 or 2 Children | 0 (0.0%) | 0 (0.0%) |
| 3 or 4 Children | 0 (0.0%) | 0 (0.0%) |
| 5 or more Children | 0 (0.0%) | 0 (0.0%) |
| Total | 17 (100.0%) | 0 (0.0%) |
Income Below Poverty Among Single-Parent Households in Furnace Creek
| Children | Single Father | Single Mother |
| No Children | 0 (0.0%) | 0 (0.0%) |
| 1 or 2 Children | 0 (0.0%) | 0 (0.0%) |
| 3 or 4 Children | 0 (0.0%) | 0 (0.0%) |
| 5 or more Children | 0 (0.0%) | 0 (0.0%) |
| Total | 0 (0.0%) | 0 (0.0%) |
Income Below Poverty Among Married-Couple vs Single-Parent Households in Furnace Creek
| Children | Married-Couple Families | Single-Parent Households |
| No Children | 0 (0.0%) | 0 (0.0%) |
| 1 or 2 Children | 0 (0.0%) | 0 (0.0%) |
| 3 or 4 Children | 0 (0.0%) | 0 (0.0%) |
| 5 or more Children | 0 (0.0%) | 0 (0.0%) |
| Total | 0 (0.0%) | 0 (0.0%) |
Race in Furnace Creek
The most populous races in Furnace Creek are White / Caucasian (90 | 69.2%), Two or more Races (26 | 20.0%), and Hispanic or Latino (24 | 18.5%).
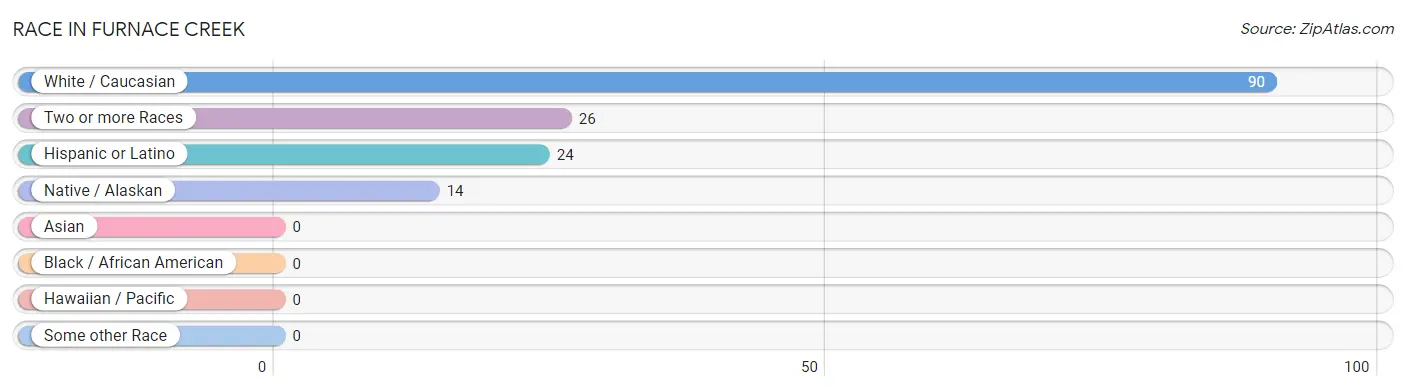
| Race | # Population | % Population |
| Asian | 0 | 0.0% |
| Black / African American | 0 | 0.0% |
| Hawaiian / Pacific | 0 | 0.0% |
| Hispanic or Latino | 24 | 18.5% |
| Native / Alaskan | 14 | 10.8% |
| White / Caucasian | 90 | 69.2% |
| Two or more Races | 26 | 20.0% |
| Some other Race | 0 | 0.0% |
| Total | 130 | 100.0% |
Ancestry in Furnace Creek
The most populous ancestries reported in Furnace Creek are American (42 | 32.3%), German (28 | 21.5%), Mexican (24 | 18.5%), Scottish (17 | 13.1%), and Italian (15 | 11.5%), together accounting for 96.9% of all Furnace Creek residents.
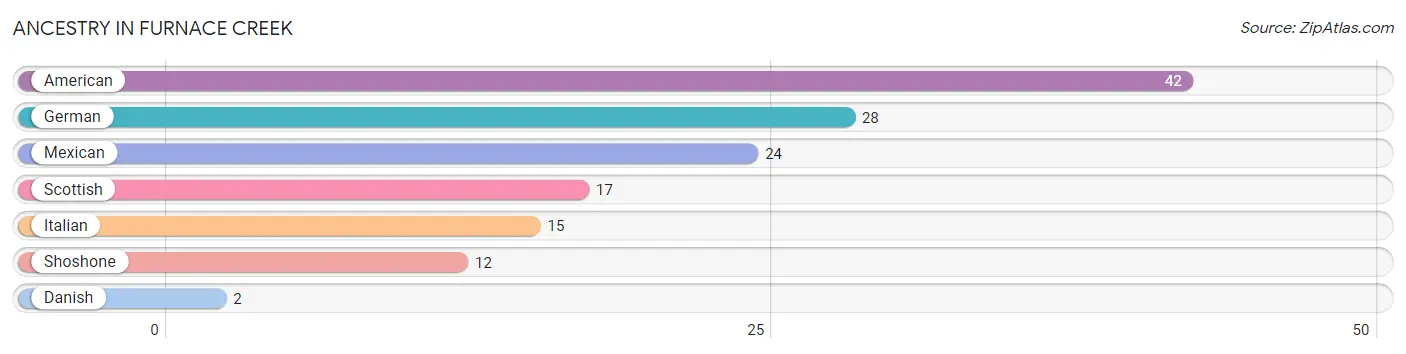
| Ancestry | # Population | % Population |
| American | 42 | 32.3% |
| Danish | 2 | 1.5% |
| German | 28 | 21.5% |
| Italian | 15 | 11.5% |
| Mexican | 24 | 18.5% |
| Scottish | 17 | 13.1% |
| Shoshone | 12 | 9.2% | View All 7 Rows |
Immigrants in Furnace Creek

| Immigration Origin | # Population | % Population | View All 0 Rows |
Sex and Age in Furnace Creek
Sex and Age in Furnace Creek
The most populous age groups in Furnace Creek are 55 to 59 Years (18 | 31.6%) for men and 35 to 39 Years (24 | 32.9%) for women.
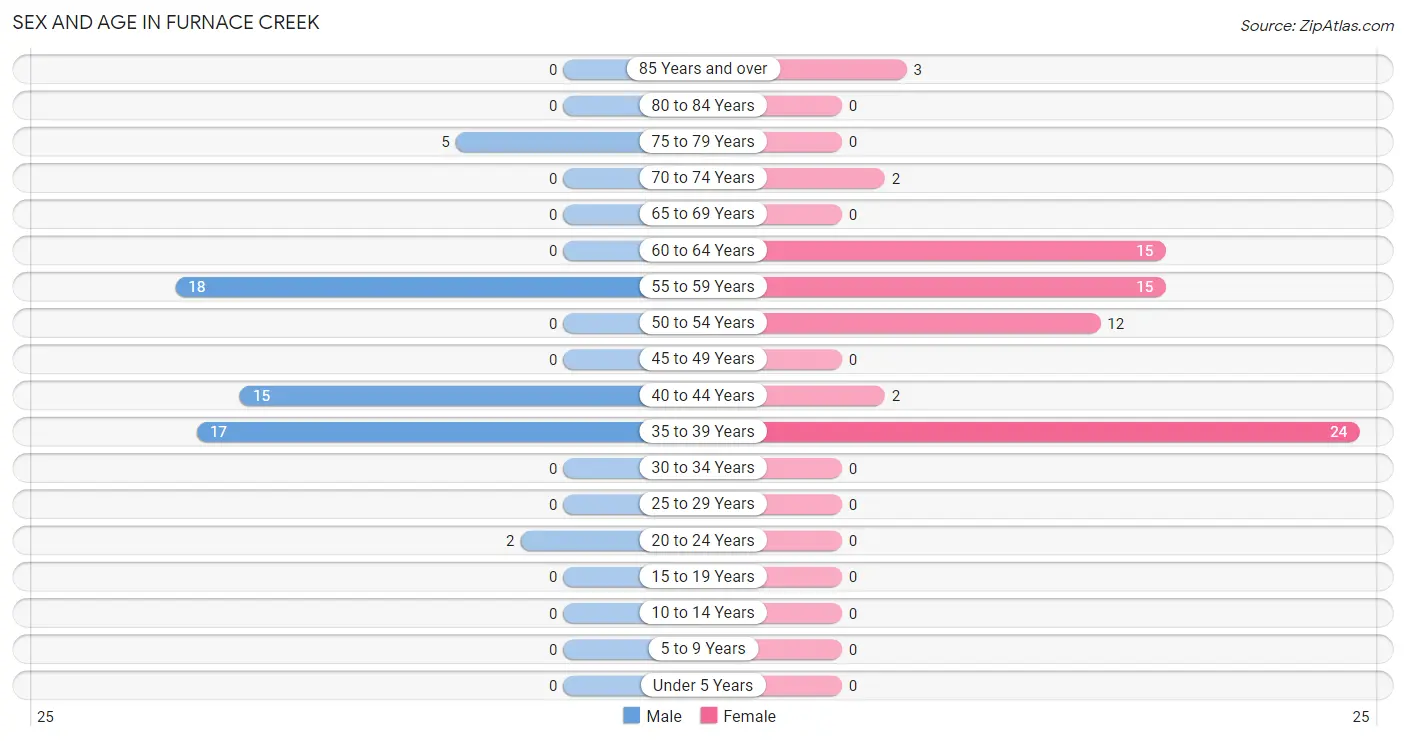
| Age Bracket | Male | Female |
| Under 5 Years | 0 (0.0%) | 0 (0.0%) |
| 5 to 9 Years | 0 (0.0%) | 0 (0.0%) |
| 10 to 14 Years | 0 (0.0%) | 0 (0.0%) |
| 15 to 19 Years | 0 (0.0%) | 0 (0.0%) |
| 20 to 24 Years | 2 (3.5%) | 0 (0.0%) |
| 25 to 29 Years | 0 (0.0%) | 0 (0.0%) |
| 30 to 34 Years | 0 (0.0%) | 0 (0.0%) |
| 35 to 39 Years | 17 (29.8%) | 24 (32.9%) |
| 40 to 44 Years | 15 (26.3%) | 2 (2.7%) |
| 45 to 49 Years | 0 (0.0%) | 0 (0.0%) |
| 50 to 54 Years | 0 (0.0%) | 12 (16.4%) |
| 55 to 59 Years | 18 (31.6%) | 15 (20.5%) |
| 60 to 64 Years | 0 (0.0%) | 15 (20.5%) |
| 65 to 69 Years | 0 (0.0%) | 0 (0.0%) |
| 70 to 74 Years | 0 (0.0%) | 2 (2.7%) |
| 75 to 79 Years | 5 (8.8%) | 0 (0.0%) |
| 80 to 84 Years | 0 (0.0%) | 0 (0.0%) |
| 85 Years and over | 0 (0.0%) | 3 (4.1%) |
| Total | 57 (100.0%) | 73 (100.0%) |
Families and Households in Furnace Creek
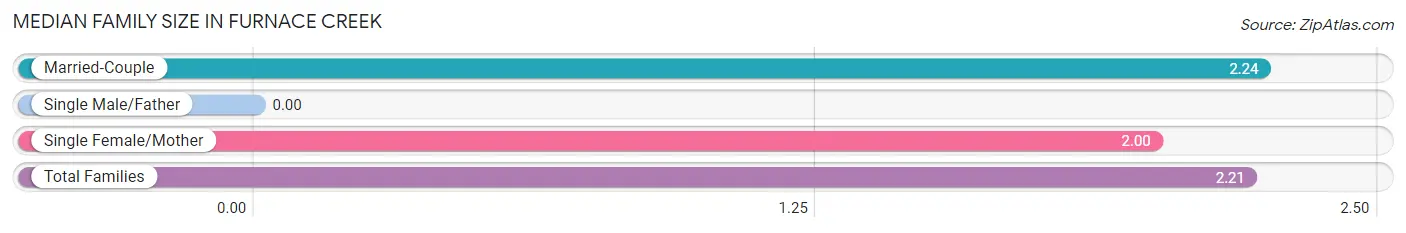
Median Family Size in Furnace Creek
| Family Type | # Families | Family Size |
| Married-Couple | 17 (89.5%) | 2.24 |
| Single Male/Father | 0 (0.0%) | - |
| Single Female/Mother | 2 (10.5%) | 2.00 |
| Total Families | 19 (100.0%) | 2.21 |
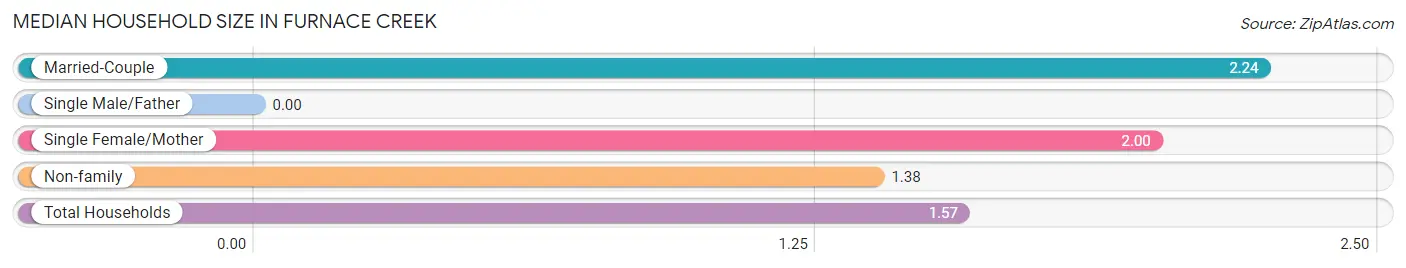
Median Household Size in Furnace Creek
| Household Type | # Households | Household Size |
| Married-Couple | 17 (20.5%) | 2.24 |
| Single Male/Father | 0 (0.0%) | - |
| Single Female/Mother | 2 (2.4%) | 2.00 |
| Non-family | 64 (77.1%) | 1.38 |
| Total Households | 83 (100.0%) | 1.57 |
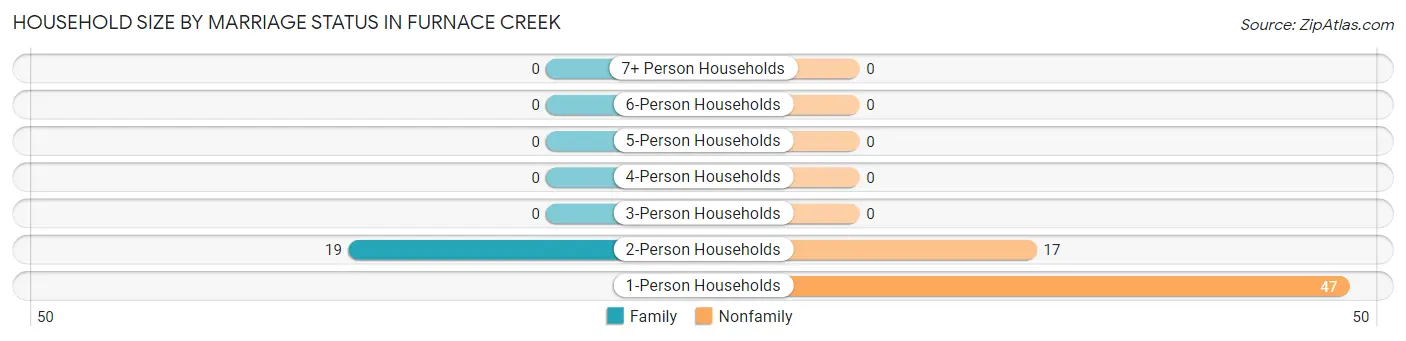
Household Size by Marriage Status in Furnace Creek
Out of a total of 83 households in Furnace Creek, 19 (22.9%) are family households, while 64 (77.1%) are nonfamily households. The most numerous type of family households are 2-person households, comprising 19, and the most common type of nonfamily households are 1-person households, comprising 47.
| Household Size | Family Households | Nonfamily Households |
| 1-Person Households | - | 47 (56.6%) |
| 2-Person Households | 19 (22.9%) | 17 (20.5%) |
| 3-Person Households | 0 (0.0%) | 0 (0.0%) |
| 4-Person Households | 0 (0.0%) | 0 (0.0%) |
| 5-Person Households | 0 (0.0%) | 0 (0.0%) |
| 6-Person Households | 0 (0.0%) | 0 (0.0%) |
| 7+ Person Households | 0 (0.0%) | 0 (0.0%) |
| Total | 19 (22.9%) | 64 (77.1%) |
Female Fertility in Furnace Creek
Fertility by Age in Furnace Creek
| Age Bracket | Women with Births | Births / 1,000 Women |
| 15 to 19 years | 0 (0.0%) | 0.0 |
| 20 to 34 years | 0 (0.0%) | 0.0 |
| 35 to 50 years | 0 (0.0%) | 0.0 |
| Total | 0 (0.0%) | 0.0 |
Fertility by Age by Marriage Status in Furnace Creek
| Age Bracket | Married | Unmarried |
| 15 to 19 years | 0 (0.0%) | 0 (0.0%) |
| 20 to 34 years | 0 (0.0%) | 0 (0.0%) |
| 35 to 50 years | 0 (0.0%) | 0 (0.0%) |
| Total | 0 (0.0%) | 0 (0.0%) |
Fertility by Education in Furnace Creek
| Educational Attainment | Women with Births | Births / 1,000 Women |
| Less than High School | 0 (0.0%) | 0.0 |
| High School Diploma | 0 (0.0%) | 0.0 |
| College or Associate's Degree | 0 (0.0%) | 0.0 |
| Bachelor's Degree | 0 (0.0%) | 0.0 |
| Graduate Degree | 0 (0.0%) | 0.0 |
| Total | 0 (0.0%) | 0.0 |
Fertility by Education by Marriage Status in Furnace Creek
| Educational Attainment | Married | Unmarried |
| Less than High School | 0 (0.0%) | 0 (0.0%) |
| High School Diploma | 0 (0.0%) | 0 (0.0%) |
| College or Associate's Degree | 0 (0.0%) | 0 (0.0%) |
| Bachelor's Degree | 0 (0.0%) | 0 (0.0%) |
| Graduate Degree | 0 (0.0%) | 0 (0.0%) |
| Total | 0 (0.0%) | 0 (0.0%) |
Employment Characteristics in Furnace Creek
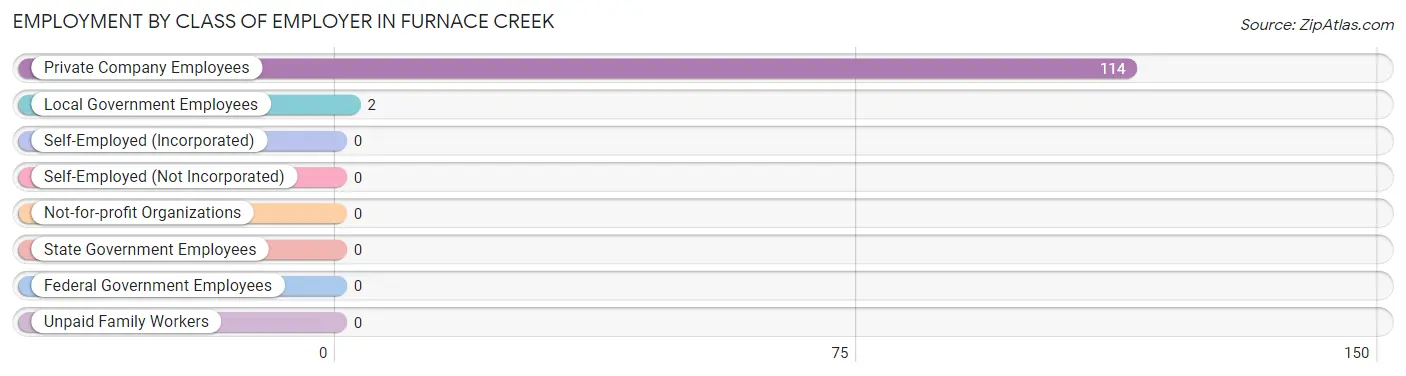
Employment by Class of Employer in Furnace Creek
Among the 116 employed individuals in Furnace Creek, private company employees (114 | 98.3%), and local government employees (2 | 1.7%) make up the most common classes of employment.
| Employer Class | # Employees | % Employees |
| Private Company Employees | 114 | 98.3% |
| Self-Employed (Incorporated) | 0 | 0.0% |
| Self-Employed (Not Incorporated) | 0 | 0.0% |
| Not-for-profit Organizations | 0 | 0.0% |
| Local Government Employees | 2 | 1.7% |
| State Government Employees | 0 | 0.0% |
| Federal Government Employees | 0 | 0.0% |
| Unpaid Family Workers | 0 | 0.0% |
| Total | 116 | 100.0% |
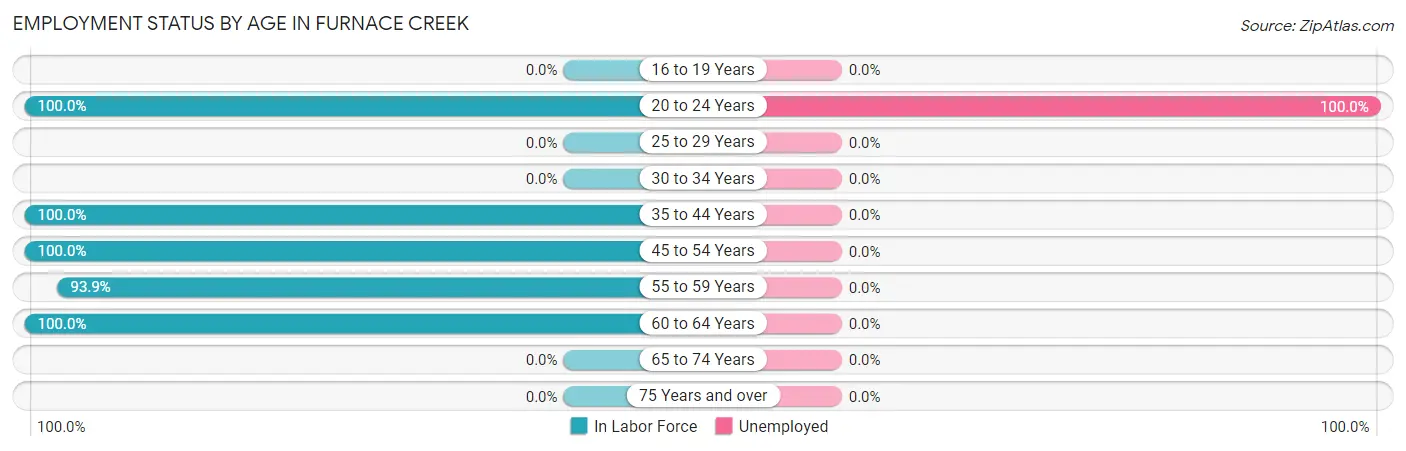
Employment Status by Age in Furnace Creek
According to the labor force statistics for Furnace Creek, out of the total population over 16 years of age (130), 90.8% or 118 individuals are in the labor force, with 1.7% or 2 of them unemployed. The age group with the highest labor force participation rate is 20 to 24 years, with 100.0% or 2 individuals in the labor force. Within the labor force, the 20 to 24 years age range has the highest percentage of unemployed individuals, with 100.0% or 2 of them being unemployed.
| Age Bracket | In Labor Force | Unemployed |
| 16 to 19 Years | 0 (0.0%) | 0 (0.0%) |
| 20 to 24 Years | 2 (100.0%) | 2 (100.0%) |
| 25 to 29 Years | 0 (0.0%) | 0 (0.0%) |
| 30 to 34 Years | 0 (0.0%) | 0 (0.0%) |
| 35 to 44 Years | 58 (100.0%) | 0 (0.0%) |
| 45 to 54 Years | 12 (100.0%) | 0 (0.0%) |
| 55 to 59 Years | 31 (93.9%) | 0 (0.0%) |
| 60 to 64 Years | 15 (100.0%) | 0 (0.0%) |
| 65 to 74 Years | 0 (0.0%) | 0 (0.0%) |
| 75 Years and over | 0 (0.0%) | 0 (0.0%) |
| Total | 118 (90.8%) | 2 (1.7%) |
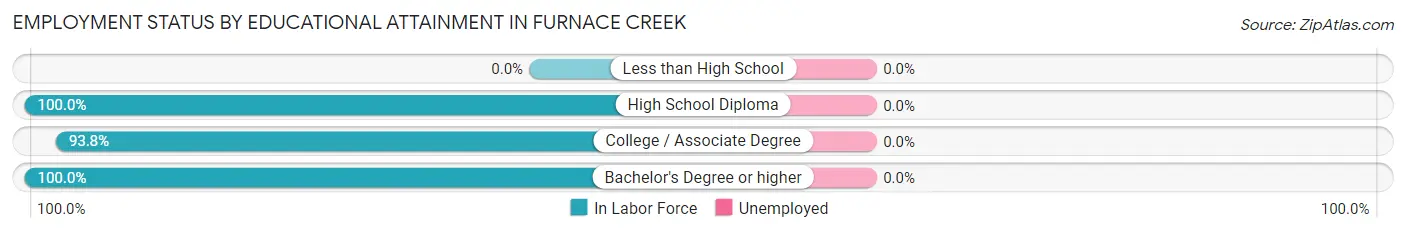
Employment Status by Educational Attainment in Furnace Creek
| Educational Attainment | In Labor Force | Unemployed |
| Less than High School | 0 (0.0%) | 0 (0.0%) |
| High School Diploma | 35 (100.0%) | 0 (0.0%) |
| College / Associate Degree | 30 (93.8%) | 0 (0.0%) |
| Bachelor's Degree or higher | 51 (100.0%) | 0 (0.0%) |
| Total | 116 (98.3%) | 0 (0.0%) |
Employment Occupations by Sex in Furnace Creek
Management, Business, Science and Arts Occupations
The most common Management, Business, Science and Arts occupations in Furnace Creek are Business & Financial (12 | 10.3%), and Management (2 | 1.7%).
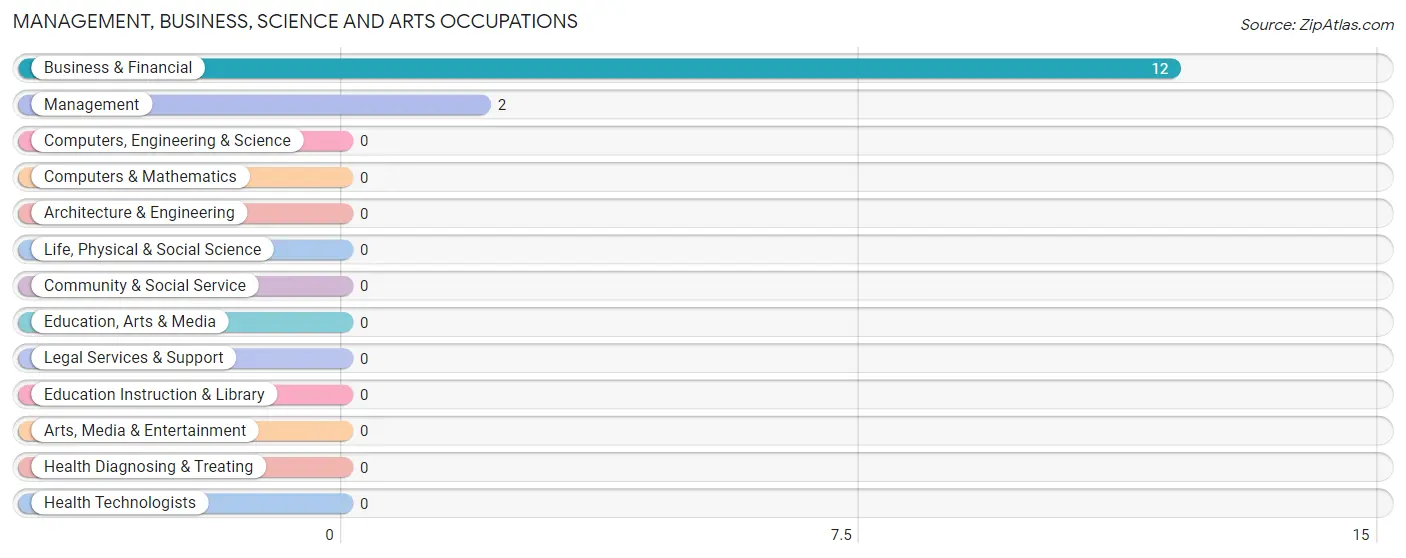
Management, Business, Science and Arts Occupations by Sex
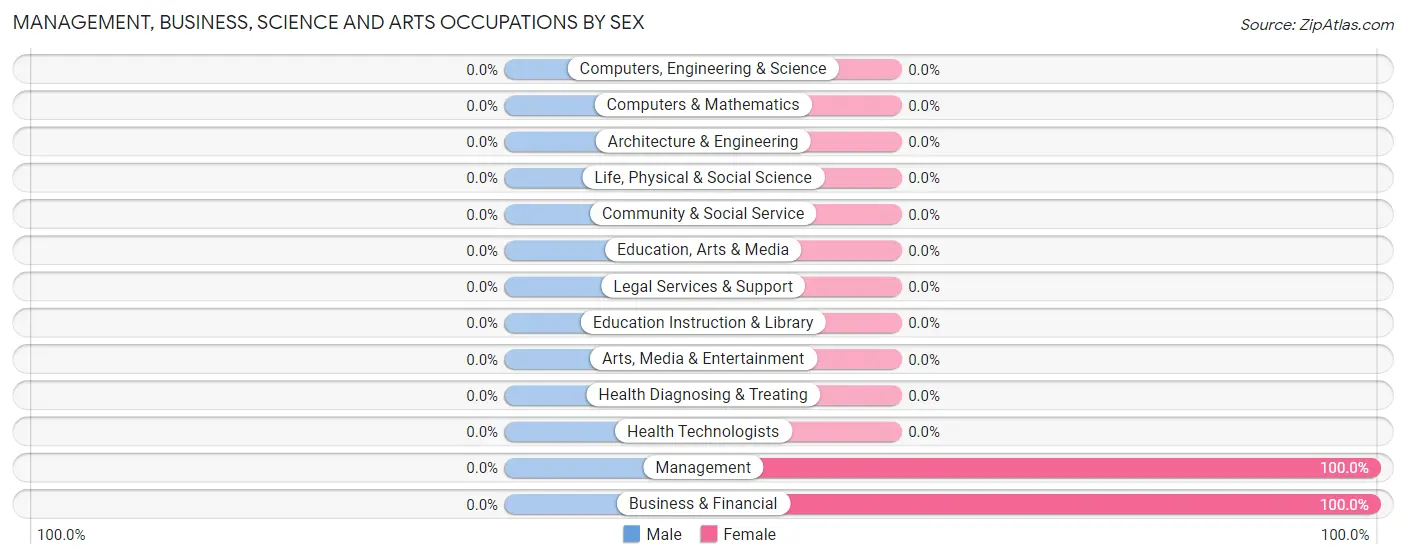
| Occupation | Male | Female |
| Management | 0 (0.0%) | 2 (100.0%) |
| Business & Financial | 0 (0.0%) | 12 (100.0%) |
| Computers, Engineering & Science | 0 (0.0%) | 0 (0.0%) |
| Computers & Mathematics | 0 (0.0%) | 0 (0.0%) |
| Architecture & Engineering | 0 (0.0%) | 0 (0.0%) |
| Life, Physical & Social Science | 0 (0.0%) | 0 (0.0%) |
| Community & Social Service | 0 (0.0%) | 0 (0.0%) |
| Education, Arts & Media | 0 (0.0%) | 0 (0.0%) |
| Legal Services & Support | 0 (0.0%) | 0 (0.0%) |
| Education Instruction & Library | 0 (0.0%) | 0 (0.0%) |
| Arts, Media & Entertainment | 0 (0.0%) | 0 (0.0%) |
| Health Diagnosing & Treating | 0 (0.0%) | 0 (0.0%) |
| Health Technologists | 0 (0.0%) | 0 (0.0%) |
| Total (Category) | 0 (0.0%) | 14 (100.0%) |
| Total (Overall) | 48 (41.4%) | 68 (58.6%) |
Services Occupations
The most common Services occupations in Furnace Creek are , and Food Preparation & Serving (41 | 35.3%).
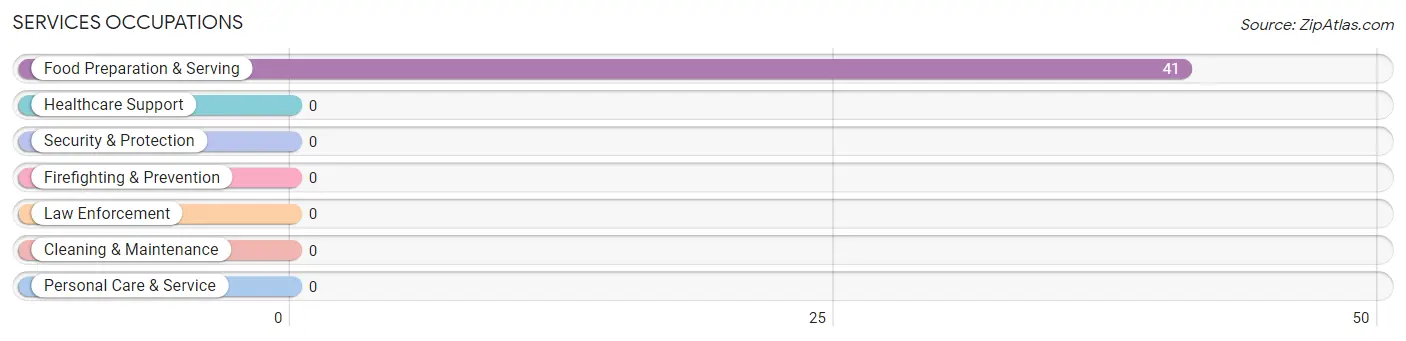
Services Occupations by Sex
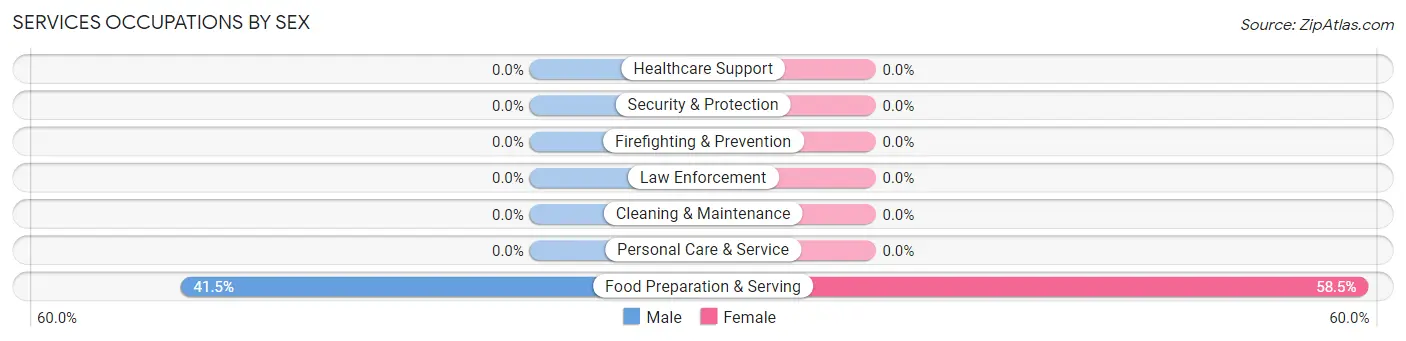
| Occupation | Male | Female |
| Healthcare Support | 0 (0.0%) | 0 (0.0%) |
| Security & Protection | 0 (0.0%) | 0 (0.0%) |
| Firefighting & Prevention | 0 (0.0%) | 0 (0.0%) |
| Law Enforcement | 0 (0.0%) | 0 (0.0%) |
| Food Preparation & Serving | 17 (41.5%) | 24 (58.5%) |
| Cleaning & Maintenance | 0 (0.0%) | 0 (0.0%) |
| Personal Care & Service | 0 (0.0%) | 0 (0.0%) |
| Total (Category) | 17 (41.5%) | 24 (58.5%) |
| Total (Overall) | 48 (41.4%) | 68 (58.6%) |
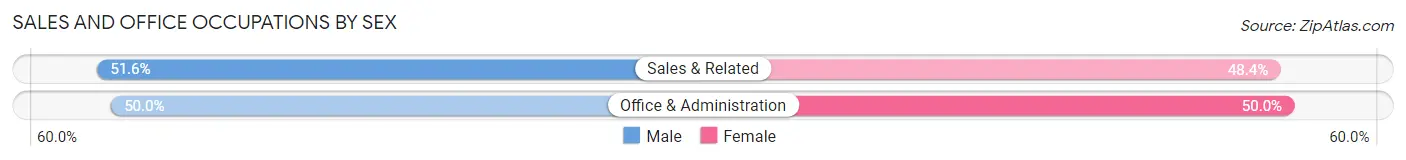
Sales and Office Occupations
The most common Sales and Office occupations in Furnace Creek are Sales & Related (31 | 26.7%), and Office & Administration (30 | 25.9%).
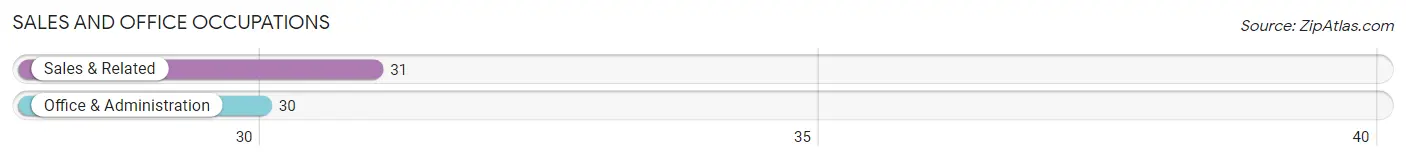
Sales and Office Occupations by Sex
| Occupation | Male | Female |
| Sales & Related | 16 (51.6%) | 15 (48.4%) |
| Office & Administration | 15 (50.0%) | 15 (50.0%) |
| Total (Category) | 31 (50.8%) | 30 (49.2%) |
| Total (Overall) | 48 (41.4%) | 68 (58.6%) |
Natural Resources, Construction and Maintenance Occupations
Natural Resources, Construction and Maintenance Occupations by Sex
| Occupation | Male | Female |
| Farming, Fishing & Forestry | 0 (0.0%) | 0 (0.0%) |
| Construction & Extraction | 0 (0.0%) | 0 (0.0%) |
| Installation, Maintenance & Repair | 0 (0.0%) | 0 (0.0%) |
| Total (Category) | 0 (0.0%) | 0 (0.0%) |
| Total (Overall) | 48 (41.4%) | 68 (58.6%) |
Production, Transportation and Moving Occupations
Production, Transportation and Moving Occupations by Sex
| Occupation | Male | Female |
| Production | 0 (0.0%) | 0 (0.0%) |
| Transportation | 0 (0.0%) | 0 (0.0%) |
| Material Moving | 0 (0.0%) | 0 (0.0%) |
| Total (Category) | 0 (0.0%) | 0 (0.0%) |
| Total (Overall) | 48 (41.4%) | 68 (58.6%) |
Employment Industries by Sex in Furnace Creek
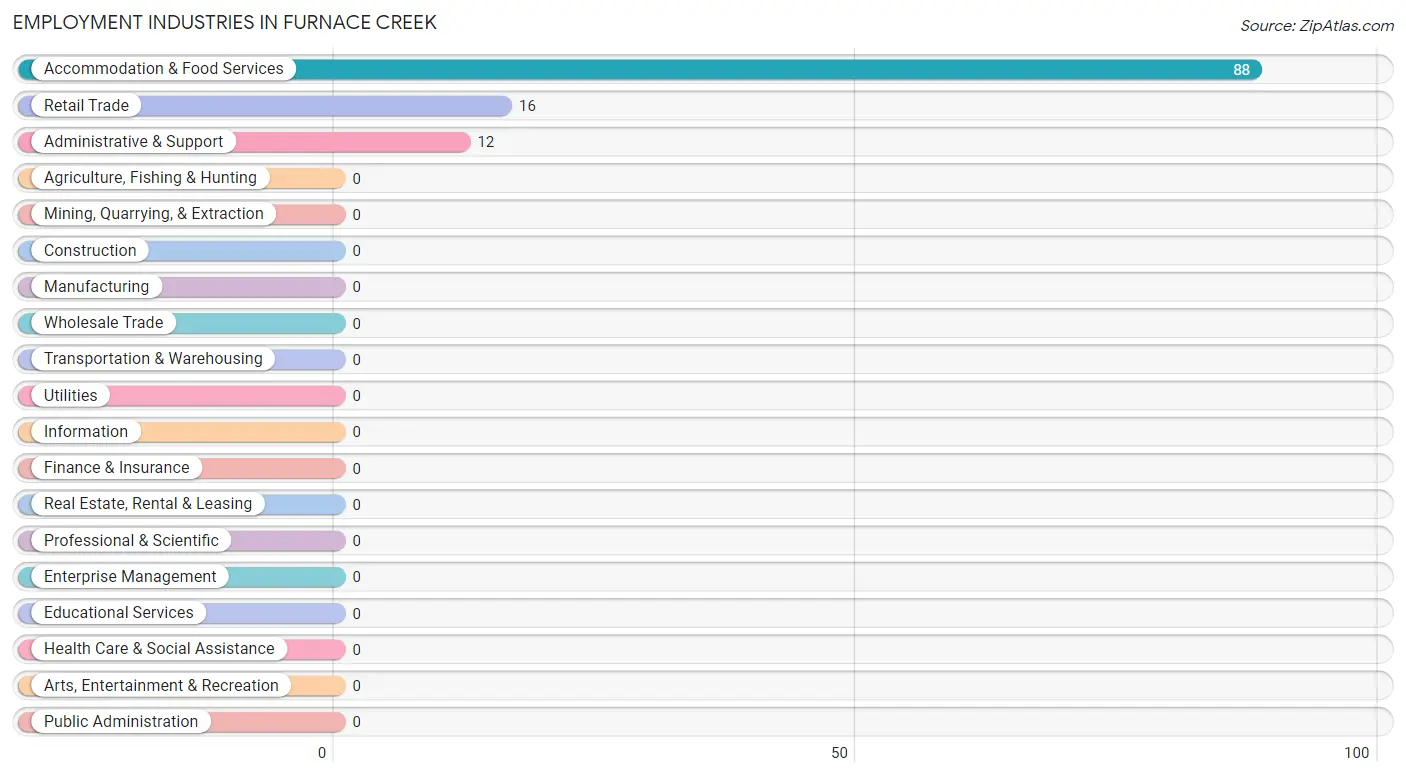
Employment Industries in Furnace Creek
The major employment industries in Furnace Creek include Accommodation & Food Services (88 | 75.9%), Retail Trade (16 | 13.8%), and Administrative & Support (12 | 10.3%).
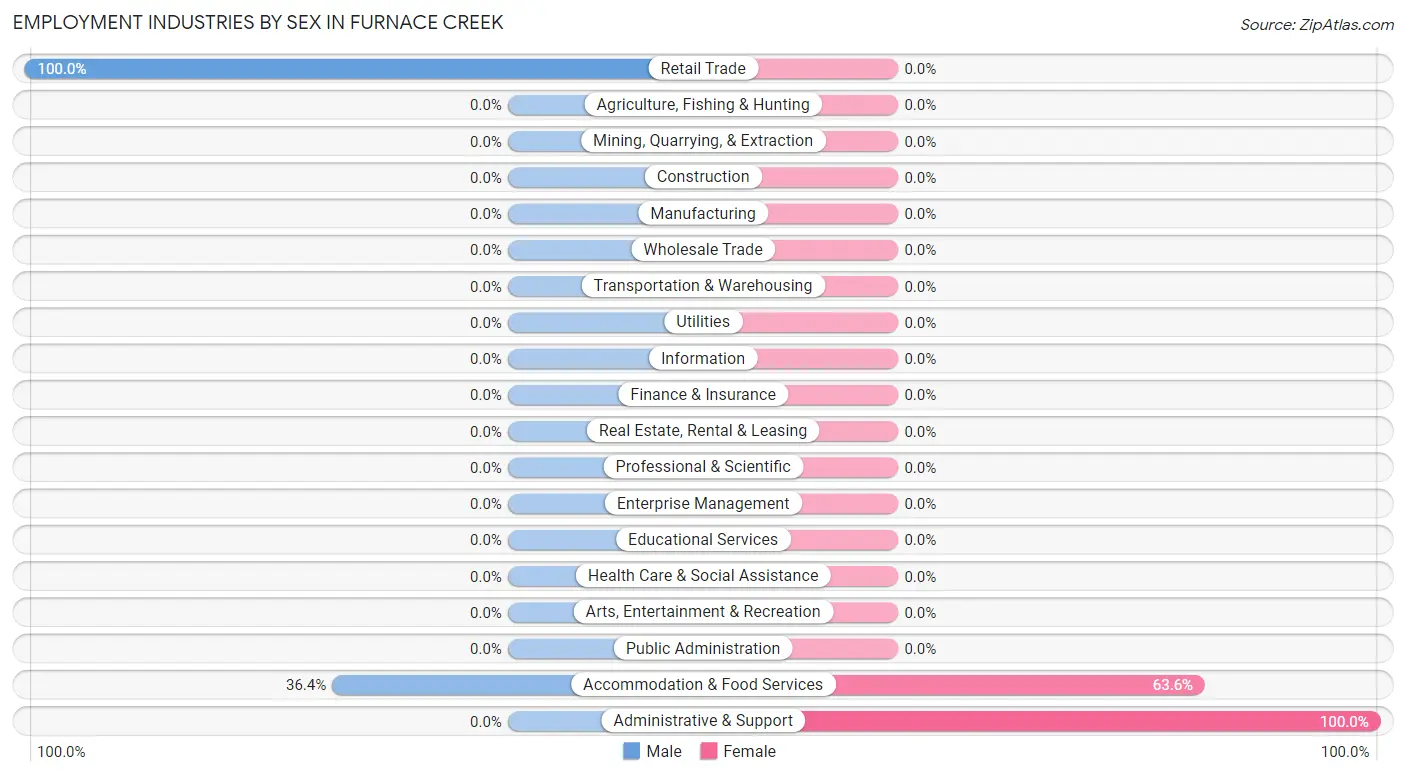
Employment Industries by Sex in Furnace Creek
The Furnace Creek industries that see more men than women are Retail Trade (100.0%), and Accommodation & Food Services (36.4%), whereas the industries that tend to have a higher number of women are Administrative & Support (100.0%), and Accommodation & Food Services (63.6%).
| Industry | Male | Female |
| Agriculture, Fishing & Hunting | 0 (0.0%) | 0 (0.0%) |
| Mining, Quarrying, & Extraction | 0 (0.0%) | 0 (0.0%) |
| Construction | 0 (0.0%) | 0 (0.0%) |
| Manufacturing | 0 (0.0%) | 0 (0.0%) |
| Wholesale Trade | 0 (0.0%) | 0 (0.0%) |
| Retail Trade | 16 (100.0%) | 0 (0.0%) |
| Transportation & Warehousing | 0 (0.0%) | 0 (0.0%) |
| Utilities | 0 (0.0%) | 0 (0.0%) |
| Information | 0 (0.0%) | 0 (0.0%) |
| Finance & Insurance | 0 (0.0%) | 0 (0.0%) |
| Real Estate, Rental & Leasing | 0 (0.0%) | 0 (0.0%) |
| Professional & Scientific | 0 (0.0%) | 0 (0.0%) |
| Enterprise Management | 0 (0.0%) | 0 (0.0%) |
| Administrative & Support | 0 (0.0%) | 12 (100.0%) |
| Educational Services | 0 (0.0%) | 0 (0.0%) |
| Health Care & Social Assistance | 0 (0.0%) | 0 (0.0%) |
| Arts, Entertainment & Recreation | 0 (0.0%) | 0 (0.0%) |
| Accommodation & Food Services | 32 (36.4%) | 56 (63.6%) |
| Public Administration | 0 (0.0%) | 0 (0.0%) |
| Total | 48 (41.4%) | 68 (58.6%) |
Education in Furnace Creek
School Enrollment in Furnace Creek
| School Level | # Students | % Students |
| Nursery / Preschool | 0 | 0.0% |
| Kindergarten | 0 | 0.0% |
| Elementary School | 0 | 0.0% |
| Middle School | 0 | 0.0% |
| High School | 0 | 0.0% |
| College / Undergraduate | 0 | 0.0% |
| Graduate / Professional | 0 | 0.0% |
| Total | 0 | 0.0% |
School Enrollment by Age by Funding Source in Furnace Creek
| Age Bracket | Public School | Private School |
| 3 to 4 Year Olds | 0 (0.0%) | 0 (0.0%) |
| 5 to 9 Year Old | 0 (0.0%) | 0 (0.0%) |
| 10 to 14 Year Olds | 0 (0.0%) | 0 (0.0%) |
| 15 to 17 Year Olds | 0 (0.0%) | 0 (0.0%) |
| 18 to 19 Year Olds | 0 (0.0%) | 0 (0.0%) |
| 20 to 24 Year Olds | 0 (0.0%) | 0 (0.0%) |
| 25 to 34 Year Olds | 0 (0.0%) | 0 (0.0%) |
| 35 Years and over | 0 (0.0%) | 0 (0.0%) |
| Total | 0 (0.0%) | 0 (0.0%) |
Educational Attainment by Field of Study in Furnace Creek
Communications (24 | 47.1%), business (15 | 29.4%), and visual & performing arts (12 | 23.5%) are the most common fields of study among 51 individuals in Furnace Creek who have obtained a bachelor's degree or higher.
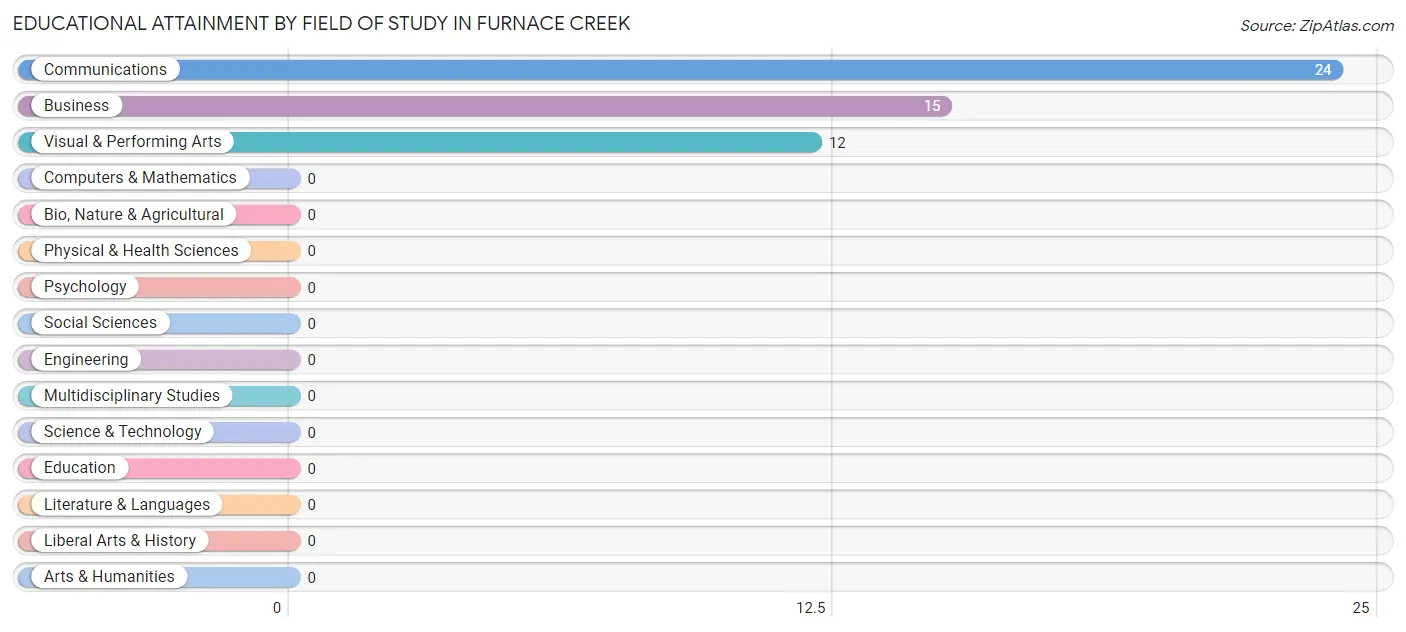
| Field of Study | # Graduates | % Graduates |
| Computers & Mathematics | 0 | 0.0% |
| Bio, Nature & Agricultural | 0 | 0.0% |
| Physical & Health Sciences | 0 | 0.0% |
| Psychology | 0 | 0.0% |
| Social Sciences | 0 | 0.0% |
| Engineering | 0 | 0.0% |
| Multidisciplinary Studies | 0 | 0.0% |
| Science & Technology | 0 | 0.0% |
| Business | 15 | 29.4% |
| Education | 0 | 0.0% |
| Literature & Languages | 0 | 0.0% |
| Liberal Arts & History | 0 | 0.0% |
| Visual & Performing Arts | 12 | 23.5% |
| Communications | 24 | 47.1% |
| Arts & Humanities | 0 | 0.0% |
| Total | 51 | 100.0% |
Transportation & Commute in Furnace Creek
Vehicle Availability by Sex in Furnace Creek
The most prevalent vehicle ownership categories in Furnace Creek are males with 1 vehicle (48, accounting for 100.0%) and females with 1 vehicle (66, making up 70.6%).
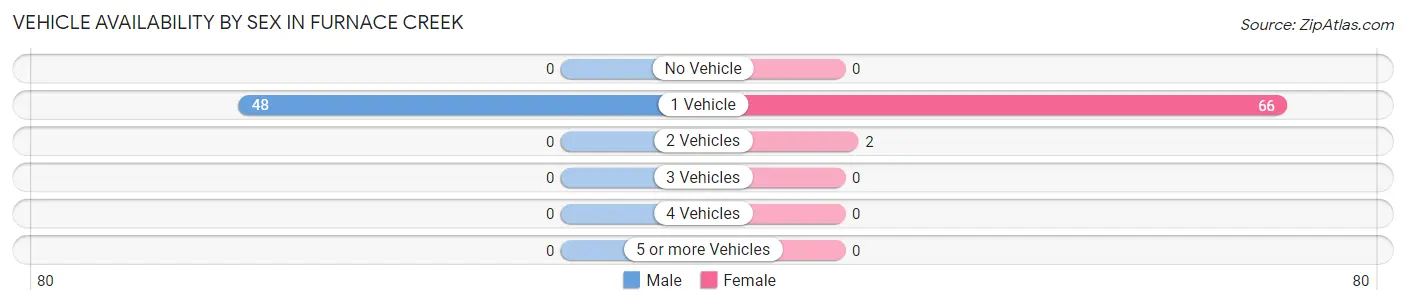
| Vehicles Available | Male | Female |
| No Vehicle | 0 (0.0%) | 0 (0.0%) |
| 1 Vehicle | 48 (100.0%) | 66 (97.1%) |
| 2 Vehicles | 0 (0.0%) | 2 (2.9%) |
| 3 Vehicles | 0 (0.0%) | 0 (0.0%) |
| 4 Vehicles | 0 (0.0%) | 0 (0.0%) |
| 5 or more Vehicles | 0 (0.0%) | 0 (0.0%) |
| Total | 48 (100.0%) | 68 (100.0%) |
Commute Time in Furnace Creek
The most frequently occuring commute durations in Furnace Creek are 5 to 9 minutes (54 commuters, 46.6%), less than 5 minutes (45 commuters, 38.8%), and 10 to 14 minutes (17 commuters, 14.7%).
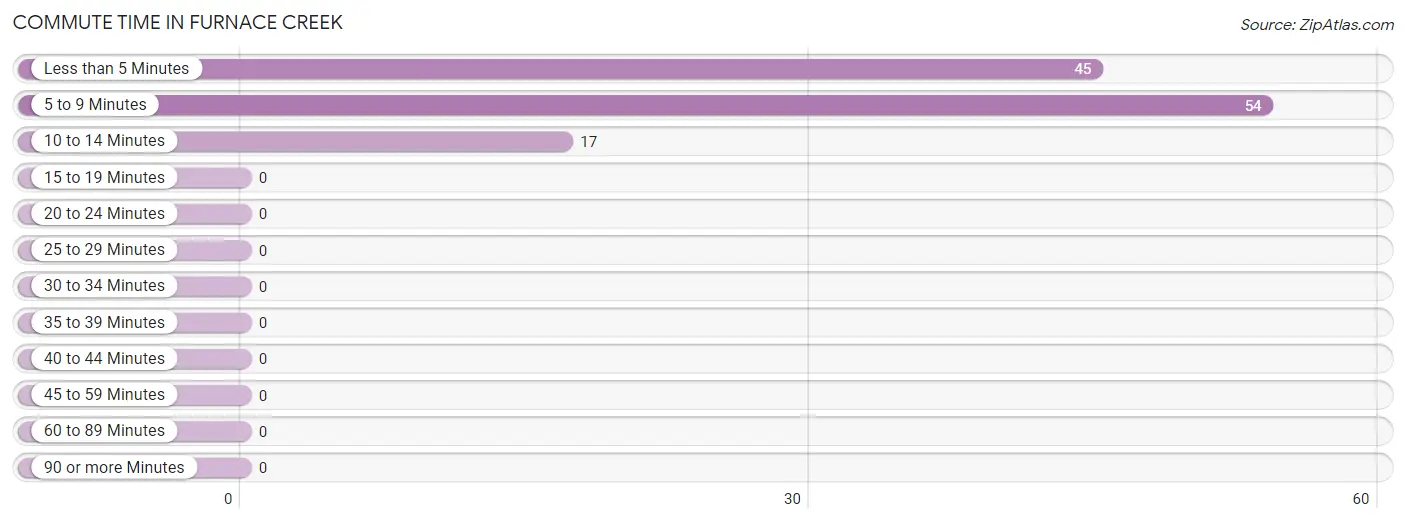
| Commute Time | # Commuters | % Commuters |
| Less than 5 Minutes | 45 | 38.8% |
| 5 to 9 Minutes | 54 | 46.6% |
| 10 to 14 Minutes | 17 | 14.7% |
| 15 to 19 Minutes | 0 | 0.0% |
| 20 to 24 Minutes | 0 | 0.0% |
| 25 to 29 Minutes | 0 | 0.0% |
| 30 to 34 Minutes | 0 | 0.0% |
| 35 to 39 Minutes | 0 | 0.0% |
| 40 to 44 Minutes | 0 | 0.0% |
| 45 to 59 Minutes | 0 | 0.0% |
| 60 to 89 Minutes | 0 | 0.0% |
| 90 or more Minutes | 0 | 0.0% |
Commute Time by Sex in Furnace Creek
The most common commute times in Furnace Creek are 10 to 14 minutes (17 commuters, 35.4%) for males and 5 to 9 minutes (39 commuters, 57.4%) for females.
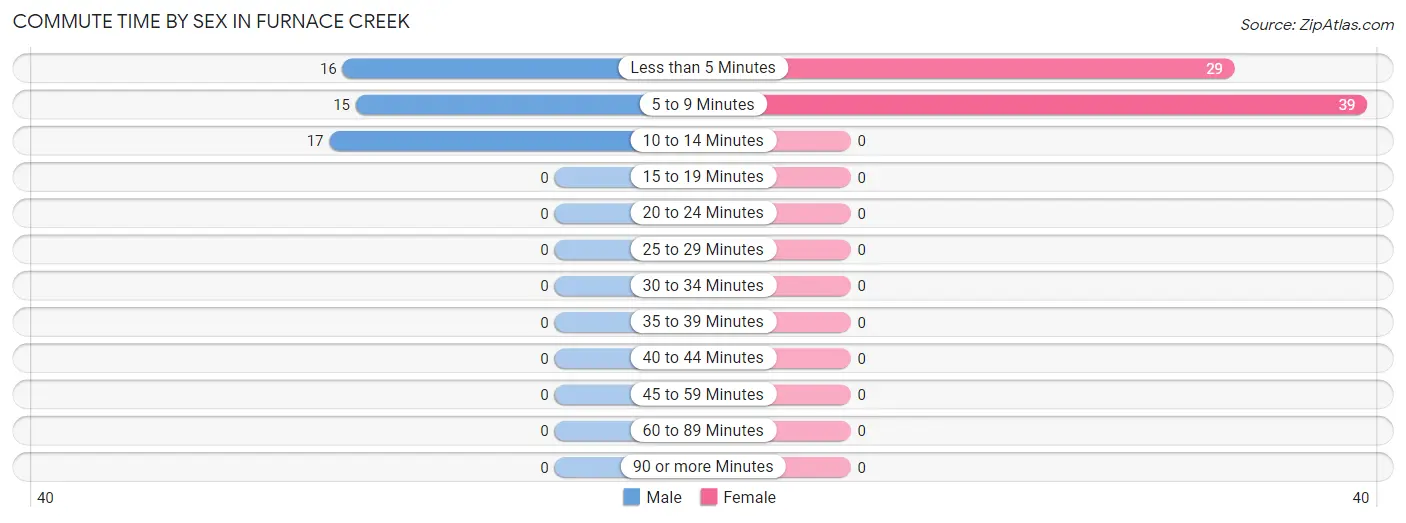
| Commute Time | Male | Female |
| Less than 5 Minutes | 16 (33.3%) | 29 (42.6%) |
| 5 to 9 Minutes | 15 (31.2%) | 39 (57.4%) |
| 10 to 14 Minutes | 17 (35.4%) | 0 (0.0%) |
| 15 to 19 Minutes | 0 (0.0%) | 0 (0.0%) |
| 20 to 24 Minutes | 0 (0.0%) | 0 (0.0%) |
| 25 to 29 Minutes | 0 (0.0%) | 0 (0.0%) |
| 30 to 34 Minutes | 0 (0.0%) | 0 (0.0%) |
| 35 to 39 Minutes | 0 (0.0%) | 0 (0.0%) |
| 40 to 44 Minutes | 0 (0.0%) | 0 (0.0%) |
| 45 to 59 Minutes | 0 (0.0%) | 0 (0.0%) |
| 60 to 89 Minutes | 0 (0.0%) | 0 (0.0%) |
| 90 or more Minutes | 0 (0.0%) | 0 (0.0%) |
Time of Departure to Work by Sex in Furnace Creek
The most frequent times of departure to work in Furnace Creek are 9:00 AM to 9:59 AM (17, 35.4%) for males and 12:00 PM to 3:59 PM (39, 57.4%) for females.
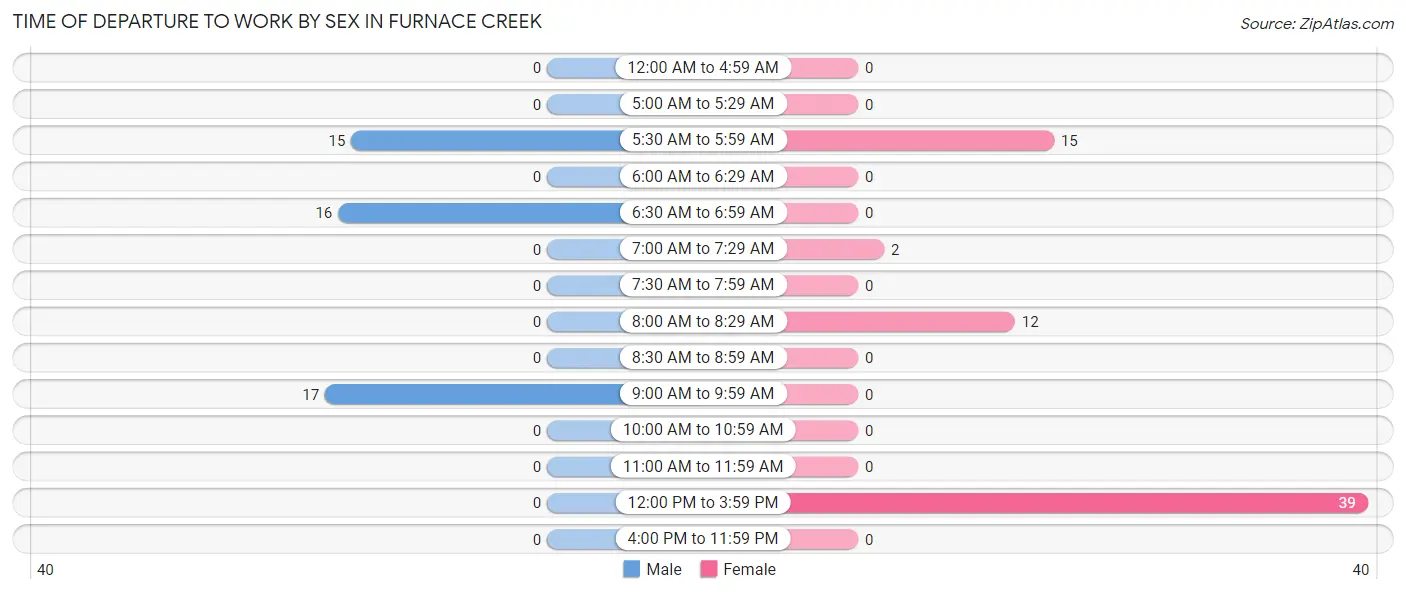
| Time of Departure | Male | Female |
| 12:00 AM to 4:59 AM | 0 (0.0%) | 0 (0.0%) |
| 5:00 AM to 5:29 AM | 0 (0.0%) | 0 (0.0%) |
| 5:30 AM to 5:59 AM | 15 (31.2%) | 15 (22.1%) |
| 6:00 AM to 6:29 AM | 0 (0.0%) | 0 (0.0%) |
| 6:30 AM to 6:59 AM | 16 (33.3%) | 0 (0.0%) |
| 7:00 AM to 7:29 AM | 0 (0.0%) | 2 (2.9%) |
| 7:30 AM to 7:59 AM | 0 (0.0%) | 0 (0.0%) |
| 8:00 AM to 8:29 AM | 0 (0.0%) | 12 (17.6%) |
| 8:30 AM to 8:59 AM | 0 (0.0%) | 0 (0.0%) |
| 9:00 AM to 9:59 AM | 17 (35.4%) | 0 (0.0%) |
| 10:00 AM to 10:59 AM | 0 (0.0%) | 0 (0.0%) |
| 11:00 AM to 11:59 AM | 0 (0.0%) | 0 (0.0%) |
| 12:00 PM to 3:59 PM | 0 (0.0%) | 39 (57.4%) |
| 4:00 PM to 11:59 PM | 0 (0.0%) | 0 (0.0%) |
| Total | 48 (100.0%) | 68 (100.0%) |
Housing Occupancy in Furnace Creek
Occupancy by Ownership in Furnace Creek
Of the total 83 dwellings in Furnace Creek, owner-occupied units account for 21 (25.3%), while renter-occupied units make up 62 (74.7%).
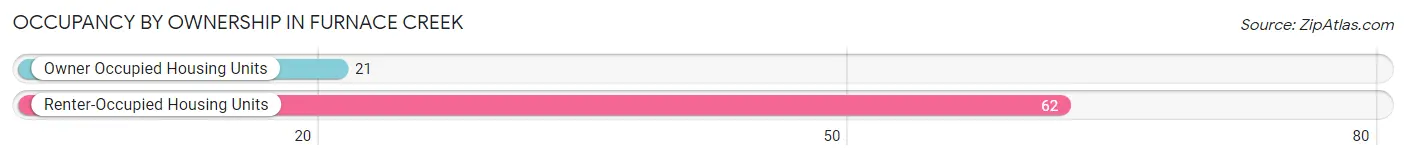
| Occupancy | # Housing Units | % Housing Units |
| Owner Occupied Housing Units | 21 | 25.3% |
| Renter-Occupied Housing Units | 62 | 74.7% |
| Total Occupied Housing Units | 83 | 100.0% |
Occupancy by Household Size in Furnace Creek
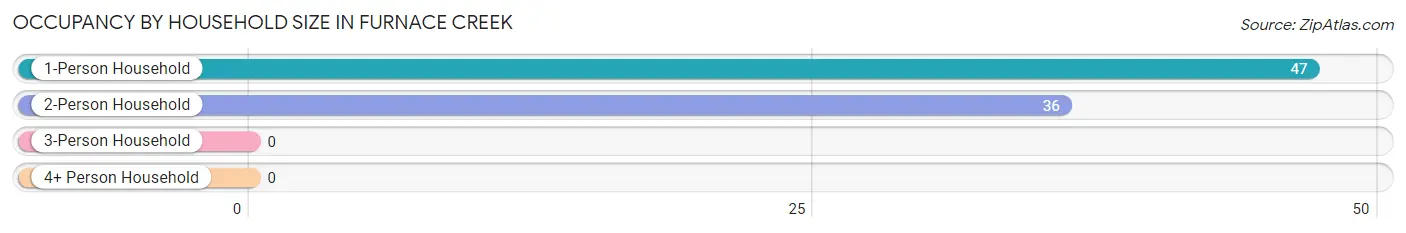
| Household Size | # Housing Units | % Housing Units |
| 1-Person Household | 47 | 56.6% |
| 2-Person Household | 36 | 43.4% |
| 3-Person Household | 0 | 0.0% |
| 4+ Person Household | 0 | 0.0% |
| Total Housing Units | 83 | 100.0% |
Occupancy by Ownership by Household Size in Furnace Creek
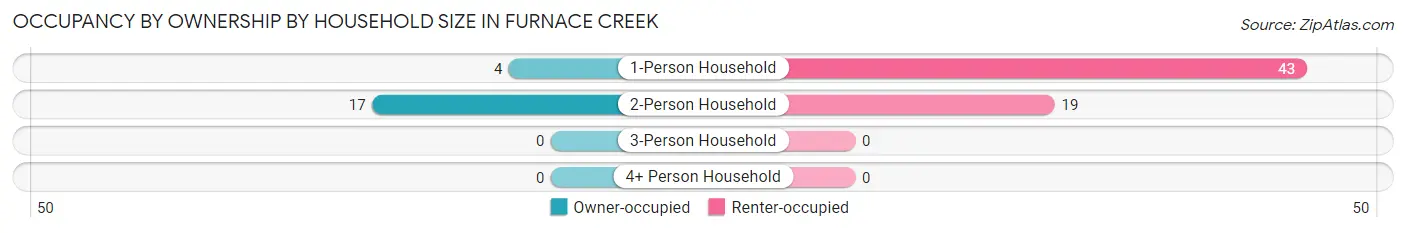
| Household Size | Owner-occupied | Renter-occupied |
| 1-Person Household | 4 (8.5%) | 43 (91.5%) |
| 2-Person Household | 17 (47.2%) | 19 (52.8%) |
| 3-Person Household | 0 (0.0%) | 0 (0.0%) |
| 4+ Person Household | 0 (0.0%) | 0 (0.0%) |
| Total Housing Units | 21 (25.3%) | 62 (74.7%) |
Occupancy by Educational Attainment in Furnace Creek
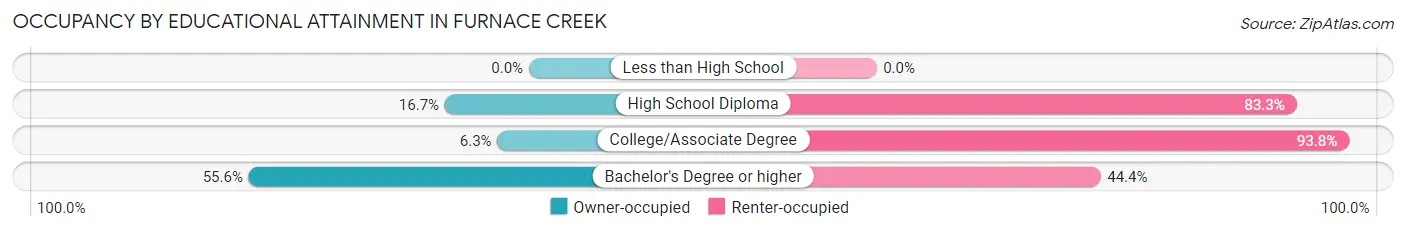
| Household Size | Owner-occupied | Renter-occupied |
| Less than High School | 0 (0.0%) | 0 (0.0%) |
| High School Diploma | 4 (16.7%) | 20 (83.3%) |
| College/Associate Degree | 2 (6.2%) | 30 (93.8%) |
| Bachelor's Degree or higher | 15 (55.6%) | 12 (44.4%) |
Occupancy by Age of Householder in Furnace Creek
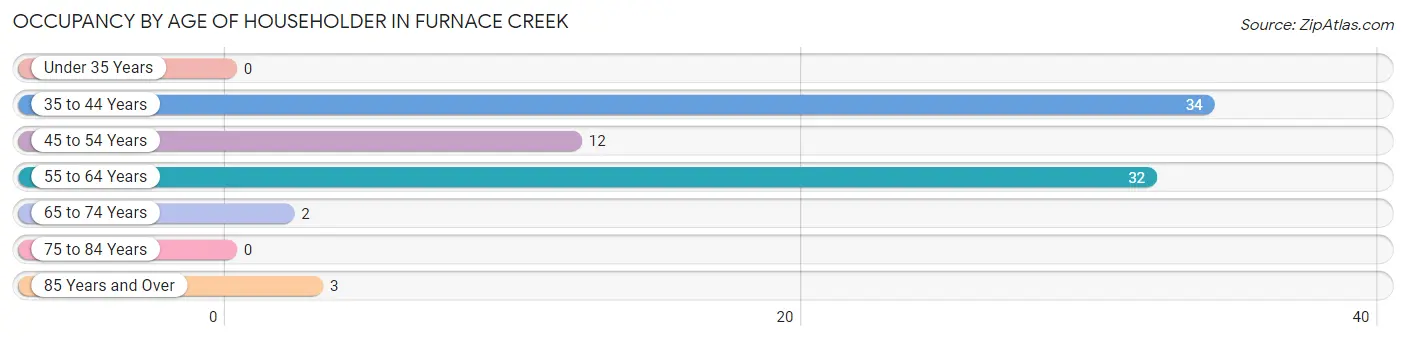
| Age Bracket | # Households | % Households |
| Under 35 Years | 0 | 0.0% |
| 35 to 44 Years | 34 | 41.0% |
| 45 to 54 Years | 12 | 14.5% |
| 55 to 64 Years | 32 | 38.6% |
| 65 to 74 Years | 2 | 2.4% |
| 75 to 84 Years | 0 | 0.0% |
| 85 Years and Over | 3 | 3.6% |
| Total | 83 | 100.0% |
Housing Finances in Furnace Creek
Median Income by Occupancy in Furnace Creek
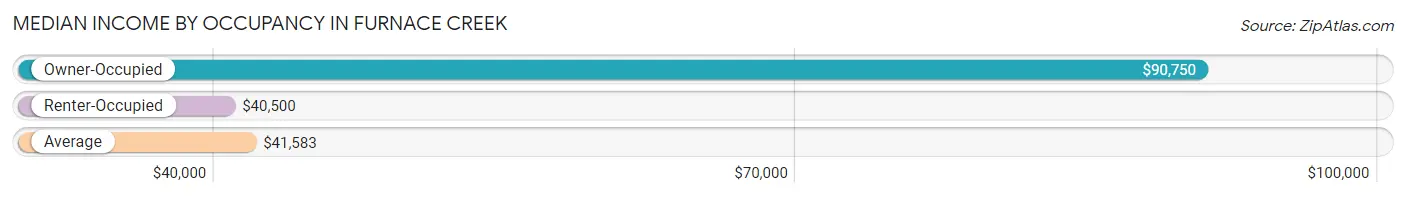
| Occupancy Type | # Households | Median Income |
| Owner-Occupied | 21 (25.3%) | $90,750 |
| Renter-Occupied | 62 (74.7%) | $40,500 |
| Average | 83 (100.0%) | $41,583 |
Occupancy by Householder Income Bracket in Furnace Creek
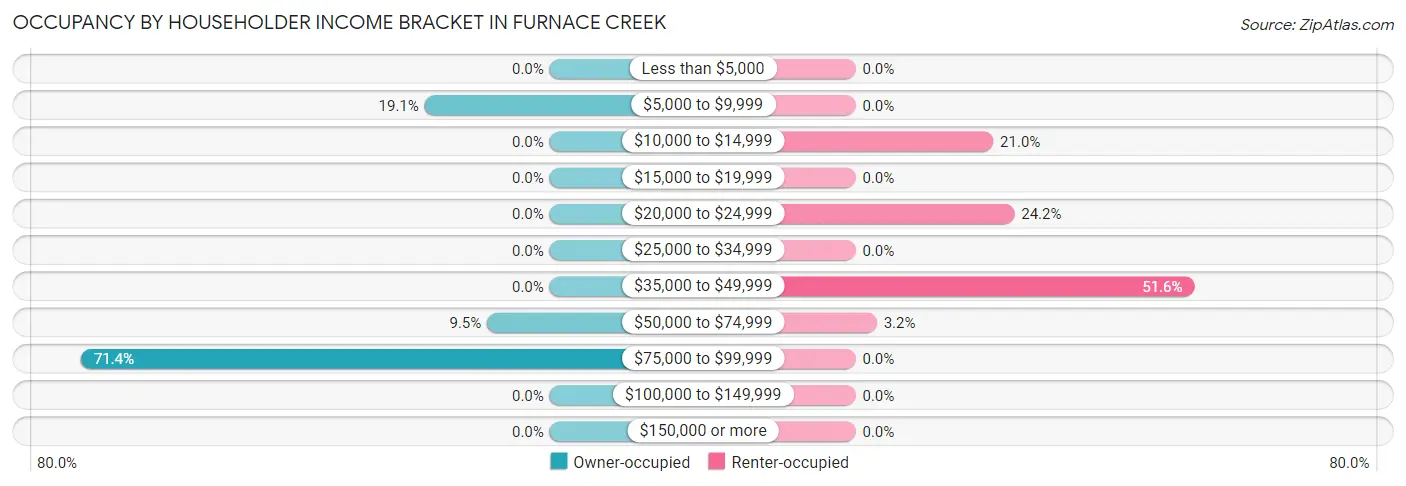
| Income Bracket | Owner-occupied | Renter-occupied |
| Less than $5,000 | 0 (0.0%) | 0 (0.0%) |
| $5,000 to $9,999 | 4 (19.1%) | 0 (0.0%) |
| $10,000 to $14,999 | 0 (0.0%) | 13 (21.0%) |
| $15,000 to $19,999 | 0 (0.0%) | 0 (0.0%) |
| $20,000 to $24,999 | 0 (0.0%) | 15 (24.2%) |
| $25,000 to $34,999 | 0 (0.0%) | 0 (0.0%) |
| $35,000 to $49,999 | 0 (0.0%) | 32 (51.6%) |
| $50,000 to $74,999 | 2 (9.5%) | 2 (3.2%) |
| $75,000 to $99,999 | 15 (71.4%) | 0 (0.0%) |
| $100,000 to $149,999 | 0 (0.0%) | 0 (0.0%) |
| $150,000 or more | 0 (0.0%) | 0 (0.0%) |
| Total | 21 (100.0%) | 62 (100.0%) |
Monthly Housing Cost Tiers in Furnace Creek
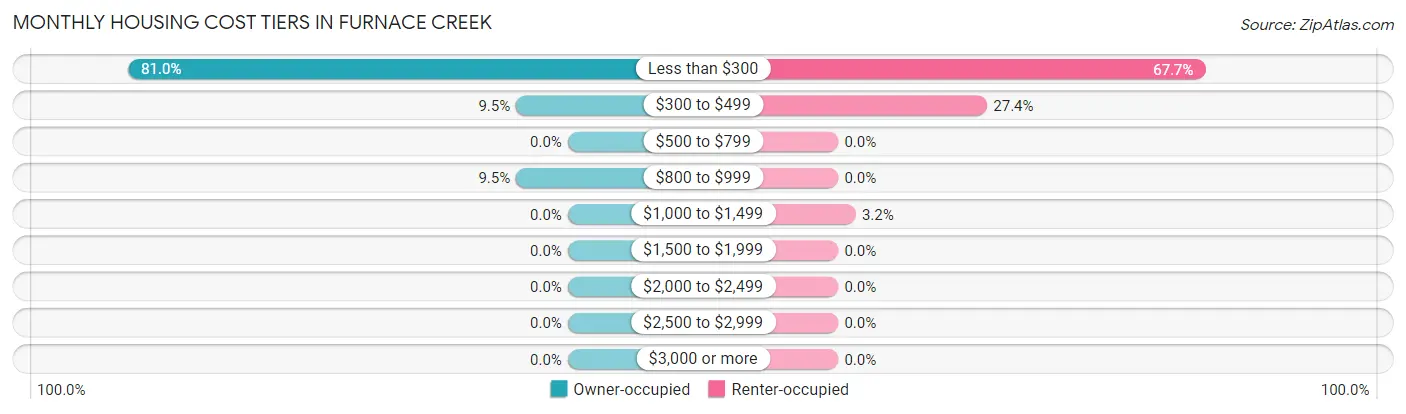
| Monthly Cost | Owner-occupied | Renter-occupied |
| Less than $300 | 17 (80.9%) | 42 (67.7%) |
| $300 to $499 | 2 (9.5%) | 17 (27.4%) |
| $500 to $799 | 0 (0.0%) | 0 (0.0%) |
| $800 to $999 | 2 (9.5%) | 0 (0.0%) |
| $1,000 to $1,499 | 0 (0.0%) | 2 (3.2%) |
| $1,500 to $1,999 | 0 (0.0%) | 0 (0.0%) |
| $2,000 to $2,499 | 0 (0.0%) | 0 (0.0%) |
| $2,500 to $2,999 | 0 (0.0%) | 0 (0.0%) |
| $3,000 or more | 0 (0.0%) | 0 (0.0%) |
| Total | 21 (100.0%) | 62 (100.0%) |
Physical Housing Characteristics in Furnace Creek
Housing Structures in Furnace Creek
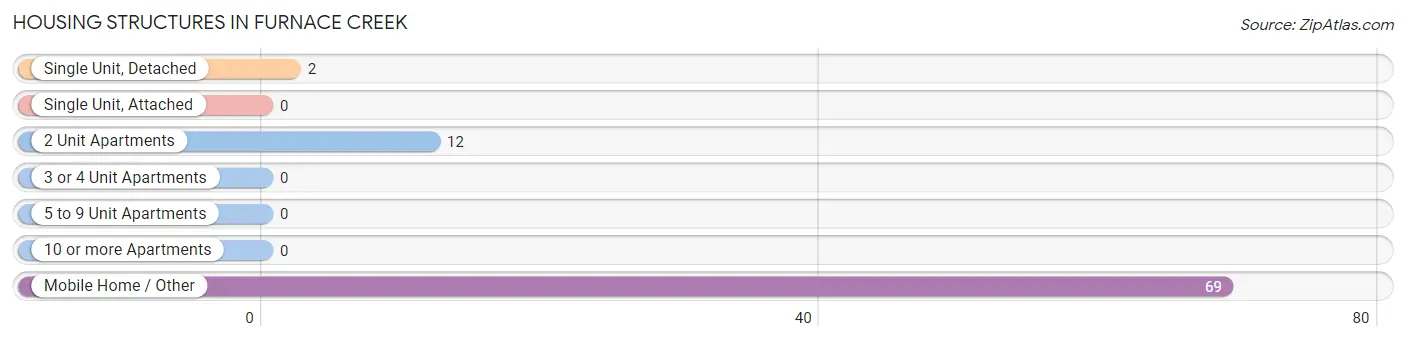
| Structure Type | # Housing Units | % Housing Units |
| Single Unit, Detached | 2 | 2.4% |
| Single Unit, Attached | 0 | 0.0% |
| 2 Unit Apartments | 12 | 14.5% |
| 3 or 4 Unit Apartments | 0 | 0.0% |
| 5 to 9 Unit Apartments | 0 | 0.0% |
| 10 or more Apartments | 0 | 0.0% |
| Mobile Home / Other | 69 | 83.1% |
| Total | 83 | 100.0% |
Housing Structures by Occupancy in Furnace Creek
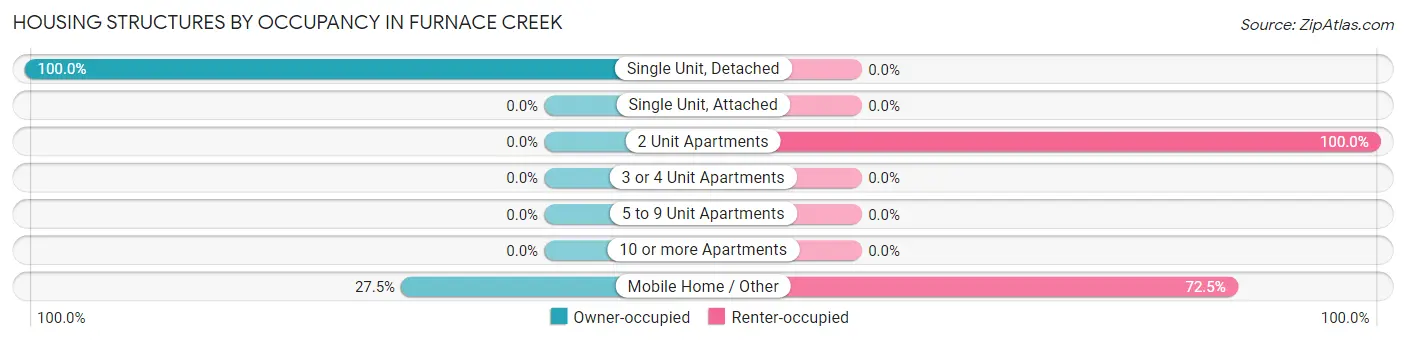
| Structure Type | Owner-occupied | Renter-occupied |
| Single Unit, Detached | 2 (100.0%) | 0 (0.0%) |
| Single Unit, Attached | 0 (0.0%) | 0 (0.0%) |
| 2 Unit Apartments | 0 (0.0%) | 12 (100.0%) |
| 3 or 4 Unit Apartments | 0 (0.0%) | 0 (0.0%) |
| 5 to 9 Unit Apartments | 0 (0.0%) | 0 (0.0%) |
| 10 or more Apartments | 0 (0.0%) | 0 (0.0%) |
| Mobile Home / Other | 19 (27.5%) | 50 (72.5%) |
| Total | 21 (25.3%) | 62 (74.7%) |
Housing Structures by Number of Rooms in Furnace Creek
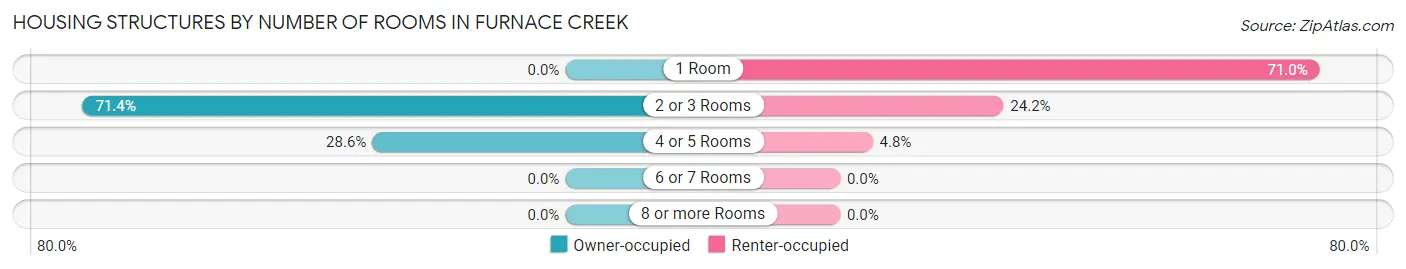
| Number of Rooms | Owner-occupied | Renter-occupied |
| 1 Room | 0 (0.0%) | 44 (71.0%) |
| 2 or 3 Rooms | 15 (71.4%) | 15 (24.2%) |
| 4 or 5 Rooms | 6 (28.6%) | 3 (4.8%) |
| 6 or 7 Rooms | 0 (0.0%) | 0 (0.0%) |
| 8 or more Rooms | 0 (0.0%) | 0 (0.0%) |
| Total | 21 (100.0%) | 62 (100.0%) |
Housing Structure by Heating Type in Furnace Creek
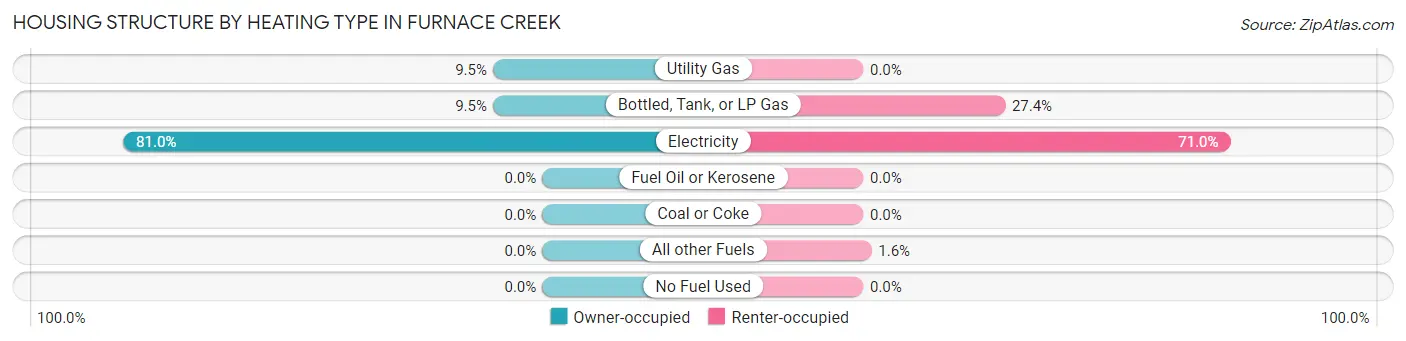
| Heating Type | Owner-occupied | Renter-occupied |
| Utility Gas | 2 (9.5%) | 0 (0.0%) |
| Bottled, Tank, or LP Gas | 2 (9.5%) | 17 (27.4%) |
| Electricity | 17 (80.9%) | 44 (71.0%) |
| Fuel Oil or Kerosene | 0 (0.0%) | 0 (0.0%) |
| Coal or Coke | 0 (0.0%) | 0 (0.0%) |
| All other Fuels | 0 (0.0%) | 1 (1.6%) |
| No Fuel Used | 0 (0.0%) | 0 (0.0%) |
| Total | 21 (100.0%) | 62 (100.0%) |
Household Vehicle Usage in Furnace Creek
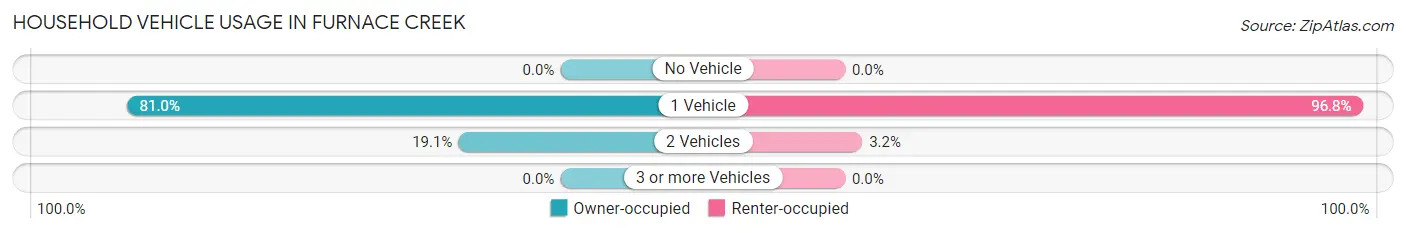
| Vehicles per Household | Owner-occupied | Renter-occupied |
| No Vehicle | 0 (0.0%) | 0 (0.0%) |
| 1 Vehicle | 17 (80.9%) | 60 (96.8%) |
| 2 Vehicles | 4 (19.1%) | 2 (3.2%) |
| 3 or more Vehicles | 0 (0.0%) | 0 (0.0%) |
| Total | 21 (100.0%) | 62 (100.0%) |
Real Estate & Mortgages in Furnace Creek
Real Estate and Mortgage Overview in Furnace Creek
| Characteristic | Without Mortgage | With Mortgage |
| Housing Units | 21 | 0 |
| Median Property Value | $9,999 | $0 |
| Median Household Income | $90,750 | $0 |
| Monthly Housing Costs | - | - |
| Real Estate Taxes | - | - |
Property Value by Mortgage Status in Furnace Creek
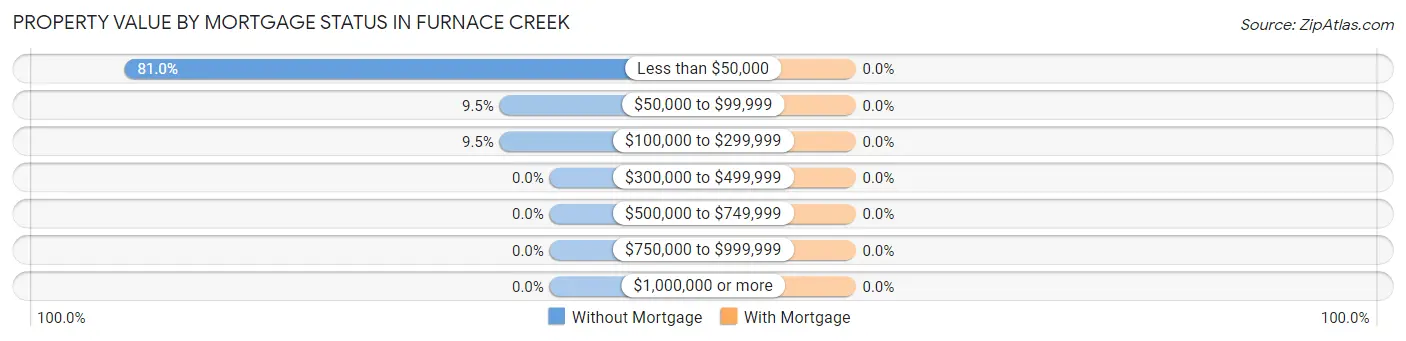
| Property Value | Without Mortgage | With Mortgage |
| Less than $50,000 | 17 (80.9%) | 0 (0.0%) |
| $50,000 to $99,999 | 2 (9.5%) | 0 (0.0%) |
| $100,000 to $299,999 | 2 (9.5%) | 0 (0.0%) |
| $300,000 to $499,999 | 0 (0.0%) | 0 (0.0%) |
| $500,000 to $749,999 | 0 (0.0%) | 0 (0.0%) |
| $750,000 to $999,999 | 0 (0.0%) | 0 (0.0%) |
| $1,000,000 or more | 0 (0.0%) | 0 (0.0%) |
| Total | 21 (100.0%) | 0 (0.0%) |
Household Income by Mortgage Status in Furnace Creek
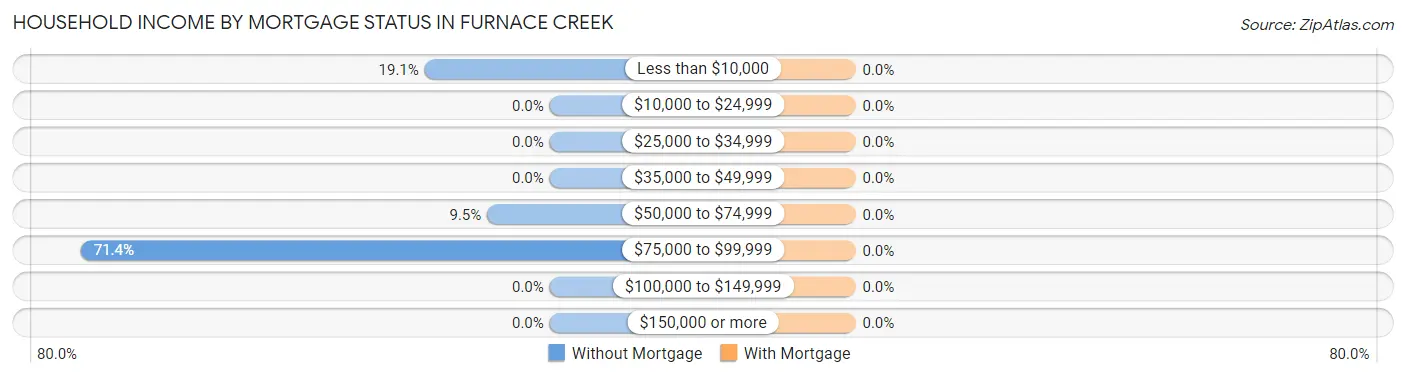
| Household Income | Without Mortgage | With Mortgage |
| Less than $10,000 | 4 (19.1%) | 0 (0.0%) |
| $10,000 to $24,999 | 0 (0.0%) | 0 (0.0%) |
| $25,000 to $34,999 | 0 (0.0%) | 0 (0.0%) |
| $35,000 to $49,999 | 0 (0.0%) | 0 (0.0%) |
| $50,000 to $74,999 | 2 (9.5%) | 0 (0.0%) |
| $75,000 to $99,999 | 15 (71.4%) | 0 (0.0%) |
| $100,000 to $149,999 | 0 (0.0%) | 0 (0.0%) |
| $150,000 or more | 0 (0.0%) | 0 (0.0%) |
| Total | 21 (100.0%) | 0 (0.0%) |
Property Value to Household Income Ratio in Furnace Creek
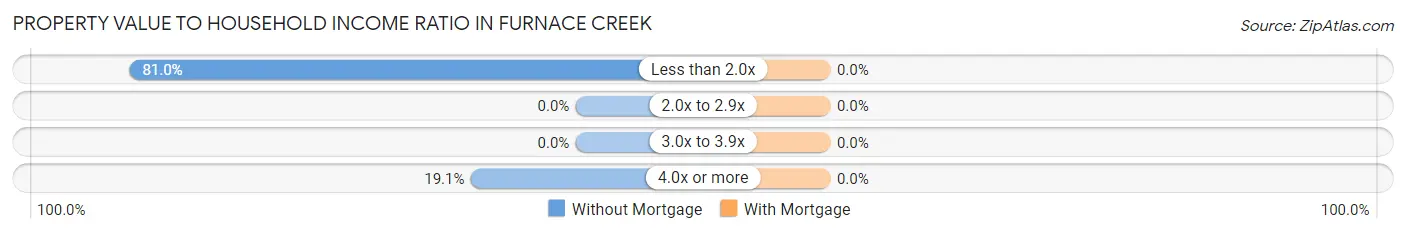
| Value-to-Income Ratio | Without Mortgage | With Mortgage |
| Less than 2.0x | 17 (80.9%) | 0 (0.0%) |
| 2.0x to 2.9x | 0 (0.0%) | 0 (0.0%) |
| 3.0x to 3.9x | 0 (0.0%) | 0 (0.0%) |
| 4.0x or more | 4 (19.1%) | 0 (0.0%) |
| Total | 21 (100.0%) | 0 (0.0%) |
Real Estate Taxes by Mortgage Status in Furnace Creek
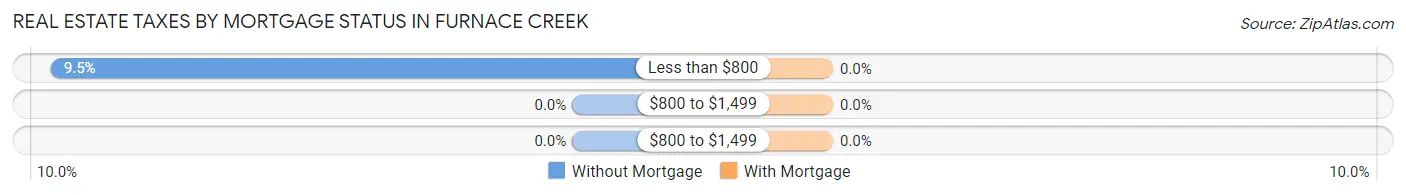
| Property Taxes | Without Mortgage | With Mortgage |
| Less than $800 | 2 (9.5%) | 0 (0.0%) |
| $800 to $1,499 | 0 (0.0%) | 0 (0.0%) |
| $800 to $1,499 | 0 (0.0%) | 0 (0.0%) |
| Total | 21 (100.0%) | 0 (0.0%) |
Health & Disability in Furnace Creek
Health Insurance Coverage by Age in Furnace Creek
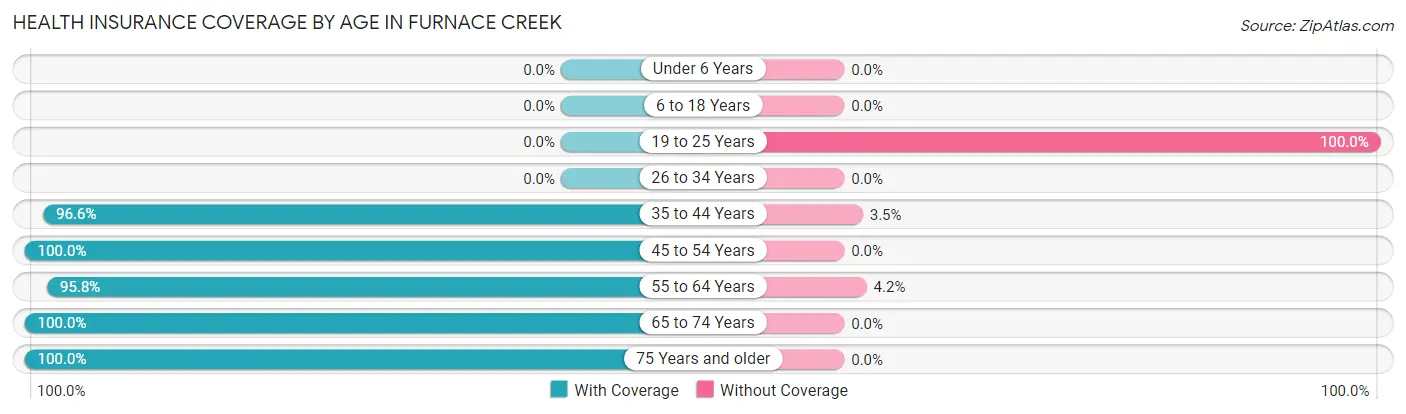
| Age Bracket | With Coverage | Without Coverage |
| Under 6 Years | 0 (0.0%) | 0 (0.0%) |
| 6 to 18 Years | 0 (0.0%) | 0 (0.0%) |
| 19 to 25 Years | 0 (0.0%) | 2 (100.0%) |
| 26 to 34 Years | 0 (0.0%) | 0 (0.0%) |
| 35 to 44 Years | 56 (96.6%) | 2 (3.5%) |
| 45 to 54 Years | 12 (100.0%) | 0 (0.0%) |
| 55 to 64 Years | 46 (95.8%) | 2 (4.2%) |
| 65 to 74 Years | 2 (100.0%) | 0 (0.0%) |
| 75 Years and older | 8 (100.0%) | 0 (0.0%) |
| Total | 124 (95.4%) | 6 (4.6%) |
Health Insurance Coverage by Citizenship Status in Furnace Creek
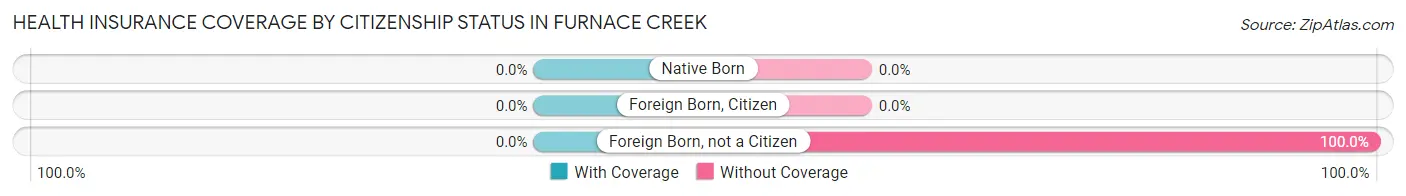
| Citizenship Status | With Coverage | Without Coverage |
| Native Born | 0 (0.0%) | 0 (0.0%) |
| Foreign Born, Citizen | 0 (0.0%) | 0 (0.0%) |
| Foreign Born, not a Citizen | 0 (0.0%) | 2 (100.0%) |
Health Insurance Coverage by Household Income in Furnace Creek
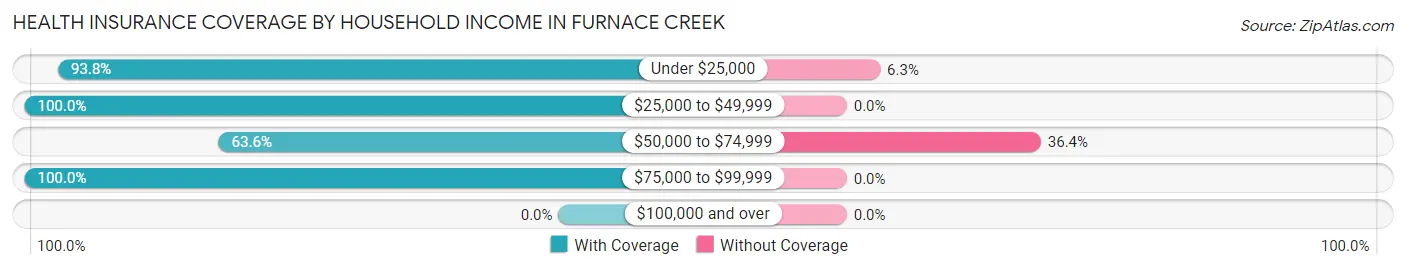
| Household Income | With Coverage | Without Coverage |
| Under $25,000 | 30 (93.8%) | 2 (6.2%) |
| $25,000 to $49,999 | 56 (100.0%) | 0 (0.0%) |
| $50,000 to $74,999 | 7 (63.6%) | 4 (36.4%) |
| $75,000 to $99,999 | 31 (100.0%) | 0 (0.0%) |
| $100,000 and over | 0 (0.0%) | 0 (0.0%) |
Public vs Private Health Insurance Coverage by Age in Furnace Creek
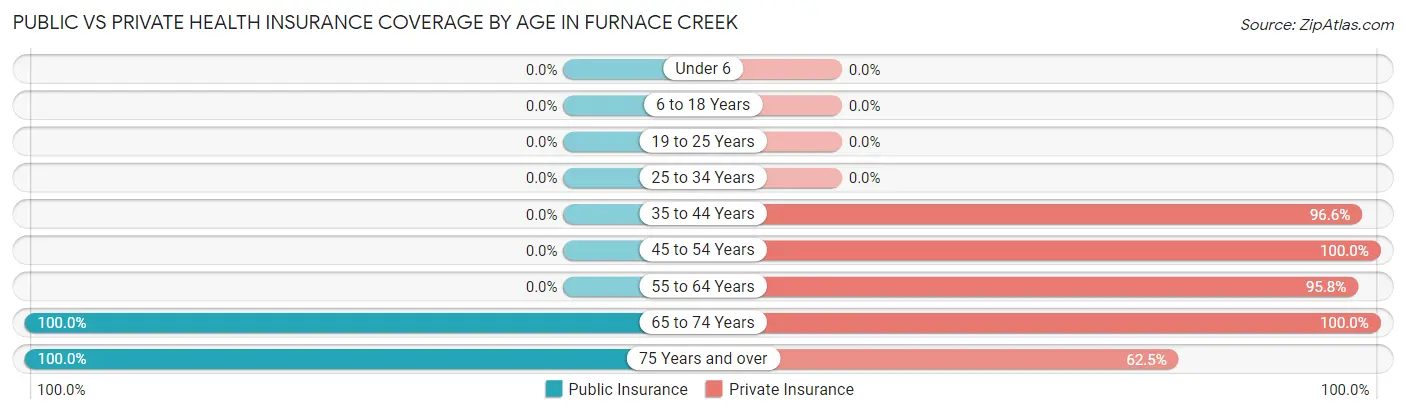
| Age Bracket | Public Insurance | Private Insurance |
| Under 6 | 0 (0.0%) | 0 (0.0%) |
| 6 to 18 Years | 0 (0.0%) | 0 (0.0%) |
| 19 to 25 Years | 0 (0.0%) | 0 (0.0%) |
| 25 to 34 Years | 0 (0.0%) | 0 (0.0%) |
| 35 to 44 Years | 0 (0.0%) | 56 (96.6%) |
| 45 to 54 Years | 0 (0.0%) | 12 (100.0%) |
| 55 to 64 Years | 0 (0.0%) | 46 (95.8%) |
| 65 to 74 Years | 2 (100.0%) | 2 (100.0%) |
| 75 Years and over | 8 (100.0%) | 5 (62.5%) |
| Total | 10 (7.7%) | 121 (93.1%) |
Disability Status by Sex by Age in Furnace Creek
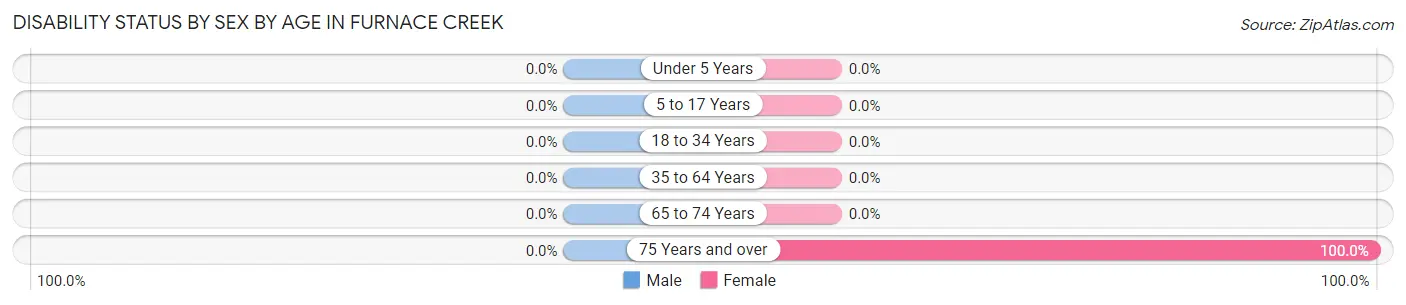
| Age Bracket | Male | Female |
| Under 5 Years | 0 (0.0%) | 0 (0.0%) |
| 5 to 17 Years | 0 (0.0%) | 0 (0.0%) |
| 18 to 34 Years | 0 (0.0%) | 0 (0.0%) |
| 35 to 64 Years | 0 (0.0%) | 0 (0.0%) |
| 65 to 74 Years | 0 (0.0%) | 0 (0.0%) |
| 75 Years and over | 0 (0.0%) | 3 (100.0%) |
Disability Class by Sex by Age in Furnace Creek
Disability Class: Hearing Difficulty
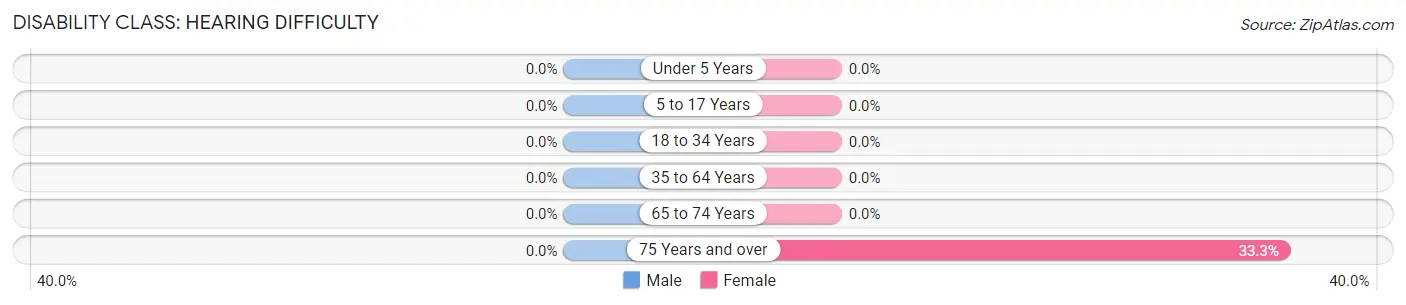
| Age Bracket | Male | Female |
| Under 5 Years | 0 (0.0%) | 0 (0.0%) |
| 5 to 17 Years | 0 (0.0%) | 0 (0.0%) |
| 18 to 34 Years | 0 (0.0%) | 0 (0.0%) |
| 35 to 64 Years | 0 (0.0%) | 0 (0.0%) |
| 65 to 74 Years | 0 (0.0%) | 0 (0.0%) |
| 75 Years and over | 0 (0.0%) | 1 (33.3%) |
Disability Class: Vision Difficulty
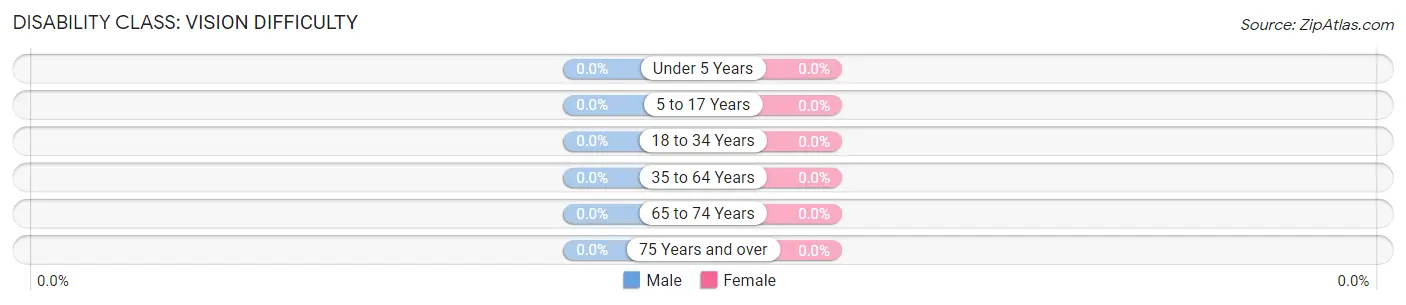
| Age Bracket | Male | Female |
| Under 5 Years | 0 (0.0%) | 0 (0.0%) |
| 5 to 17 Years | 0 (0.0%) | 0 (0.0%) |
| 18 to 34 Years | 0 (0.0%) | 0 (0.0%) |
| 35 to 64 Years | 0 (0.0%) | 0 (0.0%) |
| 65 to 74 Years | 0 (0.0%) | 0 (0.0%) |
| 75 Years and over | 0 (0.0%) | 0 (0.0%) |
Disability Class: Cognitive Difficulty
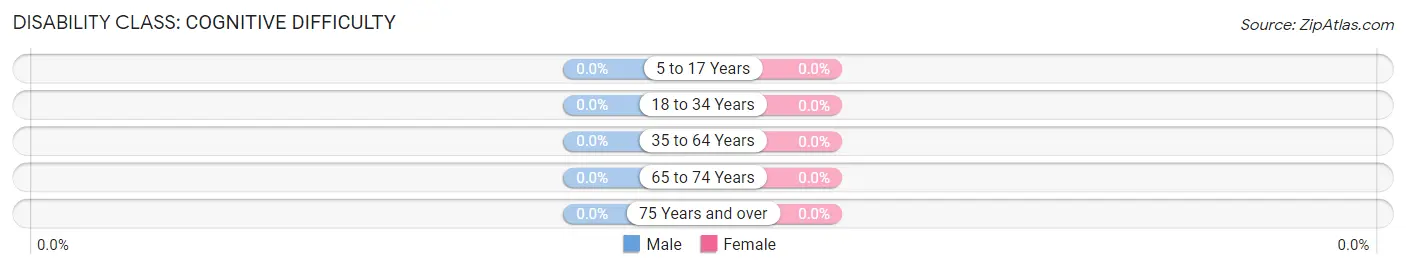
| Age Bracket | Male | Female |
| 5 to 17 Years | 0 (0.0%) | 0 (0.0%) |
| 18 to 34 Years | 0 (0.0%) | 0 (0.0%) |
| 35 to 64 Years | 0 (0.0%) | 0 (0.0%) |
| 65 to 74 Years | 0 (0.0%) | 0 (0.0%) |
| 75 Years and over | 0 (0.0%) | 0 (0.0%) |
Disability Class: Ambulatory Difficulty
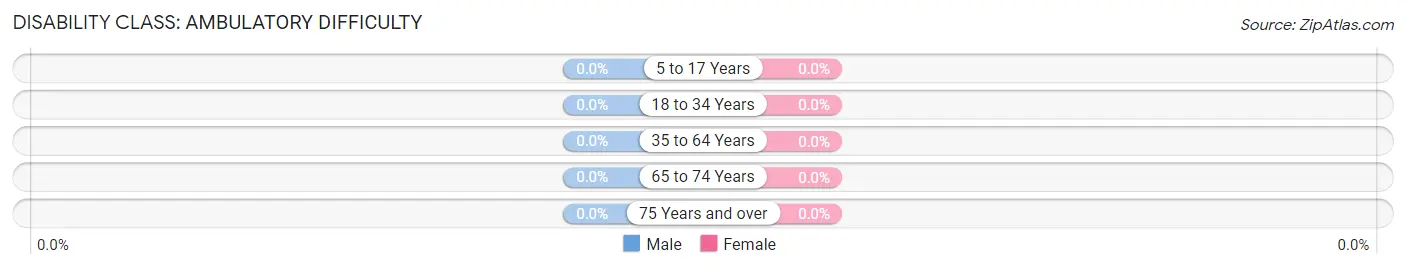
| Age Bracket | Male | Female |
| 5 to 17 Years | 0 (0.0%) | 0 (0.0%) |
| 18 to 34 Years | 0 (0.0%) | 0 (0.0%) |
| 35 to 64 Years | 0 (0.0%) | 0 (0.0%) |
| 65 to 74 Years | 0 (0.0%) | 0 (0.0%) |
| 75 Years and over | 0 (0.0%) | 0 (0.0%) |
Disability Class: Self-Care Difficulty
| Age Bracket | Male | Female |
| 5 to 17 Years | 0 (0.0%) | 0 (0.0%) |
| 18 to 34 Years | 0 (0.0%) | 0 (0.0%) |
| 35 to 64 Years | 0 (0.0%) | 0 (0.0%) |
| 65 to 74 Years | 0 (0.0%) | 0 (0.0%) |
| 75 Years and over | 0 (0.0%) | 0 (0.0%) |
Technology Access in Furnace Creek
Computing Device Access in Furnace Creek
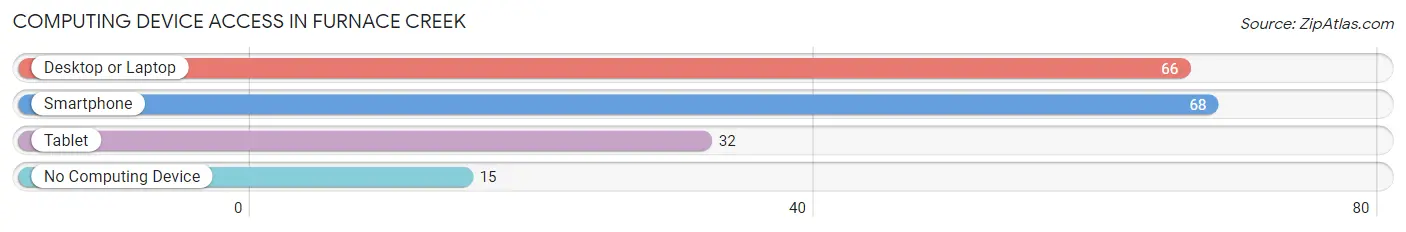
| Device Type | # Households | % Households |
| Desktop or Laptop | 66 | 79.5% |
| Smartphone | 68 | 81.9% |
| Tablet | 32 | 38.6% |
| No Computing Device | 15 | 18.1% |
| Total | 83 | 100.0% |
Internet Access in Furnace Creek
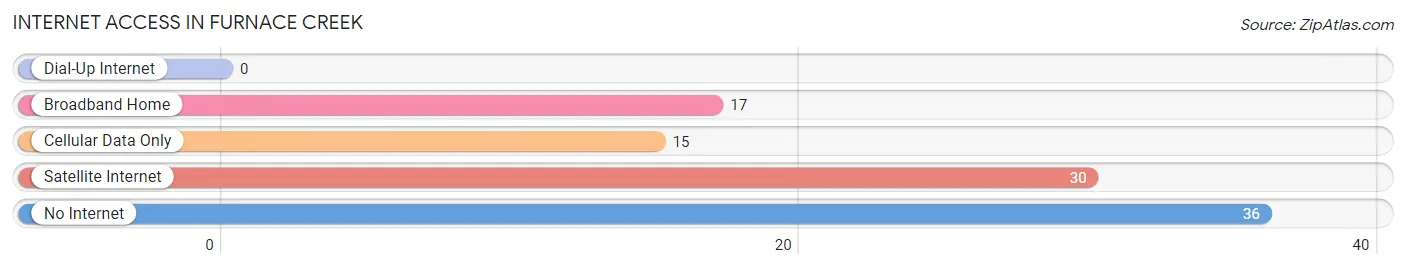
| Internet Type | # Households | % Households |
| Dial-Up Internet | 0 | 0.0% |
| Broadband Home | 17 | 20.5% |
| Cellular Data Only | 15 | 18.1% |
| Satellite Internet | 30 | 36.1% |
| No Internet | 36 | 43.4% |
| Total | 83 | 100.0% |
Furnace Creek Summary
Furnace Creek is a small unincorporated community located in the Death Valley region of Inyo County, California. It is situated in the northern part of the valley, near the Amargosa River, and is the lowest point in the United States at 282 feet (86 m) below sea level. The community is home to the Furnace Creek Resort, which includes a golf course, hotel, and other amenities.
History
Furnace Creek has a long and varied history. The area was first inhabited by the Timbisha Shoshone tribe, who lived in the area for centuries before the arrival of Europeans. The first Europeans to visit the area were members of the Spanish expedition led by Francisco Garcés in 1776. The area was later explored by John C. Fremont in 1844, and the first settlers arrived in the late 19th century.
The area was originally known as "Furnace Creek Ranch" and was established in 1883 by the Pacific Borax Company. The company built a 20-mule team borax wagon road from the ranch to the nearby mining town of Ballarat. The ranch was used as a way station for travelers and miners, and the company built a hotel, store, and other amenities.
In the early 20th century, the ranch was purchased by the Pacific Coast Borax Company, which built a new hotel and other facilities. The hotel was later renamed the Furnace Creek Inn and is still in operation today.
Geography
Furnace Creek is located in the northern part of Death Valley, near the Amargosa River. It is the lowest point in the United States, at 282 feet (86 m) below sea level. The area is characterized by its hot, dry climate and is home to a variety of unique plants and animals.
The area is surrounded by mountains, including the Panamint Range to the west and the Amargosa Range to the east. The nearby Furnace Creek Wash is a popular spot for hikers and campers.
Economy
Furnace Creek is home to the Furnace Creek Resort, which includes a golf course, hotel, and other amenities. The resort is a popular destination for tourists, and the area is also home to a number of other businesses, including restaurants, shops, and gas stations.
The area is also home to a number of mining operations, including the nearby Borax Mine. The mine is the largest borax mine in the world and is operated by the U.S. Borax Corporation.
Demographics
As of the 2010 census, the population of Furnace Creek was 24. The population is predominantly white (90.8%) and the median age is 57. The median household income is $45,000 and the median home value is $150,000.
Conclusion
Furnace Creek is a small unincorporated community located in the Death Valley region of Inyo County, California. It is situated in the northern part of the valley, near the Amargosa River, and is the lowest point in the United States at 282 feet (86 m) below sea level. The community is home to the Furnace Creek Resort, which includes a golf course, hotel, and other amenities. The area is characterized by its hot, dry climate and is home to a variety of unique plants and animals. The area is also home to a number of businesses, including restaurants, shops, and gas stations, as well as a number of mining operations. The population of Furnace Creek is predominantly white and the median age is 57. The median household income is $45,000 and the median home value is $150,000.
Common Questions
What is Per Capita Income in Furnace Creek?
Per Capita income in Furnace Creek is $29,785.
What is the Median Family Income in Furnace Creek?
Median Family Income in Furnace Creek is $90,917.
What is the Median Household income in Furnace Creek?
Median Household Income in Furnace Creek is $41,583.
What is Inequality or Gini Index in Furnace Creek?
Inequality or Gini Index in Furnace Creek is 0.34.
What is the Total Population of Furnace Creek?
Total Population of Furnace Creek is 130.
What is the Total Male Population of Furnace Creek?
Total Male Population of Furnace Creek is 57.
What is the Total Female Population of Furnace Creek?
Total Female Population of Furnace Creek is 73.
What is the Ratio of Males per 100 Females in Furnace Creek?
There are 78.08 Males per 100 Females in Furnace Creek.
What is the Ratio of Females per 100 Males in Furnace Creek?
There are 128.07 Females per 100 Males in Furnace Creek.
What is the Median Population Age in Furnace Creek?
Median Population Age in Furnace Creek is 54.4 Years.
What is the Average Family Size in Furnace Creek
Average Family Size in Furnace Creek is 2.2 People.
What is the Average Household Size in Furnace Creek
Average Household Size in Furnace Creek is 1.6 People.
How Large is the Labor Force in Furnace Creek?
There are 118 People in the Labor Forcein in Furnace Creek.
What is the Percentage of People in the Labor Force in Furnace Creek?
90.8% of People are in the Labor Force in Furnace Creek.
What is the Unemployment Rate in Furnace Creek?
Unemployment Rate in Furnace Creek is 1.7%.