University of California Davis, CA Map & Demographics
University of California Davis Map
University of California Davis Overview
$7,058
PER CAPITA INCOME
$47,344
AVG FAMILY INCOME
$19,541
AVG HOUSEHOLD INCOME
1.0%
WAGE / INCOME GAP [ % ]
99.0¢/ $1
WAGE / INCOME GAP [ $ ]
0.58
INEQUALITY / GINI INDEX
8,229
TOTAL POPULATION
3,780
MALE POPULATION
4,449
FEMALE POPULATION
84.96
MALES / 100 FEMALES
117.70
FEMALES / 100 MALES
19.6
MEDIAN AGE
2.8
AVG FAMILY SIZE
2.7
AVG HOUSEHOLD SIZE
2,152
LABOR FORCE [ PEOPLE ]
26.6%
PERCENT IN LABOR FORCE
11.3%
UNEMPLOYMENT RATE
Income in University of California Davis
Income Overview in University of California Davis
Per Capita Income in University of California Davis is $7,058, while median incomes of families and households are $47,344 and $19,541 respectively.
| Characteristic | Number | Measure |
| Per Capita Income | 8,229 | $7,058 |
| Median Family Income | 191 | $47,344 |
| Mean Family Income | 191 | $59,039 |
| Median Household Income | 1,402 | $19,541 |
| Mean Household Income | 1,402 | $34,675 |
| Income Deficit | 191 | $0 |
| Wage / Income Gap (%) | 8,229 | 0.96% |
| Wage / Income Gap ($) | 8,229 | 99.04¢ per $1 |
| Gini / Inequality Index | 8,229 | 0.58 |
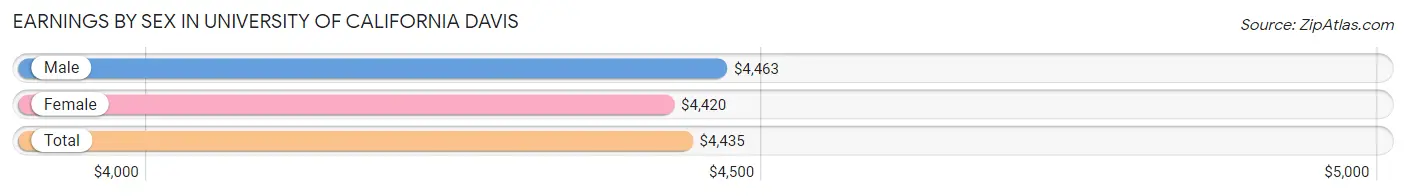
Earnings by Sex in University of California Davis
Average Earnings in University of California Davis are $4,435, $4,463 for men and $4,420 for women, a difference of 1.0%.
| Sex | Number | Average Earnings |
| Male | 1,611 (42.4%) | $4,463 |
| Female | 2,192 (57.6%) | $4,420 |
| Total | 3,803 (100.0%) | $4,435 |
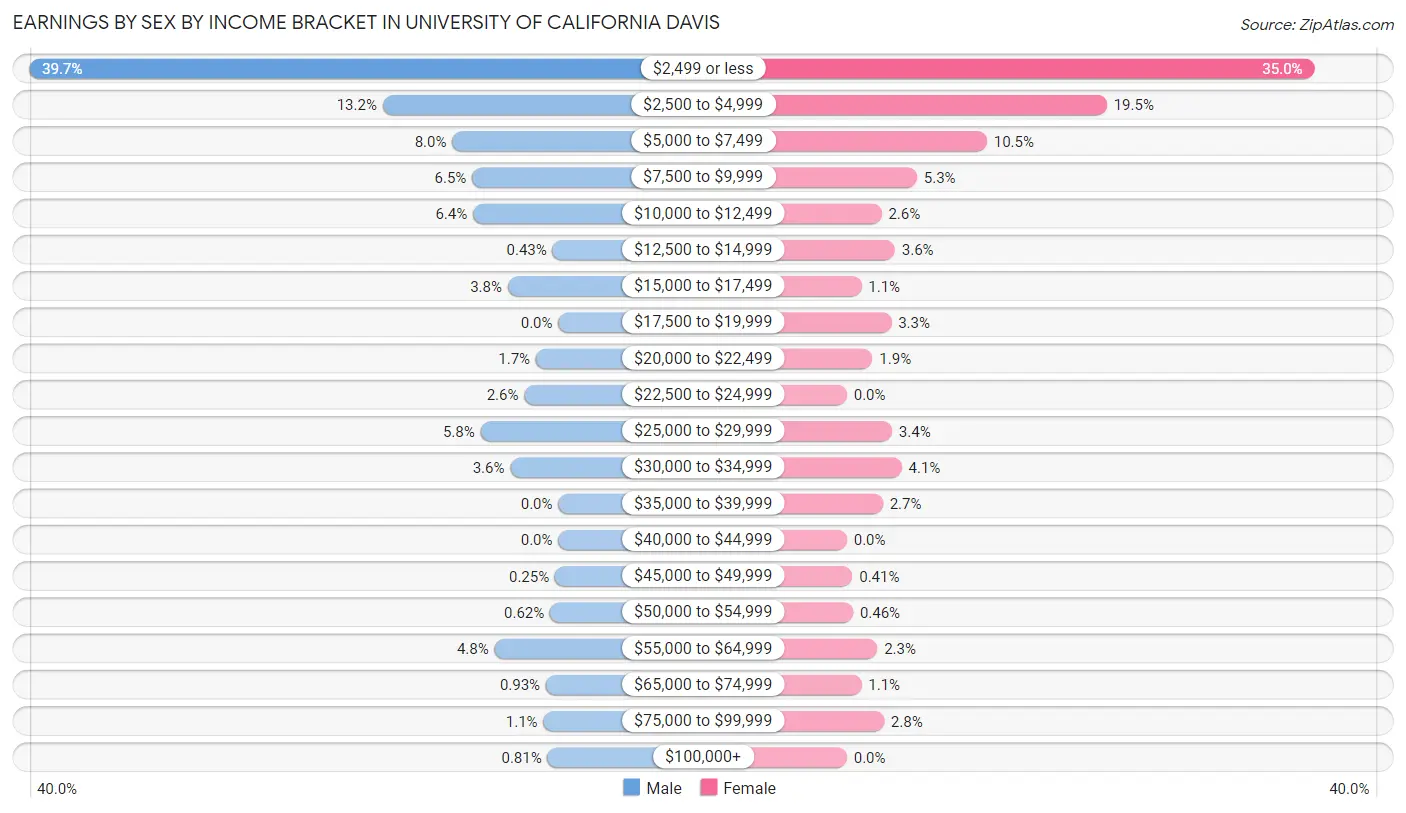
Earnings by Sex by Income Bracket in University of California Davis
The most common earnings brackets in University of California Davis are $2,499 or less for men (639 | 39.7%) and $2,499 or less for women (768 | 35.0%).
| Income | Male | Female |
| $2,499 or less | 639 (39.7%) | 768 (35.0%) |
| $2,500 to $4,999 | 212 (13.2%) | 427 (19.5%) |
| $5,000 to $7,499 | 128 (8.0%) | 230 (10.5%) |
| $7,500 to $9,999 | 104 (6.5%) | 115 (5.2%) |
| $10,000 to $12,499 | 103 (6.4%) | 57 (2.6%) |
| $12,500 to $14,999 | 7 (0.4%) | 79 (3.6%) |
| $15,000 to $17,499 | 61 (3.8%) | 24 (1.1%) |
| $17,500 to $19,999 | 0 (0.0%) | 73 (3.3%) |
| $20,000 to $22,499 | 27 (1.7%) | 42 (1.9%) |
| $22,500 to $24,999 | 41 (2.5%) | 0 (0.0%) |
| $25,000 to $29,999 | 94 (5.8%) | 74 (3.4%) |
| $30,000 to $34,999 | 58 (3.6%) | 90 (4.1%) |
| $35,000 to $39,999 | 0 (0.0%) | 59 (2.7%) |
| $40,000 to $44,999 | 0 (0.0%) | 0 (0.0%) |
| $45,000 to $49,999 | 4 (0.3%) | 9 (0.4%) |
| $50,000 to $54,999 | 10 (0.6%) | 10 (0.5%) |
| $55,000 to $64,999 | 77 (4.8%) | 50 (2.3%) |
| $65,000 to $74,999 | 15 (0.9%) | 24 (1.1%) |
| $75,000 to $99,999 | 18 (1.1%) | 61 (2.8%) |
| $100,000+ | 13 (0.8%) | 0 (0.0%) |
| Total | 1,611 (100.0%) | 2,192 (100.0%) |
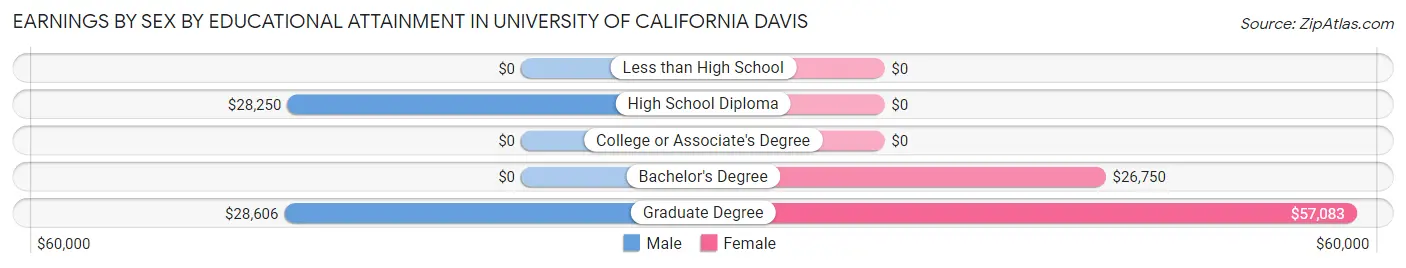
Earnings by Sex by Educational Attainment in University of California Davis
| Educational Attainment | Male Income | Female Income |
| Less than High School | - | - |
| High School Diploma | $28,250 | $0 |
| College or Associate's Degree | - | - |
| Bachelor's Degree | - | - |
| Graduate Degree | $28,606 | $57,083 |
| Total | $28,171 | $0 |
Family Income in University of California Davis
Family Income Brackets in University of California Davis
According to the University of California Davis family income data, there are 73 families falling into the $25,000 to $34,999 income range, which is the most common income bracket and makes up 38.2% of all families.
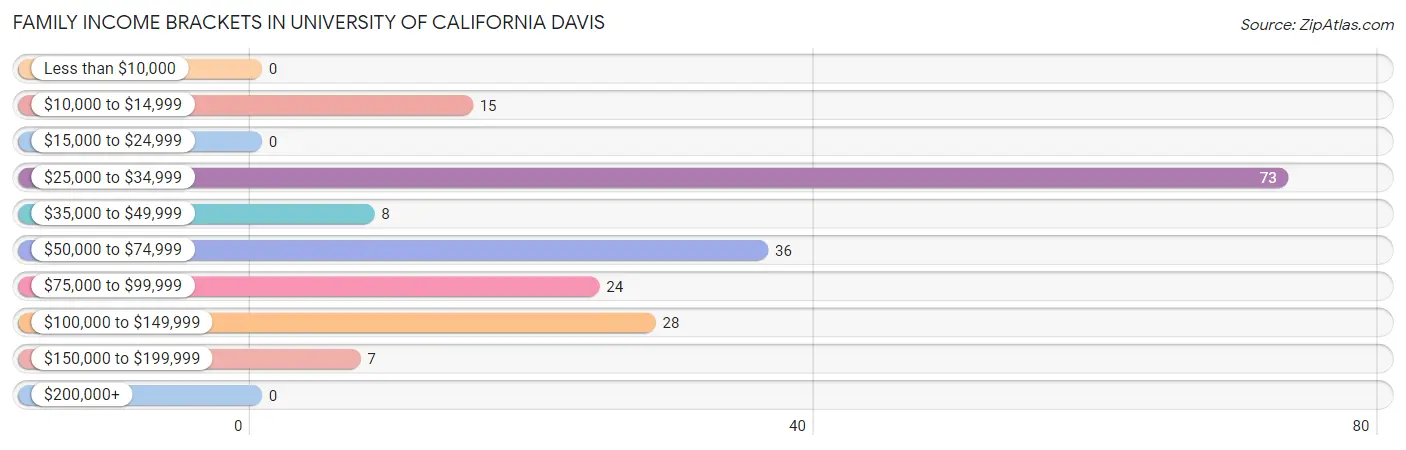
| Income Bracket | # Families | % Families |
| Less than $10,000 | 0 | 0.0% |
| $10,000 to $14,999 | 15 | 7.9% |
| $15,000 to $24,999 | 0 | 0.0% |
| $25,000 to $34,999 | 73 | 38.2% |
| $35,000 to $49,999 | 8 | 4.2% |
| $50,000 to $74,999 | 36 | 18.8% |
| $75,000 to $99,999 | 24 | 12.6% |
| $100,000 to $149,999 | 28 | 14.7% |
| $150,000 to $199,999 | 7 | 3.7% |
| $200,000+ | 0 | 0.0% |
Family Income by Famaliy Size in University of California Davis
3-person families (88 | 46.1%) account for the highest median family income in University of California Davis with $54,167 per family, while 3-person families (88 | 46.1%) have the highest median income of $18,056 per family member.
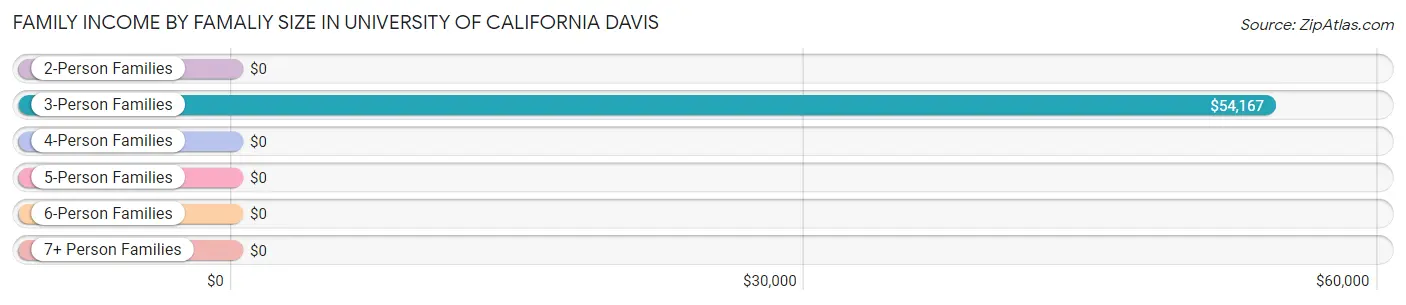
| Income Bracket | # Families | Median Income |
| 2-Person Families | 88 (46.1%) | $0 |
| 3-Person Families | 88 (46.1%) | $54,167 |
| 4-Person Families | 15 (7.9%) | $0 |
| 5-Person Families | 0 (0.0%) | $0 |
| 6-Person Families | 0 (0.0%) | $0 |
| 7+ Person Families | 0 (0.0%) | $0 |
| Total | 191 (100.0%) | $47,344 |
Family Income by Number of Earners in University of California Davis
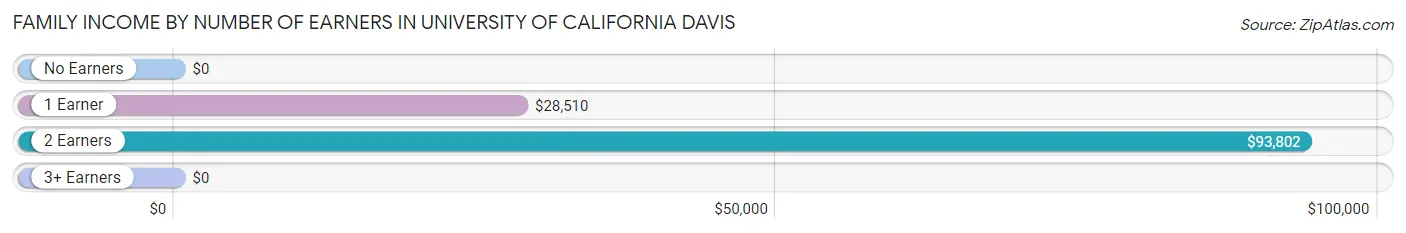
| Number of Earners | # Families | Median Income |
| No Earners | 7 (3.7%) | $0 |
| 1 Earner | 91 (47.6%) | $28,510 |
| 2 Earners | 93 (48.7%) | $93,802 |
| 3+ Earners | 0 (0.0%) | $0 |
| Total | 191 (100.0%) | $47,344 |
Household Income in University of California Davis
Household Income Brackets in University of California Davis
With 414 households falling in the category, the less than $10,000 income range is the most frequent in University of California Davis, accounting for 29.5% of all households. In contrast, only 7 households (0.5%) fall into the $150,000 to $199,999 income bracket, making it the least populous group.
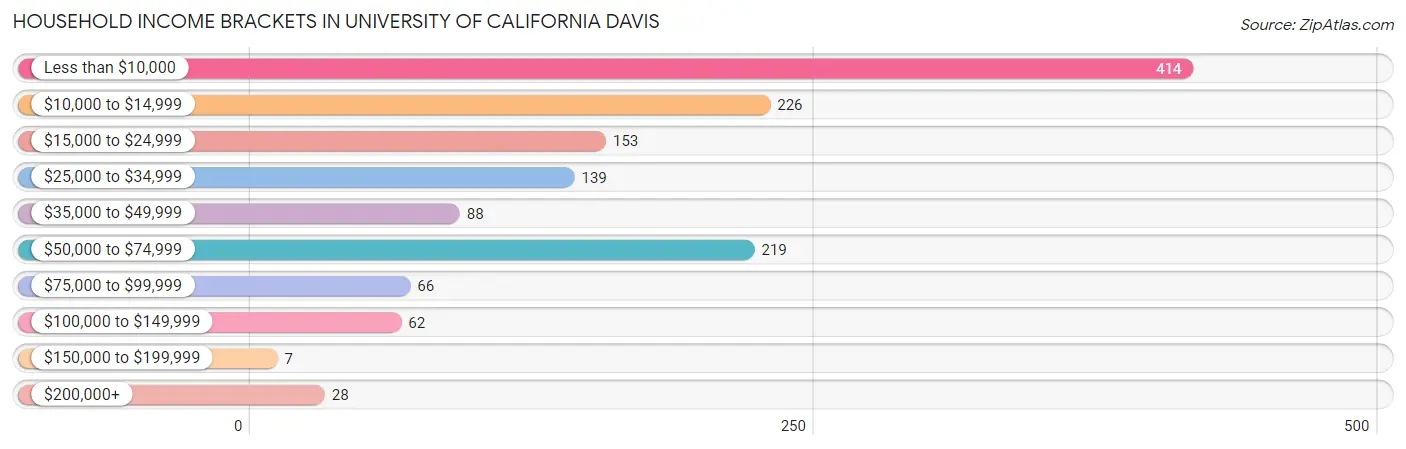
| Income Bracket | # Households | % Households |
| Less than $10,000 | 414 | 29.5% |
| $10,000 to $14,999 | 226 | 16.1% |
| $15,000 to $24,999 | 153 | 10.9% |
| $25,000 to $34,999 | 139 | 9.9% |
| $35,000 to $49,999 | 88 | 6.3% |
| $50,000 to $74,999 | 219 | 15.6% |
| $75,000 to $99,999 | 66 | 4.7% |
| $100,000 to $149,999 | 62 | 4.4% |
| $150,000 to $199,999 | 7 | 0.5% |
| $200,000+ | 28 | 2.0% |
Household Income by Householder Age in University of California Davis
The median household income in University of California Davis is $19,541, with the highest median household income of $44,125 found in the 25 to 44 years age bracket for the primary householder. A total of 417 households (29.7%) fall into this category. Meanwhile, the 45 to 64 years age bracket for the primary householder has the lowest median household income of $0, with 28 households (2.0%) in this group.
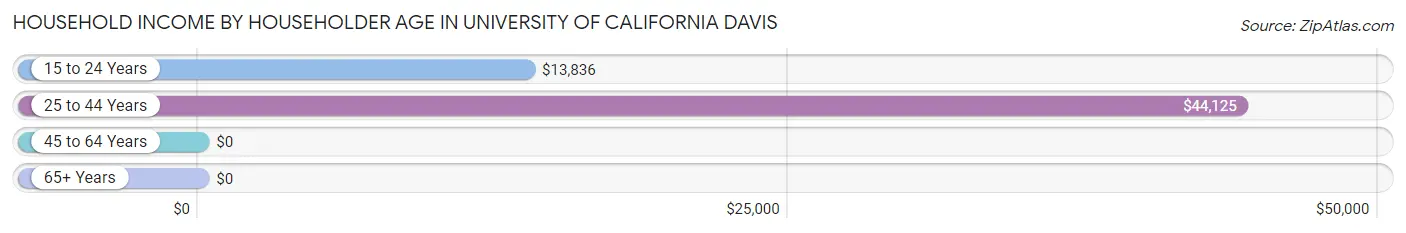
| Income Bracket | # Households | Median Income |
| 15 to 24 Years | 957 (68.3%) | $13,836 |
| 25 to 44 Years | 417 (29.7%) | $44,125 |
| 45 to 64 Years | 28 (2.0%) | $0 |
| 65+ Years | 0 (0.0%) | $0 |
| Total | 1,402 (100.0%) | $19,541 |
Poverty in University of California Davis
Income Below Poverty by Sex and Age in University of California Davis
With 70.4% poverty level for males and 61.1% for females among the residents of University of California Davis, 12 to 14 year old males and 18 to 24 year old females are the most vulnerable to poverty, with 10 males (100.0%) and 1,000 females (78.8%) in their respective age groups living below the poverty level.
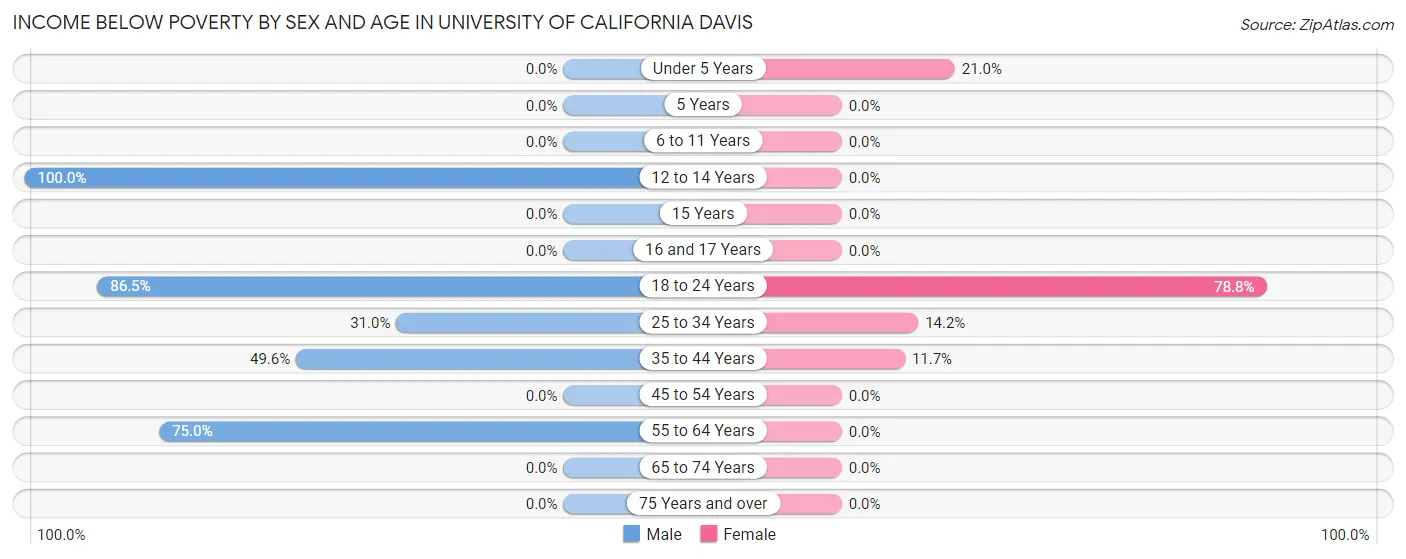
| Age Bracket | Male | Female |
| Under 5 Years | 0 (0.0%) | 13 (21.0%) |
| 5 Years | 0 (0.0%) | 0 (0.0%) |
| 6 to 11 Years | 0 (0.0%) | 0 (0.0%) |
| 12 to 14 Years | 10 (100.0%) | 0 (0.0%) |
| 15 Years | 0 (0.0%) | 0 (0.0%) |
| 16 and 17 Years | 0 (0.0%) | 0 (0.0%) |
| 18 to 24 Years | 1,184 (86.5%) | 1,000 (78.8%) |
| 25 to 34 Years | 120 (31.0%) | 40 (14.2%) |
| 35 to 44 Years | 63 (49.6%) | 15 (11.7%) |
| 45 to 54 Years | 0 (0.0%) | 0 (0.0%) |
| 55 to 64 Years | 21 (75.0%) | 0 (0.0%) |
| 65 to 74 Years | 0 (0.0%) | 0 (0.0%) |
| 75 Years and over | 0 (0.0%) | 0 (0.0%) |
| Total | 1,398 (70.4%) | 1,068 (61.1%) |
Income Above Poverty by Sex and Age in University of California Davis
According to the poverty statistics in University of California Davis, males aged under 5 years and females aged 45 to 54 years are the age groups that are most secure financially, with 100.0% of males and 100.0% of females in these age groups living above the poverty line.
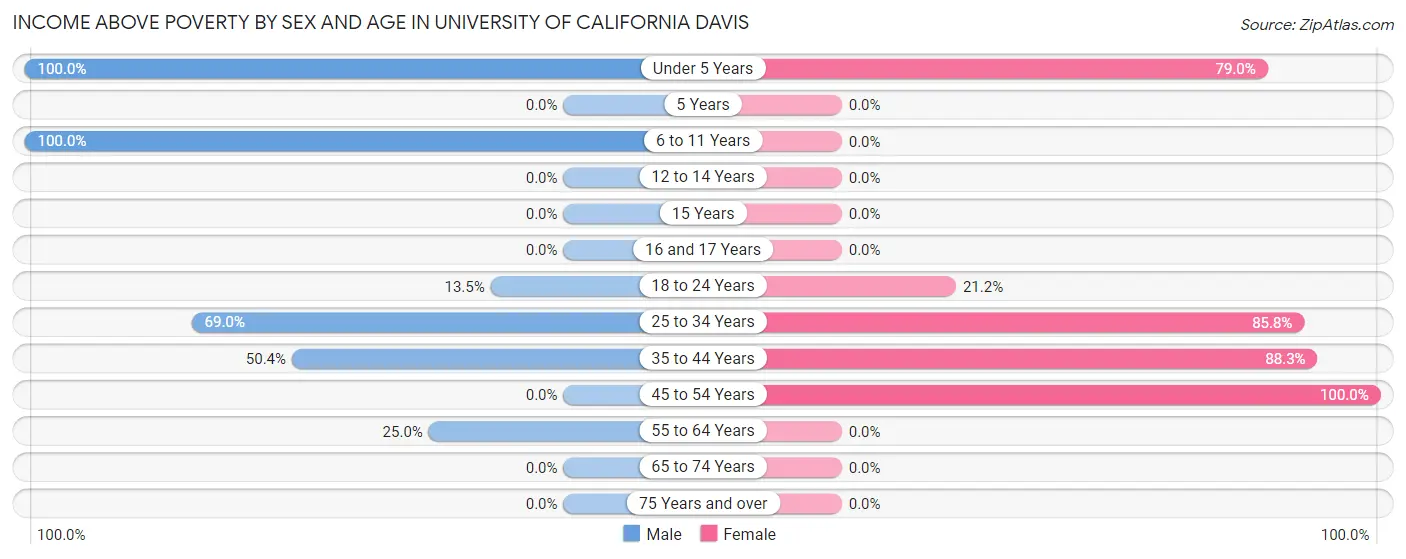
| Age Bracket | Male | Female |
| Under 5 Years | 57 (100.0%) | 49 (79.0%) |
| 5 Years | 0 (0.0%) | 0 (0.0%) |
| 6 to 11 Years | 9 (100.0%) | 0 (0.0%) |
| 12 to 14 Years | 0 (0.0%) | 0 (0.0%) |
| 15 Years | 0 (0.0%) | 0 (0.0%) |
| 16 and 17 Years | 0 (0.0%) | 0 (0.0%) |
| 18 to 24 Years | 185 (13.5%) | 269 (21.2%) |
| 25 to 34 Years | 267 (69.0%) | 242 (85.8%) |
| 35 to 44 Years | 64 (50.4%) | 113 (88.3%) |
| 45 to 54 Years | 0 (0.0%) | 7 (100.0%) |
| 55 to 64 Years | 7 (25.0%) | 0 (0.0%) |
| 65 to 74 Years | 0 (0.0%) | 0 (0.0%) |
| 75 Years and over | 0 (0.0%) | 0 (0.0%) |
| Total | 589 (29.6%) | 680 (38.9%) |
Income Below Poverty Among Married-Couple Families in University of California Davis
The poverty statistics for married-couple families in University of California Davis show that 8.2% or 15 of the total 182 families live below the poverty line. Families with 1 or 2 children have the highest poverty rate of 15.6%, comprising of 15 families. On the other hand, families with no children have the lowest poverty rate of 0.0%, which includes 0 families.
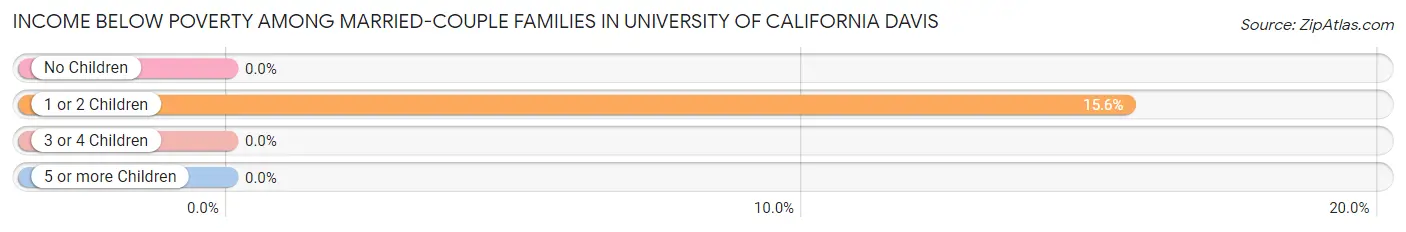
| Children | Above Poverty | Below Poverty |
| No Children | 86 (100.0%) | 0 (0.0%) |
| 1 or 2 Children | 81 (84.4%) | 15 (15.6%) |
| 3 or 4 Children | 0 (0.0%) | 0 (0.0%) |
| 5 or more Children | 0 (0.0%) | 0 (0.0%) |
| Total | 167 (91.8%) | 15 (8.2%) |
Income Below Poverty Among Single-Parent Households in University of California Davis
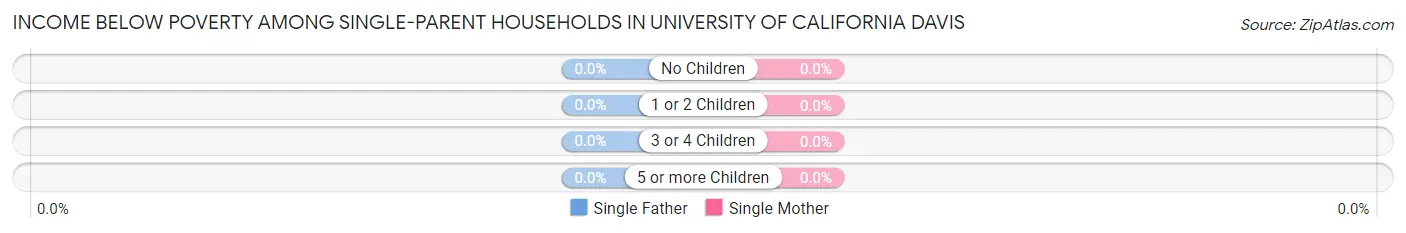
| Children | Single Father | Single Mother |
| No Children | 0 (0.0%) | 0 (0.0%) |
| 1 or 2 Children | 0 (0.0%) | 0 (0.0%) |
| 3 or 4 Children | 0 (0.0%) | 0 (0.0%) |
| 5 or more Children | 0 (0.0%) | 0 (0.0%) |
| Total | 0 (0.0%) | 0 (0.0%) |
Income Below Poverty Among Married-Couple vs Single-Parent Households in University of California Davis
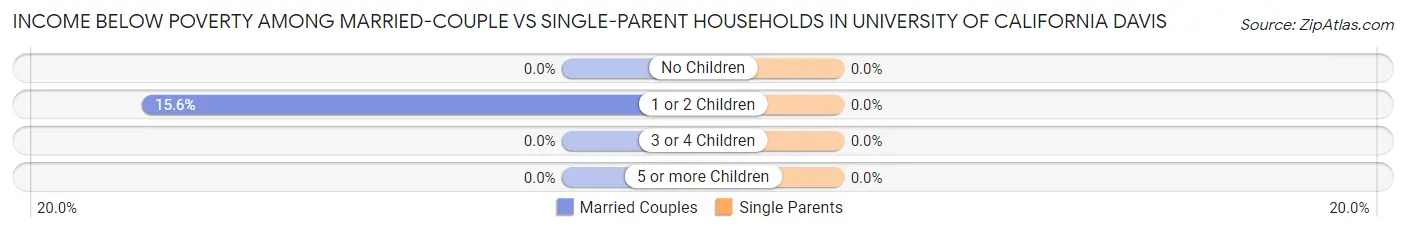
| Children | Married-Couple Families | Single-Parent Households |
| No Children | 0 (0.0%) | 0 (0.0%) |
| 1 or 2 Children | 15 (15.6%) | 0 (0.0%) |
| 3 or 4 Children | 0 (0.0%) | 0 (0.0%) |
| 5 or more Children | 0 (0.0%) | 0 (0.0%) |
| Total | 15 (8.2%) | 0 (0.0%) |
Race in University of California Davis
The most populous races in University of California Davis are White / Caucasian (3,347 | 40.7%), Asian (3,315 | 40.3%), and Hispanic or Latino (1,769 | 21.5%).
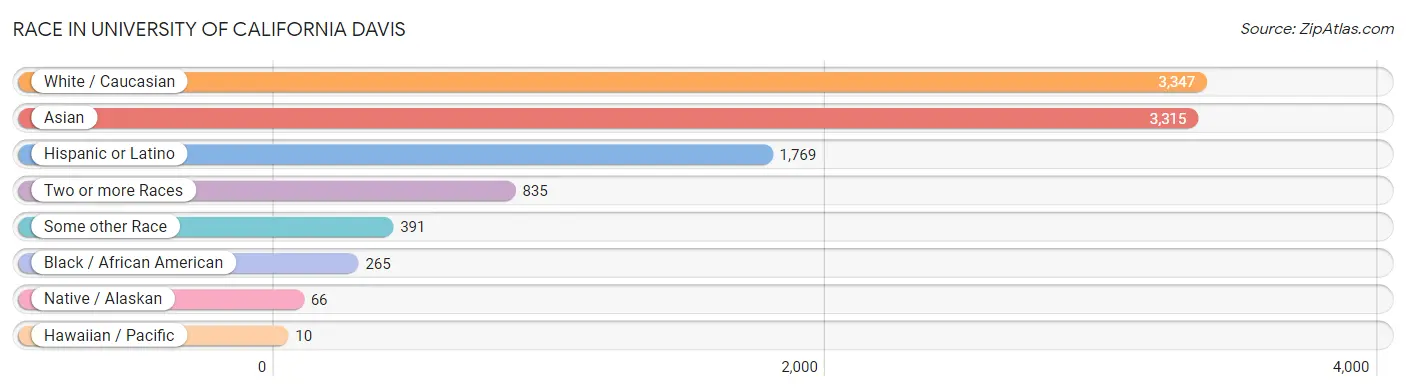
| Race | # Population | % Population |
| Asian | 3,315 | 40.3% |
| Black / African American | 265 | 3.2% |
| Hawaiian / Pacific | 10 | 0.1% |
| Hispanic or Latino | 1,769 | 21.5% |
| Native / Alaskan | 66 | 0.8% |
| White / Caucasian | 3,347 | 40.7% |
| Two or more Races | 835 | 10.2% |
| Some other Race | 391 | 4.8% |
| Total | 8,229 | 100.0% |
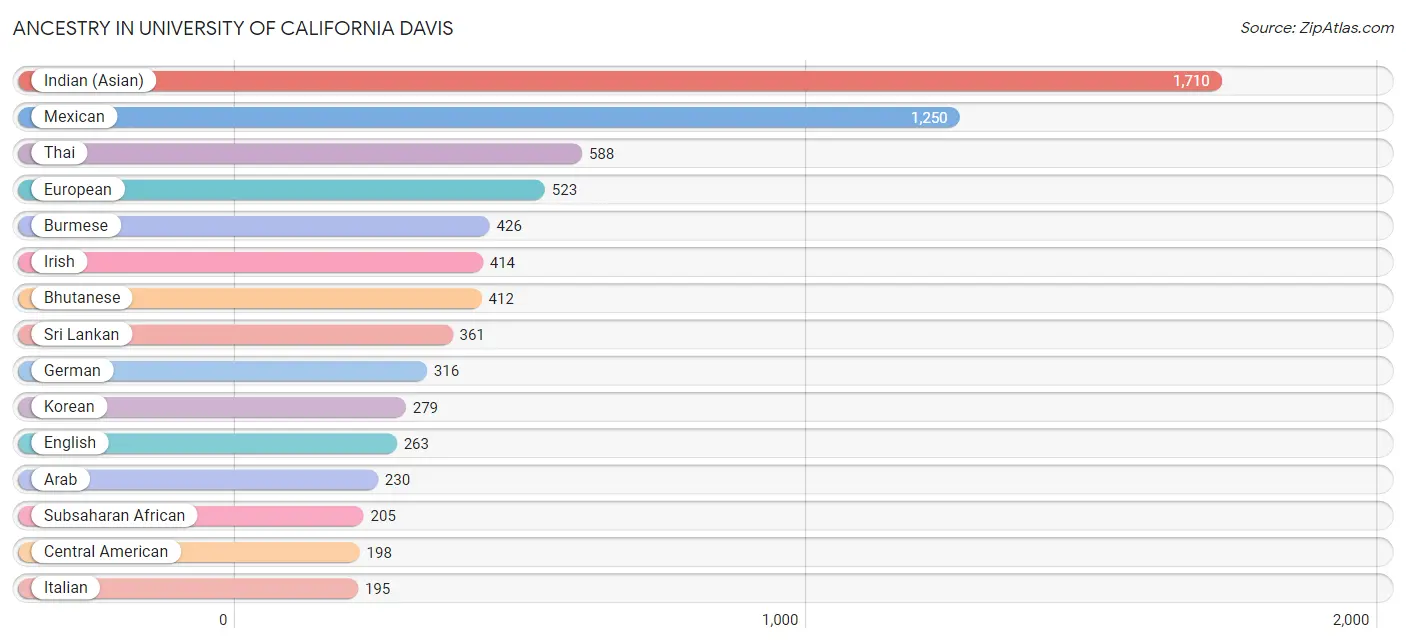
Ancestry in University of California Davis
The most populous ancestries reported in University of California Davis are Indian (Asian) (1,710 | 20.8%), Mexican (1,250 | 15.2%), Thai (588 | 7.1%), European (523 | 6.4%), and Burmese (426 | 5.2%), together accounting for 54.7% of all University of California Davis residents.
| Ancestry | # Population | % Population |
| Afghan | 5 | 0.1% |
| African | 161 | 2.0% |
| American | 132 | 1.6% |
| Apache | 8 | 0.1% |
| Arab | 230 | 2.8% |
| Argentinean | 53 | 0.6% |
| Armenian | 95 | 1.1% |
| Australian | 11 | 0.1% |
| Bhutanese | 412 | 5.0% |
| Brazilian | 16 | 0.2% |
| British | 43 | 0.5% |
| Burmese | 426 | 5.2% |
| Cambodian | 4 | 0.1% |
| Canadian | 14 | 0.2% |
| Central American | 198 | 2.4% |
| Chilean | 35 | 0.4% |
| Cuban | 43 | 0.5% |
| Danish | 67 | 0.8% |
| Dominican | 9 | 0.1% |
| Dutch | 32 | 0.4% |
| Eastern European | 4 | 0.1% |
| Egyptian | 5 | 0.1% |
| English | 263 | 3.2% |
| Ethiopian | 4 | 0.1% |
| European | 523 | 6.4% |
| Filipino | 58 | 0.7% |
| French | 34 | 0.4% |
| German | 316 | 3.8% |
| Greek | 13 | 0.2% |
| Guamanian / Chamorro | 3 | 0.0% |
| Honduran | 21 | 0.3% |
| Hungarian | 28 | 0.3% |
| Indian (Asian) | 1,710 | 20.8% |
| Indonesian | 10 | 0.1% |
| Iranian | 27 | 0.3% |
| Iraqi | 3 | 0.0% |
| Irish | 414 | 5.0% |
| Israeli | 24 | 0.3% |
| Italian | 195 | 2.4% |
| Japanese | 36 | 0.4% |
| Jordanian | 12 | 0.2% |
| Kenyan | 15 | 0.2% |
| Korean | 279 | 3.4% |
| Laotian | 7 | 0.1% |
| Latvian | 5 | 0.1% |
| Lebanese | 40 | 0.5% |
| Lithuanian | 15 | 0.2% |
| Malaysian | 11 | 0.1% |
| Mexican | 1,250 | 15.2% |
| Mexican American Indian | 34 | 0.4% |
| Mongolian | 30 | 0.4% |
| Native Hawaiian | 8 | 0.1% |
| Nicaraguan | 4 | 0.1% |
| Nigerian | 10 | 0.1% |
| Norwegian | 20 | 0.2% |
| Pakistani | 17 | 0.2% |
| Palestinian | 25 | 0.3% |
| Panamanian | 86 | 1.1% |
| Polish | 89 | 1.1% |
| Portuguese | 137 | 1.7% |
| Puerto Rican | 53 | 0.6% |
| Russian | 30 | 0.4% |
| Salvadoran | 87 | 1.1% |
| Scotch-Irish | 13 | 0.2% |
| Scottish | 110 | 1.3% |
| Senegalese | 15 | 0.2% |
| Slovak | 12 | 0.2% |
| South American | 88 | 1.1% |
| Spanish | 8 | 0.1% |
| Sri Lankan | 361 | 4.4% |
| Subsaharan African | 205 | 2.5% |
| Swedish | 135 | 1.6% |
| Swiss | 24 | 0.3% |
| Syrian | 21 | 0.3% |
| Thai | 588 | 7.1% |
| Turkish | 30 | 0.4% |
| Ukrainian | 13 | 0.2% |
| Welsh | 3 | 0.0% |
| West Indian | 17 | 0.2% | View All 79 Rows |
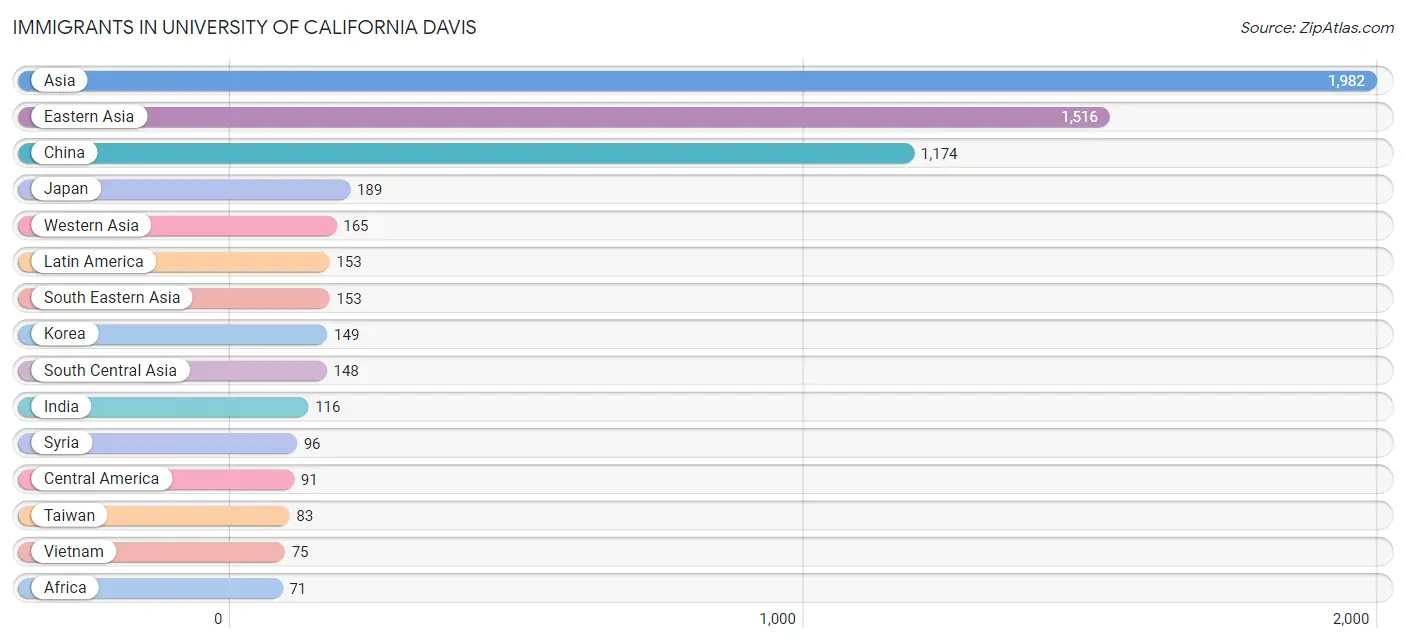
Immigrants in University of California Davis
The most numerous immigrant groups reported in University of California Davis came from Asia (1,982 | 24.1%), Eastern Asia (1,516 | 18.4%), China (1,174 | 14.3%), Japan (189 | 2.3%), and Western Asia (165 | 2.0%), together accounting for 61.1% of all University of California Davis residents.
| Immigration Origin | # Population | % Population |
| Africa | 71 | 0.9% |
| Argentina | 53 | 0.6% |
| Asia | 1,982 | 24.1% |
| Australia | 12 | 0.2% |
| Bangladesh | 27 | 0.3% |
| Brazil | 9 | 0.1% |
| Canada | 51 | 0.6% |
| Central America | 91 | 1.1% |
| China | 1,174 | 14.3% |
| Eastern Africa | 15 | 0.2% |
| Eastern Asia | 1,516 | 18.4% |
| Eastern Europe | 5 | 0.1% |
| El Salvador | 67 | 0.8% |
| Europe | 32 | 0.4% |
| France | 3 | 0.0% |
| Germany | 11 | 0.1% |
| Hong Kong | 20 | 0.2% |
| India | 116 | 1.4% |
| Indonesia | 14 | 0.2% |
| Iraq | 3 | 0.0% |
| Ireland | 13 | 0.2% |
| Israel | 9 | 0.1% |
| Japan | 189 | 2.3% |
| Jordan | 17 | 0.2% |
| Kenya | 15 | 0.2% |
| Korea | 149 | 1.8% |
| Latin America | 153 | 1.9% |
| Malaysia | 14 | 0.2% |
| Mexico | 24 | 0.3% |
| Nigeria | 56 | 0.7% |
| Northern Europe | 13 | 0.2% |
| Oceania | 51 | 0.6% |
| Pakistan | 5 | 0.1% |
| Philippines | 33 | 0.4% |
| Russia | 5 | 0.1% |
| Saudi Arabia | 4 | 0.1% |
| South America | 62 | 0.7% |
| South Central Asia | 148 | 1.8% |
| South Eastern Asia | 153 | 1.9% |
| Syria | 96 | 1.2% |
| Taiwan | 83 | 1.0% |
| Thailand | 17 | 0.2% |
| Turkey | 30 | 0.4% |
| Vietnam | 75 | 0.9% |
| Western Africa | 56 | 0.7% |
| Western Asia | 165 | 2.0% |
| Western Europe | 14 | 0.2% | View All 47 Rows |
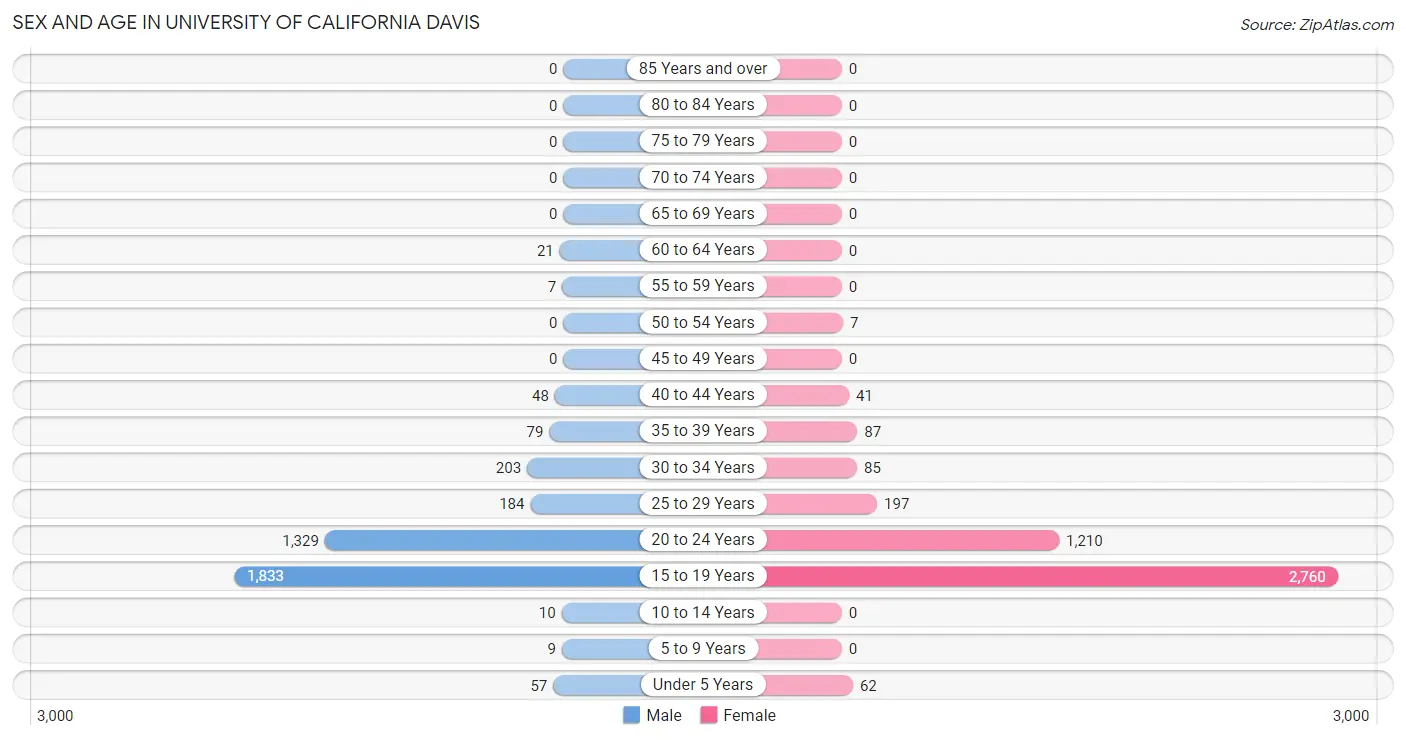
Sex and Age in University of California Davis
Sex and Age in University of California Davis
The most populous age groups in University of California Davis are 15 to 19 Years (1,833 | 48.5%) for men and 15 to 19 Years (2,760 | 62.0%) for women.
| Age Bracket | Male | Female |
| Under 5 Years | 57 (1.5%) | 62 (1.4%) |
| 5 to 9 Years | 9 (0.2%) | 0 (0.0%) |
| 10 to 14 Years | 10 (0.3%) | 0 (0.0%) |
| 15 to 19 Years | 1,833 (48.5%) | 2,760 (62.0%) |
| 20 to 24 Years | 1,329 (35.2%) | 1,210 (27.2%) |
| 25 to 29 Years | 184 (4.9%) | 197 (4.4%) |
| 30 to 34 Years | 203 (5.4%) | 85 (1.9%) |
| 35 to 39 Years | 79 (2.1%) | 87 (2.0%) |
| 40 to 44 Years | 48 (1.3%) | 41 (0.9%) |
| 45 to 49 Years | 0 (0.0%) | 0 (0.0%) |
| 50 to 54 Years | 0 (0.0%) | 7 (0.2%) |
| 55 to 59 Years | 7 (0.2%) | 0 (0.0%) |
| 60 to 64 Years | 21 (0.6%) | 0 (0.0%) |
| 65 to 69 Years | 0 (0.0%) | 0 (0.0%) |
| 70 to 74 Years | 0 (0.0%) | 0 (0.0%) |
| 75 to 79 Years | 0 (0.0%) | 0 (0.0%) |
| 80 to 84 Years | 0 (0.0%) | 0 (0.0%) |
| 85 Years and over | 0 (0.0%) | 0 (0.0%) |
| Total | 3,780 (100.0%) | 4,449 (100.0%) |
Families and Households in University of California Davis
Median Family Size in University of California Davis
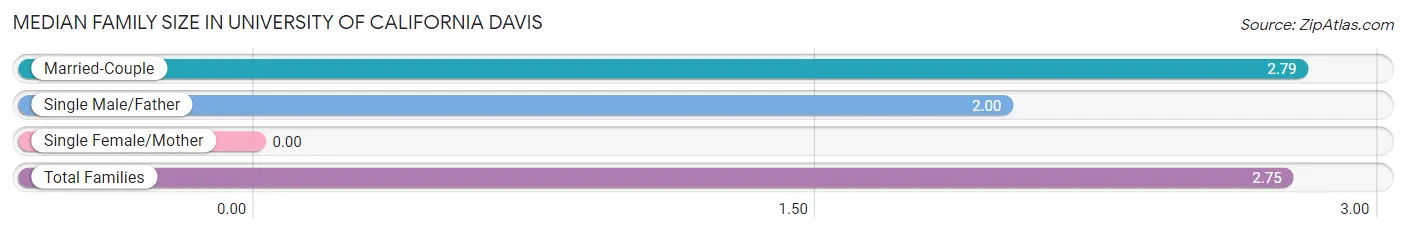
| Family Type | # Families | Family Size |
| Married-Couple | 182 (95.3%) | 2.79 |
| Single Male/Father | 9 (4.7%) | 2.00 |
| Single Female/Mother | 0 (0.0%) | - |
| Total Families | 191 (100.0%) | 2.75 |
Median Household Size in University of California Davis
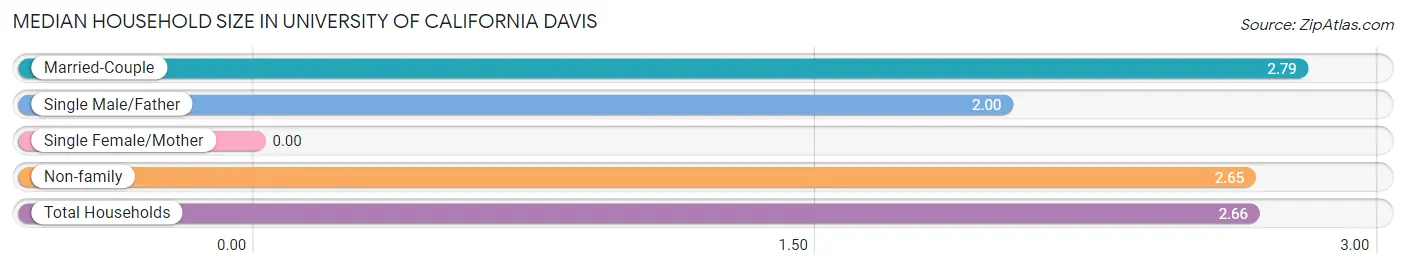
| Household Type | # Households | Household Size |
| Married-Couple | 182 (13.0%) | 2.79 |
| Single Male/Father | 9 (0.6%) | 2.00 |
| Single Female/Mother | 0 (0.0%) | - |
| Non-family | 1,211 (86.4%) | 2.65 |
| Total Households | 1,402 (100.0%) | 2.66 |
Household Size by Marriage Status in University of California Davis
Out of a total of 1,402 households in University of California Davis, 191 (13.6%) are family households, while 1,211 (86.4%) are nonfamily households. The most numerous type of family households are 2-person households, comprising 88, and the most common type of nonfamily households are 2-person households, comprising 353.
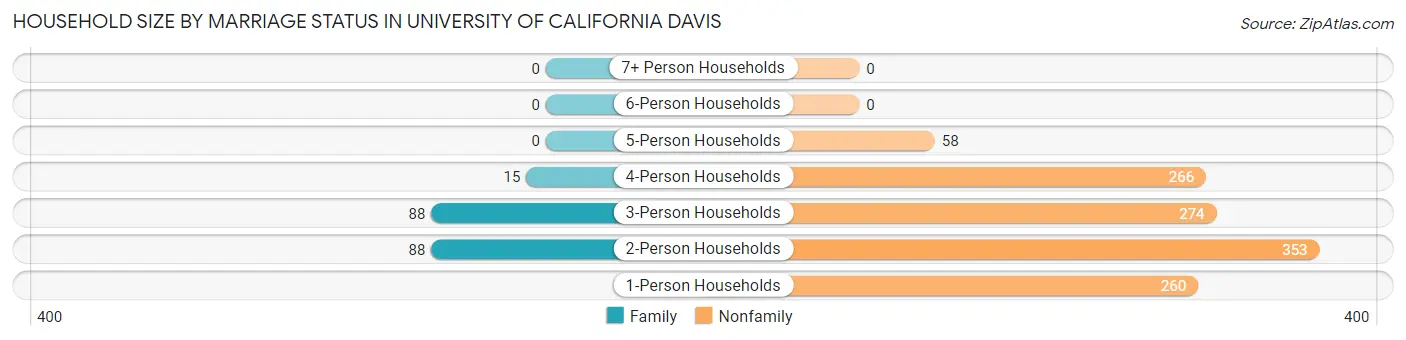
| Household Size | Family Households | Nonfamily Households |
| 1-Person Households | - | 260 (18.5%) |
| 2-Person Households | 88 (6.3%) | 353 (25.2%) |
| 3-Person Households | 88 (6.3%) | 274 (19.5%) |
| 4-Person Households | 15 (1.1%) | 266 (19.0%) |
| 5-Person Households | 0 (0.0%) | 58 (4.1%) |
| 6-Person Households | 0 (0.0%) | 0 (0.0%) |
| 7+ Person Households | 0 (0.0%) | 0 (0.0%) |
| Total | 191 (13.6%) | 1,211 (86.4%) |
Female Fertility in University of California Davis
Fertility by Age in University of California Davis
Average fertility rate in University of California Davis is 18.0 births per 1,000 women. Women in the age bracket of 20 to 34 years have the highest fertility rate with 52.0 births per 1,000 women. Women in the age bracket of 20 to 34 years acount for 100.0% of all women with births.
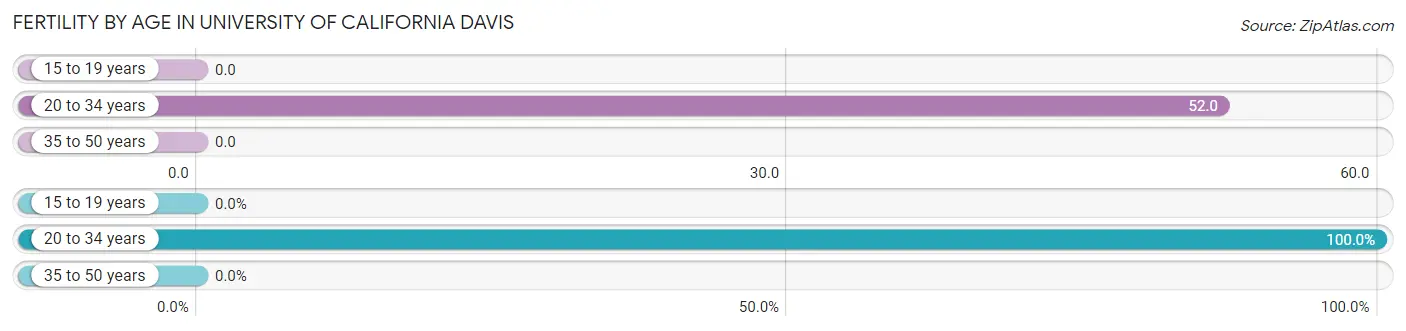
| Age Bracket | Women with Births | Births / 1,000 Women |
| 15 to 19 years | 0 (0.0%) | 0.0 |
| 20 to 34 years | 77 (100.0%) | 52.0 |
| 35 to 50 years | 0 (0.0%) | 0.0 |
| Total | 77 (100.0%) | 18.0 |
Fertility by Age by Marriage Status in University of California Davis
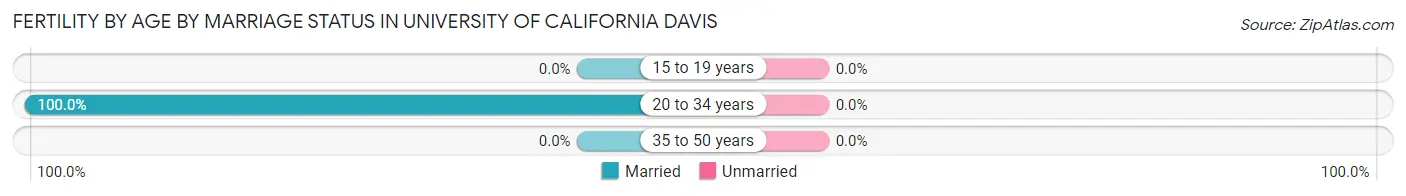
| Age Bracket | Married | Unmarried |
| 15 to 19 years | 0 (0.0%) | 0 (0.0%) |
| 20 to 34 years | 77 (100.0%) | 0 (0.0%) |
| 35 to 50 years | 0 (0.0%) | 0 (0.0%) |
| Total | 77 (100.0%) | 0 (0.0%) |
Fertility by Education in University of California Davis
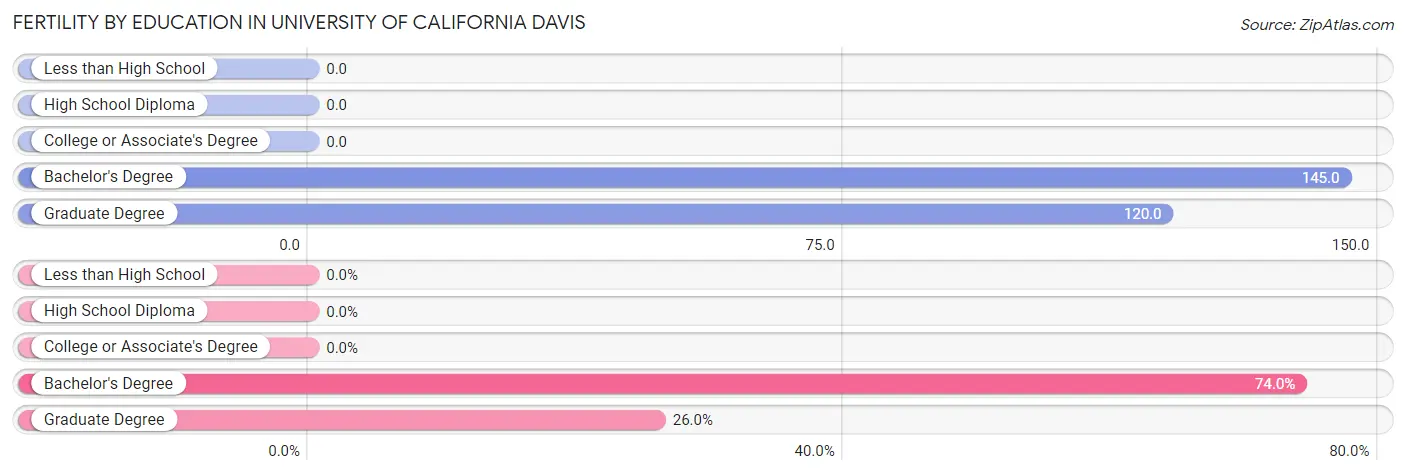
| Educational Attainment | Women with Births | Births / 1,000 Women |
| Less than High School | 0 (0.0%) | 0.0 |
| High School Diploma | 0 (0.0%) | 0.0 |
| College or Associate's Degree | 0 (0.0%) | 0.0 |
| Bachelor's Degree | 57 (74.0%) | 145.0 |
| Graduate Degree | 20 (26.0%) | 120.0 |
| Total | 77 (100.0%) | 18.0 |
Fertility by Education by Marriage Status in University of California Davis
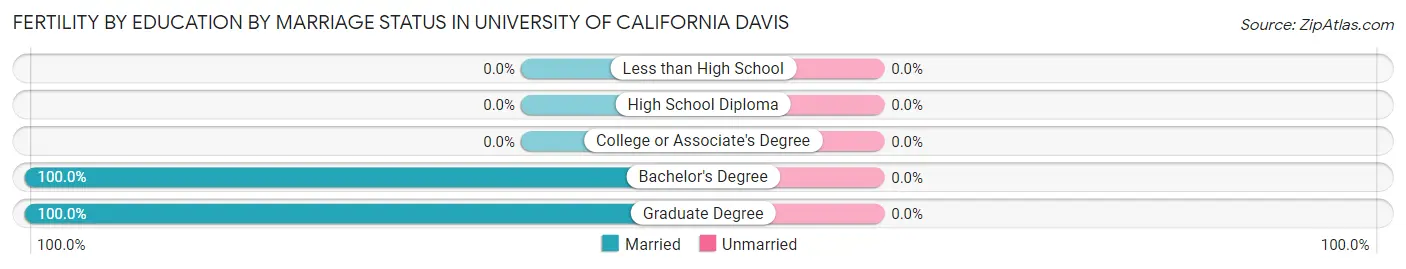
| Educational Attainment | Married | Unmarried |
| Less than High School | 0 (0.0%) | 0 (0.0%) |
| High School Diploma | 0 (0.0%) | 0 (0.0%) |
| College or Associate's Degree | 0 (0.0%) | 0 (0.0%) |
| Bachelor's Degree | 57 (100.0%) | 0 (0.0%) |
| Graduate Degree | 20 (100.0%) | 0 (0.0%) |
| Total | 77 (100.0%) | 0 (0.0%) |
Employment Characteristics in University of California Davis
Employment by Class of Employer in University of California Davis
Among the 1,765 employed individuals in University of California Davis, private company employees (832 | 47.1%), state government employees (541 | 30.6%), and not-for-profit organizations (273 | 15.5%) make up the most common classes of employment.
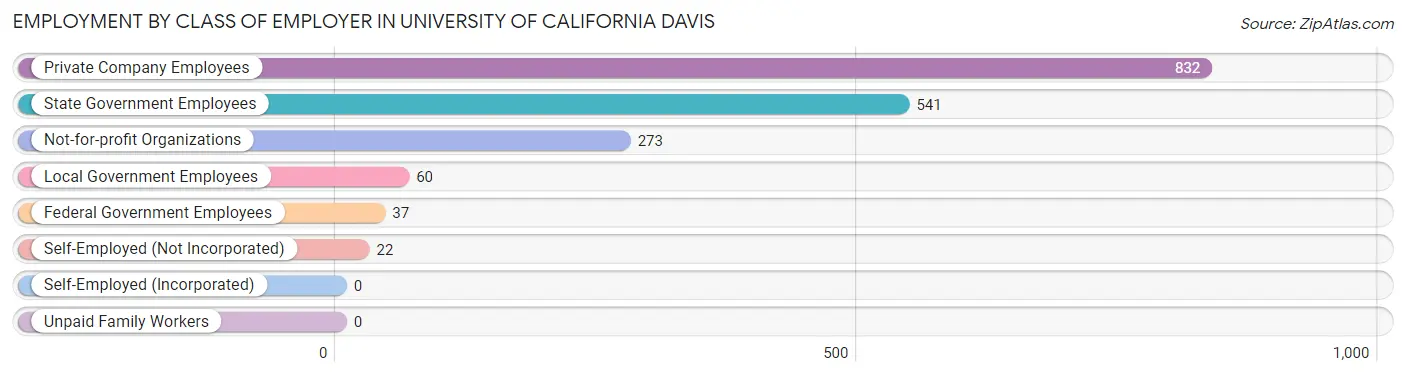
| Employer Class | # Employees | % Employees |
| Private Company Employees | 832 | 47.1% |
| Self-Employed (Incorporated) | 0 | 0.0% |
| Self-Employed (Not Incorporated) | 22 | 1.3% |
| Not-for-profit Organizations | 273 | 15.5% |
| Local Government Employees | 60 | 3.4% |
| State Government Employees | 541 | 30.6% |
| Federal Government Employees | 37 | 2.1% |
| Unpaid Family Workers | 0 | 0.0% |
| Total | 1,765 | 100.0% |
Employment Status by Age in University of California Davis
According to the labor force statistics for University of California Davis, out of the total population over 16 years of age (8,091), 26.6% or 2,152 individuals are in the labor force, with 11.3% or 243 of them unemployed. The age group with the highest labor force participation rate is 45 to 54 years, with 100.0% or 7 individuals in the labor force. Within the labor force, the 45 to 54 years age range has the highest percentage of unemployed individuals, with 100.0% or 7 of them being unemployed.
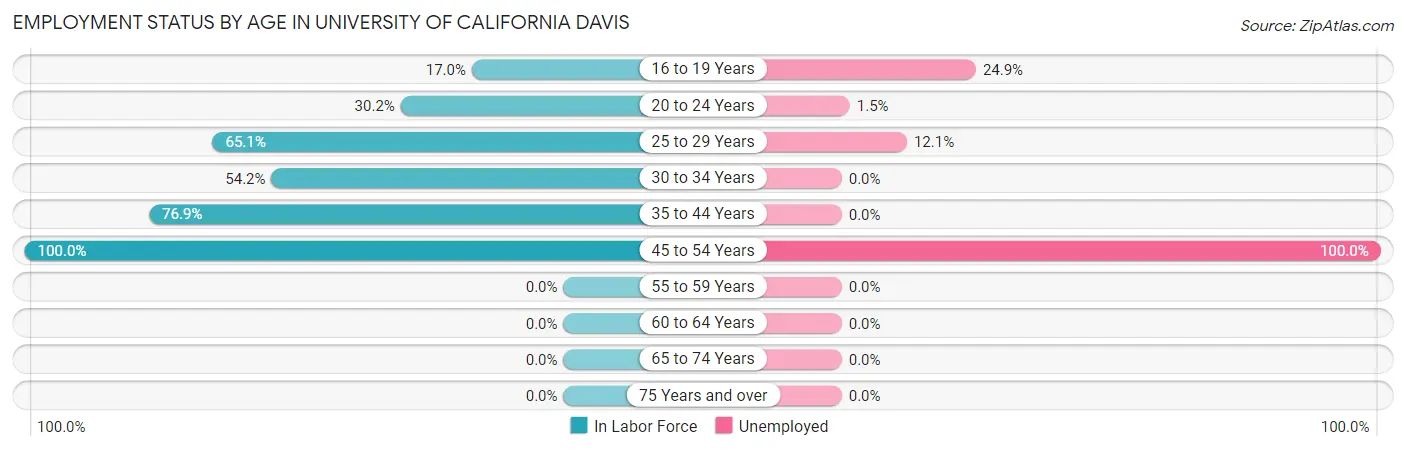
| Age Bracket | In Labor Force | Unemployed |
| 16 to 19 Years | 781 (17.0%) | 194 (24.9%) |
| 20 to 24 Years | 767 (30.2%) | 12 (1.5%) |
| 25 to 29 Years | 248 (65.1%) | 30 (12.1%) |
| 30 to 34 Years | 156 (54.2%) | 0 (0.0%) |
| 35 to 44 Years | 196 (76.9%) | 0 (0.0%) |
| 45 to 54 Years | 7 (100.0%) | 7 (100.0%) |
| 55 to 59 Years | 0 (0.0%) | 0 (0.0%) |
| 60 to 64 Years | 0 (0.0%) | 0 (0.0%) |
| 65 to 74 Years | 0 (0.0%) | 0 (0.0%) |
| 75 Years and over | 0 (0.0%) | 0 (0.0%) |
| Total | 2,152 (26.6%) | 243 (11.3%) |
Employment Status by Educational Attainment in University of California Davis
According to labor force statistics for University of California Davis, 63.3% of individuals (607) out of the total population between 25 and 64 years of age (959) are in the labor force, with 6.1% or 37 of them being unemployed. The group with the highest labor force participation rate are those with the educational attainment of less than high school, with 100.0% or 7 individuals in the labor force. Within the labor force, individuals with less than high school education have the highest percentage of unemployment, with 100.0% or 7 of them being unemployed.
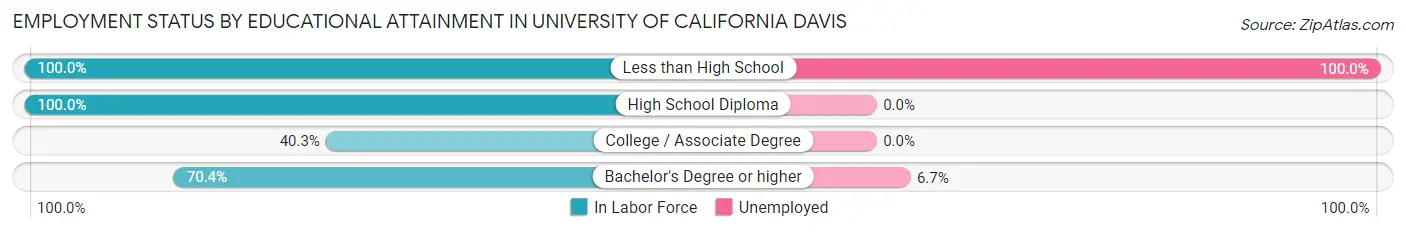
| Educational Attainment | In Labor Force | Unemployed |
| Less than High School | 7 (100.0%) | 7 (100.0%) |
| High School Diploma | 41 (100.0%) | 0 (0.0%) |
| College / Associate Degree | 110 (40.3%) | 0 (0.0%) |
| Bachelor's Degree or higher | 449 (70.4%) | 43 (6.7%) |
| Total | 607 (63.3%) | 58 (6.1%) |
Employment Occupations by Sex in University of California Davis
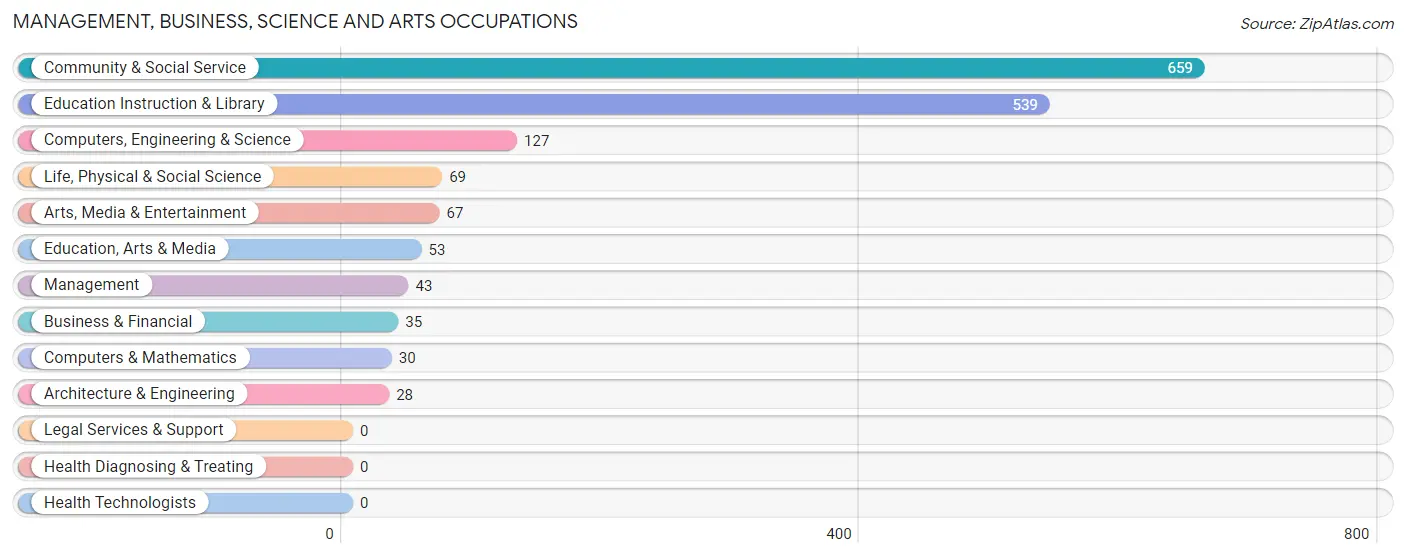
Management, Business, Science and Arts Occupations
The most common Management, Business, Science and Arts occupations in University of California Davis are Community & Social Service (659 | 34.8%), Education Instruction & Library (539 | 28.5%), Computers, Engineering & Science (127 | 6.7%), Life, Physical & Social Science (69 | 3.6%), and Arts, Media & Entertainment (67 | 3.5%).
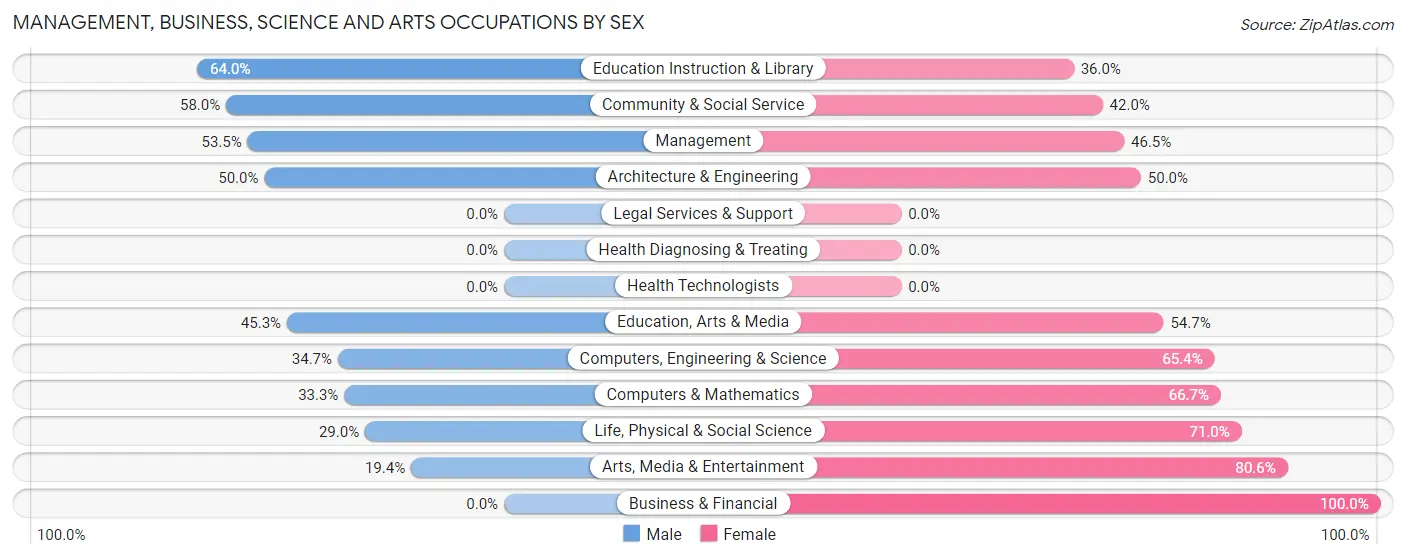
Management, Business, Science and Arts Occupations by Sex
Within the Management, Business, Science and Arts occupations in University of California Davis, the most male-oriented occupations are Education Instruction & Library (64.0%), Community & Social Service (58.0%), and Management (53.5%), while the most female-oriented occupations are Business & Financial (100.0%), Arts, Media & Entertainment (80.6%), and Life, Physical & Social Science (71.0%).
| Occupation | Male | Female |
| Management | 23 (53.5%) | 20 (46.5%) |
| Business & Financial | 0 (0.0%) | 35 (100.0%) |
| Computers, Engineering & Science | 44 (34.6%) | 83 (65.3%) |
| Computers & Mathematics | 10 (33.3%) | 20 (66.7%) |
| Architecture & Engineering | 14 (50.0%) | 14 (50.0%) |
| Life, Physical & Social Science | 20 (29.0%) | 49 (71.0%) |
| Community & Social Service | 382 (58.0%) | 277 (42.0%) |
| Education, Arts & Media | 24 (45.3%) | 29 (54.7%) |
| Legal Services & Support | 0 (0.0%) | 0 (0.0%) |
| Education Instruction & Library | 345 (64.0%) | 194 (36.0%) |
| Arts, Media & Entertainment | 13 (19.4%) | 54 (80.6%) |
| Health Diagnosing & Treating | 0 (0.0%) | 0 (0.0%) |
| Health Technologists | 0 (0.0%) | 0 (0.0%) |
| Total (Category) | 449 (52.0%) | 415 (48.0%) |
| Total (Overall) | 819 (43.2%) | 1,075 (56.8%) |
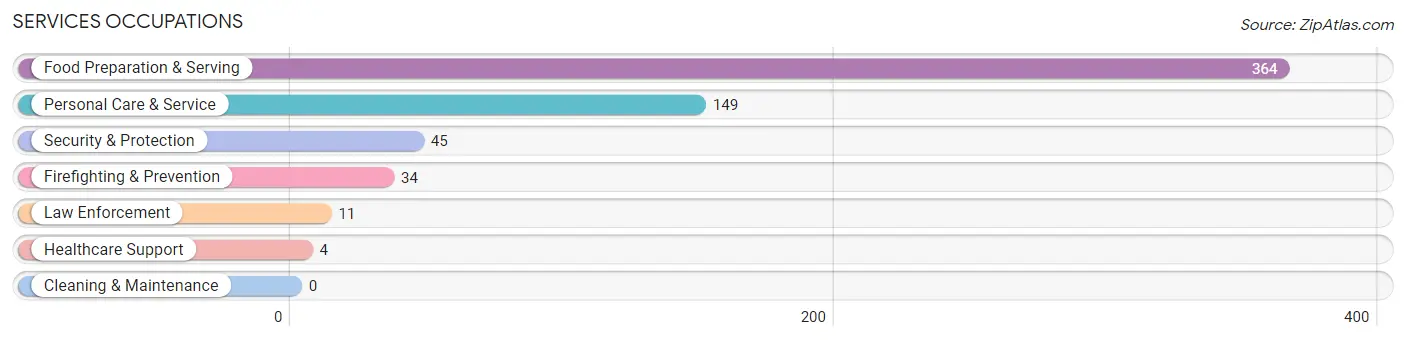
Services Occupations
The most common Services occupations in University of California Davis are Food Preparation & Serving (364 | 19.2%), Personal Care & Service (149 | 7.9%), Security & Protection (45 | 2.4%), Firefighting & Prevention (34 | 1.8%), and Law Enforcement (11 | 0.6%).
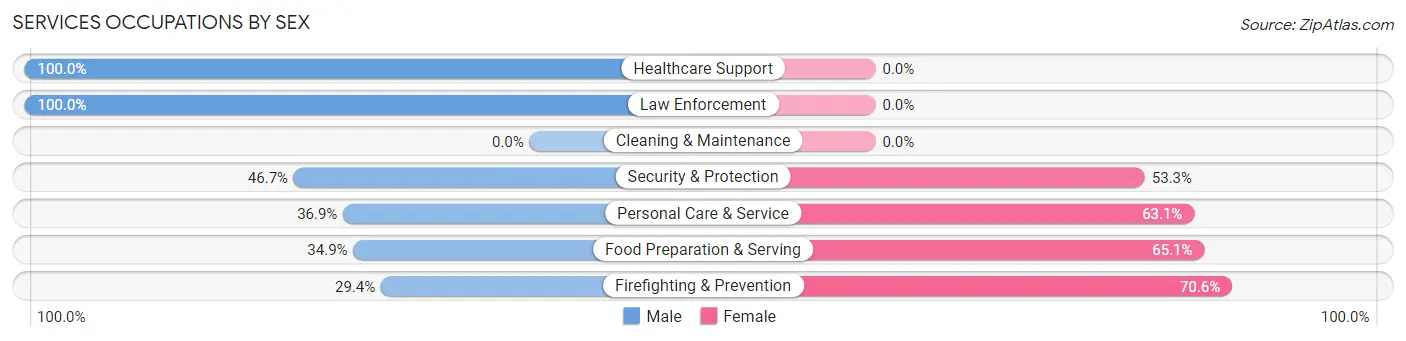
Services Occupations by Sex
Within the Services occupations in University of California Davis, the most male-oriented occupations are Healthcare Support (100.0%), Law Enforcement (100.0%), and Security & Protection (46.7%), while the most female-oriented occupations are Firefighting & Prevention (70.6%), Food Preparation & Serving (65.1%), and Personal Care & Service (63.1%).
| Occupation | Male | Female |
| Healthcare Support | 4 (100.0%) | 0 (0.0%) |
| Security & Protection | 21 (46.7%) | 24 (53.3%) |
| Firefighting & Prevention | 10 (29.4%) | 24 (70.6%) |
| Law Enforcement | 11 (100.0%) | 0 (0.0%) |
| Food Preparation & Serving | 127 (34.9%) | 237 (65.1%) |
| Cleaning & Maintenance | 0 (0.0%) | 0 (0.0%) |
| Personal Care & Service | 55 (36.9%) | 94 (63.1%) |
| Total (Category) | 207 (36.8%) | 355 (63.2%) |
| Total (Overall) | 819 (43.2%) | 1,075 (56.8%) |
Sales and Office Occupations
The most common Sales and Office occupations in University of California Davis are Office & Administration (206 | 10.9%), and Sales & Related (145 | 7.7%).
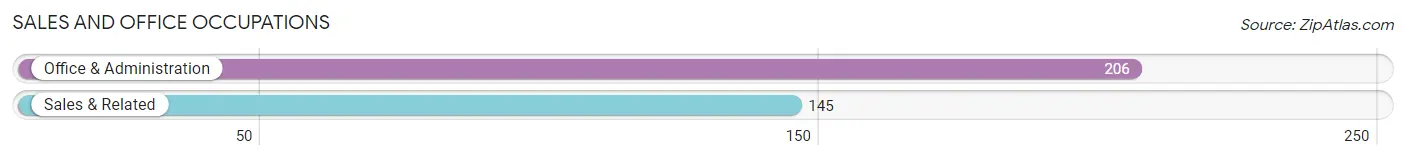
Sales and Office Occupations by Sex
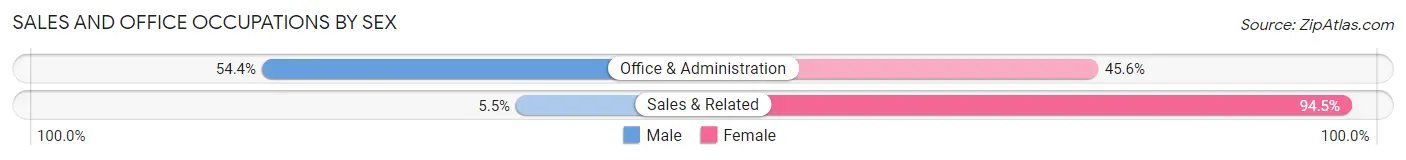
| Occupation | Male | Female |
| Sales & Related | 8 (5.5%) | 137 (94.5%) |
| Office & Administration | 112 (54.4%) | 94 (45.6%) |
| Total (Category) | 120 (34.2%) | 231 (65.8%) |
| Total (Overall) | 819 (43.2%) | 1,075 (56.8%) |
Natural Resources, Construction and Maintenance Occupations
The most common Natural Resources, Construction and Maintenance occupations in University of California Davis are Farming, Fishing & Forestry (22 | 1.2%), and Installation, Maintenance & Repair (18 | 0.9%).
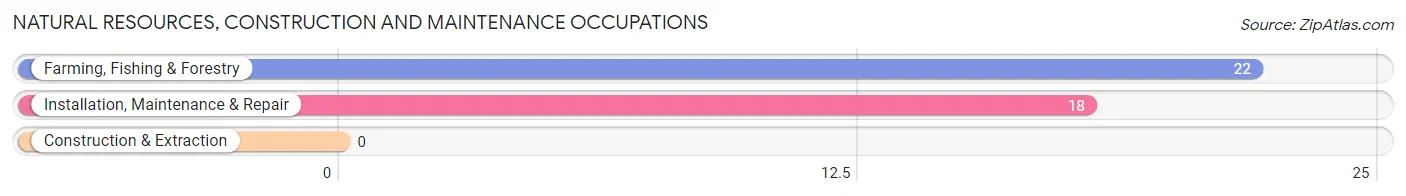
Natural Resources, Construction and Maintenance Occupations by Sex
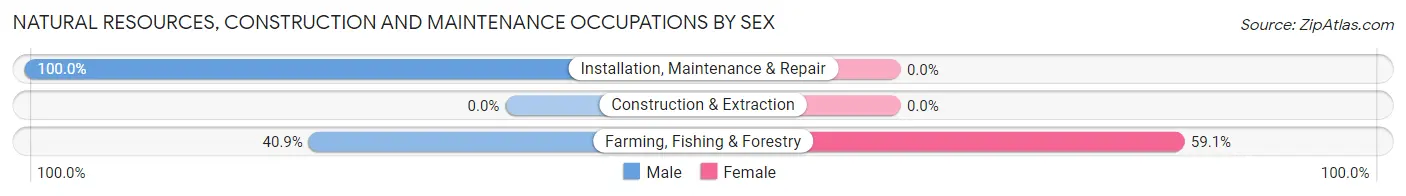
| Occupation | Male | Female |
| Farming, Fishing & Forestry | 9 (40.9%) | 13 (59.1%) |
| Construction & Extraction | 0 (0.0%) | 0 (0.0%) |
| Installation, Maintenance & Repair | 18 (100.0%) | 0 (0.0%) |
| Total (Category) | 27 (67.5%) | 13 (32.5%) |
| Total (Overall) | 819 (43.2%) | 1,075 (56.8%) |
Production, Transportation and Moving Occupations
The most common Production, Transportation and Moving occupations in University of California Davis are Material Moving (66 | 3.5%), Production (8 | 0.4%), and Transportation (3 | 0.2%).
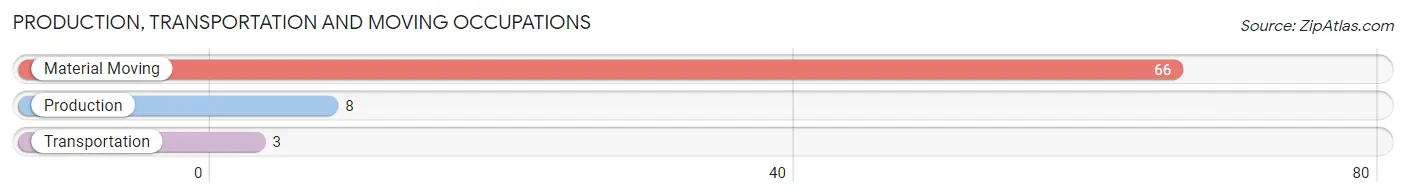
Production, Transportation and Moving Occupations by Sex
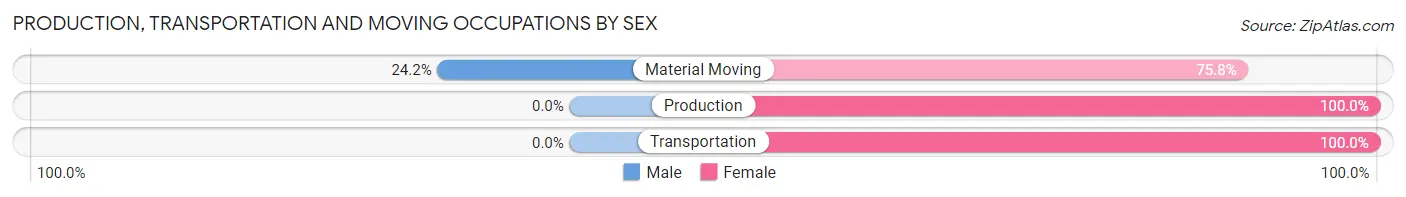
| Occupation | Male | Female |
| Production | 0 (0.0%) | 8 (100.0%) |
| Transportation | 0 (0.0%) | 3 (100.0%) |
| Material Moving | 16 (24.2%) | 50 (75.8%) |
| Total (Category) | 16 (20.8%) | 61 (79.2%) |
| Total (Overall) | 819 (43.2%) | 1,075 (56.8%) |
Employment Industries by Sex in University of California Davis
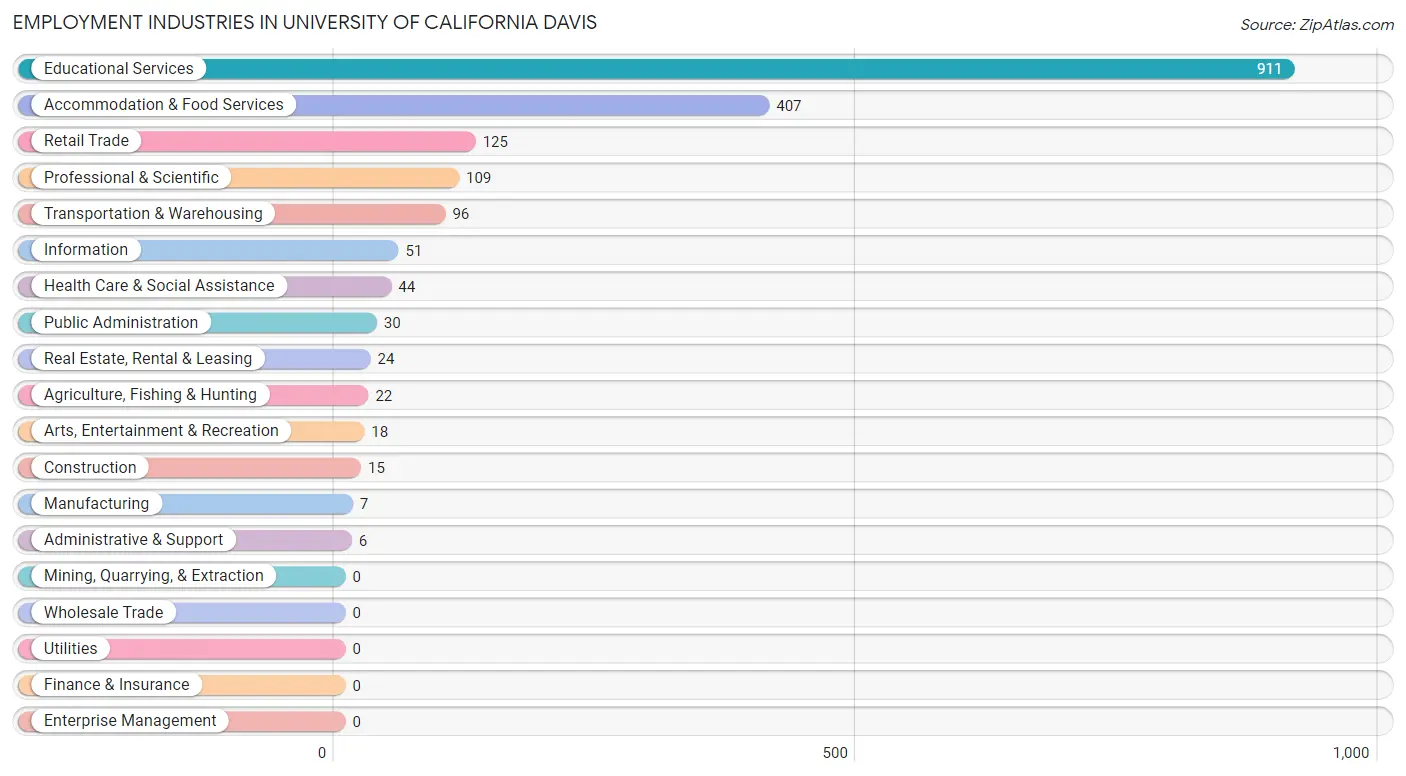
Employment Industries in University of California Davis
The major employment industries in University of California Davis include Educational Services (911 | 48.1%), Accommodation & Food Services (407 | 21.5%), Retail Trade (125 | 6.6%), Professional & Scientific (109 | 5.8%), and Transportation & Warehousing (96 | 5.1%).
Employment Industries by Sex in University of California Davis
The University of California Davis industries that see more men than women are Construction (100.0%), Manufacturing (100.0%), and Transportation & Warehousing (89.6%), whereas the industries that tend to have a higher number of women are Real Estate, Rental & Leasing (100.0%), Administrative & Support (100.0%), and Health Care & Social Assistance (90.9%).
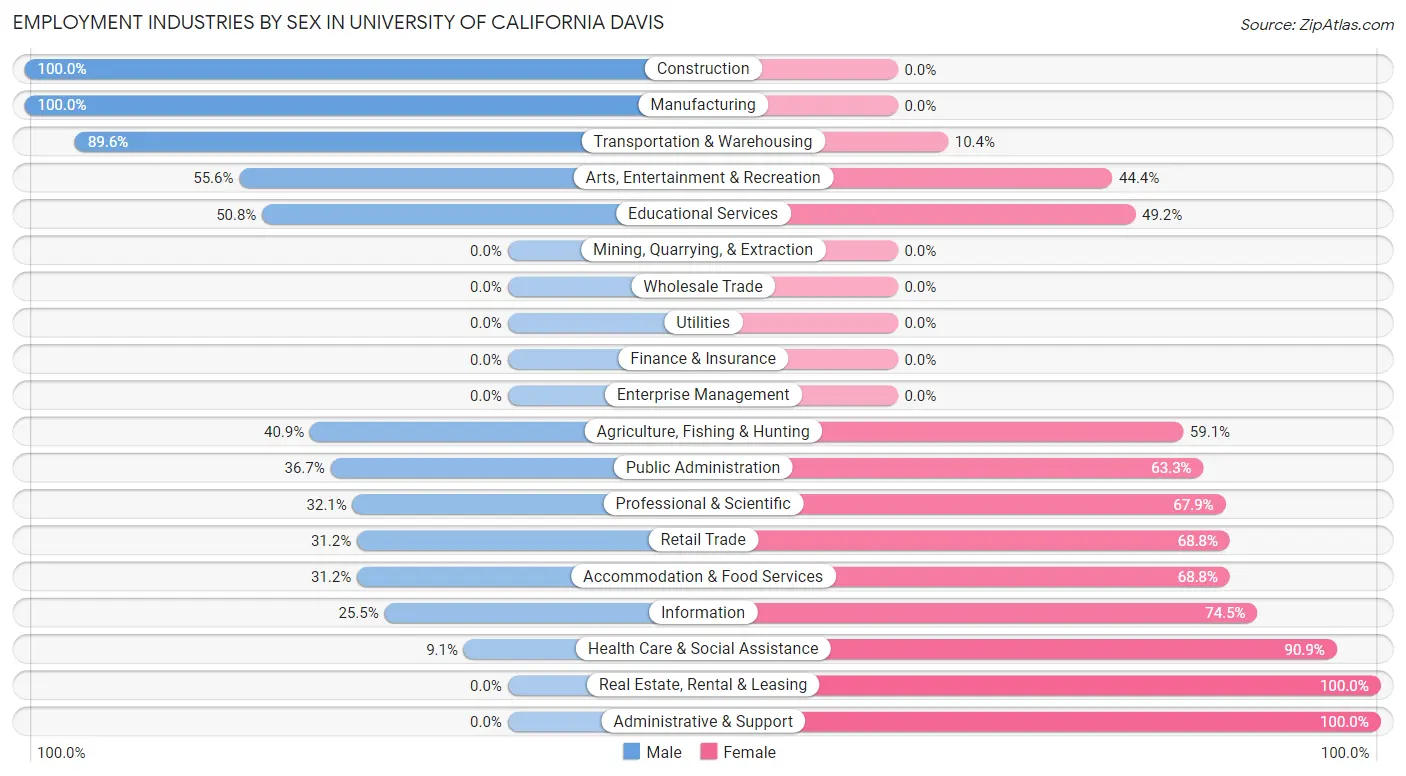
| Industry | Male | Female |
| Agriculture, Fishing & Hunting | 9 (40.9%) | 13 (59.1%) |
| Mining, Quarrying, & Extraction | 0 (0.0%) | 0 (0.0%) |
| Construction | 15 (100.0%) | 0 (0.0%) |
| Manufacturing | 7 (100.0%) | 0 (0.0%) |
| Wholesale Trade | 0 (0.0%) | 0 (0.0%) |
| Retail Trade | 39 (31.2%) | 86 (68.8%) |
| Transportation & Warehousing | 86 (89.6%) | 10 (10.4%) |
| Utilities | 0 (0.0%) | 0 (0.0%) |
| Information | 13 (25.5%) | 38 (74.5%) |
| Finance & Insurance | 0 (0.0%) | 0 (0.0%) |
| Real Estate, Rental & Leasing | 0 (0.0%) | 24 (100.0%) |
| Professional & Scientific | 35 (32.1%) | 74 (67.9%) |
| Enterprise Management | 0 (0.0%) | 0 (0.0%) |
| Administrative & Support | 0 (0.0%) | 6 (100.0%) |
| Educational Services | 463 (50.8%) | 448 (49.2%) |
| Health Care & Social Assistance | 4 (9.1%) | 40 (90.9%) |
| Arts, Entertainment & Recreation | 10 (55.6%) | 8 (44.4%) |
| Accommodation & Food Services | 127 (31.2%) | 280 (68.8%) |
| Public Administration | 11 (36.7%) | 19 (63.3%) |
| Total | 819 (43.2%) | 1,075 (56.8%) |
Education in University of California Davis
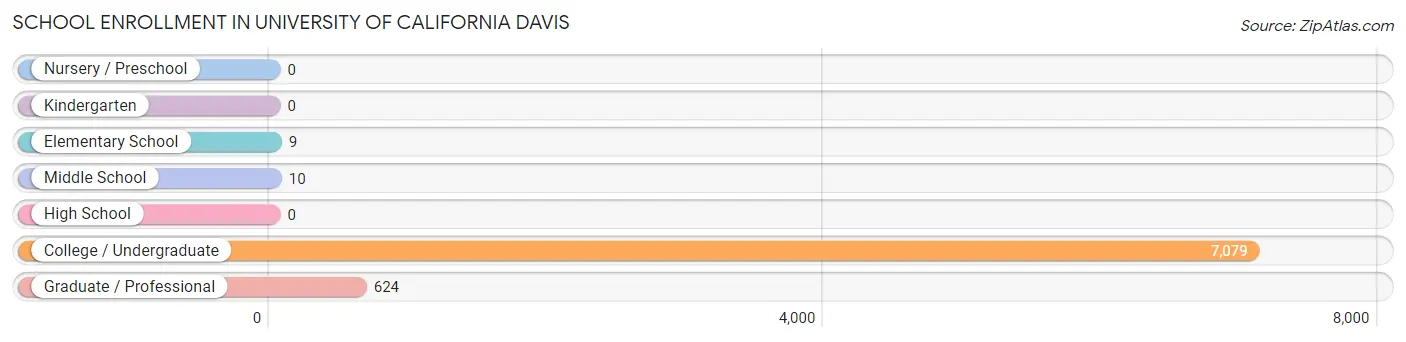
School Enrollment in University of California Davis
The most common levels of schooling among the 7,722 students in University of California Davis are college / undergraduate (7,079 | 91.7%), graduate / professional (624 | 8.1%), and middle school (10 | 0.1%).
| School Level | # Students | % Students |
| Nursery / Preschool | 0 | 0.0% |
| Kindergarten | 0 | 0.0% |
| Elementary School | 9 | 0.1% |
| Middle School | 10 | 0.1% |
| High School | 0 | 0.0% |
| College / Undergraduate | 7,079 | 91.7% |
| Graduate / Professional | 624 | 8.1% |
| Total | 7,722 | 100.0% |
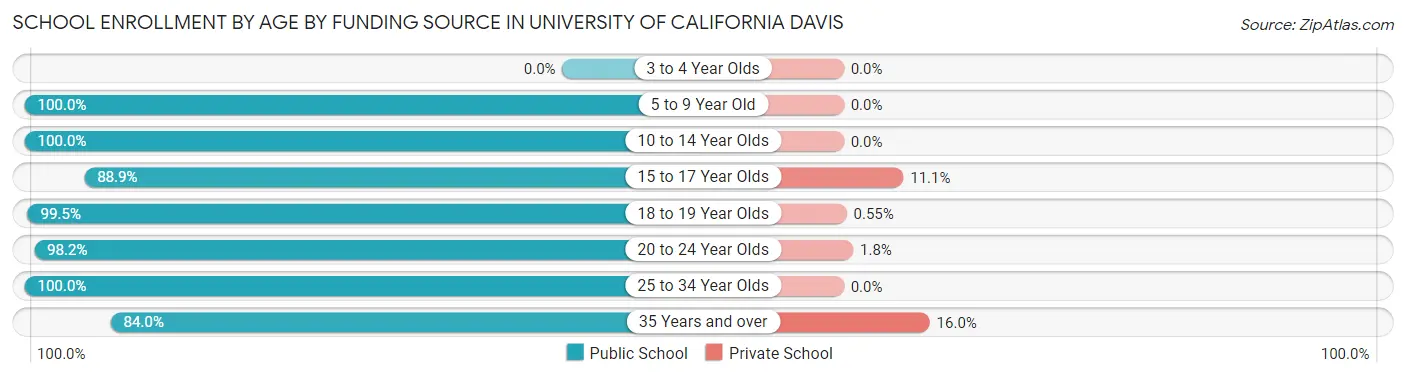
School Enrollment by Age by Funding Source in University of California Davis
Out of a total of 7,722 students who are enrolled in schools in University of California Davis, 116 (1.5%) attend a private institution, while the remaining 7,606 (98.5%) are enrolled in public schools. The age group of 35 years and over has the highest likelihood of being enrolled in private schools, with 37 (16.0% in the age bracket) enrolled. Conversely, the age group of 5 to 9 year old has the lowest likelihood of being enrolled in a private school, with 9 (100.0% in the age bracket) attending a public institution.
| Age Bracket | Public School | Private School |
| 3 to 4 Year Olds | 0 (0.0%) | 0 (0.0%) |
| 5 to 9 Year Old | 9 (100.0%) | 0 (0.0%) |
| 10 to 14 Year Olds | 10 (100.0%) | 0 (0.0%) |
| 15 to 17 Year Olds | 72 (88.9%) | 9 (11.1%) |
| 18 to 19 Year Olds | 4,487 (99.5%) | 25 (0.5%) |
| 20 to 24 Year Olds | 2,406 (98.2%) | 43 (1.8%) |
| 25 to 34 Year Olds | 430 (100.0%) | 0 (0.0%) |
| 35 Years and over | 194 (84.0%) | 37 (16.0%) |
| Total | 7,606 (98.5%) | 116 (1.5%) |
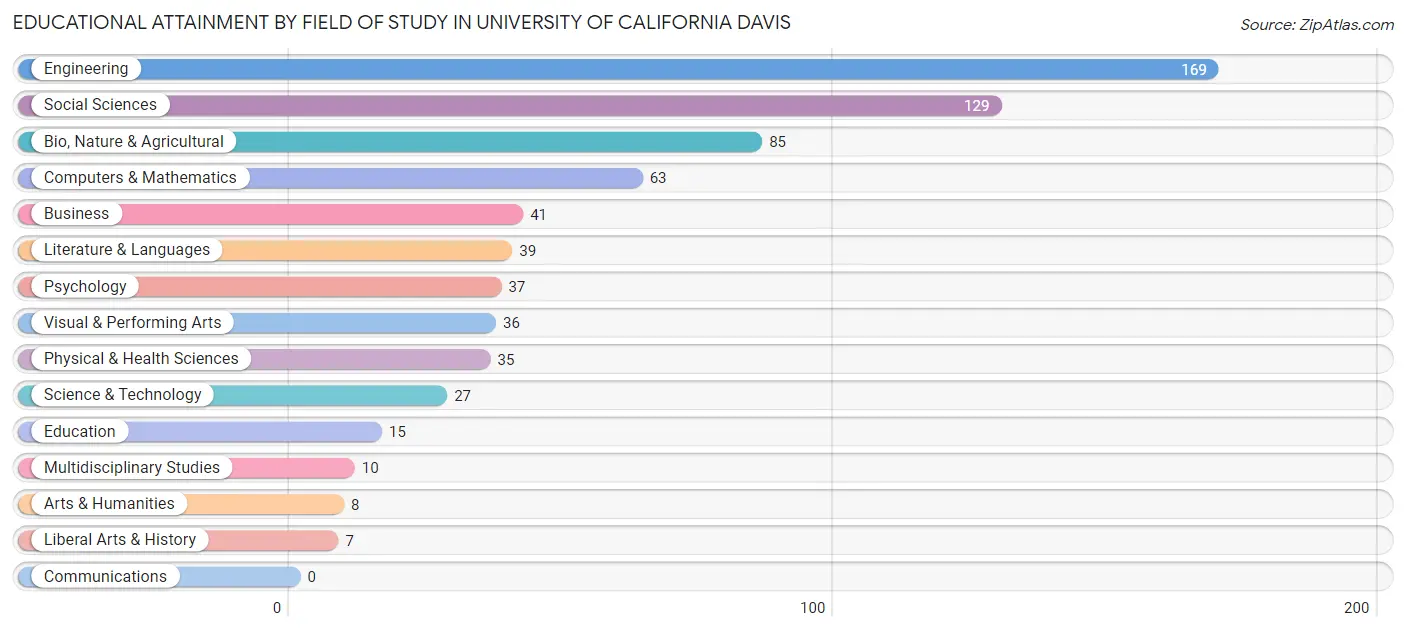
Educational Attainment by Field of Study in University of California Davis
Engineering (169 | 24.1%), social sciences (129 | 18.4%), bio, nature & agricultural (85 | 12.1%), computers & mathematics (63 | 9.0%), and business (41 | 5.9%) are the most common fields of study among 701 individuals in University of California Davis who have obtained a bachelor's degree or higher.
| Field of Study | # Graduates | % Graduates |
| Computers & Mathematics | 63 | 9.0% |
| Bio, Nature & Agricultural | 85 | 12.1% |
| Physical & Health Sciences | 35 | 5.0% |
| Psychology | 37 | 5.3% |
| Social Sciences | 129 | 18.4% |
| Engineering | 169 | 24.1% |
| Multidisciplinary Studies | 10 | 1.4% |
| Science & Technology | 27 | 3.8% |
| Business | 41 | 5.9% |
| Education | 15 | 2.1% |
| Literature & Languages | 39 | 5.6% |
| Liberal Arts & History | 7 | 1.0% |
| Visual & Performing Arts | 36 | 5.1% |
| Communications | 0 | 0.0% |
| Arts & Humanities | 8 | 1.1% |
| Total | 701 | 100.0% |
Transportation & Commute in University of California Davis
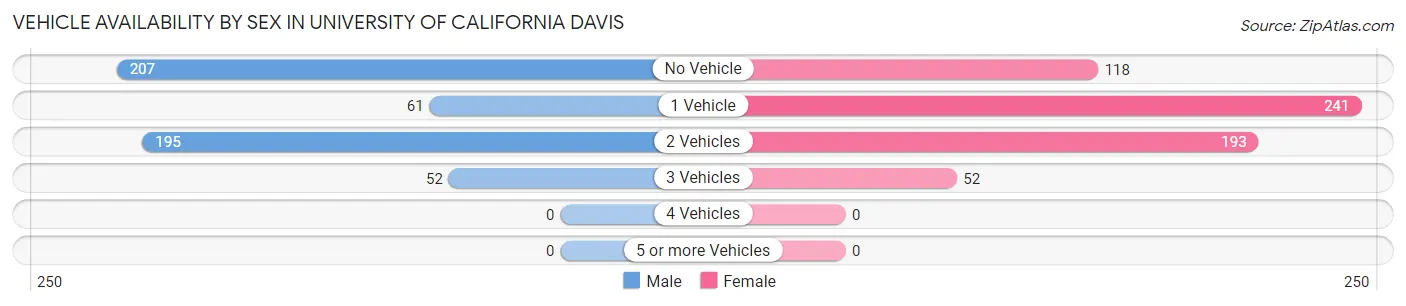
Vehicle Availability by Sex in University of California Davis
The most prevalent vehicle ownership categories in University of California Davis are males with no vehicle (207, accounting for 40.2%) and females with no vehicle (118, making up 34.3%).
| Vehicles Available | Male | Female |
| No Vehicle | 207 (40.2%) | 118 (19.5%) |
| 1 Vehicle | 61 (11.8%) | 241 (39.9%) |
| 2 Vehicles | 195 (37.9%) | 193 (32.0%) |
| 3 Vehicles | 52 (10.1%) | 52 (8.6%) |
| 4 Vehicles | 0 (0.0%) | 0 (0.0%) |
| 5 or more Vehicles | 0 (0.0%) | 0 (0.0%) |
| Total | 515 (100.0%) | 604 (100.0%) |
Commute Time in University of California Davis
The most frequently occuring commute durations in University of California Davis are 10 to 14 minutes (448 commuters, 32.1%), 15 to 19 minutes (370 commuters, 26.5%), and 5 to 9 minutes (256 commuters, 18.3%).
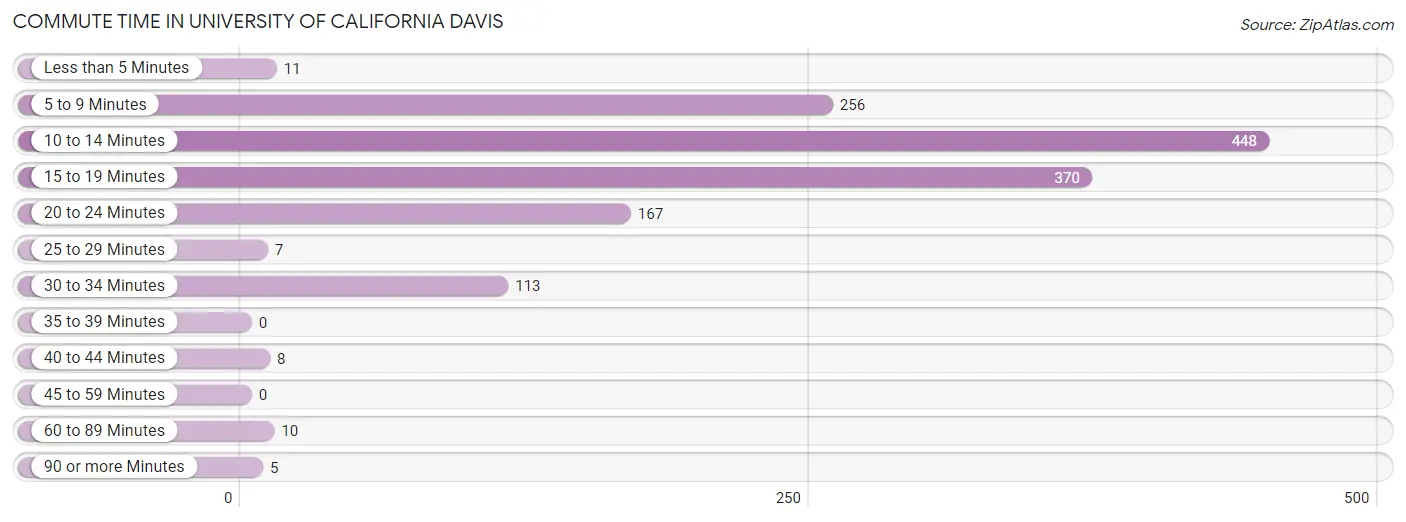
| Commute Time | # Commuters | % Commuters |
| Less than 5 Minutes | 11 | 0.8% |
| 5 to 9 Minutes | 256 | 18.3% |
| 10 to 14 Minutes | 448 | 32.1% |
| 15 to 19 Minutes | 370 | 26.5% |
| 20 to 24 Minutes | 167 | 12.0% |
| 25 to 29 Minutes | 7 | 0.5% |
| 30 to 34 Minutes | 113 | 8.1% |
| 35 to 39 Minutes | 0 | 0.0% |
| 40 to 44 Minutes | 8 | 0.6% |
| 45 to 59 Minutes | 0 | 0.0% |
| 60 to 89 Minutes | 10 | 0.7% |
| 90 or more Minutes | 5 | 0.4% |
Commute Time by Sex in University of California Davis
The most common commute times in University of California Davis are 10 to 14 minutes (217 commuters, 37.2%) for males and 10 to 14 minutes (231 commuters, 28.5%) for females.
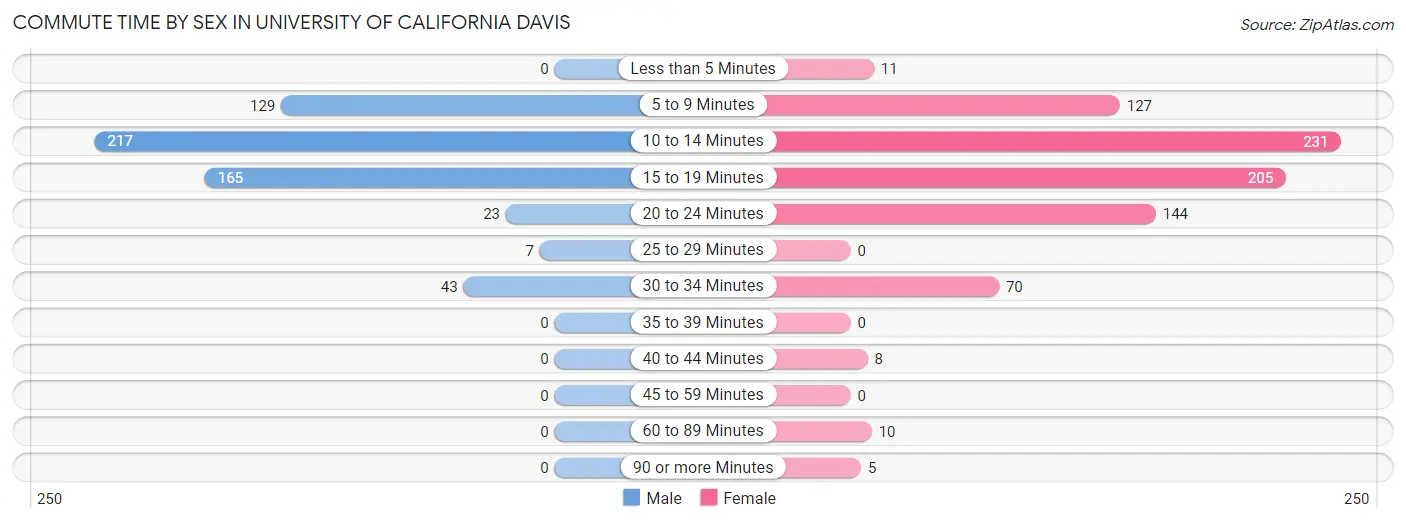
| Commute Time | Male | Female |
| Less than 5 Minutes | 0 (0.0%) | 11 (1.4%) |
| 5 to 9 Minutes | 129 (22.1%) | 127 (15.7%) |
| 10 to 14 Minutes | 217 (37.2%) | 231 (28.5%) |
| 15 to 19 Minutes | 165 (28.2%) | 205 (25.3%) |
| 20 to 24 Minutes | 23 (3.9%) | 144 (17.8%) |
| 25 to 29 Minutes | 7 (1.2%) | 0 (0.0%) |
| 30 to 34 Minutes | 43 (7.4%) | 70 (8.6%) |
| 35 to 39 Minutes | 0 (0.0%) | 0 (0.0%) |
| 40 to 44 Minutes | 0 (0.0%) | 8 (1.0%) |
| 45 to 59 Minutes | 0 (0.0%) | 0 (0.0%) |
| 60 to 89 Minutes | 0 (0.0%) | 10 (1.2%) |
| 90 or more Minutes | 0 (0.0%) | 5 (0.6%) |
Time of Departure to Work by Sex in University of California Davis
The most frequent times of departure to work in University of California Davis are 9:00 AM to 9:59 AM (152, 26.0%) for males and 11:00 AM to 11:59 AM (148, 18.2%) for females.
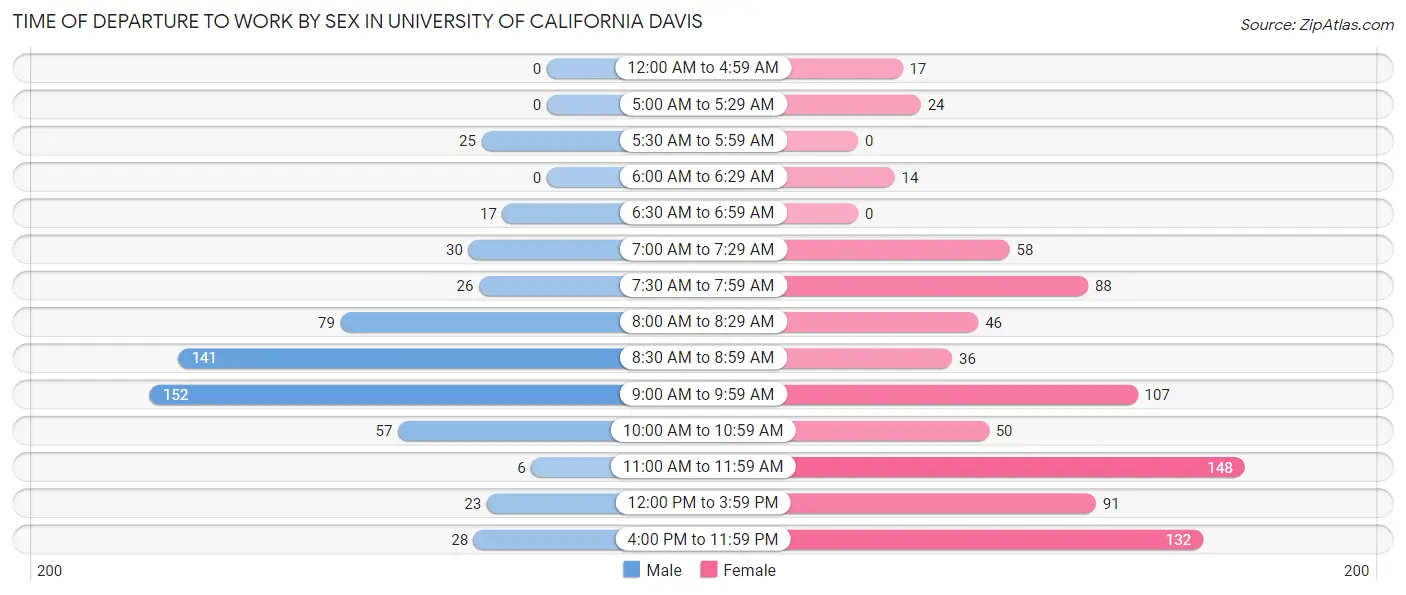
| Time of Departure | Male | Female |
| 12:00 AM to 4:59 AM | 0 (0.0%) | 17 (2.1%) |
| 5:00 AM to 5:29 AM | 0 (0.0%) | 24 (3.0%) |
| 5:30 AM to 5:59 AM | 25 (4.3%) | 0 (0.0%) |
| 6:00 AM to 6:29 AM | 0 (0.0%) | 14 (1.7%) |
| 6:30 AM to 6:59 AM | 17 (2.9%) | 0 (0.0%) |
| 7:00 AM to 7:29 AM | 30 (5.1%) | 58 (7.1%) |
| 7:30 AM to 7:59 AM | 26 (4.4%) | 88 (10.8%) |
| 8:00 AM to 8:29 AM | 79 (13.5%) | 46 (5.7%) |
| 8:30 AM to 8:59 AM | 141 (24.1%) | 36 (4.4%) |
| 9:00 AM to 9:59 AM | 152 (26.0%) | 107 (13.2%) |
| 10:00 AM to 10:59 AM | 57 (9.8%) | 50 (6.2%) |
| 11:00 AM to 11:59 AM | 6 (1.0%) | 148 (18.2%) |
| 12:00 PM to 3:59 PM | 23 (3.9%) | 91 (11.2%) |
| 4:00 PM to 11:59 PM | 28 (4.8%) | 132 (16.3%) |
| Total | 584 (100.0%) | 811 (100.0%) |
Housing Occupancy in University of California Davis
Occupancy by Ownership in University of California Davis
Of the total 1,402 dwellings in University of California Davis, owner-occupied units account for 28 (2.0%), while renter-occupied units make up 1,374 (98.0%).
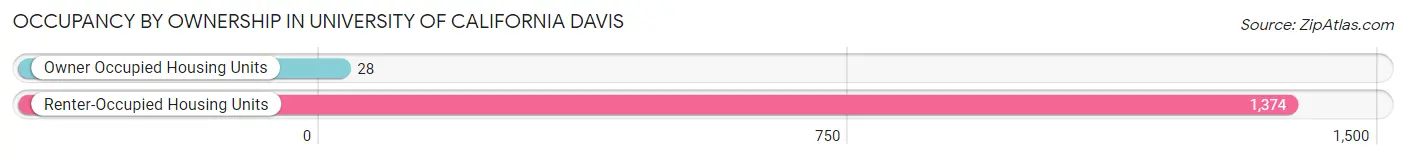
| Occupancy | # Housing Units | % Housing Units |
| Owner Occupied Housing Units | 28 | 2.0% |
| Renter-Occupied Housing Units | 1,374 | 98.0% |
| Total Occupied Housing Units | 1,402 | 100.0% |
Occupancy by Household Size in University of California Davis
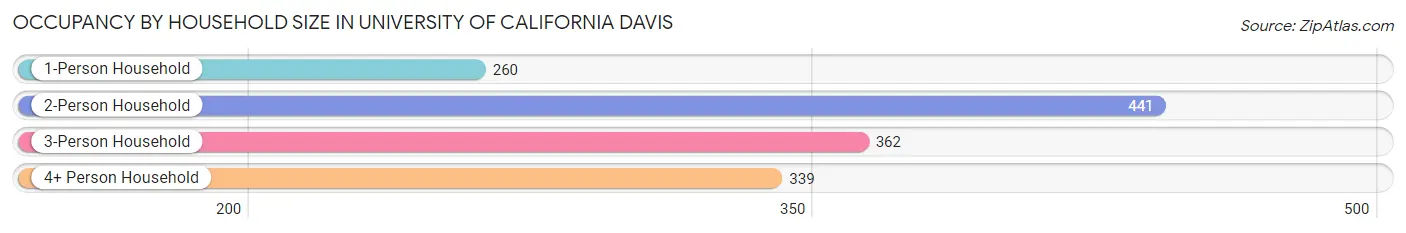
| Household Size | # Housing Units | % Housing Units |
| 1-Person Household | 260 | 18.5% |
| 2-Person Household | 441 | 31.5% |
| 3-Person Household | 362 | 25.8% |
| 4+ Person Household | 339 | 24.2% |
| Total Housing Units | 1,402 | 100.0% |
Occupancy by Ownership by Household Size in University of California Davis
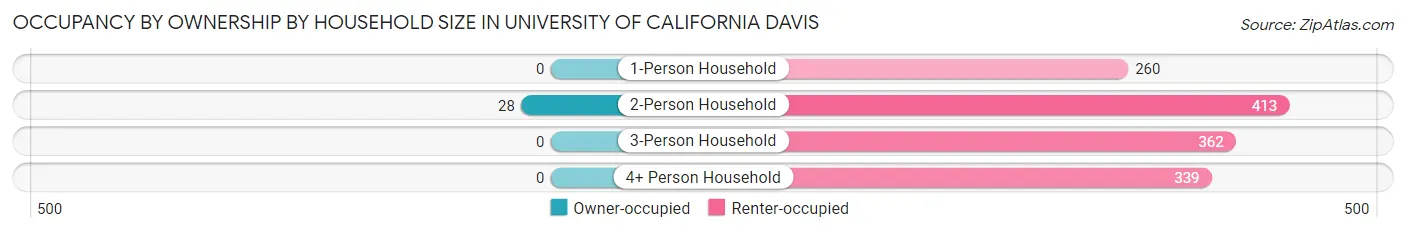
| Household Size | Owner-occupied | Renter-occupied |
| 1-Person Household | 0 (0.0%) | 260 (100.0%) |
| 2-Person Household | 28 (6.4%) | 413 (93.6%) |
| 3-Person Household | 0 (0.0%) | 362 (100.0%) |
| 4+ Person Household | 0 (0.0%) | 339 (100.0%) |
| Total Housing Units | 28 (2.0%) | 1,374 (98.0%) |
Occupancy by Educational Attainment in University of California Davis
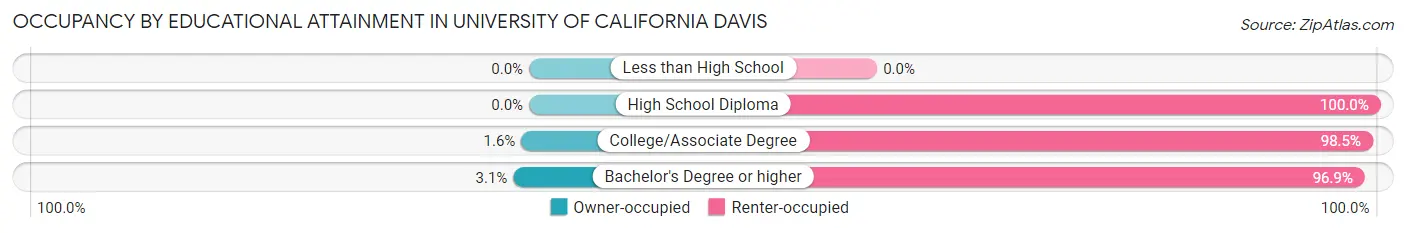
| Household Size | Owner-occupied | Renter-occupied |
| Less than High School | 0 (0.0%) | 0 (0.0%) |
| High School Diploma | 0 (0.0%) | 119 (100.0%) |
| College/Associate Degree | 12 (1.5%) | 761 (98.5%) |
| Bachelor's Degree or higher | 16 (3.1%) | 494 (96.9%) |
Occupancy by Age of Householder in University of California Davis
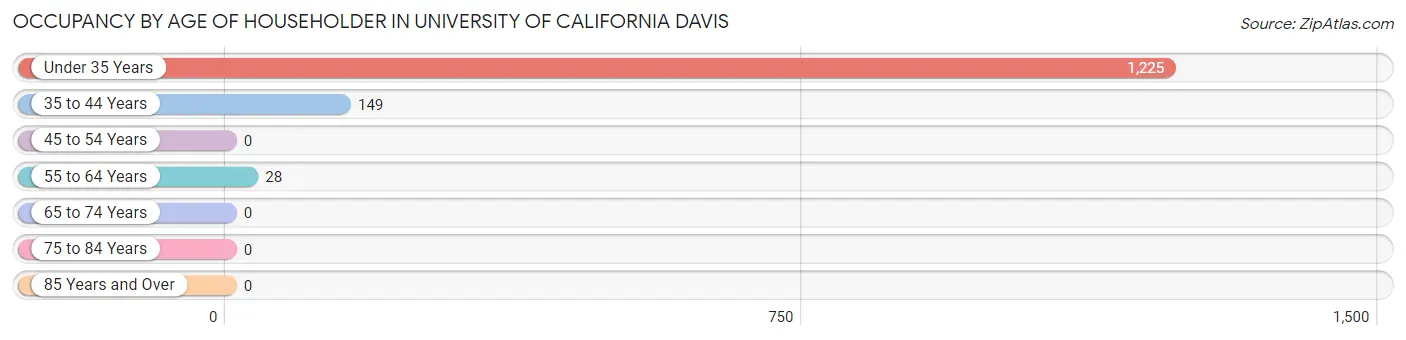
| Age Bracket | # Households | % Households |
| Under 35 Years | 1,225 | 87.4% |
| 35 to 44 Years | 149 | 10.6% |
| 45 to 54 Years | 0 | 0.0% |
| 55 to 64 Years | 28 | 2.0% |
| 65 to 74 Years | 0 | 0.0% |
| 75 to 84 Years | 0 | 0.0% |
| 85 Years and Over | 0 | 0.0% |
| Total | 1,402 | 100.0% |
Housing Finances in University of California Davis
Median Income by Occupancy in University of California Davis
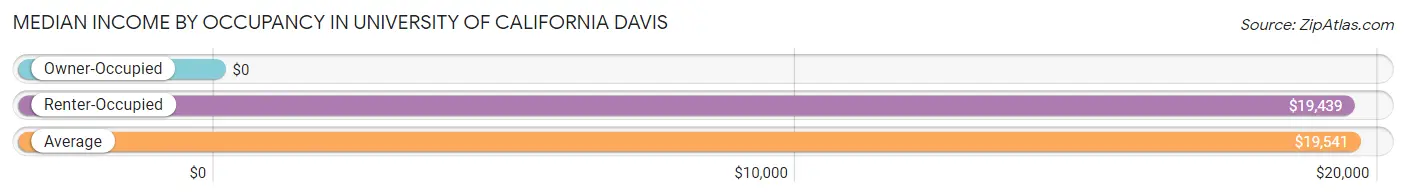
| Occupancy Type | # Households | Median Income |
| Owner-Occupied | 28 (2.0%) | $0 |
| Renter-Occupied | 1,374 (98.0%) | $19,439 |
| Average | 1,402 (100.0%) | $19,541 |
Occupancy by Householder Income Bracket in University of California Davis
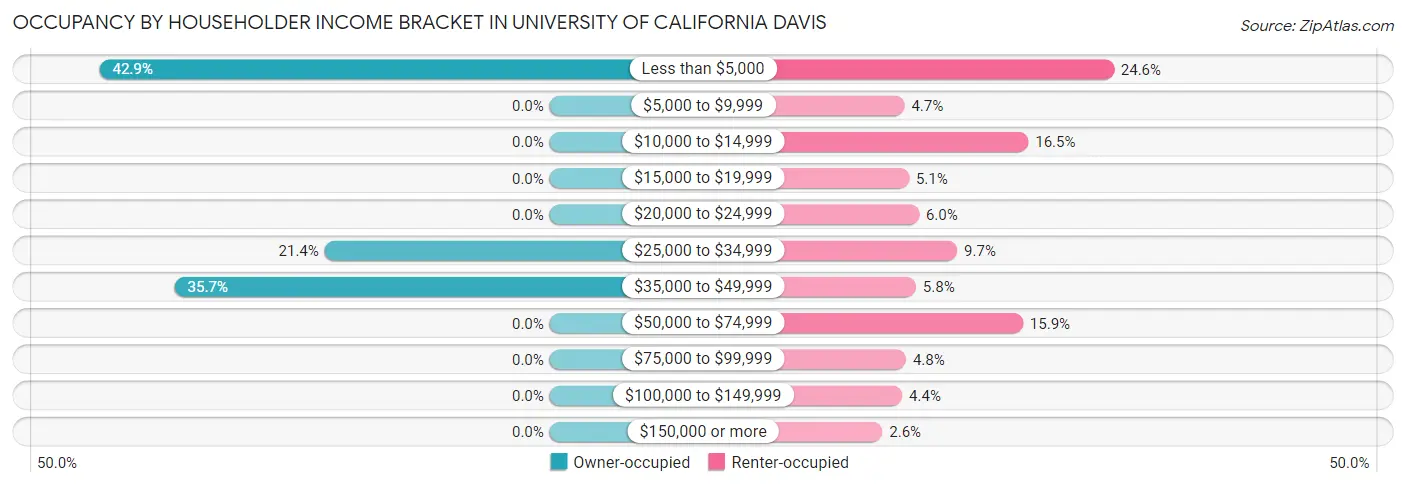
| Income Bracket | Owner-occupied | Renter-occupied |
| Less than $5,000 | 12 (42.9%) | 338 (24.6%) |
| $5,000 to $9,999 | 0 (0.0%) | 64 (4.7%) |
| $10,000 to $14,999 | 0 (0.0%) | 226 (16.5%) |
| $15,000 to $19,999 | 0 (0.0%) | 70 (5.1%) |
| $20,000 to $24,999 | 0 (0.0%) | 83 (6.0%) |
| $25,000 to $34,999 | 6 (21.4%) | 133 (9.7%) |
| $35,000 to $49,999 | 10 (35.7%) | 79 (5.8%) |
| $50,000 to $74,999 | 0 (0.0%) | 219 (15.9%) |
| $75,000 to $99,999 | 0 (0.0%) | 66 (4.8%) |
| $100,000 to $149,999 | 0 (0.0%) | 61 (4.4%) |
| $150,000 or more | 0 (0.0%) | 35 (2.5%) |
| Total | 28 (100.0%) | 1,374 (100.0%) |
Monthly Housing Cost Tiers in University of California Davis
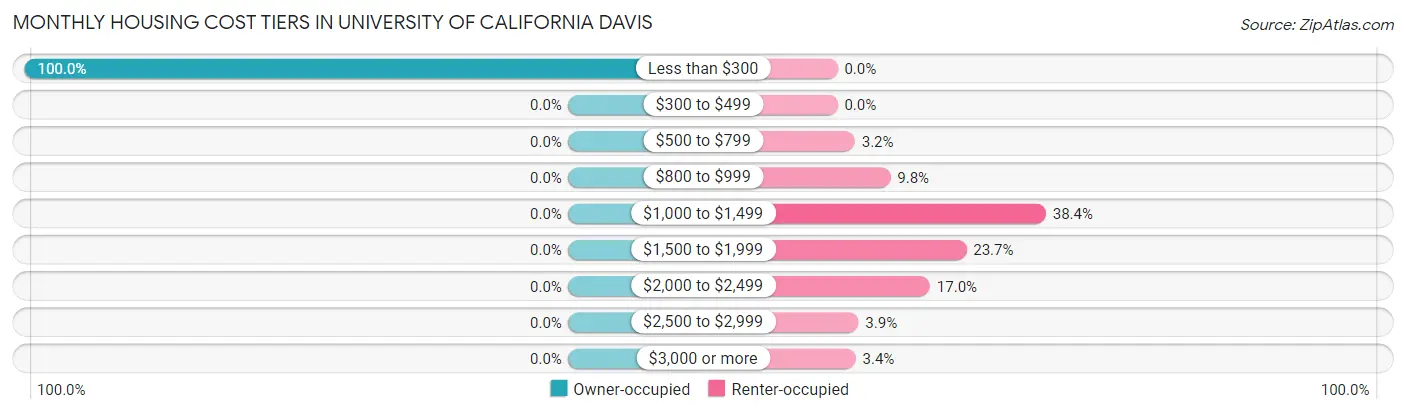
| Monthly Cost | Owner-occupied | Renter-occupied |
| Less than $300 | 28 (100.0%) | 0 (0.0%) |
| $300 to $499 | 0 (0.0%) | 0 (0.0%) |
| $500 to $799 | 0 (0.0%) | 44 (3.2%) |
| $800 to $999 | 0 (0.0%) | 134 (9.8%) |
| $1,000 to $1,499 | 0 (0.0%) | 527 (38.4%) |
| $1,500 to $1,999 | 0 (0.0%) | 326 (23.7%) |
| $2,000 to $2,499 | 0 (0.0%) | 234 (17.0%) |
| $2,500 to $2,999 | 0 (0.0%) | 53 (3.9%) |
| $3,000 or more | 0 (0.0%) | 46 (3.4%) |
| Total | 28 (100.0%) | 1,374 (100.0%) |
Physical Housing Characteristics in University of California Davis
Housing Structures in University of California Davis
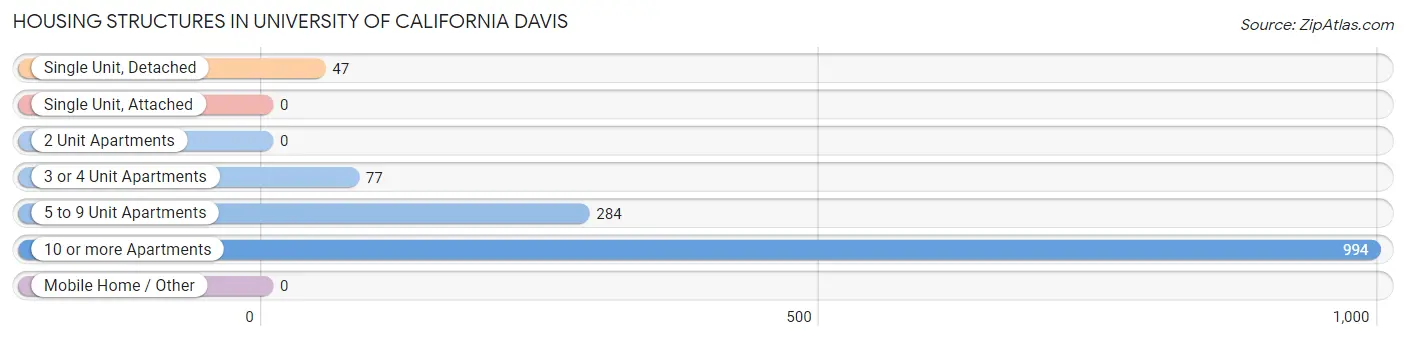
| Structure Type | # Housing Units | % Housing Units |
| Single Unit, Detached | 47 | 3.4% |
| Single Unit, Attached | 0 | 0.0% |
| 2 Unit Apartments | 0 | 0.0% |
| 3 or 4 Unit Apartments | 77 | 5.5% |
| 5 to 9 Unit Apartments | 284 | 20.3% |
| 10 or more Apartments | 994 | 70.9% |
| Mobile Home / Other | 0 | 0.0% |
| Total | 1,402 | 100.0% |
Housing Structures by Occupancy in University of California Davis
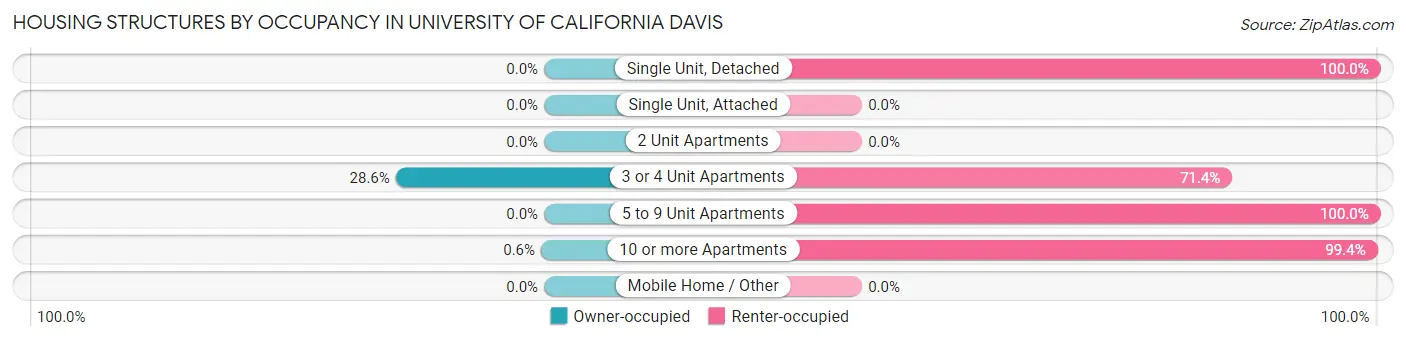
| Structure Type | Owner-occupied | Renter-occupied |
| Single Unit, Detached | 0 (0.0%) | 47 (100.0%) |
| Single Unit, Attached | 0 (0.0%) | 0 (0.0%) |
| 2 Unit Apartments | 0 (0.0%) | 0 (0.0%) |
| 3 or 4 Unit Apartments | 22 (28.6%) | 55 (71.4%) |
| 5 to 9 Unit Apartments | 0 (0.0%) | 284 (100.0%) |
| 10 or more Apartments | 6 (0.6%) | 988 (99.4%) |
| Mobile Home / Other | 0 (0.0%) | 0 (0.0%) |
| Total | 28 (2.0%) | 1,374 (98.0%) |
Housing Structures by Number of Rooms in University of California Davis
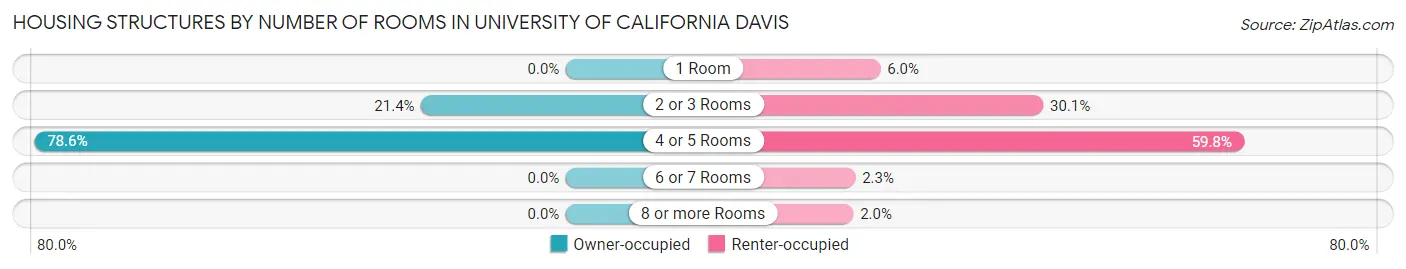
| Number of Rooms | Owner-occupied | Renter-occupied |
| 1 Room | 0 (0.0%) | 82 (6.0%) |
| 2 or 3 Rooms | 6 (21.4%) | 413 (30.1%) |
| 4 or 5 Rooms | 22 (78.6%) | 821 (59.8%) |
| 6 or 7 Rooms | 0 (0.0%) | 31 (2.3%) |
| 8 or more Rooms | 0 (0.0%) | 27 (2.0%) |
| Total | 28 (100.0%) | 1,374 (100.0%) |
Housing Structure by Heating Type in University of California Davis
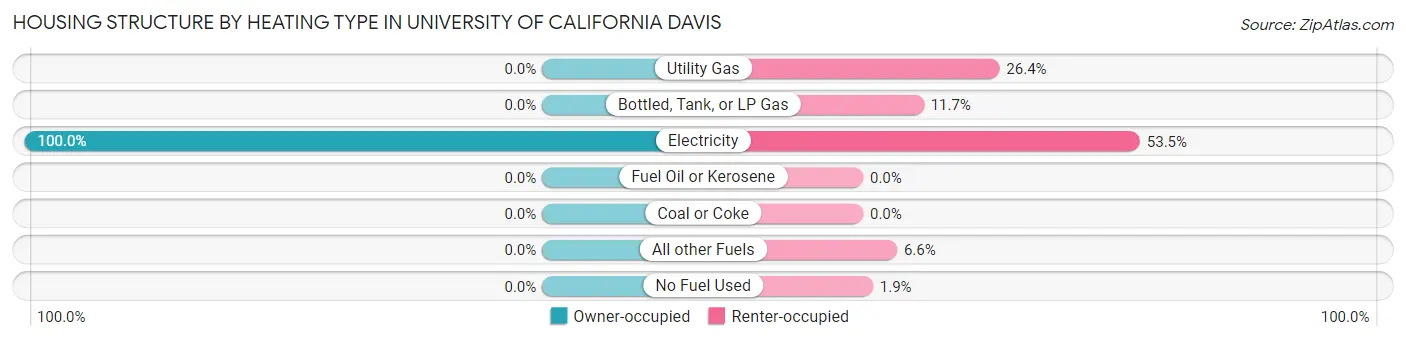
| Heating Type | Owner-occupied | Renter-occupied |
| Utility Gas | 0 (0.0%) | 362 (26.4%) |
| Bottled, Tank, or LP Gas | 0 (0.0%) | 161 (11.7%) |
| Electricity | 28 (100.0%) | 735 (53.5%) |
| Fuel Oil or Kerosene | 0 (0.0%) | 0 (0.0%) |
| Coal or Coke | 0 (0.0%) | 0 (0.0%) |
| All other Fuels | 0 (0.0%) | 90 (6.6%) |
| No Fuel Used | 0 (0.0%) | 26 (1.9%) |
| Total | 28 (100.0%) | 1,374 (100.0%) |
Household Vehicle Usage in University of California Davis
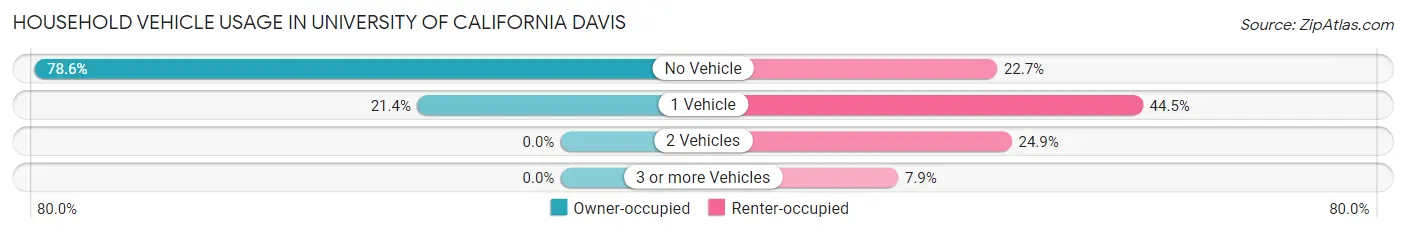
| Vehicles per Household | Owner-occupied | Renter-occupied |
| No Vehicle | 22 (78.6%) | 312 (22.7%) |
| 1 Vehicle | 6 (21.4%) | 611 (44.5%) |
| 2 Vehicles | 0 (0.0%) | 342 (24.9%) |
| 3 or more Vehicles | 0 (0.0%) | 109 (7.9%) |
| Total | 28 (100.0%) | 1,374 (100.0%) |
Real Estate & Mortgages in University of California Davis
Real Estate and Mortgage Overview in University of California Davis
| Characteristic | Without Mortgage | With Mortgage |
| Housing Units | 28 | 0 |
| Median Property Value | $115,900 | $0 |
| Median Household Income | - | - |
| Monthly Housing Costs | $168 | $0 |
| Real Estate Taxes | - | - |
Property Value by Mortgage Status in University of California Davis
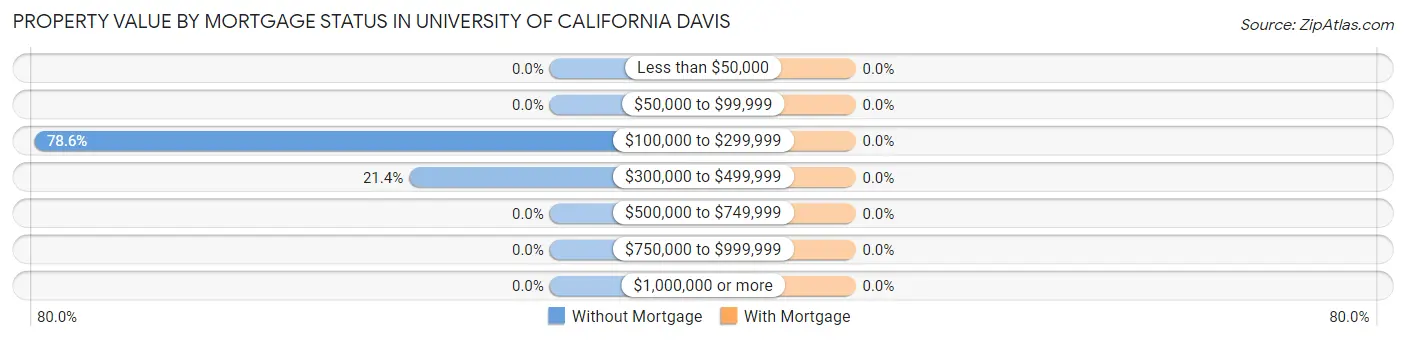
| Property Value | Without Mortgage | With Mortgage |
| Less than $50,000 | 0 (0.0%) | 0 (0.0%) |
| $50,000 to $99,999 | 0 (0.0%) | 0 (0.0%) |
| $100,000 to $299,999 | 22 (78.6%) | 0 (0.0%) |
| $300,000 to $499,999 | 6 (21.4%) | 0 (0.0%) |
| $500,000 to $749,999 | 0 (0.0%) | 0 (0.0%) |
| $750,000 to $999,999 | 0 (0.0%) | 0 (0.0%) |
| $1,000,000 or more | 0 (0.0%) | 0 (0.0%) |
| Total | 28 (100.0%) | 0 (0.0%) |
Household Income by Mortgage Status in University of California Davis
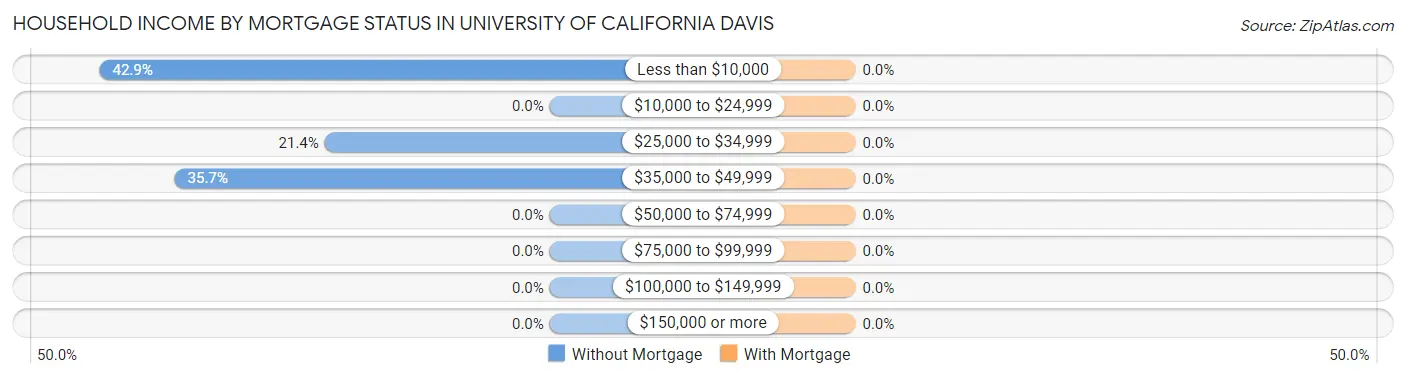
| Household Income | Without Mortgage | With Mortgage |
| Less than $10,000 | 12 (42.9%) | 0 (0.0%) |
| $10,000 to $24,999 | 0 (0.0%) | 0 (0.0%) |
| $25,000 to $34,999 | 6 (21.4%) | 0 (0.0%) |
| $35,000 to $49,999 | 10 (35.7%) | 0 (0.0%) |
| $50,000 to $74,999 | 0 (0.0%) | 0 (0.0%) |
| $75,000 to $99,999 | 0 (0.0%) | 0 (0.0%) |
| $100,000 to $149,999 | 0 (0.0%) | 0 (0.0%) |
| $150,000 or more | 0 (0.0%) | 0 (0.0%) |
| Total | 28 (100.0%) | 0 (0.0%) |
Property Value to Household Income Ratio in University of California Davis
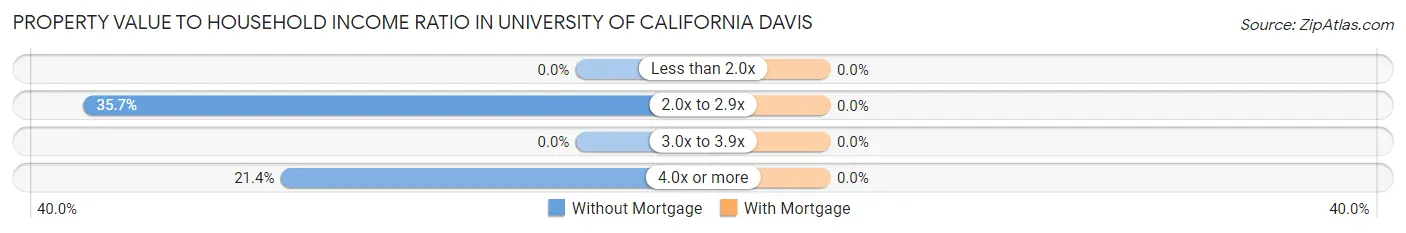
| Value-to-Income Ratio | Without Mortgage | With Mortgage |
| Less than 2.0x | 0 (0.0%) | 0 (0.0%) |
| 2.0x to 2.9x | 10 (35.7%) | 0 (0.0%) |
| 3.0x to 3.9x | 0 (0.0%) | 0 (0.0%) |
| 4.0x or more | 6 (21.4%) | 0 (0.0%) |
| Total | 28 (100.0%) | 0 (0.0%) |
Real Estate Taxes by Mortgage Status in University of California Davis
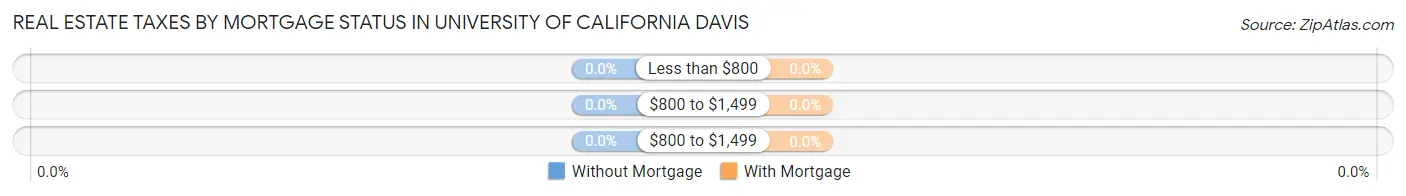
| Property Taxes | Without Mortgage | With Mortgage |
| Less than $800 | 0 (0.0%) | 0 (0.0%) |
| $800 to $1,499 | 0 (0.0%) | 0 (0.0%) |
| $800 to $1,499 | 0 (0.0%) | 0 (0.0%) |
| Total | 28 (100.0%) | 0 (0.0%) |
Health & Disability in University of California Davis
Health Insurance Coverage by Age in University of California Davis
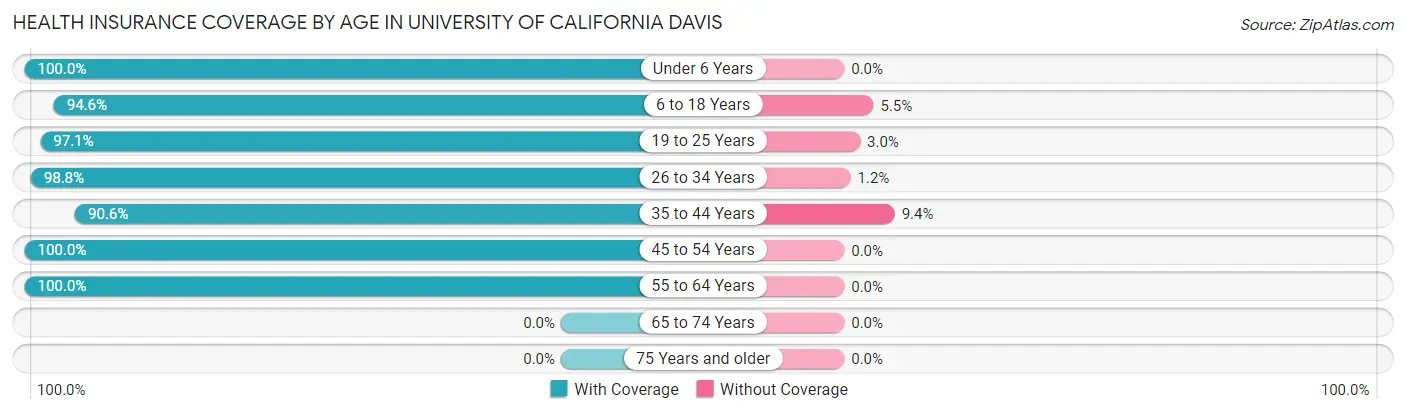
| Age Bracket | With Coverage | Without Coverage |
| Under 6 Years | 119 (100.0%) | 0 (0.0%) |
| 6 to 18 Years | 2,756 (94.6%) | 159 (5.4%) |
| 19 to 25 Years | 4,246 (97.1%) | 129 (2.9%) |
| 26 to 34 Years | 506 (98.8%) | 6 (1.2%) |
| 35 to 44 Years | 231 (90.6%) | 24 (9.4%) |
| 45 to 54 Years | 7 (100.0%) | 0 (0.0%) |
| 55 to 64 Years | 28 (100.0%) | 0 (0.0%) |
| 65 to 74 Years | 0 (0.0%) | 0 (0.0%) |
| 75 Years and older | 0 (0.0%) | 0 (0.0%) |
| Total | 7,893 (96.1%) | 318 (3.9%) |
Health Insurance Coverage by Citizenship Status in University of California Davis
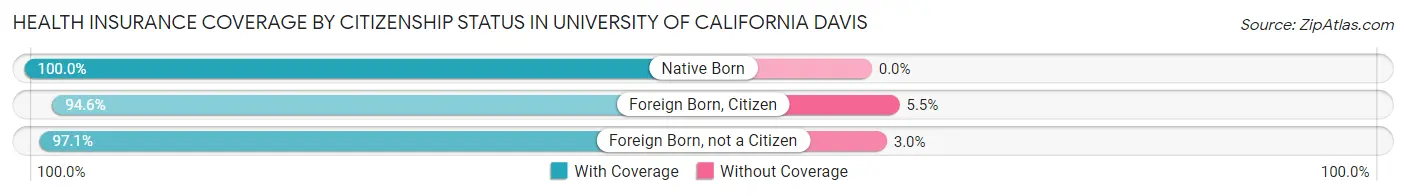
| Citizenship Status | With Coverage | Without Coverage |
| Native Born | 119 (100.0%) | 0 (0.0%) |
| Foreign Born, Citizen | 2,756 (94.6%) | 159 (5.4%) |
| Foreign Born, not a Citizen | 4,246 (97.1%) | 129 (2.9%) |
Health Insurance Coverage by Household Income in University of California Davis
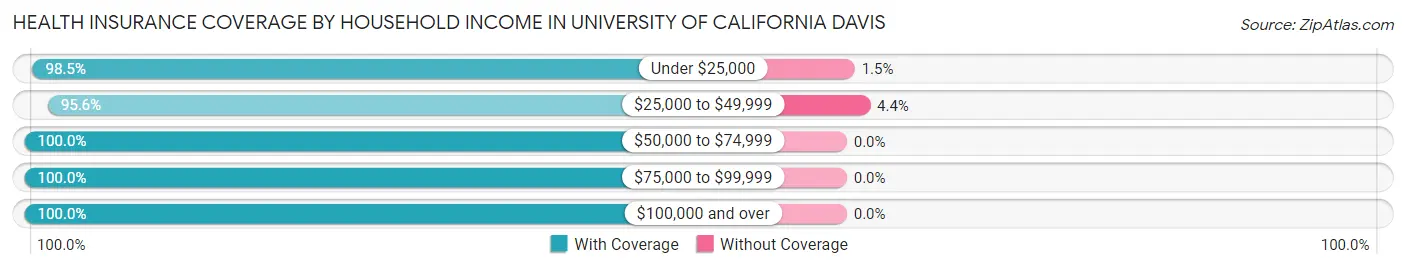
| Household Income | With Coverage | Without Coverage |
| Under $25,000 | 2,052 (98.5%) | 31 (1.5%) |
| $25,000 to $49,999 | 527 (95.6%) | 24 (4.4%) |
| $50,000 to $74,999 | 576 (100.0%) | 0 (0.0%) |
| $75,000 to $99,999 | 247 (100.0%) | 0 (0.0%) |
| $100,000 and over | 260 (100.0%) | 0 (0.0%) |
Public vs Private Health Insurance Coverage by Age in University of California Davis
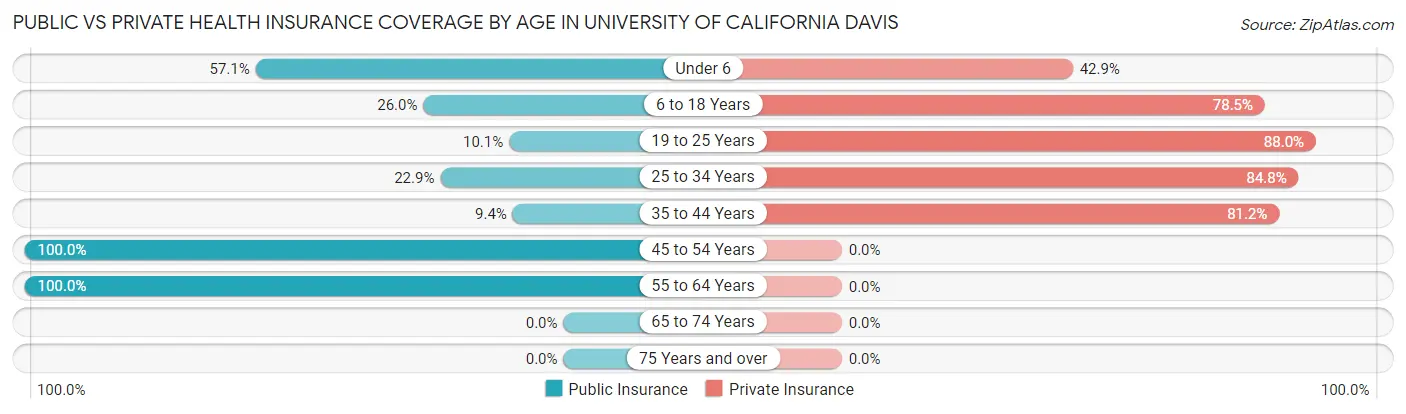
| Age Bracket | Public Insurance | Private Insurance |
| Under 6 | 68 (57.1%) | 51 (42.9%) |
| 6 to 18 Years | 758 (26.0%) | 2,289 (78.5%) |
| 19 to 25 Years | 441 (10.1%) | 3,850 (88.0%) |
| 25 to 34 Years | 117 (22.9%) | 434 (84.8%) |
| 35 to 44 Years | 24 (9.4%) | 207 (81.2%) |
| 45 to 54 Years | 7 (100.0%) | 0 (0.0%) |
| 55 to 64 Years | 28 (100.0%) | 0 (0.0%) |
| 65 to 74 Years | 0 (0.0%) | 0 (0.0%) |
| 75 Years and over | 0 (0.0%) | 0 (0.0%) |
| Total | 1,443 (17.6%) | 6,831 (83.2%) |
Disability Status by Sex by Age in University of California Davis
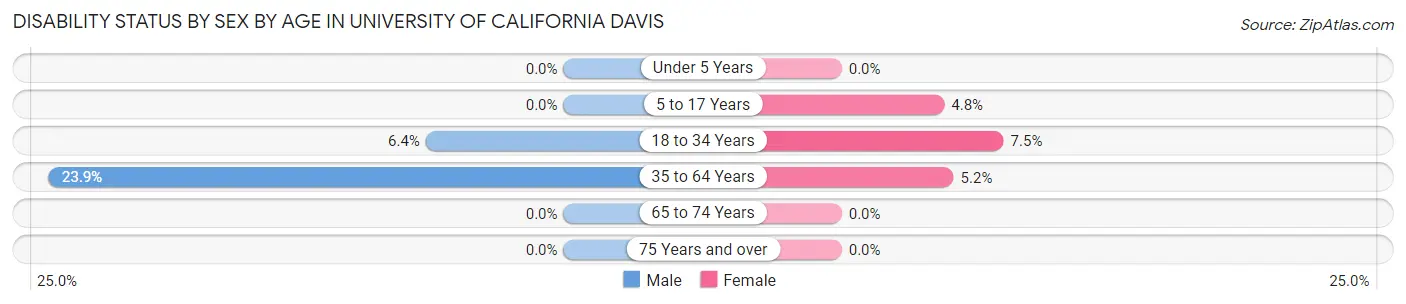
| Age Bracket | Male | Female |
| Under 5 Years | 0 (0.0%) | 0 (0.0%) |
| 5 to 17 Years | 0 (0.0%) | 3 (4.8%) |
| 18 to 34 Years | 225 (6.4%) | 314 (7.5%) |
| 35 to 64 Years | 37 (23.9%) | 7 (5.2%) |
| 65 to 74 Years | 0 (0.0%) | 0 (0.0%) |
| 75 Years and over | 0 (0.0%) | 0 (0.0%) |
Disability Class by Sex by Age in University of California Davis
Disability Class: Hearing Difficulty
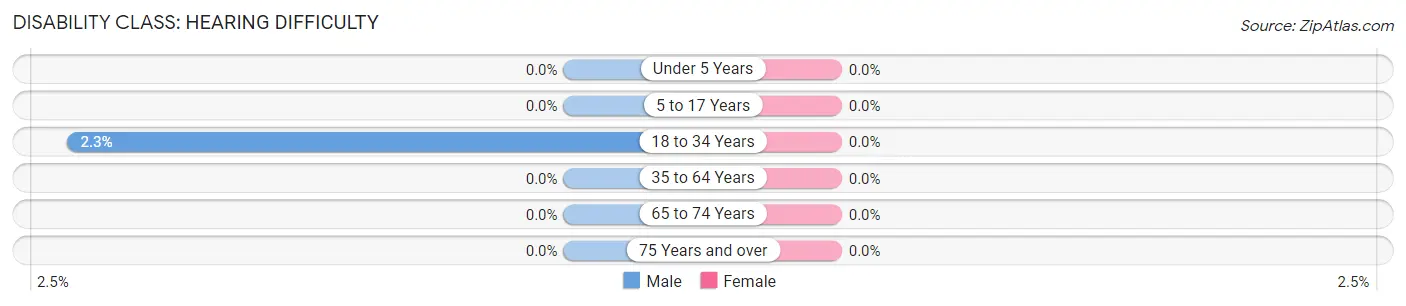
| Age Bracket | Male | Female |
| Under 5 Years | 0 (0.0%) | 0 (0.0%) |
| 5 to 17 Years | 0 (0.0%) | 0 (0.0%) |
| 18 to 34 Years | 81 (2.3%) | 0 (0.0%) |
| 35 to 64 Years | 0 (0.0%) | 0 (0.0%) |
| 65 to 74 Years | 0 (0.0%) | 0 (0.0%) |
| 75 Years and over | 0 (0.0%) | 0 (0.0%) |
Disability Class: Vision Difficulty
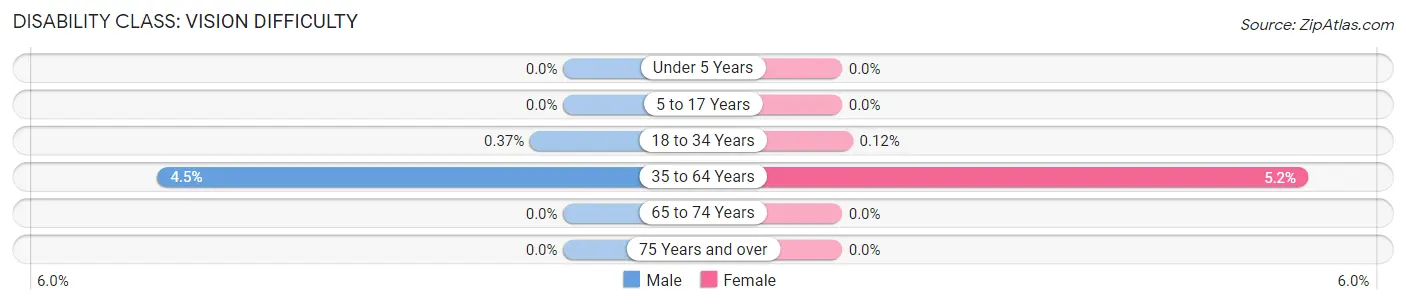
| Age Bracket | Male | Female |
| Under 5 Years | 0 (0.0%) | 0 (0.0%) |
| 5 to 17 Years | 0 (0.0%) | 0 (0.0%) |
| 18 to 34 Years | 13 (0.4%) | 5 (0.1%) |
| 35 to 64 Years | 7 (4.5%) | 7 (5.2%) |
| 65 to 74 Years | 0 (0.0%) | 0 (0.0%) |
| 75 Years and over | 0 (0.0%) | 0 (0.0%) |
Disability Class: Cognitive Difficulty
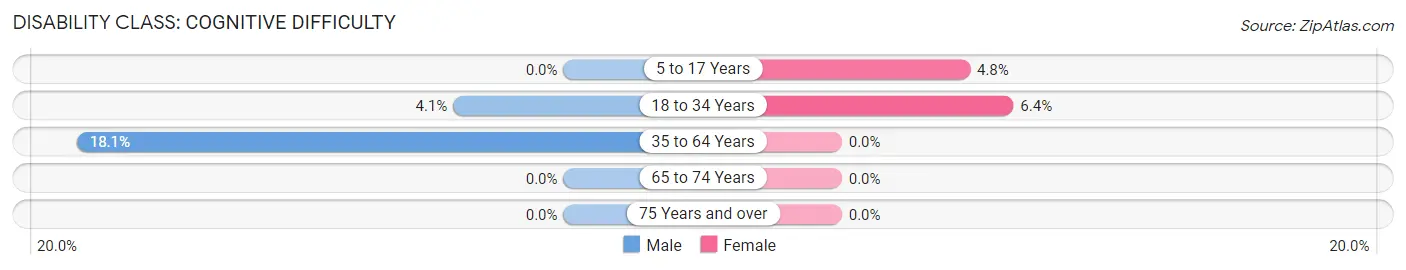
| Age Bracket | Male | Female |
| 5 to 17 Years | 0 (0.0%) | 3 (4.8%) |
| 18 to 34 Years | 144 (4.1%) | 266 (6.4%) |
| 35 to 64 Years | 28 (18.1%) | 0 (0.0%) |
| 65 to 74 Years | 0 (0.0%) | 0 (0.0%) |
| 75 Years and over | 0 (0.0%) | 0 (0.0%) |
Disability Class: Ambulatory Difficulty
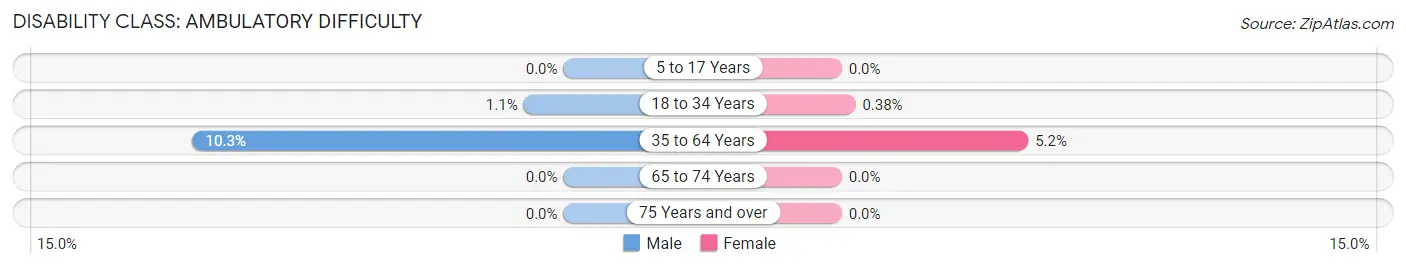
| Age Bracket | Male | Female |
| 5 to 17 Years | 0 (0.0%) | 0 (0.0%) |
| 18 to 34 Years | 39 (1.1%) | 16 (0.4%) |
| 35 to 64 Years | 16 (10.3%) | 7 (5.2%) |
| 65 to 74 Years | 0 (0.0%) | 0 (0.0%) |
| 75 Years and over | 0 (0.0%) | 0 (0.0%) |
Disability Class: Self-Care Difficulty
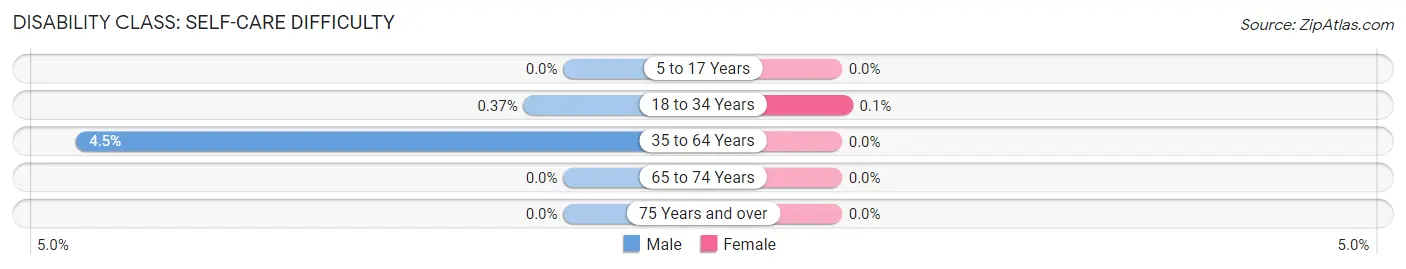
| Age Bracket | Male | Female |
| 5 to 17 Years | 0 (0.0%) | 0 (0.0%) |
| 18 to 34 Years | 13 (0.4%) | 4 (0.1%) |
| 35 to 64 Years | 7 (4.5%) | 0 (0.0%) |
| 65 to 74 Years | 0 (0.0%) | 0 (0.0%) |
| 75 Years and over | 0 (0.0%) | 0 (0.0%) |
Technology Access in University of California Davis
Computing Device Access in University of California Davis
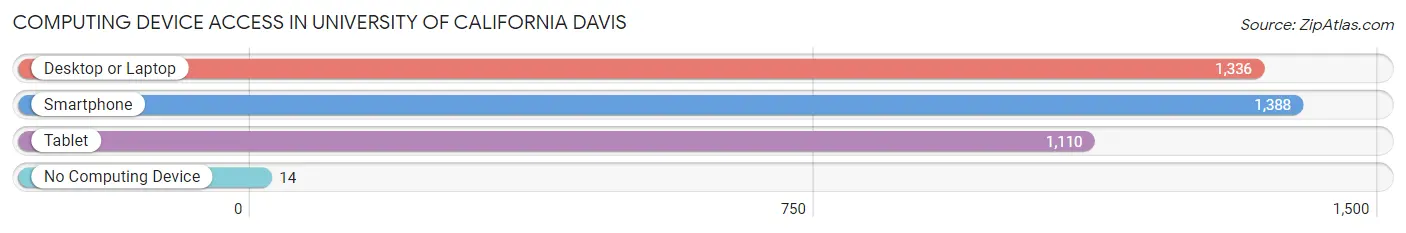
| Device Type | # Households | % Households |
| Desktop or Laptop | 1,336 | 95.3% |
| Smartphone | 1,388 | 99.0% |
| Tablet | 1,110 | 79.2% |
| No Computing Device | 14 | 1.0% |
| Total | 1,402 | 100.0% |
Internet Access in University of California Davis
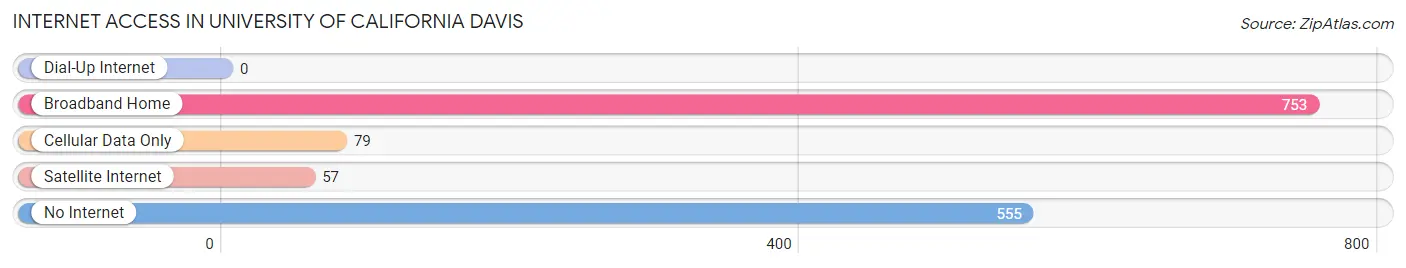
| Internet Type | # Households | % Households |
| Dial-Up Internet | 0 | 0.0% |
| Broadband Home | 753 | 53.7% |
| Cellular Data Only | 79 | 5.6% |
| Satellite Internet | 57 | 4.1% |
| No Internet | 555 | 39.6% |
| Total | 1,402 | 100.0% |
University of California Davis Summary
University of California Davis (UC Davis) is a public research university located in Davis, California. It is part of the University of California system and is the largest university in the Sacramento area. UC Davis was founded in 1905 as the University Farm, a branch of the University of California, Berkeley. It was established to provide instruction in agriculture, veterinary medicine, and other related disciplines. Today, UC Davis is a comprehensive research university with a wide range of academic programs, including the humanities, social sciences, natural sciences, and engineering.
History
UC Davis was founded in 1905 as the University Farm, a branch of the University of California, Berkeley. It was established to provide instruction in agriculture, veterinary medicine, and other related disciplines. The University Farm was located on the site of the former Davisville, a small farming community that had been established in the late 19th century. The University Farm was initially funded by the state of California and the federal government, and it was the first public university in the state to offer instruction in agriculture and veterinary medicine.
In 1959, the University Farm was renamed the University of California, Davis. The university has since grown to become one of the largest universities in the state, with an enrollment of over 35,000 students. UC Davis is now a comprehensive research university with a wide range of academic programs, including the humanities, social sciences, natural sciences, and engineering.
Geography
UC Davis is located in the city of Davis, California, which is situated in Yolo County, about 15 miles west of Sacramento. The city of Davis is located in the Central Valley of California, an area known for its fertile soil and mild climate. The city is bordered by the Sacramento River to the north and the Yolo Bypass to the south. The university campus is located on the east side of the city, and it is surrounded by a variety of parks and open spaces.
Economy
The economy of Davis is largely driven by the university, which is the largest employer in the city. The university employs over 10,000 people, and it is estimated that the university contributes over $3 billion to the local economy each year. In addition to the university, Davis is home to a variety of businesses, including technology companies, wineries, and agricultural businesses. The city is also home to a number of cultural attractions, including the UC Davis Arboretum and the Davis Farmers Market.
Demographics
As of the 2010 census, the population of Davis was 65,622. The racial makeup of the city was 68.2% White, 11.3% Asian, 8.2% Hispanic or Latino, 6.2% African American, and 6.1% other. The median household income in Davis was $63,837, and the median family income was $77,837. The city has a high rate of educational attainment, with over 70% of the population having a bachelor's degree or higher.
Common Questions
What is Per Capita Income in University of California Davis?
Per Capita income in University of California Davis is $7,058.
What is the Median Family Income in University of California Davis?
Median Family Income in University of California Davis is $47,344.
What is the Median Household income in University of California Davis?
Median Household Income in University of California Davis is $19,541.
What is Income or Wage Gap in University of California Davis?
Income or Wage Gap in University of California Davis is 1.0%.
Women in University of California Davis earn 99.0 cents for every dollar earned by a man.
What is Inequality or Gini Index in University of California Davis?
Inequality or Gini Index in University of California Davis is 0.58.
What is the Total Population of University of California Davis?
Total Population of University of California Davis is 8,229.
What is the Total Male Population of University of California Davis?
Total Male Population of University of California Davis is 3,780.
What is the Total Female Population of University of California Davis?
Total Female Population of University of California Davis is 4,449.
What is the Ratio of Males per 100 Females in University of California Davis?
There are 84.96 Males per 100 Females in University of California Davis.
What is the Ratio of Females per 100 Males in University of California Davis?
There are 117.70 Females per 100 Males in University of California Davis.
What is the Median Population Age in University of California Davis?
Median Population Age in University of California Davis is 19.6 Years.
What is the Average Family Size in University of California Davis
Average Family Size in University of California Davis is 2.8 People.
What is the Average Household Size in University of California Davis
Average Household Size in University of California Davis is 2.7 People.
How Large is the Labor Force in University of California Davis?
There are 2,152 People in the Labor Forcein in University of California Davis.
What is the Percentage of People in the Labor Force in University of California Davis?
26.6% of People are in the Labor Force in University of California Davis.
What is the Unemployment Rate in University of California Davis?
Unemployment Rate in University of California Davis is 11.3%.