Garberville, CA Map & Demographics
Garberville Map
Garberville Overview
$15,395
PER CAPITA INCOME
$35,714
AVG FAMILY INCOME
$34,167
AVG HOUSEHOLD INCOME
39.9%
WAGE / INCOME GAP [ % ]
60.1¢/ $1
WAGE / INCOME GAP [ $ ]
0.41
INEQUALITY / GINI INDEX
1,815
TOTAL POPULATION
869
MALE POPULATION
946
FEMALE POPULATION
91.86
MALES / 100 FEMALES
108.86
FEMALES / 100 MALES
35.7
MEDIAN AGE
3.1
AVG FAMILY SIZE
2.2
AVG HOUSEHOLD SIZE
829
LABOR FORCE [ PEOPLE ]
59.7%
PERCENT IN LABOR FORCE
1.8%
UNEMPLOYMENT RATE
Garberville Zip Codes
Garberville Area Codes
Income in Garberville
Income Overview in Garberville
Per Capita Income in Garberville is $15,395, while median incomes of families and households are $35,714 and $34,167 respectively.
| Characteristic | Number | Measure |
| Per Capita Income | 1,815 | $15,395 |
| Median Family Income | 426 | $35,714 |
| Mean Family Income | 426 | $36,677 |
| Median Household Income | 812 | $34,167 |
| Mean Household Income | 812 | $33,484 |
| Income Deficit | 426 | $0 |
| Wage / Income Gap (%) | 1,815 | 39.92% |
| Wage / Income Gap ($) | 1,815 | 60.08¢ per $1 |
| Gini / Inequality Index | 1,815 | 0.41 |
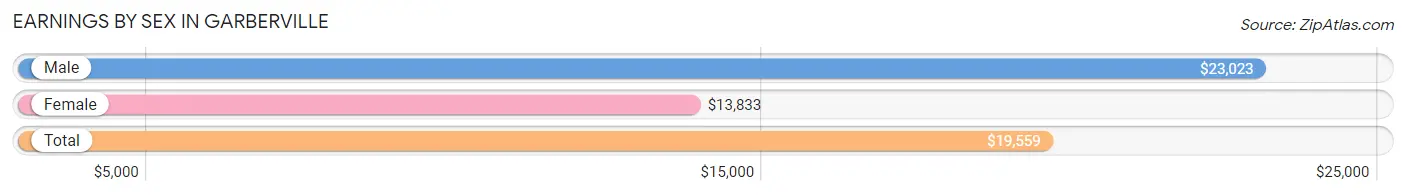
Earnings by Sex in Garberville
Average Earnings in Garberville are $19,559, $23,023 for men and $13,833 for women, a difference of 39.9%.
| Sex | Number | Average Earnings |
| Male | 472 (49.1%) | $23,023 |
| Female | 490 (50.9%) | $13,833 |
| Total | 962 (100.0%) | $19,559 |
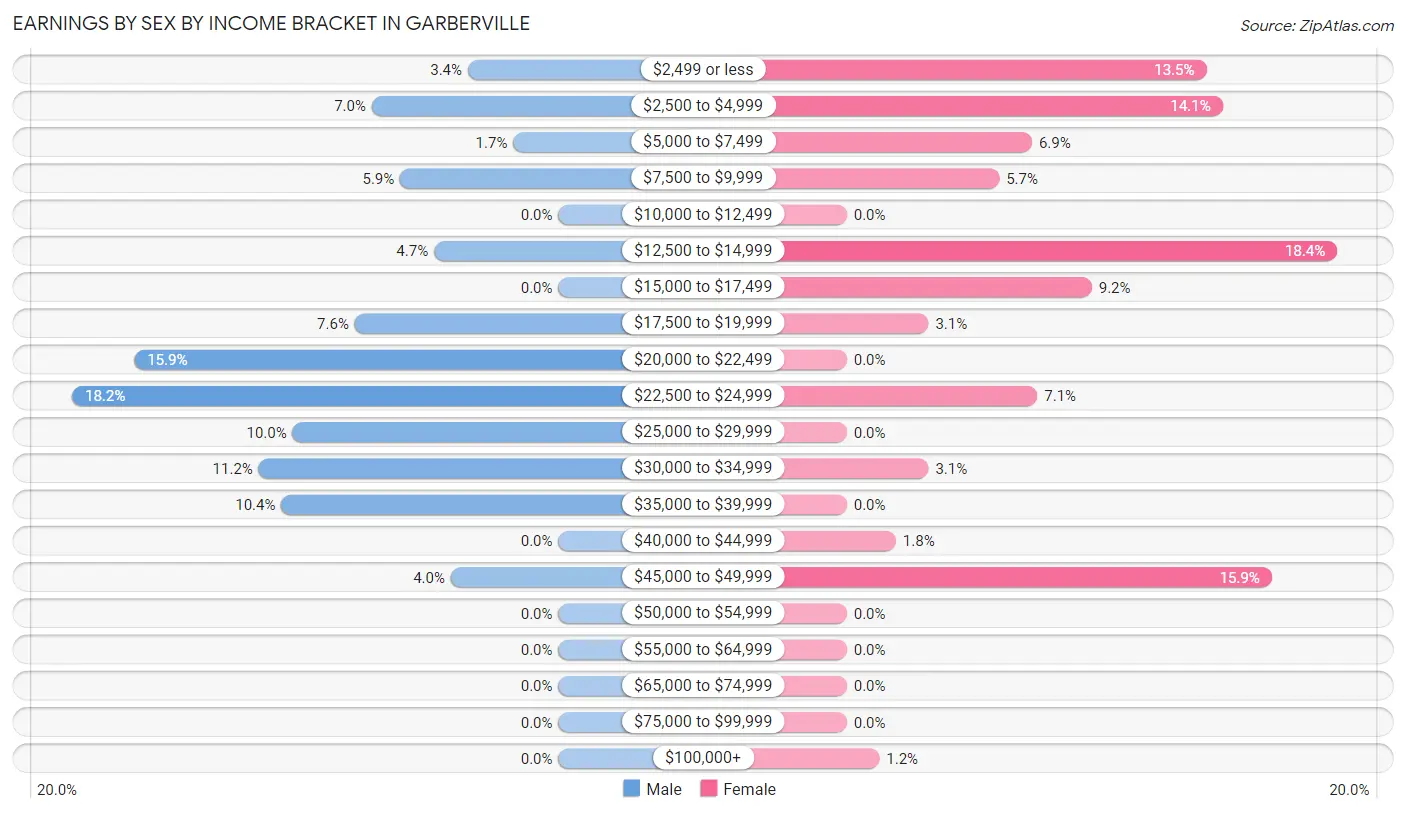
Earnings by Sex by Income Bracket in Garberville
The most common earnings brackets in Garberville are $22,500 to $24,999 for men (86 | 18.2%) and $12,500 to $14,999 for women (90 | 18.4%).
| Income | Male | Female |
| $2,499 or less | 16 (3.4%) | 66 (13.5%) |
| $2,500 to $4,999 | 33 (7.0%) | 69 (14.1%) |
| $5,000 to $7,499 | 8 (1.7%) | 34 (6.9%) |
| $7,500 to $9,999 | 28 (5.9%) | 28 (5.7%) |
| $10,000 to $12,499 | 0 (0.0%) | 0 (0.0%) |
| $12,500 to $14,999 | 22 (4.7%) | 90 (18.4%) |
| $15,000 to $17,499 | 0 (0.0%) | 45 (9.2%) |
| $17,500 to $19,999 | 36 (7.6%) | 15 (3.1%) |
| $20,000 to $22,499 | 75 (15.9%) | 0 (0.0%) |
| $22,500 to $24,999 | 86 (18.2%) | 35 (7.1%) |
| $25,000 to $29,999 | 47 (10.0%) | 0 (0.0%) |
| $30,000 to $34,999 | 53 (11.2%) | 15 (3.1%) |
| $35,000 to $39,999 | 49 (10.4%) | 0 (0.0%) |
| $40,000 to $44,999 | 0 (0.0%) | 9 (1.8%) |
| $45,000 to $49,999 | 19 (4.0%) | 78 (15.9%) |
| $50,000 to $54,999 | 0 (0.0%) | 0 (0.0%) |
| $55,000 to $64,999 | 0 (0.0%) | 0 (0.0%) |
| $65,000 to $74,999 | 0 (0.0%) | 0 (0.0%) |
| $75,000 to $99,999 | 0 (0.0%) | 0 (0.0%) |
| $100,000+ | 0 (0.0%) | 6 (1.2%) |
| Total | 472 (100.0%) | 490 (100.0%) |
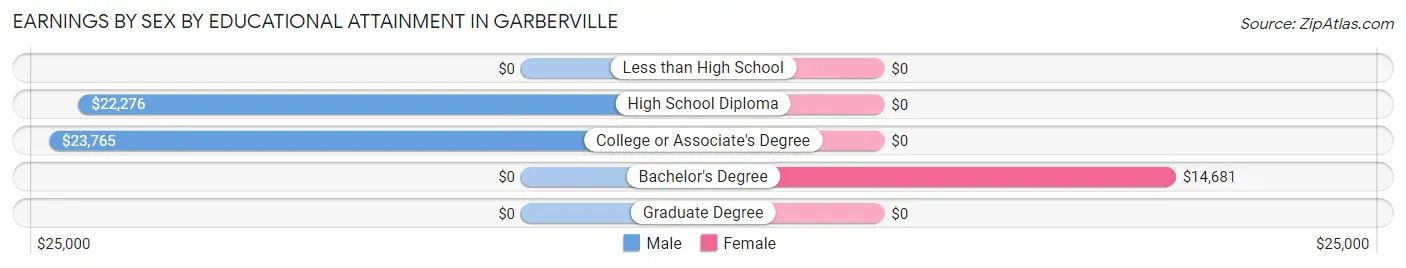
Earnings by Sex by Educational Attainment in Garberville
Average earnings in Garberville are $22,283 for men and $16,417 for women, a difference of 26.3%. Men with an educational attainment of college or associate's degree enjoy the highest average annual earnings of $23,765, while those with high school diploma education earn the least with $22,276. Women with an educational attainment of bachelor's degree earn the most with the average annual earnings of $14,681, while those with bachelor's degree education have the smallest earnings of $14,681.
| Educational Attainment | Male Income | Female Income |
| Less than High School | - | - |
| High School Diploma | $22,276 | $0 |
| College or Associate's Degree | $23,765 | $0 |
| Bachelor's Degree | - | - |
| Graduate Degree | - | - |
| Total | $22,283 | $16,417 |
Family Income in Garberville
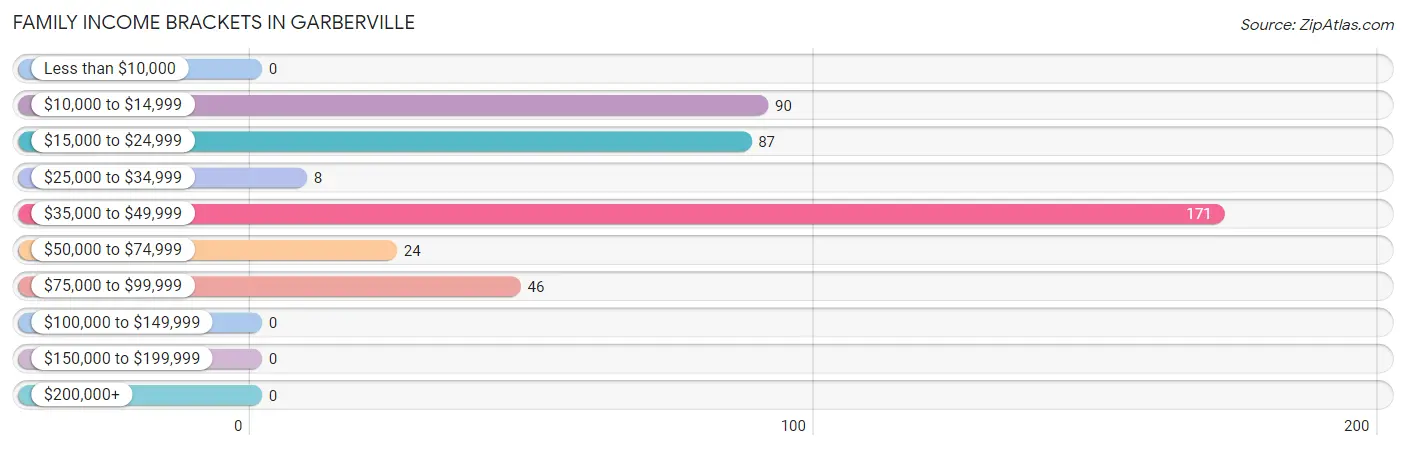
Family Income Brackets in Garberville
According to the Garberville family income data, there are 171 families falling into the $35,000 to $49,999 income range, which is the most common income bracket and makes up 40.1% of all families.
| Income Bracket | # Families | % Families |
| Less than $10,000 | 0 | 0.0% |
| $10,000 to $14,999 | 90 | 21.1% |
| $15,000 to $24,999 | 87 | 20.4% |
| $25,000 to $34,999 | 8 | 1.9% |
| $35,000 to $49,999 | 171 | 40.1% |
| $50,000 to $74,999 | 24 | 5.6% |
| $75,000 to $99,999 | 46 | 10.8% |
| $100,000 to $149,999 | 0 | 0.0% |
| $150,000 to $199,999 | 0 | 0.0% |
| $200,000+ | 0 | 0.0% |
Family Income by Famaliy Size in Garberville
| Income Bracket | # Families | Median Income |
| 2-Person Families | 198 (46.5%) | $0 |
| 3-Person Families | 97 (22.8%) | $0 |
| 4-Person Families | 82 (19.3%) | $0 |
| 5-Person Families | 49 (11.5%) | $0 |
| 6-Person Families | 0 (0.0%) | $0 |
| 7+ Person Families | 0 (0.0%) | $0 |
| Total | 426 (100.0%) | $35,714 |
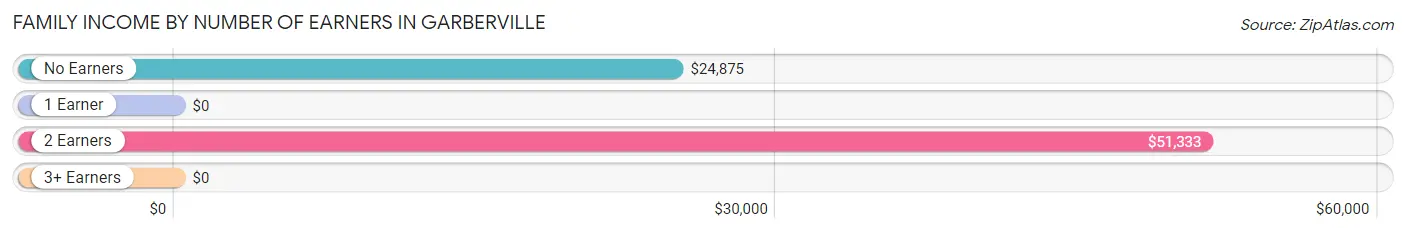
Family Income by Number of Earners in Garberville
| Number of Earners | # Families | Median Income |
| No Earners | 115 (27.0%) | $24,875 |
| 1 Earner | 166 (39.0%) | $0 |
| 2 Earners | 110 (25.8%) | $51,333 |
| 3+ Earners | 35 (8.2%) | $0 |
| Total | 426 (100.0%) | $35,714 |
Household Income in Garberville
Household Income Brackets in Garberville
With 289 households falling in the category, the $35,000 to $49,999 income range is the most frequent in Garberville, accounting for 35.6% of all households.
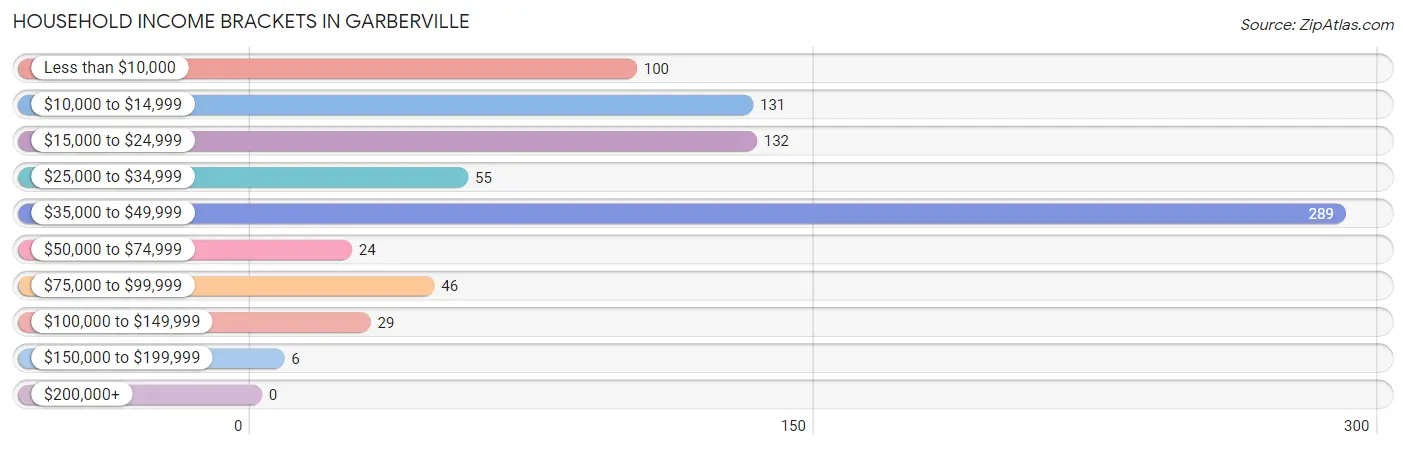
| Income Bracket | # Households | % Households |
| Less than $10,000 | 100 | 12.3% |
| $10,000 to $14,999 | 131 | 16.1% |
| $15,000 to $24,999 | 132 | 16.3% |
| $25,000 to $34,999 | 55 | 6.8% |
| $35,000 to $49,999 | 289 | 35.6% |
| $50,000 to $74,999 | 24 | 3.0% |
| $75,000 to $99,999 | 46 | 5.7% |
| $100,000 to $149,999 | 29 | 3.6% |
| $150,000 to $199,999 | 6 | 0.7% |
| $200,000+ | 0 | 0.0% |
Household Income by Householder Age in Garberville
The median household income in Garberville is $34,167, with the highest median household income of $42,847 found in the 45 to 64 years age bracket for the primary householder. A total of 240 households (29.6%) fall into this category. Meanwhile, the 15 to 24 years age bracket for the primary householder has the lowest median household income of $0, with 112 households (13.8%) in this group.
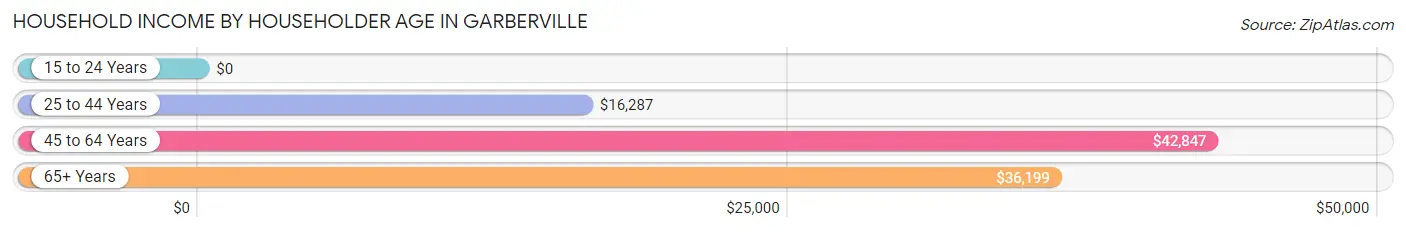
| Income Bracket | # Households | Median Income |
| 15 to 24 Years | 112 (13.8%) | $0 |
| 25 to 44 Years | 299 (36.8%) | $16,287 |
| 45 to 64 Years | 240 (29.6%) | $42,847 |
| 65+ Years | 161 (19.8%) | $36,199 |
| Total | 812 (100.0%) | $34,167 |
Poverty in Garberville
Income Below Poverty by Sex and Age in Garberville
With 46.6% poverty level for males and 44.4% for females among the residents of Garberville, 6 to 11 year old males and 35 to 44 year old females are the most vulnerable to poverty, with 80 males (100.0%) and 147 females (90.7%) in their respective age groups living below the poverty level.
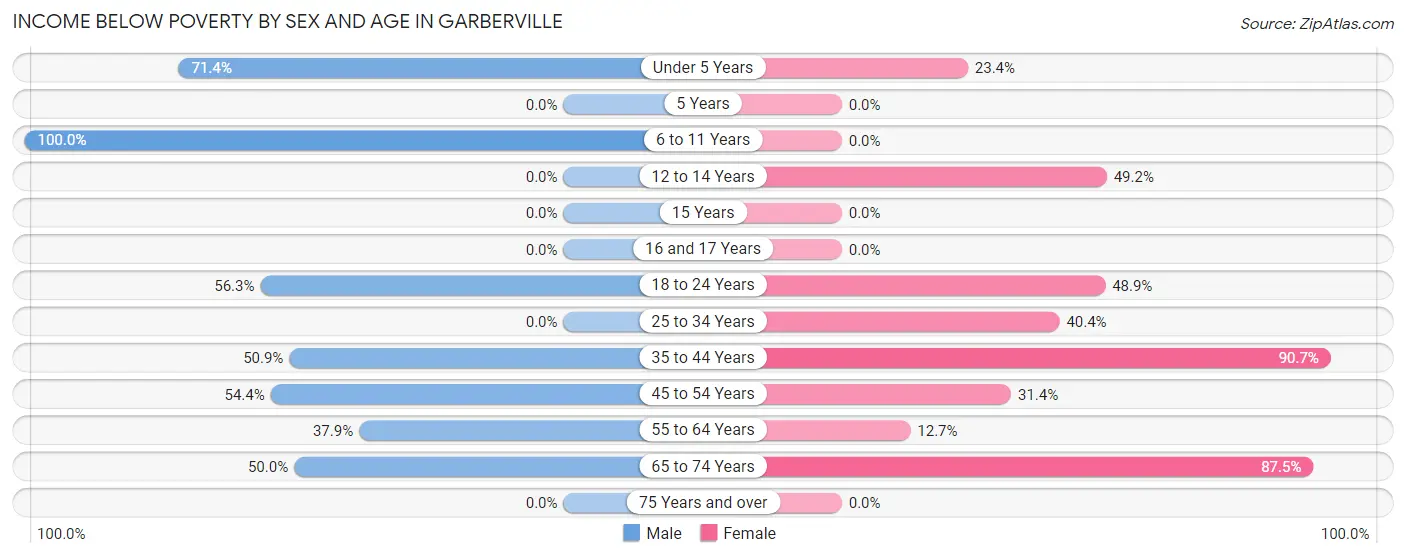
| Age Bracket | Male | Female |
| Under 5 Years | 75 (71.4%) | 11 (23.4%) |
| 5 Years | 0 (0.0%) | 0 (0.0%) |
| 6 to 11 Years | 80 (100.0%) | 0 (0.0%) |
| 12 to 14 Years | 0 (0.0%) | 30 (49.2%) |
| 15 Years | 0 (0.0%) | 0 (0.0%) |
| 16 and 17 Years | 0 (0.0%) | 0 (0.0%) |
| 18 to 24 Years | 63 (56.2%) | 66 (48.9%) |
| 25 to 34 Years | 0 (0.0%) | 61 (40.4%) |
| 35 to 44 Years | 57 (50.9%) | 147 (90.7%) |
| 45 to 54 Years | 100 (54.3%) | 49 (31.4%) |
| 55 to 64 Years | 22 (37.9%) | 7 (12.7%) |
| 65 to 74 Years | 8 (50.0%) | 49 (87.5%) |
| 75 Years and over | 0 (0.0%) | 0 (0.0%) |
| Total | 405 (46.6%) | 420 (44.4%) |
Income Above Poverty by Sex and Age in Garberville
According to the poverty statistics in Garberville, males aged 15 years and females aged 6 to 11 years are the age groups that are most secure financially, with 100.0% of males and 100.0% of females in these age groups living above the poverty line.
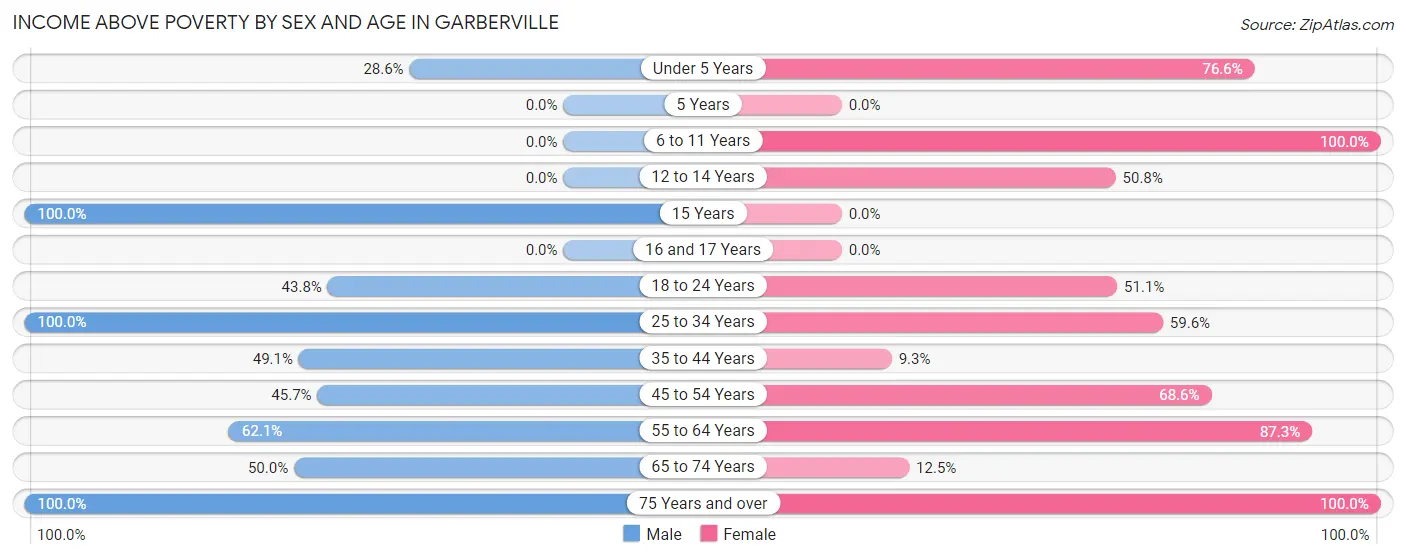
| Age Bracket | Male | Female |
| Under 5 Years | 30 (28.6%) | 36 (76.6%) |
| 5 Years | 0 (0.0%) | 0 (0.0%) |
| 6 to 11 Years | 0 (0.0%) | 70 (100.0%) |
| 12 to 14 Years | 0 (0.0%) | 31 (50.8%) |
| 15 Years | 64 (100.0%) | 0 (0.0%) |
| 16 and 17 Years | 0 (0.0%) | 0 (0.0%) |
| 18 to 24 Years | 49 (43.8%) | 69 (51.1%) |
| 25 to 34 Years | 53 (100.0%) | 90 (59.6%) |
| 35 to 44 Years | 55 (49.1%) | 15 (9.3%) |
| 45 to 54 Years | 84 (45.7%) | 107 (68.6%) |
| 55 to 64 Years | 36 (62.1%) | 48 (87.3%) |
| 65 to 74 Years | 8 (50.0%) | 7 (12.5%) |
| 75 Years and over | 85 (100.0%) | 52 (100.0%) |
| Total | 464 (53.4%) | 525 (55.6%) |
Income Below Poverty Among Married-Couple Families in Garberville
The poverty statistics for married-couple families in Garberville show that 31.9% or 65 of the total 204 families live below the poverty line. Families with 1 or 2 children have the highest poverty rate of 33.3%, comprising of 37 families. On the other hand, families with no children have the lowest poverty rate of 30.1%, which includes 28 families.
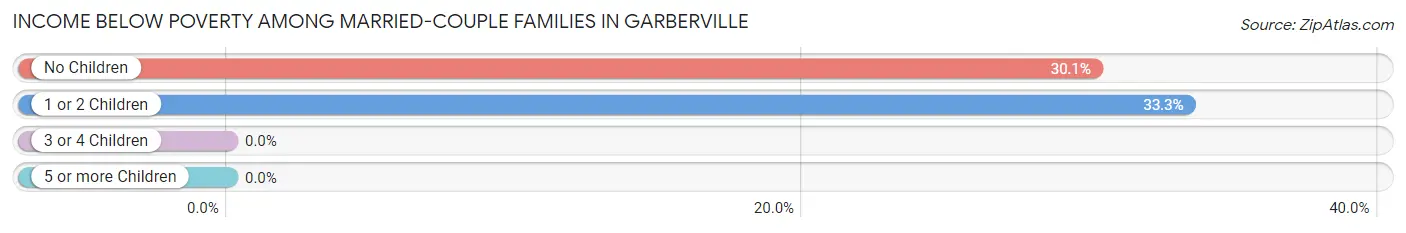
| Children | Above Poverty | Below Poverty |
| No Children | 65 (69.9%) | 28 (30.1%) |
| 1 or 2 Children | 74 (66.7%) | 37 (33.3%) |
| 3 or 4 Children | 0 (0.0%) | 0 (0.0%) |
| 5 or more Children | 0 (0.0%) | 0 (0.0%) |
| Total | 139 (68.1%) | 65 (31.9%) |
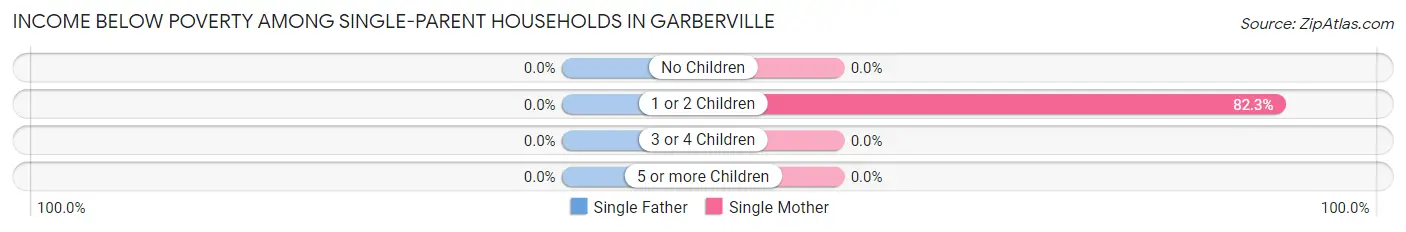
Income Below Poverty Among Single-Parent Households in Garberville
| Children | Single Father | Single Mother |
| No Children | 0 (0.0%) | 0 (0.0%) |
| 1 or 2 Children | 0 (0.0%) | 139 (82.3%) |
| 3 or 4 Children | 0 (0.0%) | 0 (0.0%) |
| 5 or more Children | 0 (0.0%) | 0 (0.0%) |
| Total | 0 (0.0%) | 139 (68.5%) |
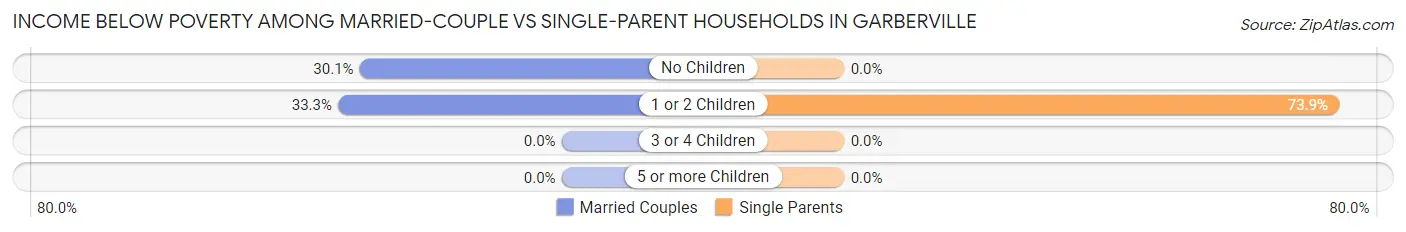
Income Below Poverty Among Married-Couple vs Single-Parent Households in Garberville
The poverty data for Garberville shows that 65 of the married-couple family households (31.9%) and 139 of the single-parent households (62.6%) are living below the poverty level. Within the married-couple family households, those with 1 or 2 children have the highest poverty rate, with 37 households (33.3%) falling below the poverty line. Among the single-parent households, those with 1 or 2 children have the highest poverty rate, with 139 household (73.9%) living below poverty.
| Children | Married-Couple Families | Single-Parent Households |
| No Children | 28 (30.1%) | 0 (0.0%) |
| 1 or 2 Children | 37 (33.3%) | 139 (73.9%) |
| 3 or 4 Children | 0 (0.0%) | 0 (0.0%) |
| 5 or more Children | 0 (0.0%) | 0 (0.0%) |
| Total | 65 (31.9%) | 139 (62.6%) |
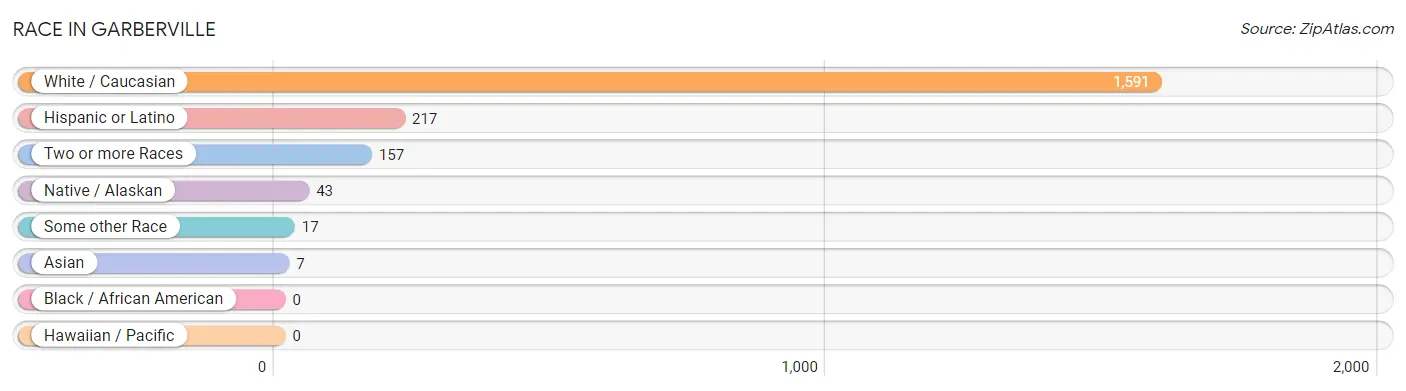
Race in Garberville
The most populous races in Garberville are White / Caucasian (1,591 | 87.7%), Hispanic or Latino (217 | 12.0%), and Two or more Races (157 | 8.6%).
| Race | # Population | % Population |
| Asian | 7 | 0.4% |
| Black / African American | 0 | 0.0% |
| Hawaiian / Pacific | 0 | 0.0% |
| Hispanic or Latino | 217 | 12.0% |
| Native / Alaskan | 43 | 2.4% |
| White / Caucasian | 1,591 | 87.7% |
| Two or more Races | 157 | 8.6% |
| Some other Race | 17 | 0.9% |
| Total | 1,815 | 100.0% |
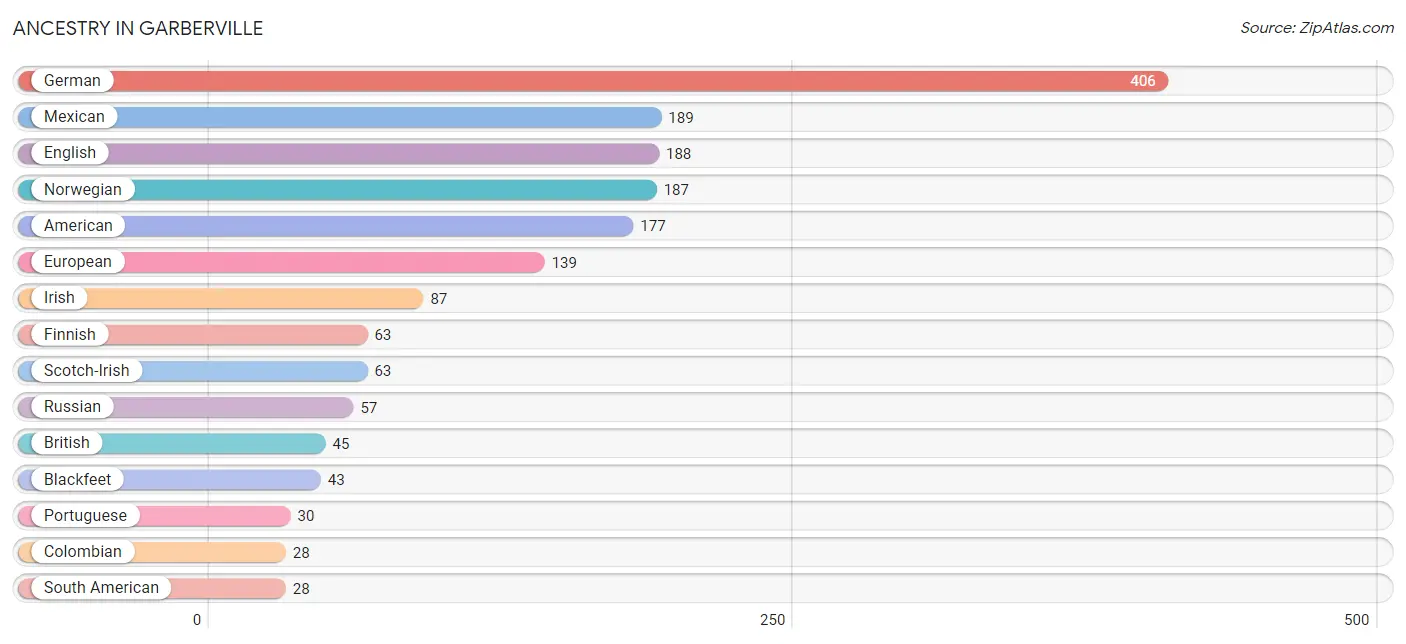
Ancestry in Garberville
The most populous ancestries reported in Garberville are German (406 | 22.4%), Mexican (189 | 10.4%), English (188 | 10.4%), Norwegian (187 | 10.3%), and American (177 | 9.8%), together accounting for 63.2% of all Garberville residents.
| Ancestry | # Population | % Population |
| American | 177 | 9.8% |
| Austrian | 7 | 0.4% |
| Belgian | 7 | 0.4% |
| Blackfeet | 43 | 2.4% |
| British | 45 | 2.5% |
| Burmese | 7 | 0.4% |
| Choctaw | 15 | 0.8% |
| Colombian | 28 | 1.5% |
| English | 188 | 10.4% |
| European | 139 | 7.7% |
| Finnish | 63 | 3.5% |
| French | 11 | 0.6% |
| German | 406 | 22.4% |
| Irish | 87 | 4.8% |
| Italian | 19 | 1.1% |
| Mexican | 189 | 10.4% |
| Norwegian | 187 | 10.3% |
| Portuguese | 30 | 1.7% |
| Russian | 57 | 3.1% |
| Scotch-Irish | 63 | 3.5% |
| South American | 28 | 1.5% | View All 21 Rows |
Immigrants in Garberville
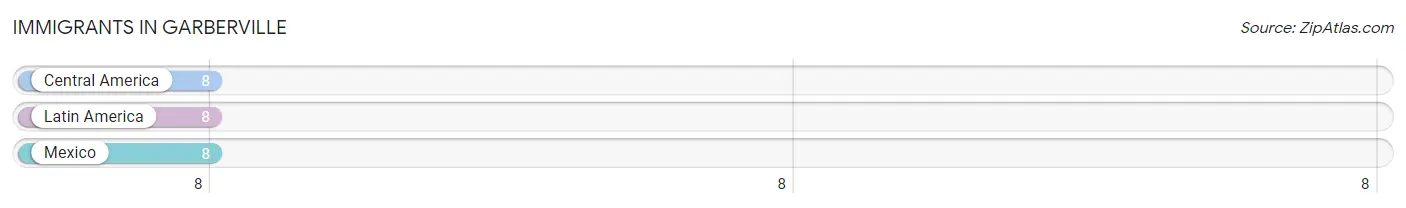
The most numerous immigrant groups reported in Garberville came from Central America (8 | 0.4%), Latin America (8 | 0.4%), and Mexico (8 | 0.4%), together accounting for 1.3% of all Garberville residents.
| Immigration Origin | # Population | % Population |
| Central America | 8 | 0.4% |
| Latin America | 8 | 0.4% |
| Mexico | 8 | 0.4% | View All 3 Rows |
Sex and Age in Garberville
Sex and Age in Garberville
The most populous age groups in Garberville are 45 to 49 Years (168 | 19.3%) for men and 15 to 19 Years (135 | 14.3%) for women.
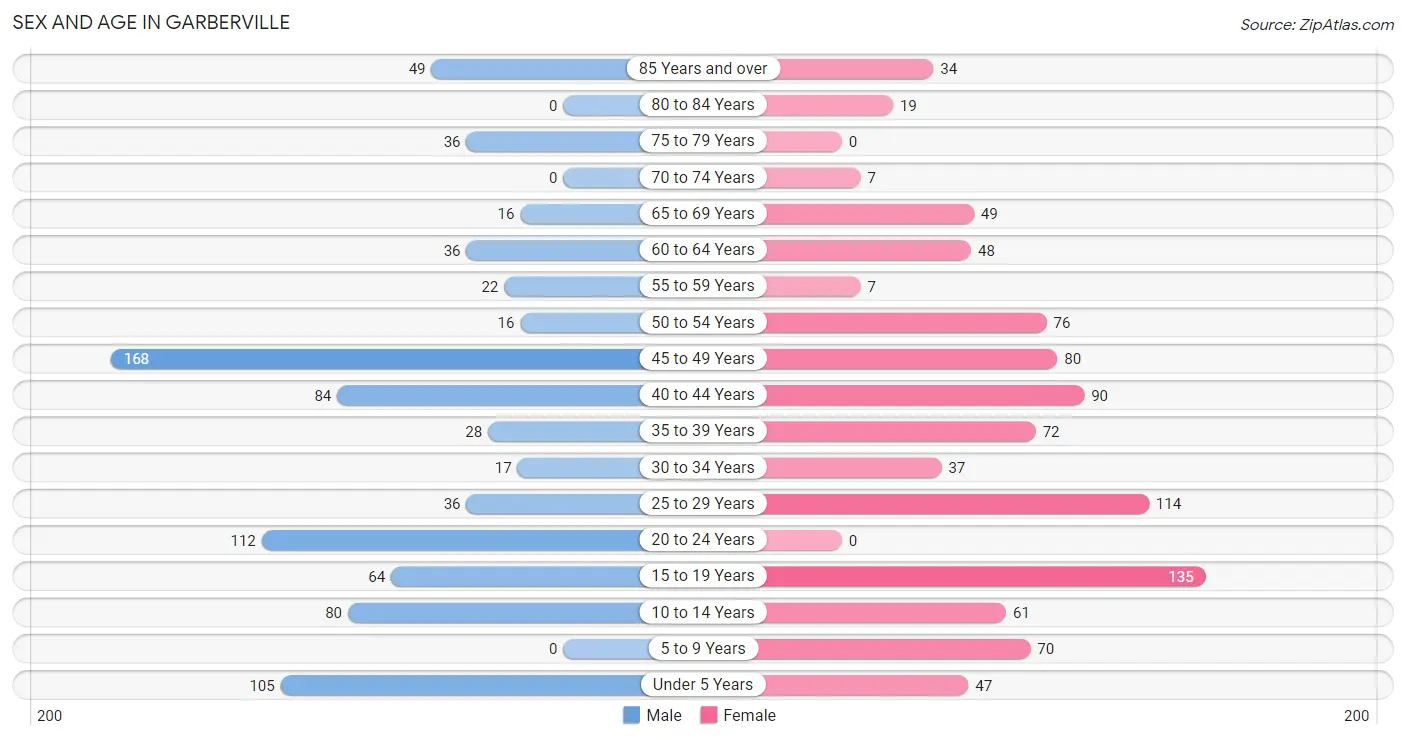
| Age Bracket | Male | Female |
| Under 5 Years | 105 (12.1%) | 47 (5.0%) |
| 5 to 9 Years | 0 (0.0%) | 70 (7.4%) |
| 10 to 14 Years | 80 (9.2%) | 61 (6.5%) |
| 15 to 19 Years | 64 (7.4%) | 135 (14.3%) |
| 20 to 24 Years | 112 (12.9%) | 0 (0.0%) |
| 25 to 29 Years | 36 (4.1%) | 114 (12.0%) |
| 30 to 34 Years | 17 (2.0%) | 37 (3.9%) |
| 35 to 39 Years | 28 (3.2%) | 72 (7.6%) |
| 40 to 44 Years | 84 (9.7%) | 90 (9.5%) |
| 45 to 49 Years | 168 (19.3%) | 80 (8.5%) |
| 50 to 54 Years | 16 (1.8%) | 76 (8.0%) |
| 55 to 59 Years | 22 (2.5%) | 7 (0.7%) |
| 60 to 64 Years | 36 (4.1%) | 48 (5.1%) |
| 65 to 69 Years | 16 (1.8%) | 49 (5.2%) |
| 70 to 74 Years | 0 (0.0%) | 7 (0.7%) |
| 75 to 79 Years | 36 (4.1%) | 0 (0.0%) |
| 80 to 84 Years | 0 (0.0%) | 19 (2.0%) |
| 85 Years and over | 49 (5.6%) | 34 (3.6%) |
| Total | 869 (100.0%) | 946 (100.0%) |
Families and Households in Garberville
Median Family Size in Garberville
The median family size in Garberville is 3.07 persons per family, with single male/father families (19 | 4.5%) accounting for the largest median family size of 4.47 persons per family. On the other hand, single female/mother families (203 | 47.6%) represent the smallest median family size with 2.92 persons per family.
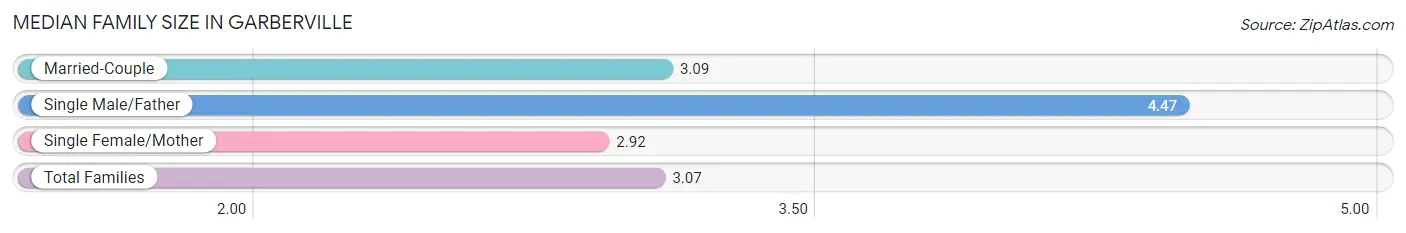
| Family Type | # Families | Family Size |
| Married-Couple | 204 (47.9%) | 3.09 |
| Single Male/Father | 19 (4.5%) | 4.47 |
| Single Female/Mother | 203 (47.6%) | 2.92 |
| Total Families | 426 (100.0%) | 3.07 |
Median Household Size in Garberville
The median household size in Garberville is 2.23 persons per household, with single male/father households (19 | 2.3%) accounting for the largest median household size of 4.47 persons per household. non-family households (386 | 47.5%) represent the smallest median household size with 1.31 persons per household.
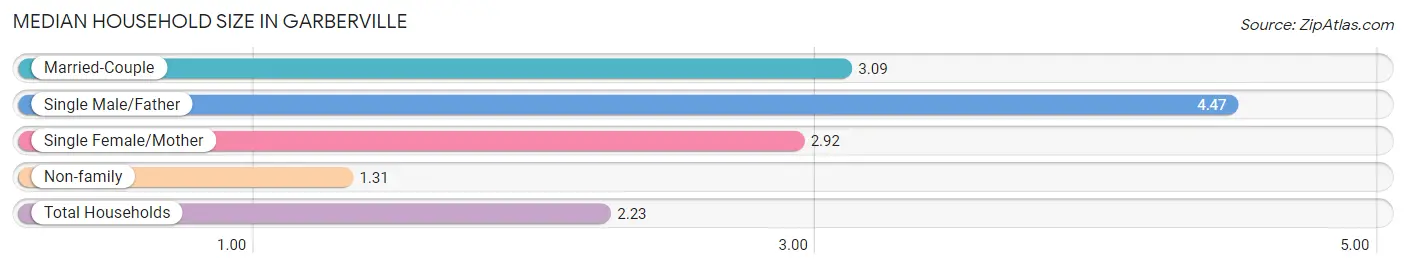
| Household Type | # Households | Household Size |
| Married-Couple | 204 (25.1%) | 3.09 |
| Single Male/Father | 19 (2.3%) | 4.47 |
| Single Female/Mother | 203 (25.0%) | 2.92 |
| Non-family | 386 (47.5%) | 1.31 |
| Total Households | 812 (100.0%) | 2.23 |
Household Size by Marriage Status in Garberville
Out of a total of 812 households in Garberville, 426 (52.5%) are family households, while 386 (47.5%) are nonfamily households. The most numerous type of family households are 2-person households, comprising 198, and the most common type of nonfamily households are 1-person households, comprising 275.
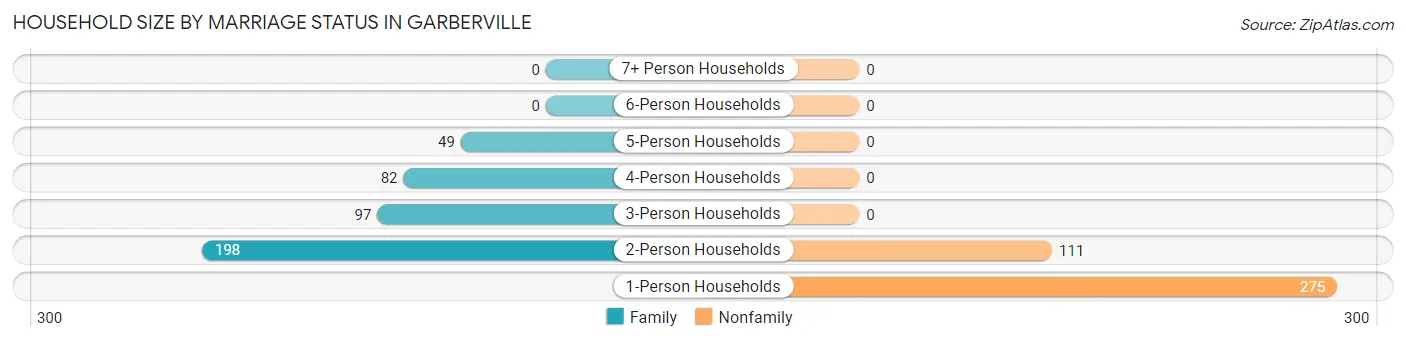
| Household Size | Family Households | Nonfamily Households |
| 1-Person Households | - | 275 (33.9%) |
| 2-Person Households | 198 (24.4%) | 111 (13.7%) |
| 3-Person Households | 97 (11.9%) | 0 (0.0%) |
| 4-Person Households | 82 (10.1%) | 0 (0.0%) |
| 5-Person Households | 49 (6.0%) | 0 (0.0%) |
| 6-Person Households | 0 (0.0%) | 0 (0.0%) |
| 7+ Person Households | 0 (0.0%) | 0 (0.0%) |
| Total | 426 (52.5%) | 386 (47.5%) |
Female Fertility in Garberville
Fertility by Age in Garberville
Average fertility rate in Garberville is 112.0 births per 1,000 women. Women in the age bracket of 20 to 34 years have the highest fertility rate with 199.0 births per 1,000 women. Women in the age bracket of 20 to 34 years acount for 50.8% of all women with births.
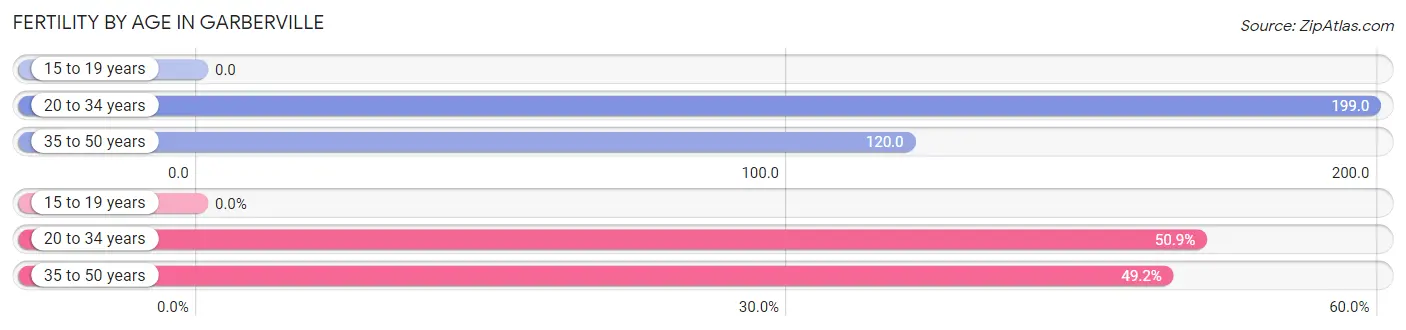
| Age Bracket | Women with Births | Births / 1,000 Women |
| 15 to 19 years | 0 (0.0%) | 0.0 |
| 20 to 34 years | 30 (50.8%) | 199.0 |
| 35 to 50 years | 29 (49.1%) | 120.0 |
| Total | 59 (100.0%) | 112.0 |
Fertility by Age by Marriage Status in Garberville
49.2% of women with births (59) in Garberville are married. The highest percentage of unmarried women with births falls into 20 to 34 years age bracket with 100.0% of them unmarried at the time of birth, while the lowest percentage of unmarried women with births belong to 35 to 50 years age bracket with 0.0% of them unmarried.
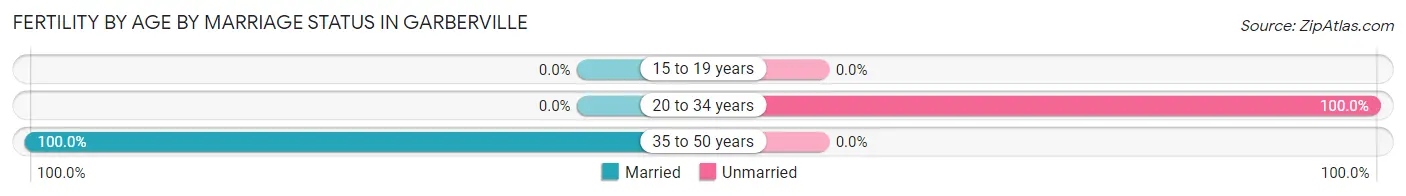
| Age Bracket | Married | Unmarried |
| 15 to 19 years | 0 (0.0%) | 0 (0.0%) |
| 20 to 34 years | 0 (0.0%) | 30 (100.0%) |
| 35 to 50 years | 29 (100.0%) | 0 (0.0%) |
| Total | 29 (49.1%) | 30 (50.8%) |
Fertility by Education in Garberville
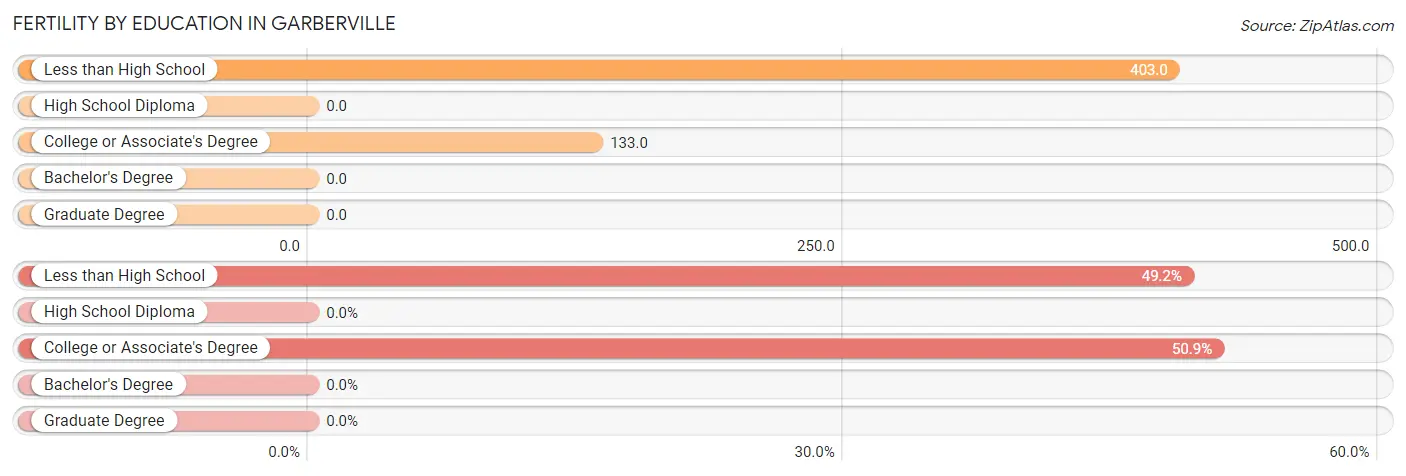
| Educational Attainment | Women with Births | Births / 1,000 Women |
| Less than High School | 29 (49.1%) | 403.0 |
| High School Diploma | 0 (0.0%) | 0.0 |
| College or Associate's Degree | 30 (50.8%) | 133.0 |
| Bachelor's Degree | 0 (0.0%) | 0.0 |
| Graduate Degree | 0 (0.0%) | 0.0 |
| Total | 59 (100.0%) | 112.0 |
Fertility by Education by Marriage Status in Garberville
50.8% of women with births in Garberville are unmarried. Women with the educational attainment of less than high school are most likely to be married with 100.0% of them married at childbirth, while women with the educational attainment of college or associate's degree are least likely to be married with 100.0% of them unmarried at childbirth.
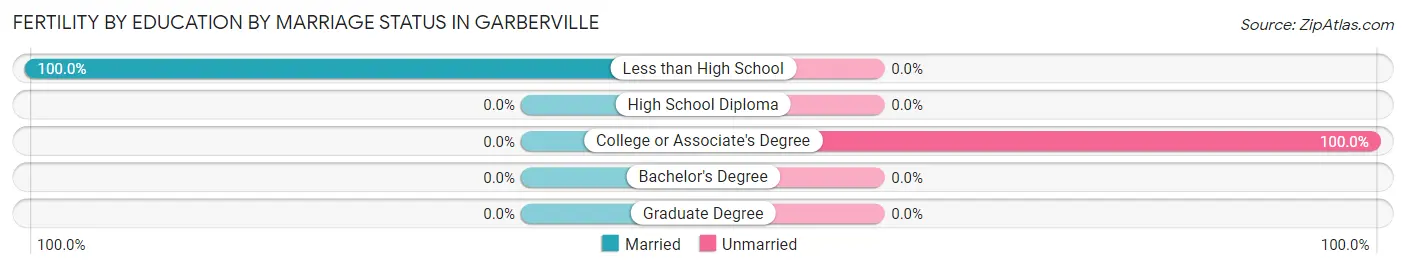
| Educational Attainment | Married | Unmarried |
| Less than High School | 29 (100.0%) | 0 (0.0%) |
| High School Diploma | 0 (0.0%) | 0 (0.0%) |
| College or Associate's Degree | 0 (0.0%) | 30 (100.0%) |
| Bachelor's Degree | 0 (0.0%) | 0 (0.0%) |
| Graduate Degree | 0 (0.0%) | 0 (0.0%) |
| Total | 29 (49.1%) | 30 (50.8%) |
Employment Characteristics in Garberville
Employment by Class of Employer in Garberville
Among the 780 employed individuals in Garberville, private company employees (568 | 72.8%), self-employed (not incorporated) (128 | 16.4%), and not-for-profit organizations (45 | 5.8%) make up the most common classes of employment.
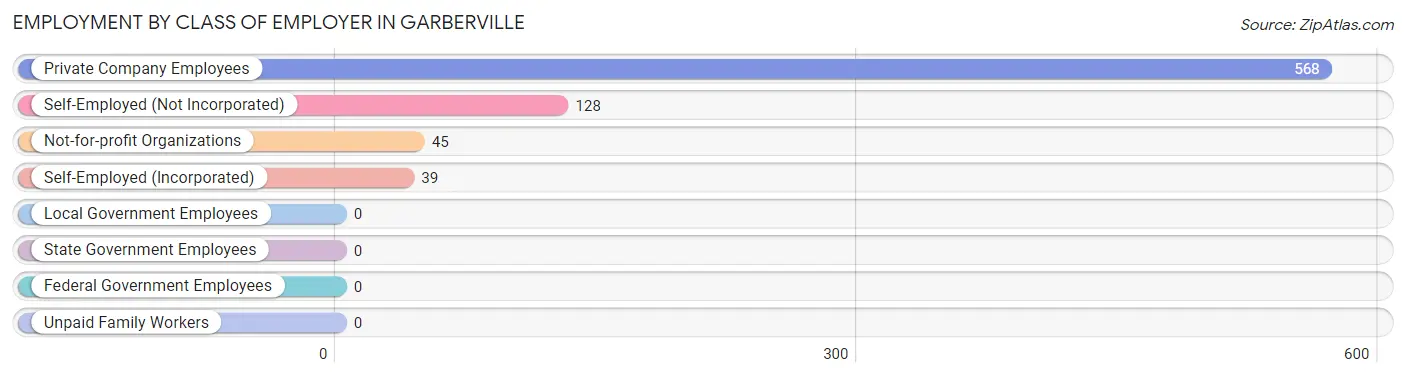
| Employer Class | # Employees | % Employees |
| Private Company Employees | 568 | 72.8% |
| Self-Employed (Incorporated) | 39 | 5.0% |
| Self-Employed (Not Incorporated) | 128 | 16.4% |
| Not-for-profit Organizations | 45 | 5.8% |
| Local Government Employees | 0 | 0.0% |
| State Government Employees | 0 | 0.0% |
| Federal Government Employees | 0 | 0.0% |
| Unpaid Family Workers | 0 | 0.0% |
| Total | 780 | 100.0% |
Employment Status by Age in Garberville
According to the labor force statistics for Garberville, out of the total population over 16 years of age (1,388), 59.7% or 829 individuals are in the labor force, with 1.8% or 15 of them unemployed. The age group with the highest labor force participation rate is 16 to 19 years, with 100.0% or 135 individuals in the labor force. Within the labor force, the 25 to 29 years age range has the highest percentage of unemployed individuals, with 15.6% or 15 of them being unemployed.
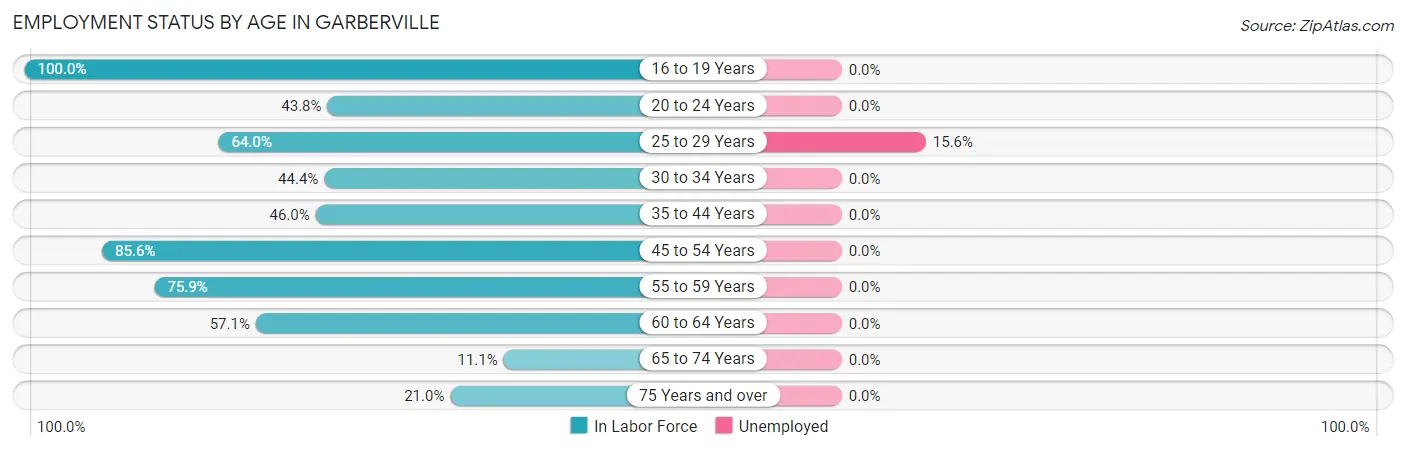
| Age Bracket | In Labor Force | Unemployed |
| 16 to 19 Years | 135 (100.0%) | 0 (0.0%) |
| 20 to 24 Years | 49 (43.8%) | 0 (0.0%) |
| 25 to 29 Years | 96 (64.0%) | 15 (15.6%) |
| 30 to 34 Years | 24 (44.4%) | 0 (0.0%) |
| 35 to 44 Years | 126 (46.0%) | 0 (0.0%) |
| 45 to 54 Years | 291 (85.6%) | 0 (0.0%) |
| 55 to 59 Years | 22 (75.9%) | 0 (0.0%) |
| 60 to 64 Years | 48 (57.1%) | 0 (0.0%) |
| 65 to 74 Years | 8 (11.1%) | 0 (0.0%) |
| 75 Years and over | 29 (21.0%) | 0 (0.0%) |
| Total | 829 (59.7%) | 15 (1.8%) |
Employment Status by Educational Attainment in Garberville
According to labor force statistics for Garberville, 65.2% of individuals (607) out of the total population between 25 and 64 years of age (931) are in the labor force, with 2.5% or 15 of them being unemployed. The group with the highest labor force participation rate are those with the educational attainment of college / associate degree, with 79.3% or 302 individuals in the labor force. Within the labor force, individuals with college / associate degree education have the highest percentage of unemployment, with 5.0% or 15 of them being unemployed.
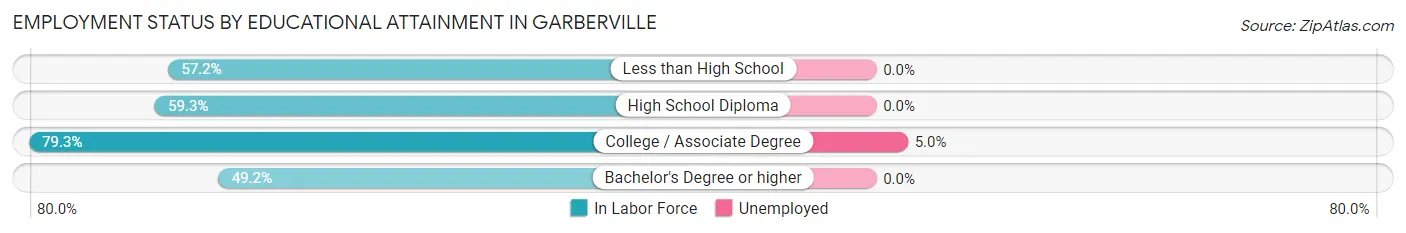
| Educational Attainment | In Labor Force | Unemployed |
| Less than High School | 87 (57.2%) | 0 (0.0%) |
| High School Diploma | 131 (59.3%) | 0 (0.0%) |
| College / Associate Degree | 302 (79.3%) | 19 (5.0%) |
| Bachelor's Degree or higher | 87 (49.2%) | 0 (0.0%) |
| Total | 607 (65.2%) | 23 (2.5%) |
Employment Occupations by Sex in Garberville
Management, Business, Science and Arts Occupations
The most common Management, Business, Science and Arts occupations in Garberville are , and Management (86 | 10.6%).
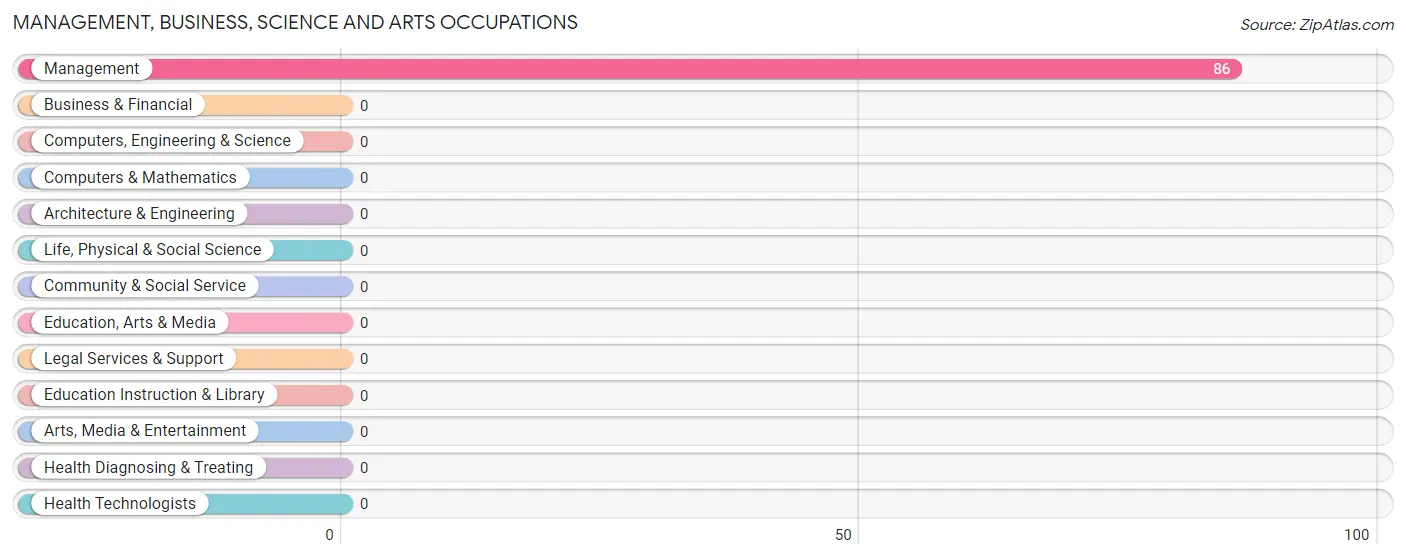
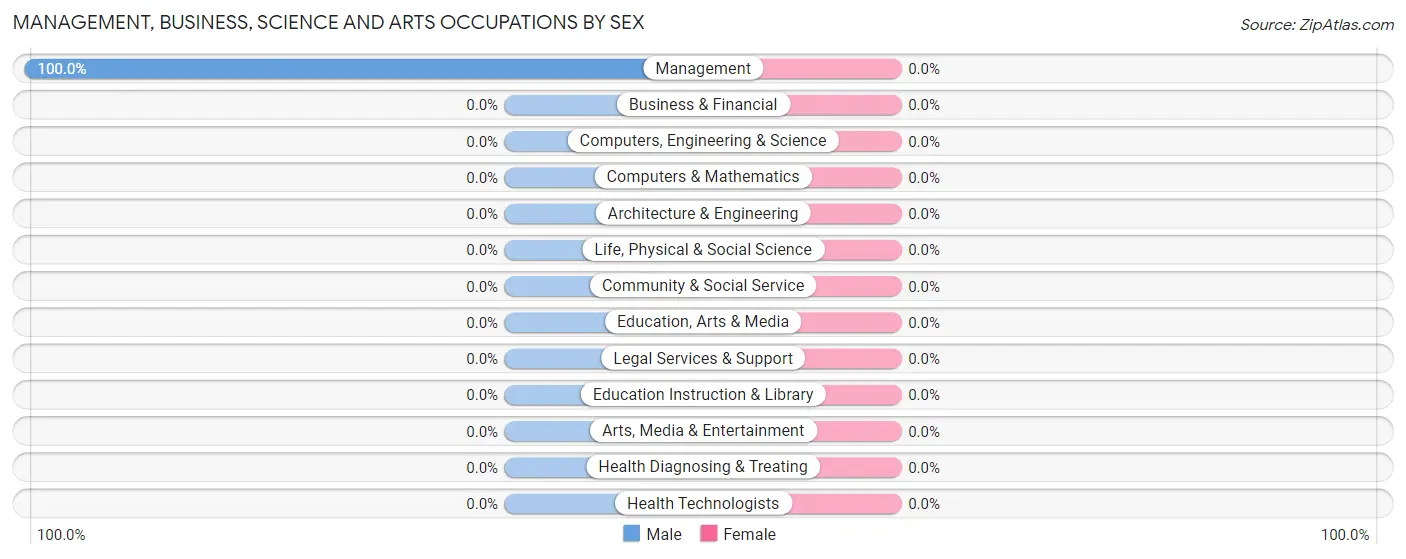
Management, Business, Science and Arts Occupations by Sex
| Occupation | Male | Female |
| Management | 86 (100.0%) | 0 (0.0%) |
| Business & Financial | 0 (0.0%) | 0 (0.0%) |
| Computers, Engineering & Science | 0 (0.0%) | 0 (0.0%) |
| Computers & Mathematics | 0 (0.0%) | 0 (0.0%) |
| Architecture & Engineering | 0 (0.0%) | 0 (0.0%) |
| Life, Physical & Social Science | 0 (0.0%) | 0 (0.0%) |
| Community & Social Service | 0 (0.0%) | 0 (0.0%) |
| Education, Arts & Media | 0 (0.0%) | 0 (0.0%) |
| Legal Services & Support | 0 (0.0%) | 0 (0.0%) |
| Education Instruction & Library | 0 (0.0%) | 0 (0.0%) |
| Arts, Media & Entertainment | 0 (0.0%) | 0 (0.0%) |
| Health Diagnosing & Treating | 0 (0.0%) | 0 (0.0%) |
| Health Technologists | 0 (0.0%) | 0 (0.0%) |
| Total (Category) | 86 (100.0%) | 0 (0.0%) |
| Total (Overall) | 428 (52.6%) | 385 (47.4%) |
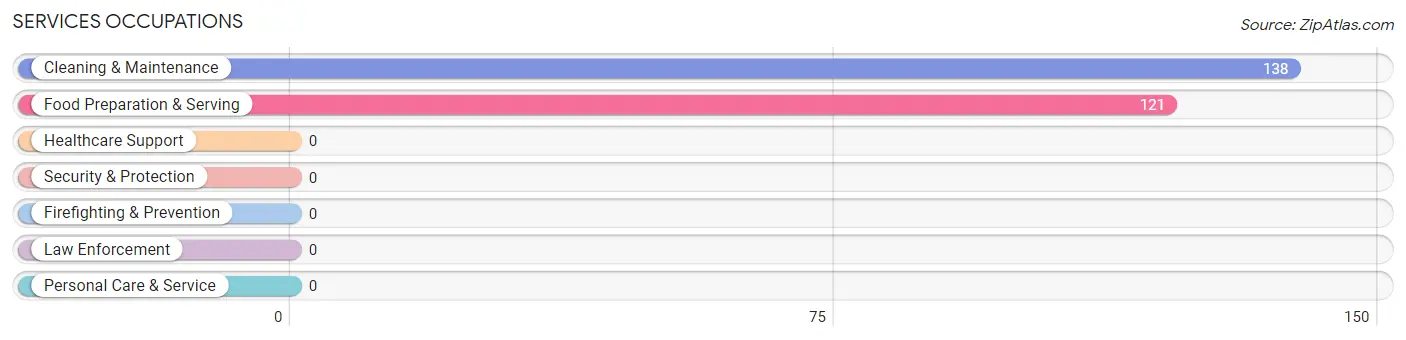
Services Occupations
The most common Services occupations in Garberville are Cleaning & Maintenance (138 | 17.0%), and Food Preparation & Serving (121 | 14.9%).
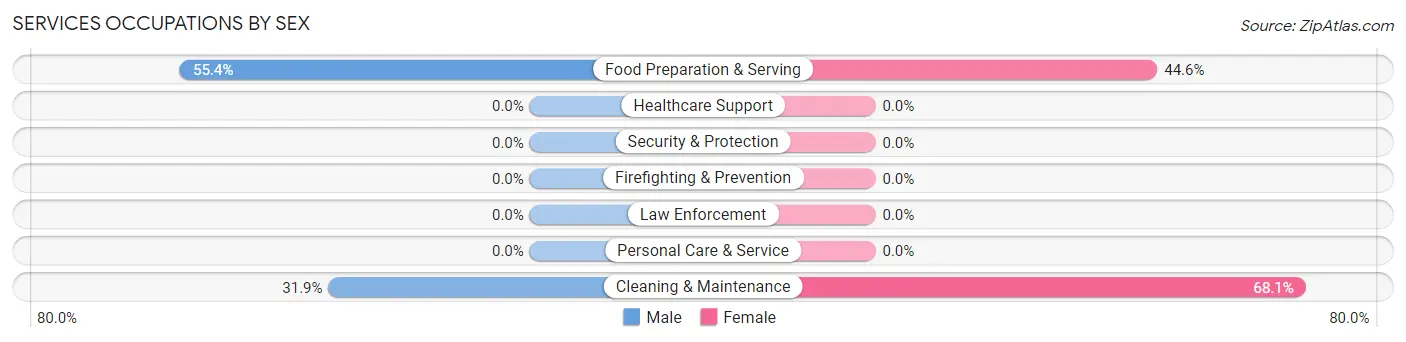
Services Occupations by Sex
Within the Services occupations in Garberville, the most male-oriented occupations are Food Preparation & Serving (55.4%), and Cleaning & Maintenance (31.9%), while the most female-oriented occupations are Cleaning & Maintenance (68.1%), and Food Preparation & Serving (44.6%).
| Occupation | Male | Female |
| Healthcare Support | 0 (0.0%) | 0 (0.0%) |
| Security & Protection | 0 (0.0%) | 0 (0.0%) |
| Firefighting & Prevention | 0 (0.0%) | 0 (0.0%) |
| Law Enforcement | 0 (0.0%) | 0 (0.0%) |
| Food Preparation & Serving | 67 (55.4%) | 54 (44.6%) |
| Cleaning & Maintenance | 44 (31.9%) | 94 (68.1%) |
| Personal Care & Service | 0 (0.0%) | 0 (0.0%) |
| Total (Category) | 111 (42.9%) | 148 (57.1%) |
| Total (Overall) | 428 (52.6%) | 385 (47.4%) |
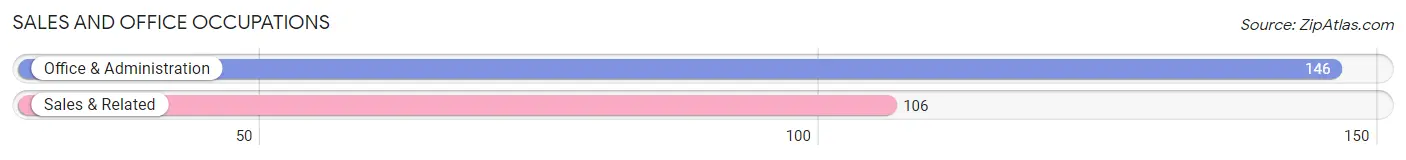
Sales and Office Occupations
The most common Sales and Office occupations in Garberville are Office & Administration (146 | 18.0%), and Sales & Related (106 | 13.0%).
Sales and Office Occupations by Sex
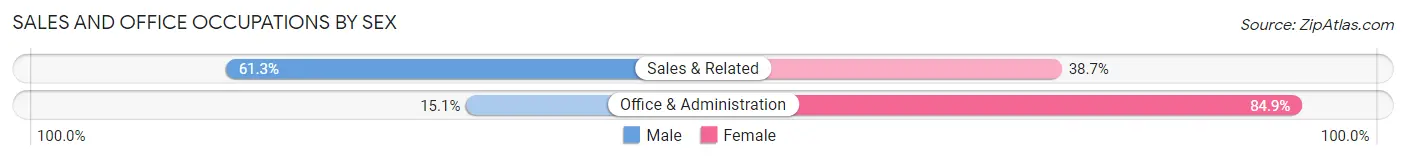
| Occupation | Male | Female |
| Sales & Related | 65 (61.3%) | 41 (38.7%) |
| Office & Administration | 22 (15.1%) | 124 (84.9%) |
| Total (Category) | 87 (34.5%) | 165 (65.5%) |
| Total (Overall) | 428 (52.6%) | 385 (47.4%) |
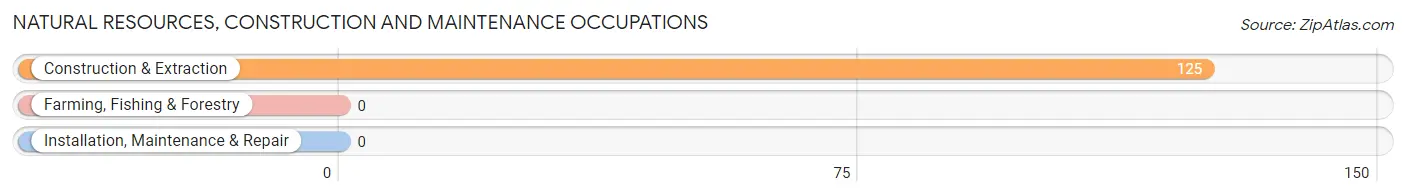
Natural Resources, Construction and Maintenance Occupations
The most common Natural Resources, Construction and Maintenance occupations in Garberville are , and Construction & Extraction (125 | 15.4%).
Natural Resources, Construction and Maintenance Occupations by Sex
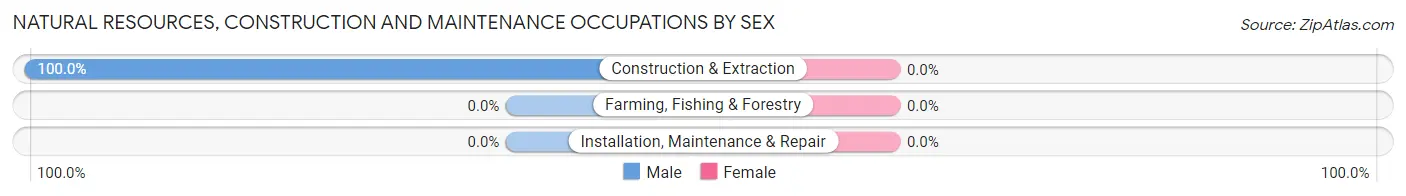
| Occupation | Male | Female |
| Farming, Fishing & Forestry | 0 (0.0%) | 0 (0.0%) |
| Construction & Extraction | 125 (100.0%) | 0 (0.0%) |
| Installation, Maintenance & Repair | 0 (0.0%) | 0 (0.0%) |
| Total (Category) | 125 (100.0%) | 0 (0.0%) |
| Total (Overall) | 428 (52.6%) | 385 (47.4%) |
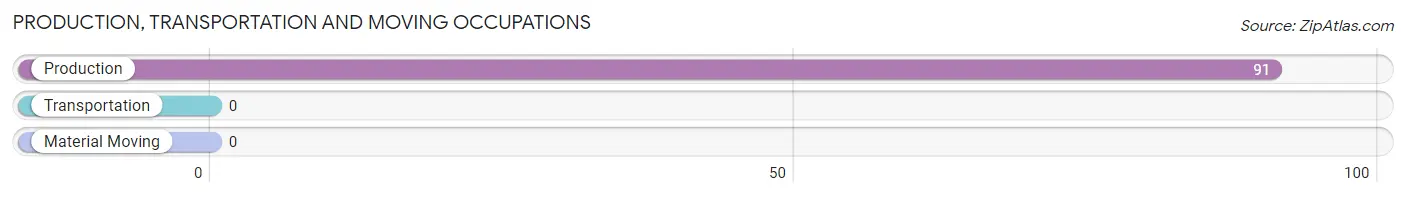
Production, Transportation and Moving Occupations
The most common Production, Transportation and Moving occupations in Garberville are , and Production (91 | 11.2%).
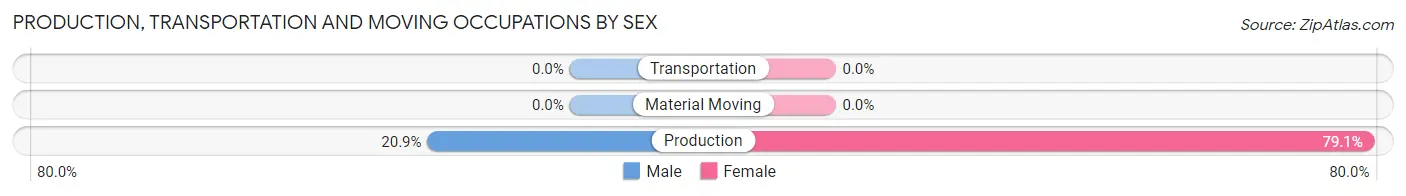
Production, Transportation and Moving Occupations by Sex
| Occupation | Male | Female |
| Production | 19 (20.9%) | 72 (79.1%) |
| Transportation | 0 (0.0%) | 0 (0.0%) |
| Material Moving | 0 (0.0%) | 0 (0.0%) |
| Total (Category) | 19 (20.9%) | 72 (79.1%) |
| Total (Overall) | 428 (52.6%) | 385 (47.4%) |
Employment Industries by Sex in Garberville
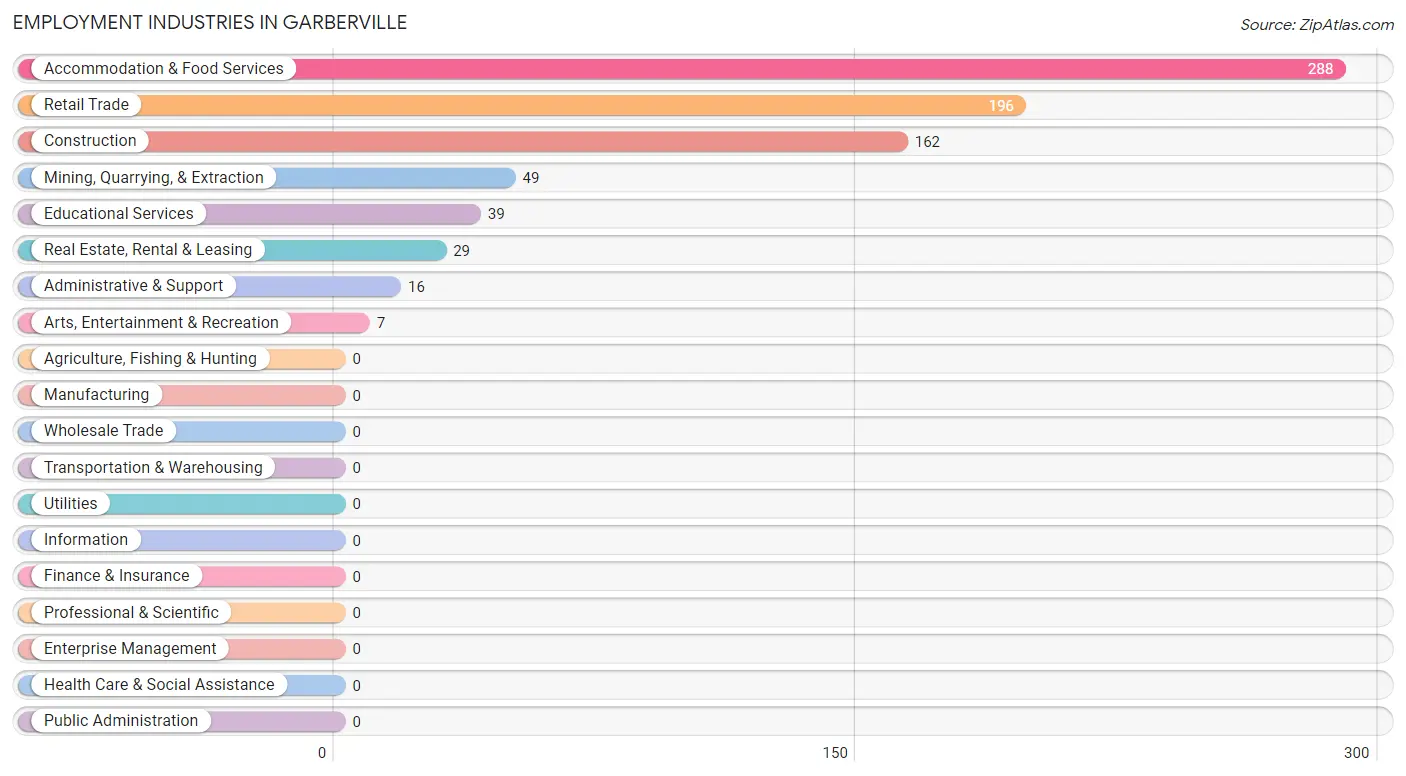
Employment Industries in Garberville
The major employment industries in Garberville include Accommodation & Food Services (288 | 35.4%), Retail Trade (196 | 24.1%), Construction (162 | 19.9%), Mining, Quarrying, & Extraction (49 | 6.0%), and Educational Services (39 | 4.8%).
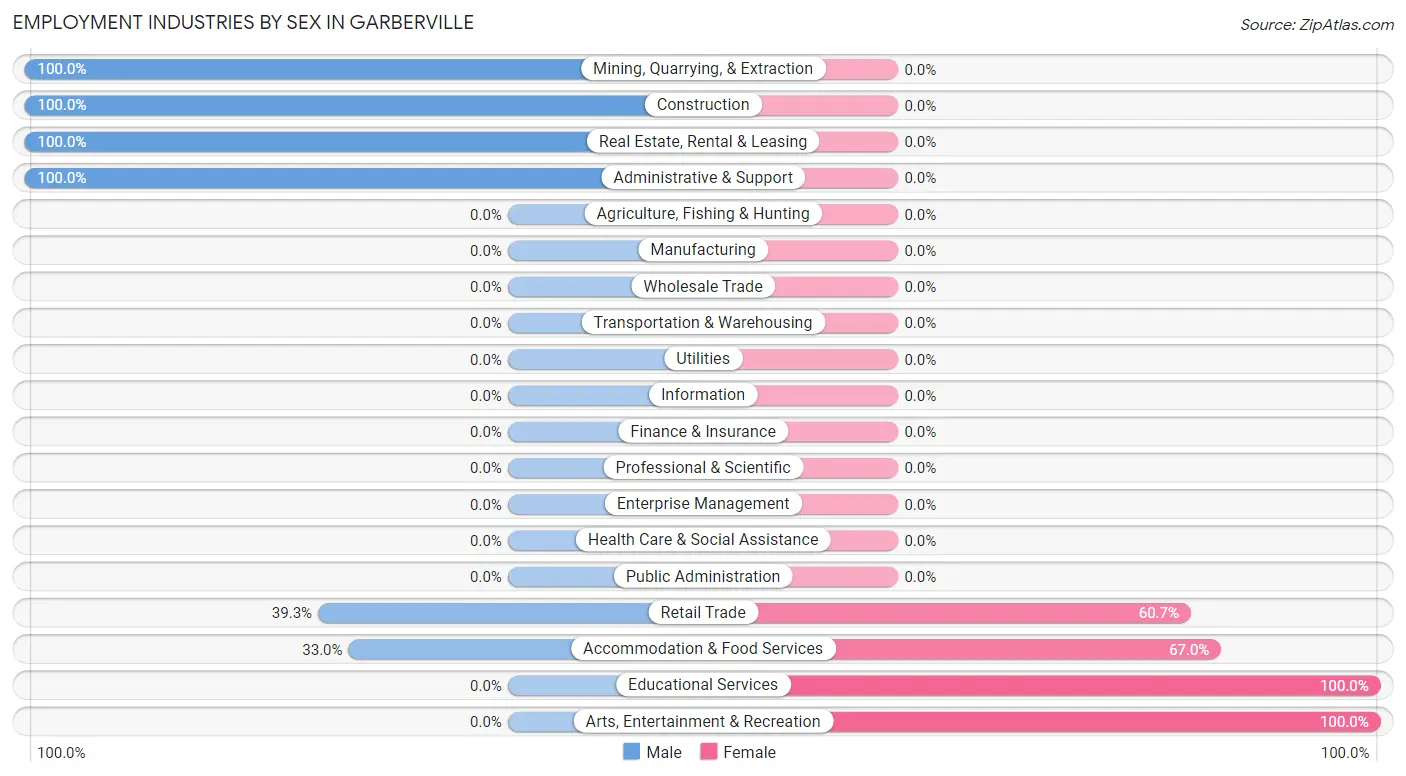
Employment Industries by Sex in Garberville
The Garberville industries that see more men than women are Mining, Quarrying, & Extraction (100.0%), Construction (100.0%), and Real Estate, Rental & Leasing (100.0%), whereas the industries that tend to have a higher number of women are Educational Services (100.0%), Arts, Entertainment & Recreation (100.0%), and Accommodation & Food Services (67.0%).
| Industry | Male | Female |
| Agriculture, Fishing & Hunting | 0 (0.0%) | 0 (0.0%) |
| Mining, Quarrying, & Extraction | 49 (100.0%) | 0 (0.0%) |
| Construction | 162 (100.0%) | 0 (0.0%) |
| Manufacturing | 0 (0.0%) | 0 (0.0%) |
| Wholesale Trade | 0 (0.0%) | 0 (0.0%) |
| Retail Trade | 77 (39.3%) | 119 (60.7%) |
| Transportation & Warehousing | 0 (0.0%) | 0 (0.0%) |
| Utilities | 0 (0.0%) | 0 (0.0%) |
| Information | 0 (0.0%) | 0 (0.0%) |
| Finance & Insurance | 0 (0.0%) | 0 (0.0%) |
| Real Estate, Rental & Leasing | 29 (100.0%) | 0 (0.0%) |
| Professional & Scientific | 0 (0.0%) | 0 (0.0%) |
| Enterprise Management | 0 (0.0%) | 0 (0.0%) |
| Administrative & Support | 16 (100.0%) | 0 (0.0%) |
| Educational Services | 0 (0.0%) | 39 (100.0%) |
| Health Care & Social Assistance | 0 (0.0%) | 0 (0.0%) |
| Arts, Entertainment & Recreation | 0 (0.0%) | 7 (100.0%) |
| Accommodation & Food Services | 95 (33.0%) | 193 (67.0%) |
| Public Administration | 0 (0.0%) | 0 (0.0%) |
| Total | 428 (52.6%) | 385 (47.4%) |
Education in Garberville
School Enrollment in Garberville
The most common levels of schooling among the 380 students in Garberville are elementary school (150 | 39.5%), college / undergraduate (69 | 18.2%), and high school (64 | 16.8%).
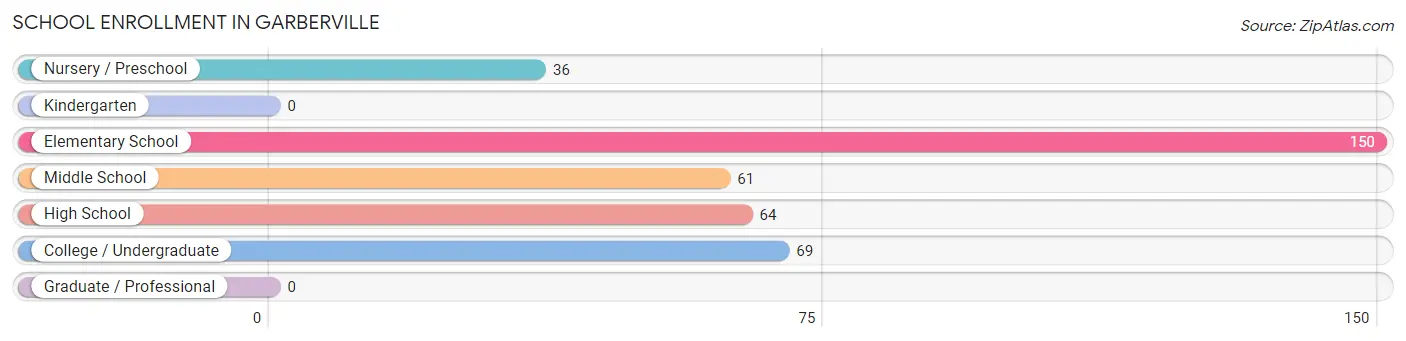
| School Level | # Students | % Students |
| Nursery / Preschool | 36 | 9.5% |
| Kindergarten | 0 | 0.0% |
| Elementary School | 150 | 39.5% |
| Middle School | 61 | 16.1% |
| High School | 64 | 16.8% |
| College / Undergraduate | 69 | 18.2% |
| Graduate / Professional | 0 | 0.0% |
| Total | 380 | 100.0% |
School Enrollment by Age by Funding Source in Garberville
Out of a total of 380 students who are enrolled in schools in Garberville, 36 (9.5%) attend a private institution, while the remaining 344 (90.5%) are enrolled in public schools. The age group of 3 to 4 year olds has the highest likelihood of being enrolled in private schools, with 36 (100.0% in the age bracket) enrolled. Conversely, the age group of 5 to 9 year old has the lowest likelihood of being enrolled in a private school, with 70 (100.0% in the age bracket) attending a public institution.
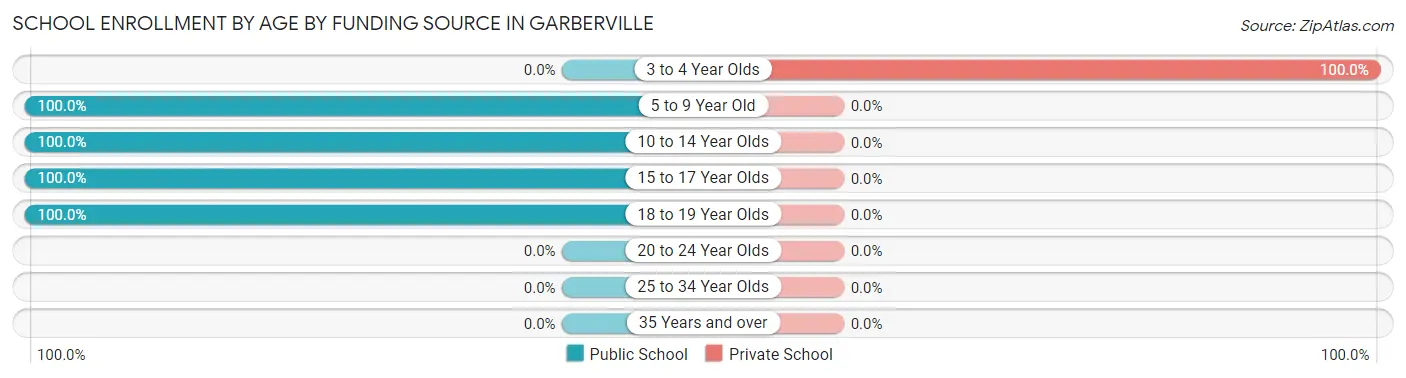
| Age Bracket | Public School | Private School |
| 3 to 4 Year Olds | 0 (0.0%) | 36 (100.0%) |
| 5 to 9 Year Old | 70 (100.0%) | 0 (0.0%) |
| 10 to 14 Year Olds | 141 (100.0%) | 0 (0.0%) |
| 15 to 17 Year Olds | 64 (100.0%) | 0 (0.0%) |
| 18 to 19 Year Olds | 69 (100.0%) | 0 (0.0%) |
| 20 to 24 Year Olds | 0 (0.0%) | 0 (0.0%) |
| 25 to 34 Year Olds | 0 (0.0%) | 0 (0.0%) |
| 35 Years and over | 0 (0.0%) | 0 (0.0%) |
| Total | 344 (90.5%) | 36 (9.5%) |
Educational Attainment by Field of Study in Garberville
Business (90 | 47.1%), bio, nature & agricultural (39 | 20.4%), education (35 | 18.3%), psychology (7 | 3.7%), and liberal arts & history (7 | 3.7%) are the most common fields of study among 191 individuals in Garberville who have obtained a bachelor's degree or higher.
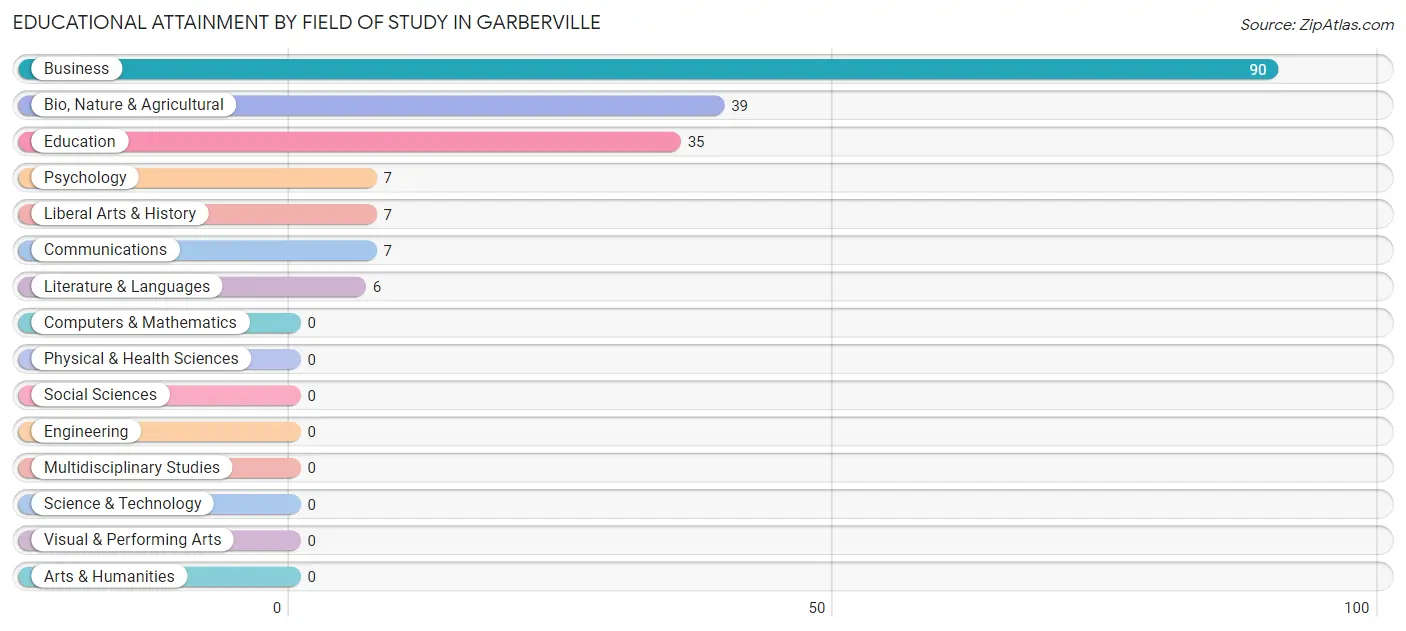
| Field of Study | # Graduates | % Graduates |
| Computers & Mathematics | 0 | 0.0% |
| Bio, Nature & Agricultural | 39 | 20.4% |
| Physical & Health Sciences | 0 | 0.0% |
| Psychology | 7 | 3.7% |
| Social Sciences | 0 | 0.0% |
| Engineering | 0 | 0.0% |
| Multidisciplinary Studies | 0 | 0.0% |
| Science & Technology | 0 | 0.0% |
| Business | 90 | 47.1% |
| Education | 35 | 18.3% |
| Literature & Languages | 6 | 3.1% |
| Liberal Arts & History | 7 | 3.7% |
| Visual & Performing Arts | 0 | 0.0% |
| Communications | 7 | 3.7% |
| Arts & Humanities | 0 | 0.0% |
| Total | 191 | 100.0% |
Transportation & Commute in Garberville
Vehicle Availability by Sex in Garberville
The most prevalent vehicle ownership categories in Garberville are males with no vehicle (131, accounting for 33.2%) and females with no vehicle (28, making up 34.0%).
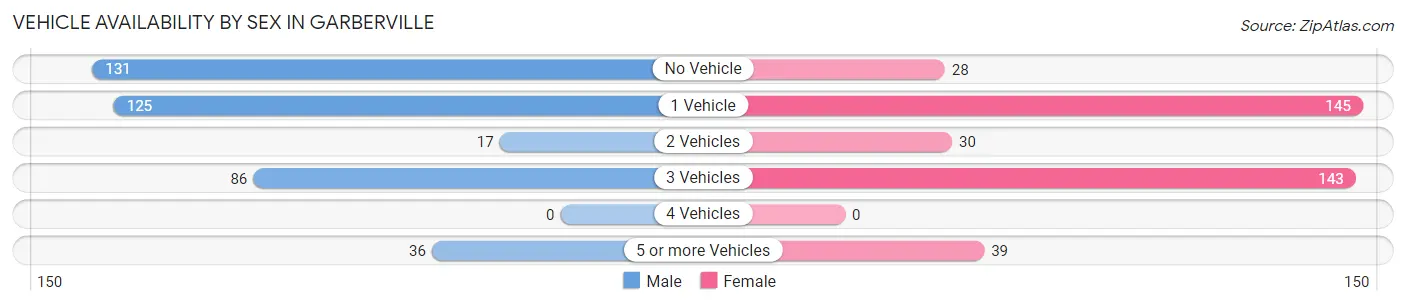
| Vehicles Available | Male | Female |
| No Vehicle | 131 (33.2%) | 28 (7.3%) |
| 1 Vehicle | 125 (31.7%) | 145 (37.7%) |
| 2 Vehicles | 17 (4.3%) | 30 (7.8%) |
| 3 Vehicles | 86 (21.8%) | 143 (37.1%) |
| 4 Vehicles | 0 (0.0%) | 0 (0.0%) |
| 5 or more Vehicles | 36 (9.1%) | 39 (10.1%) |
| Total | 395 (100.0%) | 385 (100.0%) |
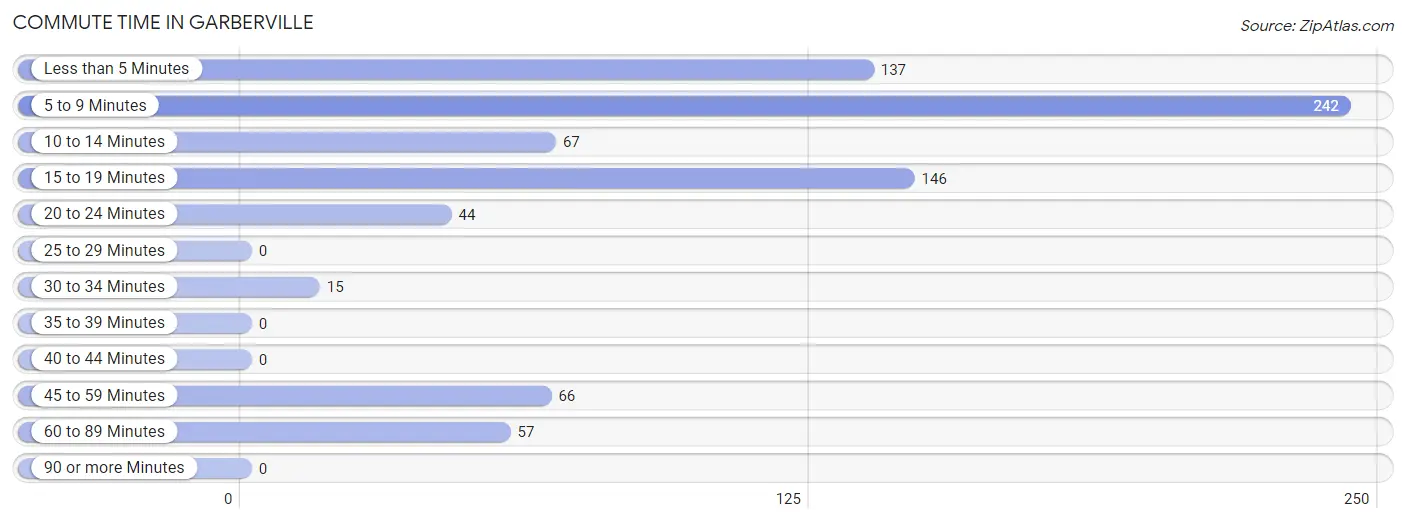
Commute Time in Garberville
The most frequently occuring commute durations in Garberville are 5 to 9 minutes (242 commuters, 31.3%), 15 to 19 minutes (146 commuters, 18.9%), and less than 5 minutes (137 commuters, 17.7%).
| Commute Time | # Commuters | % Commuters |
| Less than 5 Minutes | 137 | 17.7% |
| 5 to 9 Minutes | 242 | 31.3% |
| 10 to 14 Minutes | 67 | 8.7% |
| 15 to 19 Minutes | 146 | 18.9% |
| 20 to 24 Minutes | 44 | 5.7% |
| 25 to 29 Minutes | 0 | 0.0% |
| 30 to 34 Minutes | 15 | 1.9% |
| 35 to 39 Minutes | 0 | 0.0% |
| 40 to 44 Minutes | 0 | 0.0% |
| 45 to 59 Minutes | 66 | 8.5% |
| 60 to 89 Minutes | 57 | 7.4% |
| 90 or more Minutes | 0 | 0.0% |
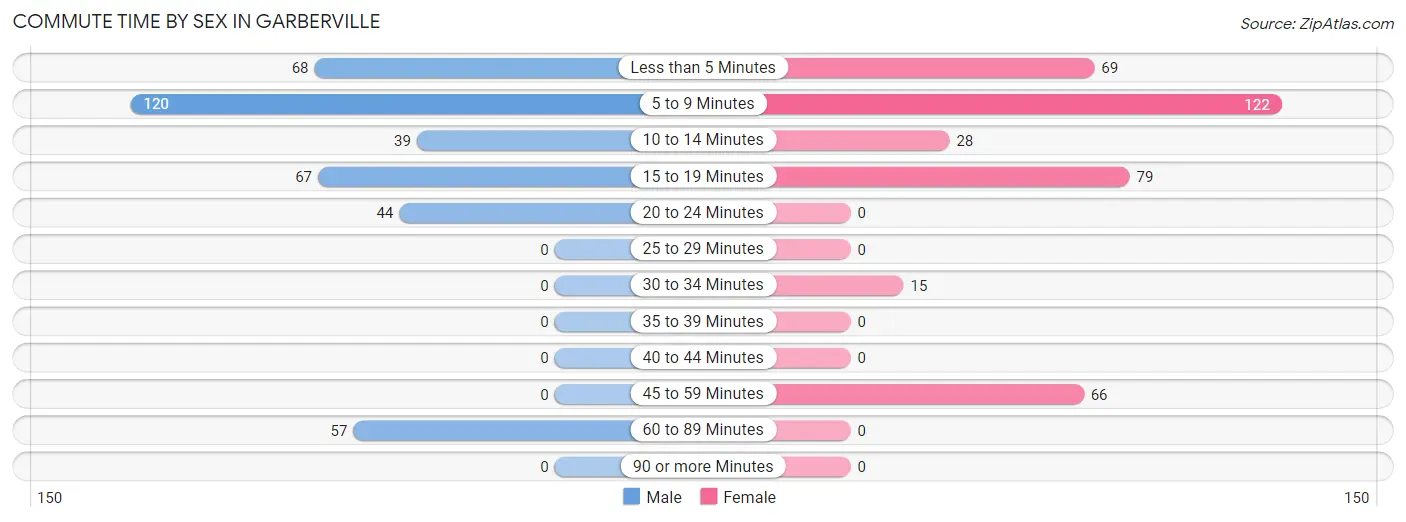
Commute Time by Sex in Garberville
The most common commute times in Garberville are 5 to 9 minutes (120 commuters, 30.4%) for males and 5 to 9 minutes (122 commuters, 32.2%) for females.
| Commute Time | Male | Female |
| Less than 5 Minutes | 68 (17.2%) | 69 (18.2%) |
| 5 to 9 Minutes | 120 (30.4%) | 122 (32.2%) |
| 10 to 14 Minutes | 39 (9.9%) | 28 (7.4%) |
| 15 to 19 Minutes | 67 (17.0%) | 79 (20.8%) |
| 20 to 24 Minutes | 44 (11.1%) | 0 (0.0%) |
| 25 to 29 Minutes | 0 (0.0%) | 0 (0.0%) |
| 30 to 34 Minutes | 0 (0.0%) | 15 (4.0%) |
| 35 to 39 Minutes | 0 (0.0%) | 0 (0.0%) |
| 40 to 44 Minutes | 0 (0.0%) | 0 (0.0%) |
| 45 to 59 Minutes | 0 (0.0%) | 66 (17.4%) |
| 60 to 89 Minutes | 57 (14.4%) | 0 (0.0%) |
| 90 or more Minutes | 0 (0.0%) | 0 (0.0%) |
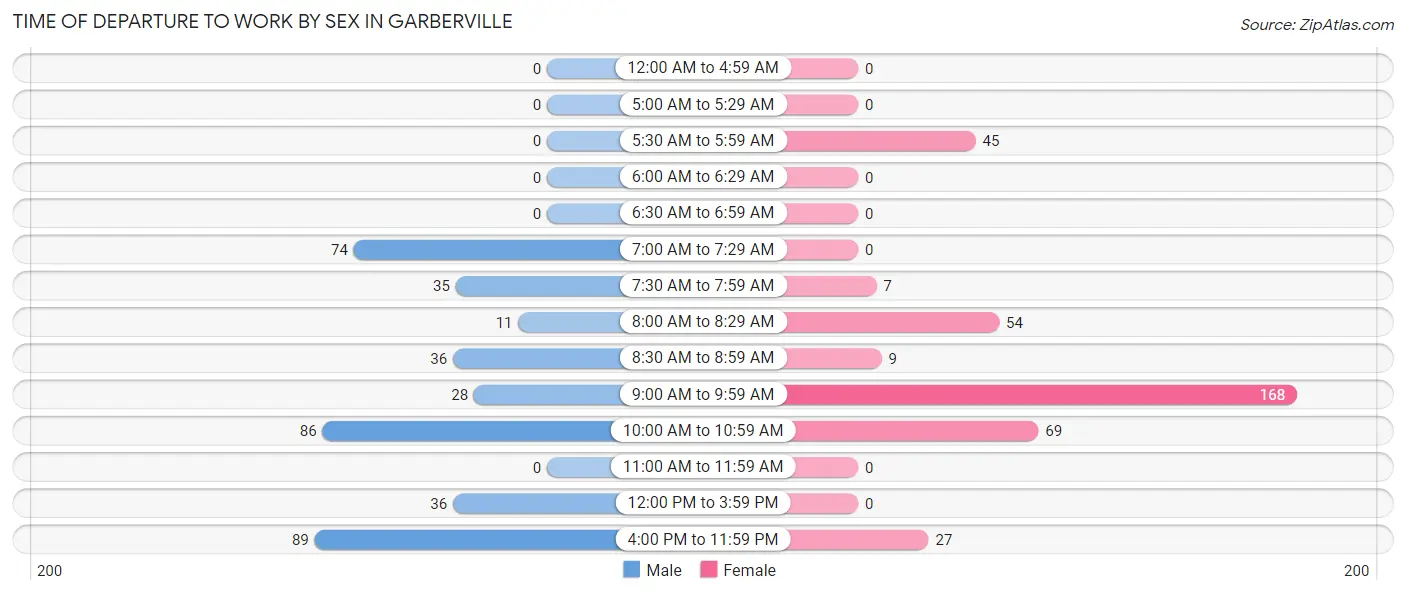
Time of Departure to Work by Sex in Garberville
The most frequent times of departure to work in Garberville are 4:00 PM to 11:59 PM (89, 22.5%) for males and 9:00 AM to 9:59 AM (168, 44.3%) for females.
| Time of Departure | Male | Female |
| 12:00 AM to 4:59 AM | 0 (0.0%) | 0 (0.0%) |
| 5:00 AM to 5:29 AM | 0 (0.0%) | 0 (0.0%) |
| 5:30 AM to 5:59 AM | 0 (0.0%) | 45 (11.9%) |
| 6:00 AM to 6:29 AM | 0 (0.0%) | 0 (0.0%) |
| 6:30 AM to 6:59 AM | 0 (0.0%) | 0 (0.0%) |
| 7:00 AM to 7:29 AM | 74 (18.7%) | 0 (0.0%) |
| 7:30 AM to 7:59 AM | 35 (8.9%) | 7 (1.8%) |
| 8:00 AM to 8:29 AM | 11 (2.8%) | 54 (14.2%) |
| 8:30 AM to 8:59 AM | 36 (9.1%) | 9 (2.4%) |
| 9:00 AM to 9:59 AM | 28 (7.1%) | 168 (44.3%) |
| 10:00 AM to 10:59 AM | 86 (21.8%) | 69 (18.2%) |
| 11:00 AM to 11:59 AM | 0 (0.0%) | 0 (0.0%) |
| 12:00 PM to 3:59 PM | 36 (9.1%) | 0 (0.0%) |
| 4:00 PM to 11:59 PM | 89 (22.5%) | 27 (7.1%) |
| Total | 395 (100.0%) | 379 (100.0%) |
Housing Occupancy in Garberville
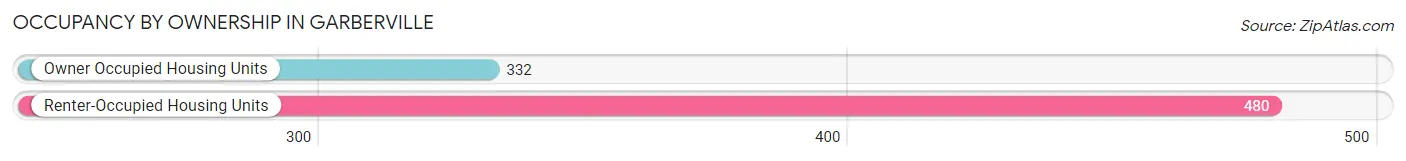
Occupancy by Ownership in Garberville
Of the total 812 dwellings in Garberville, owner-occupied units account for 332 (40.9%), while renter-occupied units make up 480 (59.1%).
| Occupancy | # Housing Units | % Housing Units |
| Owner Occupied Housing Units | 332 | 40.9% |
| Renter-Occupied Housing Units | 480 | 59.1% |
| Total Occupied Housing Units | 812 | 100.0% |
Occupancy by Household Size in Garberville
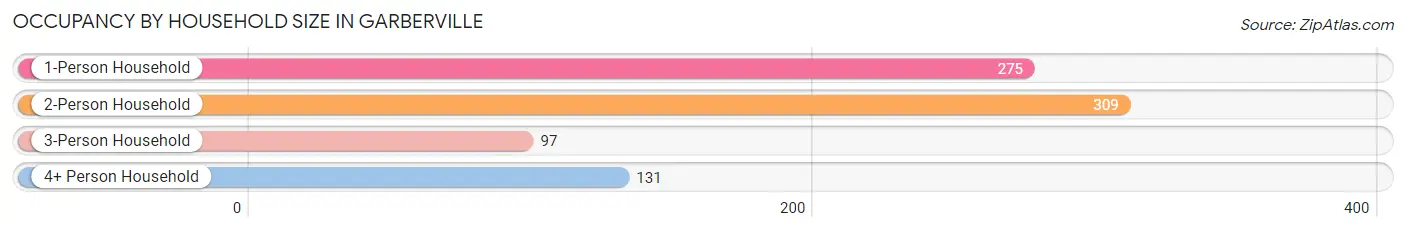
| Household Size | # Housing Units | % Housing Units |
| 1-Person Household | 275 | 33.9% |
| 2-Person Household | 309 | 38.1% |
| 3-Person Household | 97 | 11.9% |
| 4+ Person Household | 131 | 16.1% |
| Total Housing Units | 812 | 100.0% |
Occupancy by Ownership by Household Size in Garberville
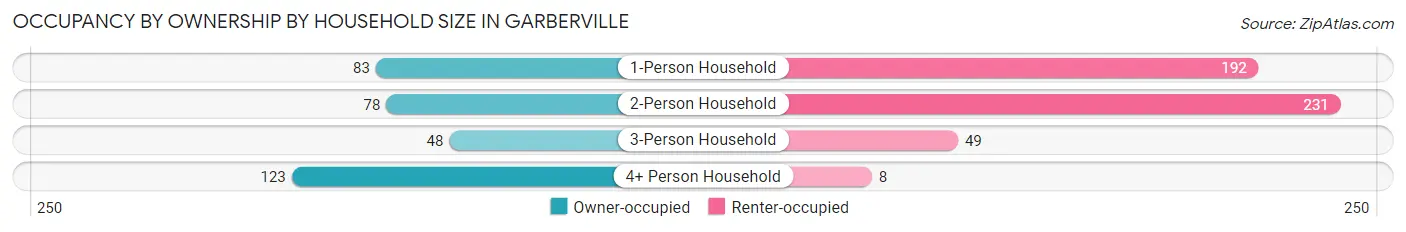
| Household Size | Owner-occupied | Renter-occupied |
| 1-Person Household | 83 (30.2%) | 192 (69.8%) |
| 2-Person Household | 78 (25.2%) | 231 (74.8%) |
| 3-Person Household | 48 (49.5%) | 49 (50.5%) |
| 4+ Person Household | 123 (93.9%) | 8 (6.1%) |
| Total Housing Units | 332 (40.9%) | 480 (59.1%) |
Occupancy by Educational Attainment in Garberville
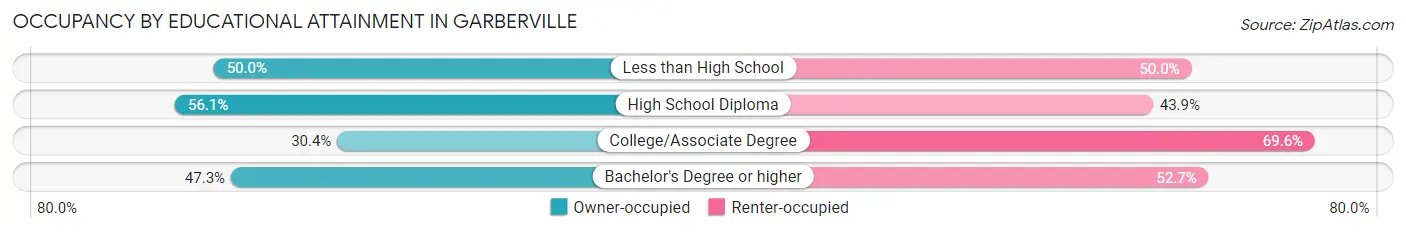
| Household Size | Owner-occupied | Renter-occupied |
| Less than High School | 36 (50.0%) | 36 (50.0%) |
| High School Diploma | 87 (56.1%) | 68 (43.9%) |
| College/Associate Degree | 122 (30.4%) | 279 (69.6%) |
| Bachelor's Degree or higher | 87 (47.3%) | 97 (52.7%) |
Occupancy by Age of Householder in Garberville
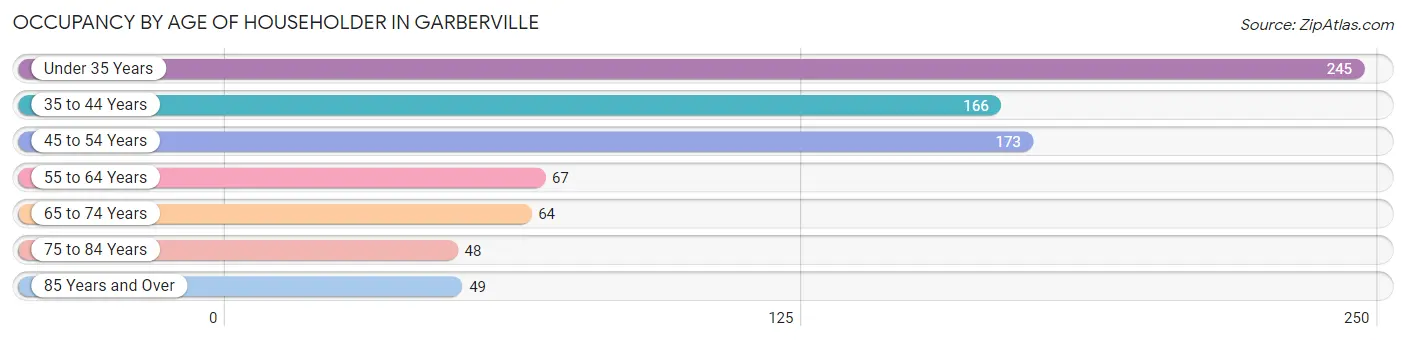
| Age Bracket | # Households | % Households |
| Under 35 Years | 245 | 30.2% |
| 35 to 44 Years | 166 | 20.4% |
| 45 to 54 Years | 173 | 21.3% |
| 55 to 64 Years | 67 | 8.3% |
| 65 to 74 Years | 64 | 7.9% |
| 75 to 84 Years | 48 | 5.9% |
| 85 Years and Over | 49 | 6.0% |
| Total | 812 | 100.0% |
Housing Finances in Garberville
Median Income by Occupancy in Garberville
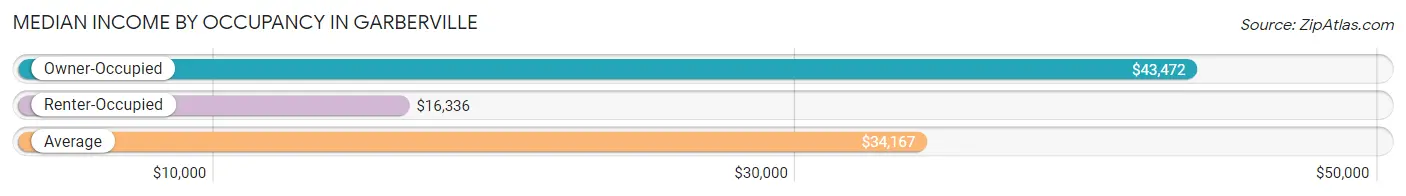
| Occupancy Type | # Households | Median Income |
| Owner-Occupied | 332 (40.9%) | $43,472 |
| Renter-Occupied | 480 (59.1%) | $16,336 |
| Average | 812 (100.0%) | $34,167 |
Occupancy by Householder Income Bracket in Garberville
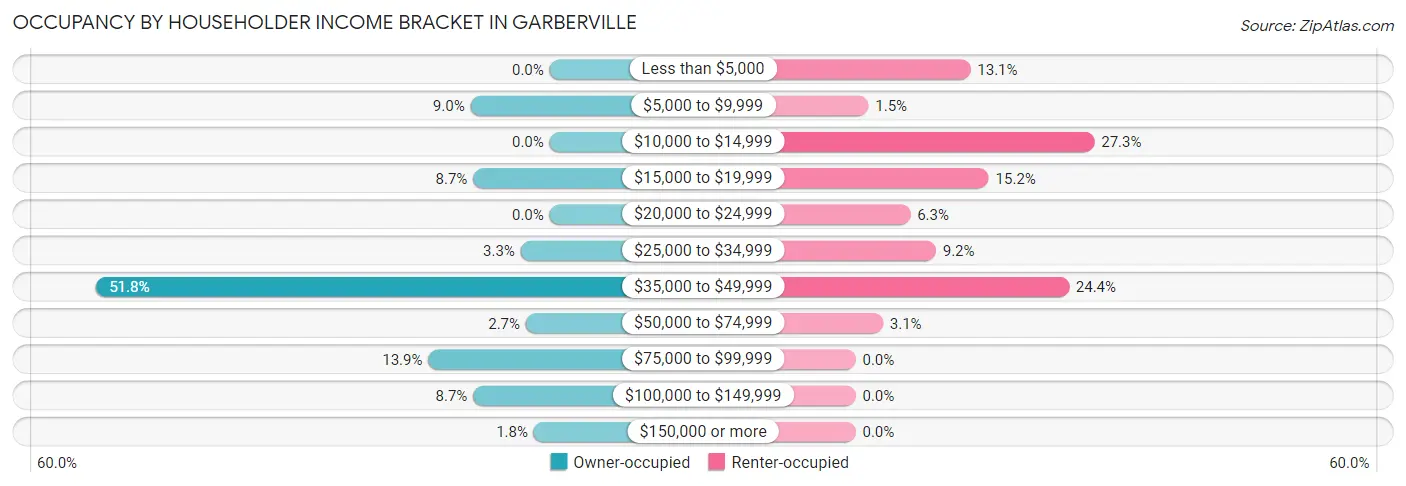
| Income Bracket | Owner-occupied | Renter-occupied |
| Less than $5,000 | 0 (0.0%) | 63 (13.1%) |
| $5,000 to $9,999 | 30 (9.0%) | 7 (1.5%) |
| $10,000 to $14,999 | 0 (0.0%) | 131 (27.3%) |
| $15,000 to $19,999 | 29 (8.7%) | 73 (15.2%) |
| $20,000 to $24,999 | 0 (0.0%) | 30 (6.2%) |
| $25,000 to $34,999 | 11 (3.3%) | 44 (9.2%) |
| $35,000 to $49,999 | 172 (51.8%) | 117 (24.4%) |
| $50,000 to $74,999 | 9 (2.7%) | 15 (3.1%) |
| $75,000 to $99,999 | 46 (13.9%) | 0 (0.0%) |
| $100,000 to $149,999 | 29 (8.7%) | 0 (0.0%) |
| $150,000 or more | 6 (1.8%) | 0 (0.0%) |
| Total | 332 (100.0%) | 480 (100.0%) |
Monthly Housing Cost Tiers in Garberville
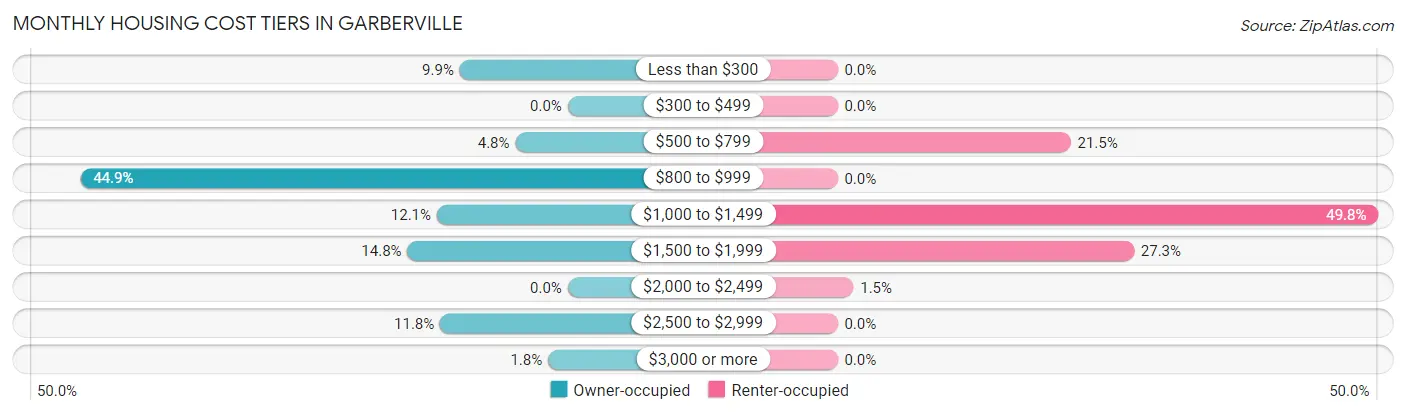
| Monthly Cost | Owner-occupied | Renter-occupied |
| Less than $300 | 33 (9.9%) | 0 (0.0%) |
| $300 to $499 | 0 (0.0%) | 0 (0.0%) |
| $500 to $799 | 16 (4.8%) | 103 (21.5%) |
| $800 to $999 | 149 (44.9%) | 0 (0.0%) |
| $1,000 to $1,499 | 40 (12.0%) | 239 (49.8%) |
| $1,500 to $1,999 | 49 (14.8%) | 131 (27.3%) |
| $2,000 to $2,499 | 0 (0.0%) | 7 (1.5%) |
| $2,500 to $2,999 | 39 (11.7%) | 0 (0.0%) |
| $3,000 or more | 6 (1.8%) | 0 (0.0%) |
| Total | 332 (100.0%) | 480 (100.0%) |
Physical Housing Characteristics in Garberville
Housing Structures in Garberville
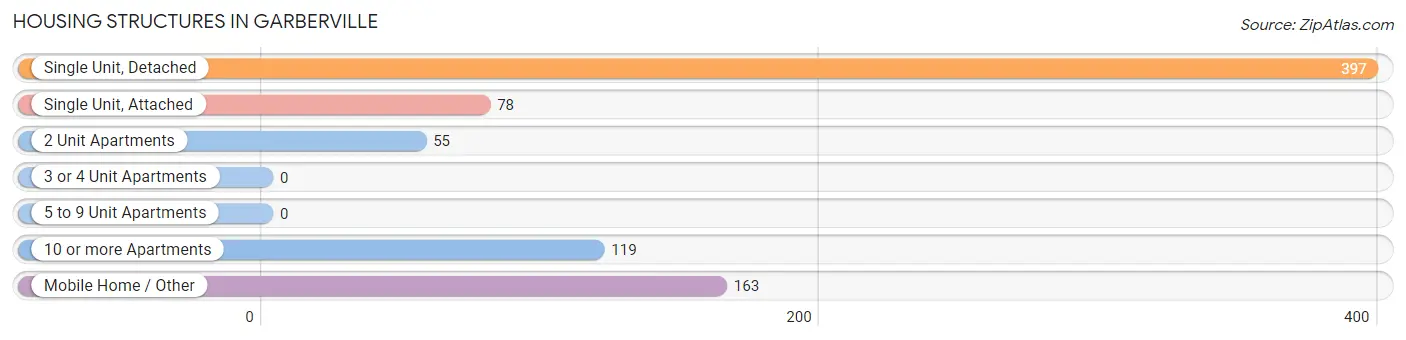
| Structure Type | # Housing Units | % Housing Units |
| Single Unit, Detached | 397 | 48.9% |
| Single Unit, Attached | 78 | 9.6% |
| 2 Unit Apartments | 55 | 6.8% |
| 3 or 4 Unit Apartments | 0 | 0.0% |
| 5 to 9 Unit Apartments | 0 | 0.0% |
| 10 or more Apartments | 119 | 14.7% |
| Mobile Home / Other | 163 | 20.1% |
| Total | 812 | 100.0% |
Housing Structures by Occupancy in Garberville
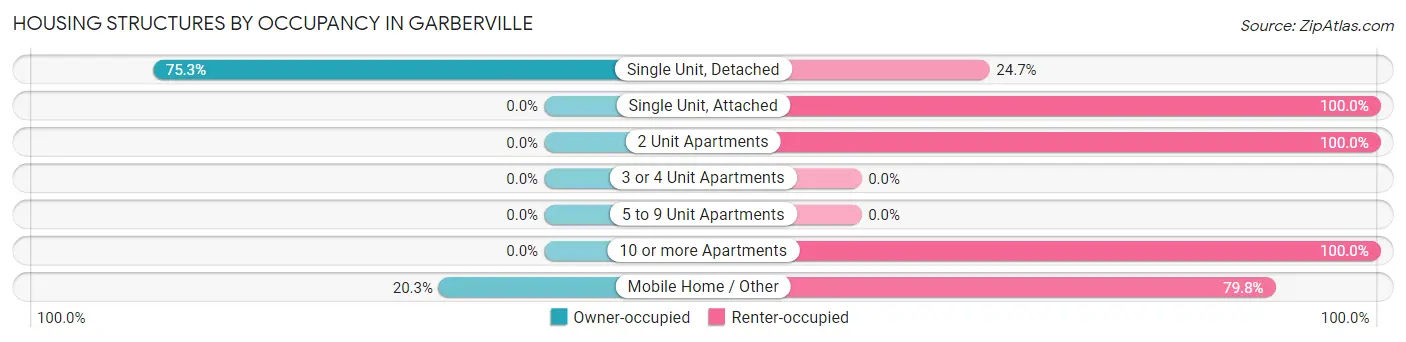
| Structure Type | Owner-occupied | Renter-occupied |
| Single Unit, Detached | 299 (75.3%) | 98 (24.7%) |
| Single Unit, Attached | 0 (0.0%) | 78 (100.0%) |
| 2 Unit Apartments | 0 (0.0%) | 55 (100.0%) |
| 3 or 4 Unit Apartments | 0 (0.0%) | 0 (0.0%) |
| 5 to 9 Unit Apartments | 0 (0.0%) | 0 (0.0%) |
| 10 or more Apartments | 0 (0.0%) | 119 (100.0%) |
| Mobile Home / Other | 33 (20.3%) | 130 (79.7%) |
| Total | 332 (40.9%) | 480 (59.1%) |
Housing Structures by Number of Rooms in Garberville
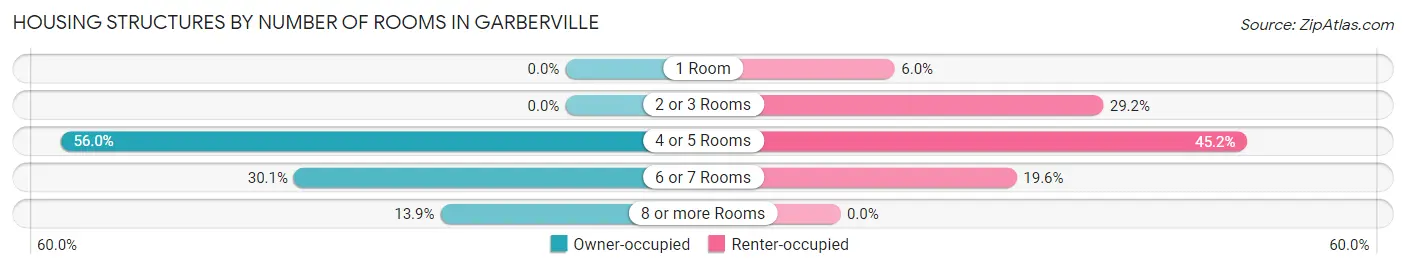
| Number of Rooms | Owner-occupied | Renter-occupied |
| 1 Room | 0 (0.0%) | 29 (6.0%) |
| 2 or 3 Rooms | 0 (0.0%) | 140 (29.2%) |
| 4 or 5 Rooms | 186 (56.0%) | 217 (45.2%) |
| 6 or 7 Rooms | 100 (30.1%) | 94 (19.6%) |
| 8 or more Rooms | 46 (13.9%) | 0 (0.0%) |
| Total | 332 (100.0%) | 480 (100.0%) |
Housing Structure by Heating Type in Garberville
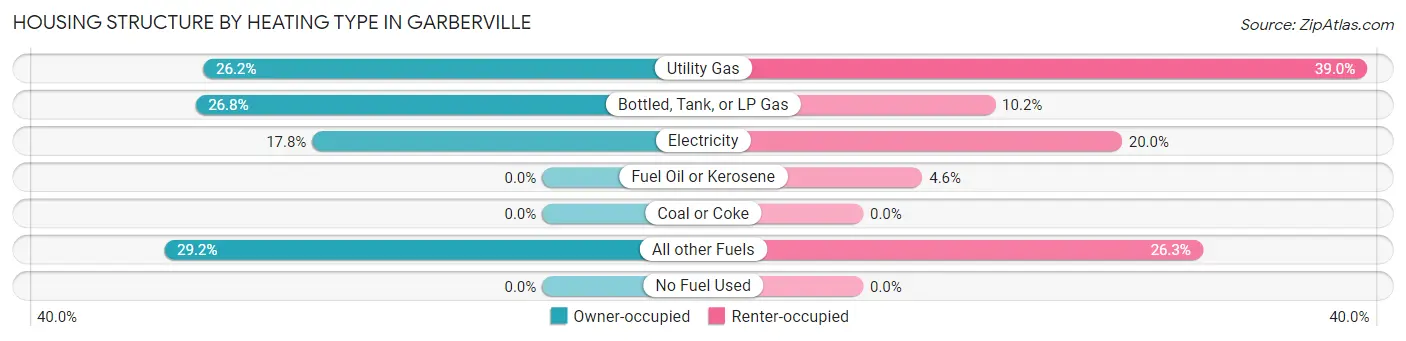
| Heating Type | Owner-occupied | Renter-occupied |
| Utility Gas | 87 (26.2%) | 187 (39.0%) |
| Bottled, Tank, or LP Gas | 89 (26.8%) | 49 (10.2%) |
| Electricity | 59 (17.8%) | 96 (20.0%) |
| Fuel Oil or Kerosene | 0 (0.0%) | 22 (4.6%) |
| Coal or Coke | 0 (0.0%) | 0 (0.0%) |
| All other Fuels | 97 (29.2%) | 126 (26.3%) |
| No Fuel Used | 0 (0.0%) | 0 (0.0%) |
| Total | 332 (100.0%) | 480 (100.0%) |
Household Vehicle Usage in Garberville
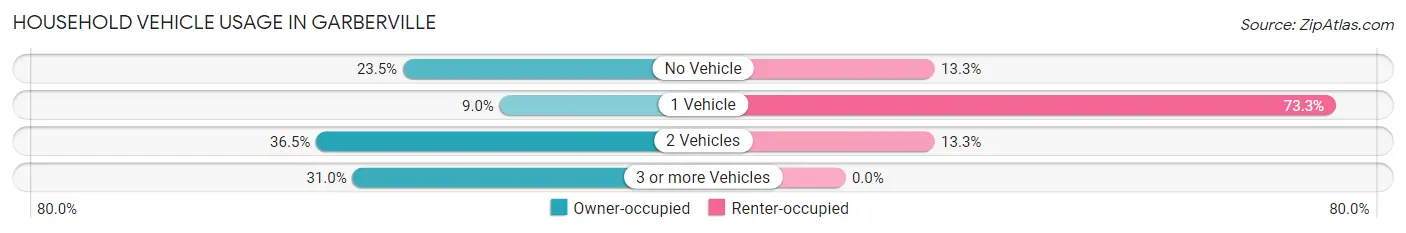
| Vehicles per Household | Owner-occupied | Renter-occupied |
| No Vehicle | 78 (23.5%) | 64 (13.3%) |
| 1 Vehicle | 30 (9.0%) | 352 (73.3%) |
| 2 Vehicles | 121 (36.4%) | 64 (13.3%) |
| 3 or more Vehicles | 103 (31.0%) | 0 (0.0%) |
| Total | 332 (100.0%) | 480 (100.0%) |
Real Estate & Mortgages in Garberville
Real Estate and Mortgage Overview in Garberville
| Characteristic | Without Mortgage | With Mortgage |
| Housing Units | 246 | 86 |
| Median Property Value | $341,600 | $785,000 |
| Median Household Income | $43,333 | $6 |
| Monthly Housing Costs | $850 | $6 |
| Real Estate Taxes | $3,494 | $0 |
Property Value by Mortgage Status in Garberville
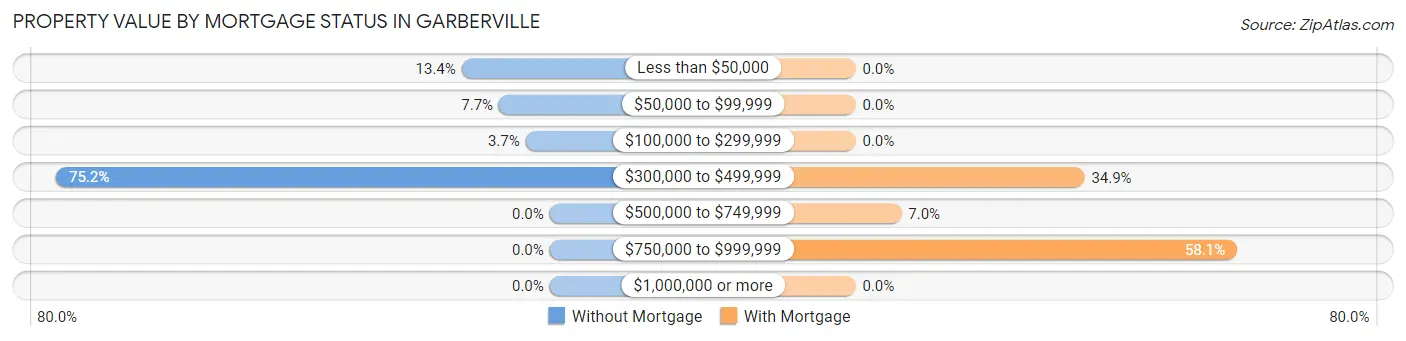
| Property Value | Without Mortgage | With Mortgage |
| Less than $50,000 | 33 (13.4%) | 0 (0.0%) |
| $50,000 to $99,999 | 19 (7.7%) | 0 (0.0%) |
| $100,000 to $299,999 | 9 (3.7%) | 0 (0.0%) |
| $300,000 to $499,999 | 185 (75.2%) | 30 (34.9%) |
| $500,000 to $749,999 | 0 (0.0%) | 6 (7.0%) |
| $750,000 to $999,999 | 0 (0.0%) | 50 (58.1%) |
| $1,000,000 or more | 0 (0.0%) | 0 (0.0%) |
| Total | 246 (100.0%) | 86 (100.0%) |
Household Income by Mortgage Status in Garberville
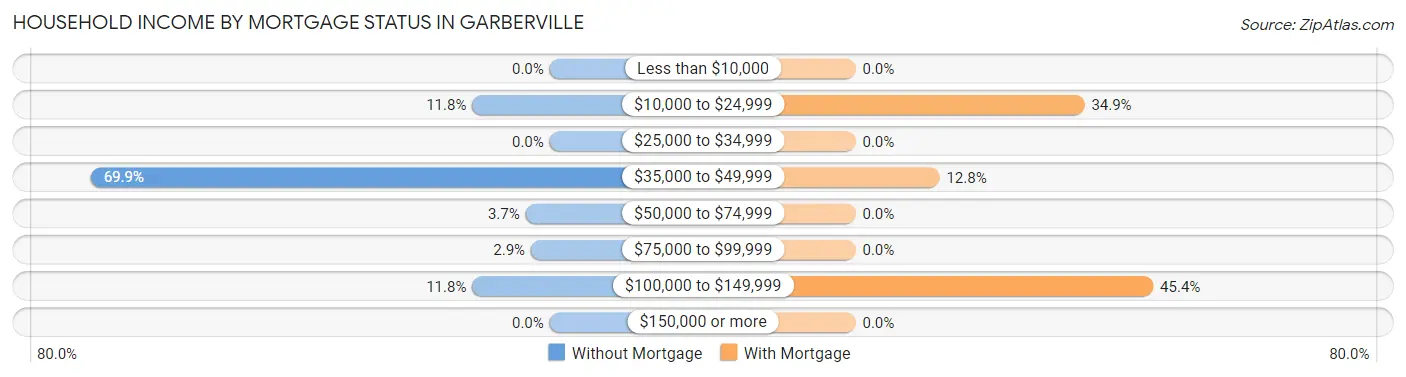
| Household Income | Without Mortgage | With Mortgage |
| Less than $10,000 | 0 (0.0%) | 0 (0.0%) |
| $10,000 to $24,999 | 29 (11.8%) | 30 (34.9%) |
| $25,000 to $34,999 | 0 (0.0%) | 0 (0.0%) |
| $35,000 to $49,999 | 172 (69.9%) | 11 (12.8%) |
| $50,000 to $74,999 | 9 (3.7%) | 0 (0.0%) |
| $75,000 to $99,999 | 7 (2.9%) | 0 (0.0%) |
| $100,000 to $149,999 | 29 (11.8%) | 39 (45.4%) |
| $150,000 or more | 0 (0.0%) | 0 (0.0%) |
| Total | 246 (100.0%) | 86 (100.0%) |
Property Value to Household Income Ratio in Garberville
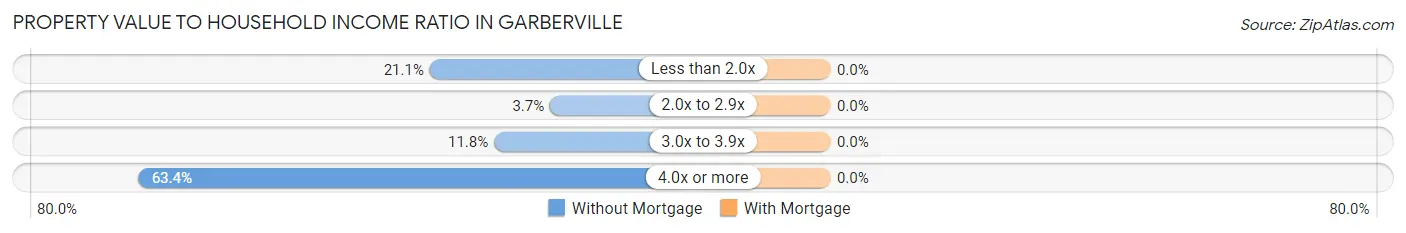
| Value-to-Income Ratio | Without Mortgage | With Mortgage |
| Less than 2.0x | 52 (21.1%) | 0 (0.0%) |
| 2.0x to 2.9x | 9 (3.7%) | 0 (0.0%) |
| 3.0x to 3.9x | 29 (11.8%) | 0 (0.0%) |
| 4.0x or more | 156 (63.4%) | 0 (0.0%) |
| Total | 246 (100.0%) | 86 (100.0%) |
Real Estate Taxes by Mortgage Status in Garberville
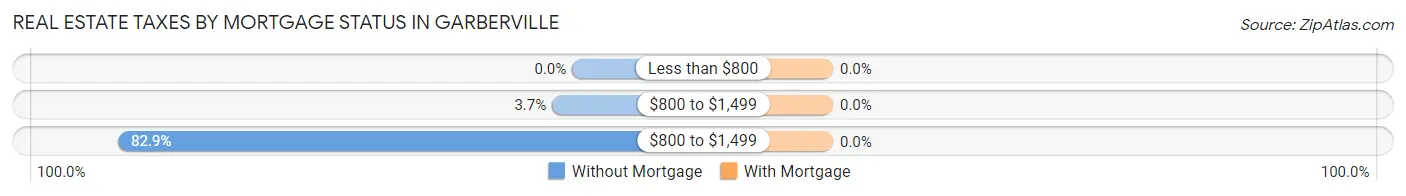
| Property Taxes | Without Mortgage | With Mortgage |
| Less than $800 | 0 (0.0%) | 0 (0.0%) |
| $800 to $1,499 | 9 (3.7%) | 0 (0.0%) |
| $800 to $1,499 | 204 (82.9%) | 0 (0.0%) |
| Total | 246 (100.0%) | 86 (100.0%) |
Health & Disability in Garberville
Health Insurance Coverage by Age in Garberville
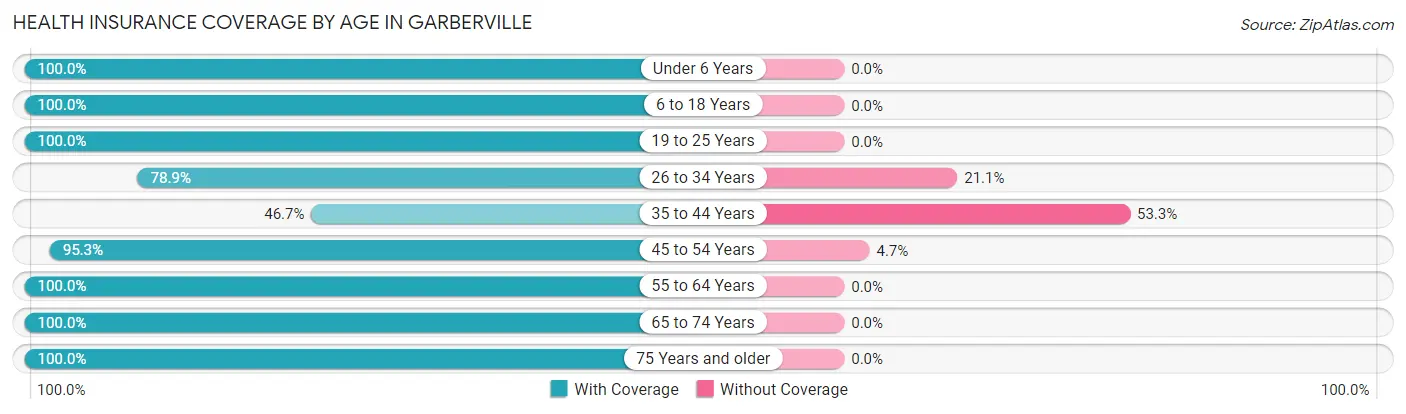
| Age Bracket | With Coverage | Without Coverage |
| Under 6 Years | 152 (100.0%) | 0 (0.0%) |
| 6 to 18 Years | 344 (100.0%) | 0 (0.0%) |
| 19 to 25 Years | 178 (100.0%) | 0 (0.0%) |
| 26 to 34 Years | 161 (78.9%) | 43 (21.1%) |
| 35 to 44 Years | 128 (46.7%) | 146 (53.3%) |
| 45 to 54 Years | 324 (95.3%) | 16 (4.7%) |
| 55 to 64 Years | 113 (100.0%) | 0 (0.0%) |
| 65 to 74 Years | 72 (100.0%) | 0 (0.0%) |
| 75 Years and older | 137 (100.0%) | 0 (0.0%) |
| Total | 1,609 (88.7%) | 205 (11.3%) |
Health Insurance Coverage by Citizenship Status in Garberville
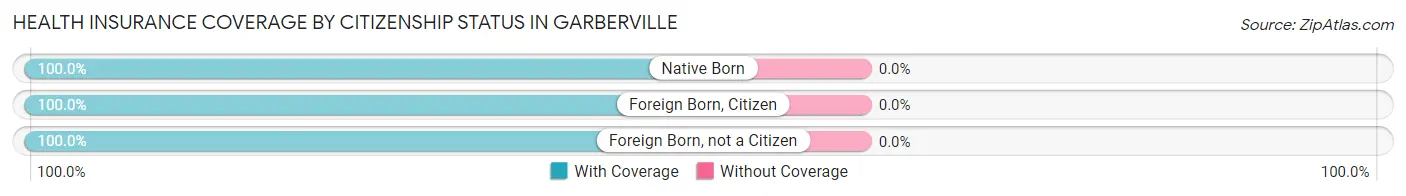
| Citizenship Status | With Coverage | Without Coverage |
| Native Born | 152 (100.0%) | 0 (0.0%) |
| Foreign Born, Citizen | 344 (100.0%) | 0 (0.0%) |
| Foreign Born, not a Citizen | 178 (100.0%) | 0 (0.0%) |
Health Insurance Coverage by Household Income in Garberville
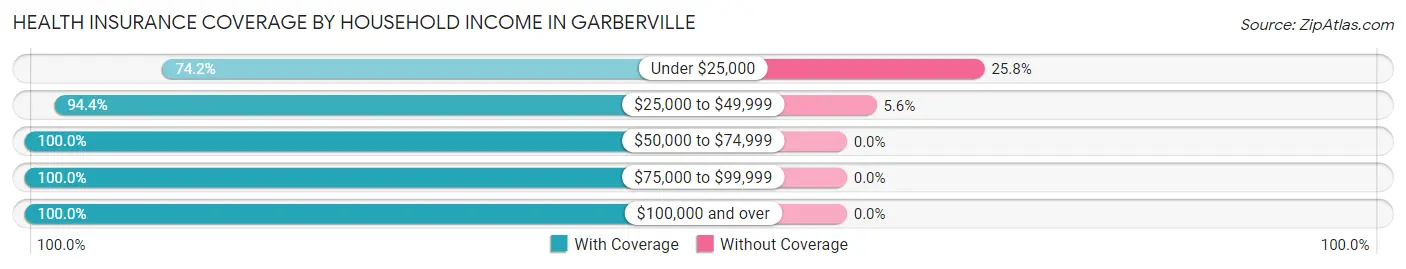
| Household Income | With Coverage | Without Coverage |
| Under $25,000 | 440 (74.2%) | 153 (25.8%) |
| $25,000 to $49,999 | 884 (94.4%) | 52 (5.6%) |
| $50,000 to $74,999 | 49 (100.0%) | 0 (0.0%) |
| $75,000 to $99,999 | 162 (100.0%) | 0 (0.0%) |
| $100,000 and over | 74 (100.0%) | 0 (0.0%) |
Public vs Private Health Insurance Coverage by Age in Garberville
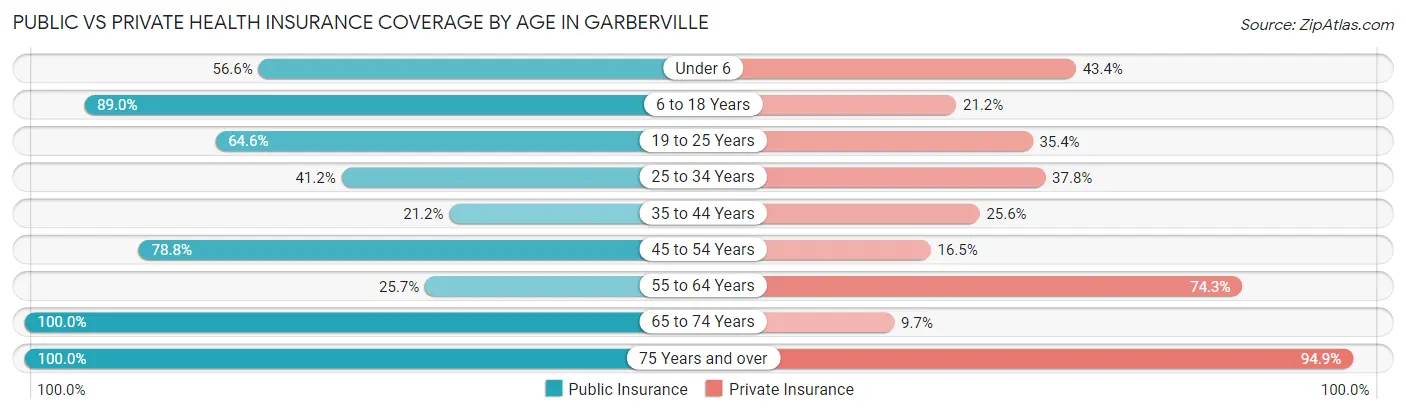
| Age Bracket | Public Insurance | Private Insurance |
| Under 6 | 86 (56.6%) | 66 (43.4%) |
| 6 to 18 Years | 306 (88.9%) | 73 (21.2%) |
| 19 to 25 Years | 115 (64.6%) | 63 (35.4%) |
| 25 to 34 Years | 84 (41.2%) | 77 (37.8%) |
| 35 to 44 Years | 58 (21.2%) | 70 (25.6%) |
| 45 to 54 Years | 268 (78.8%) | 56 (16.5%) |
| 55 to 64 Years | 29 (25.7%) | 84 (74.3%) |
| 65 to 74 Years | 72 (100.0%) | 7 (9.7%) |
| 75 Years and over | 137 (100.0%) | 130 (94.9%) |
| Total | 1,155 (63.7%) | 626 (34.5%) |
Disability Status by Sex by Age in Garberville
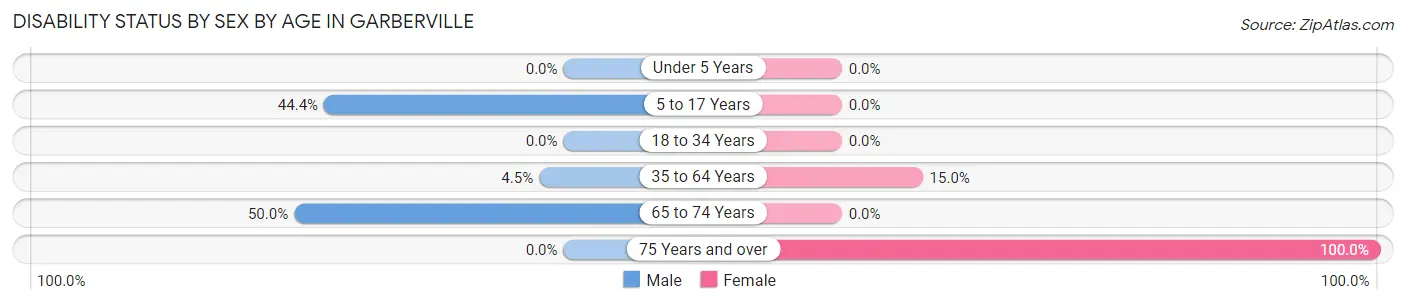
| Age Bracket | Male | Female |
| Under 5 Years | 0 (0.0%) | 0 (0.0%) |
| 5 to 17 Years | 64 (44.4%) | 0 (0.0%) |
| 18 to 34 Years | 0 (0.0%) | 0 (0.0%) |
| 35 to 64 Years | 16 (4.5%) | 56 (15.0%) |
| 65 to 74 Years | 8 (50.0%) | 0 (0.0%) |
| 75 Years and over | 0 (0.0%) | 52 (100.0%) |
Disability Class by Sex by Age in Garberville
Disability Class: Hearing Difficulty
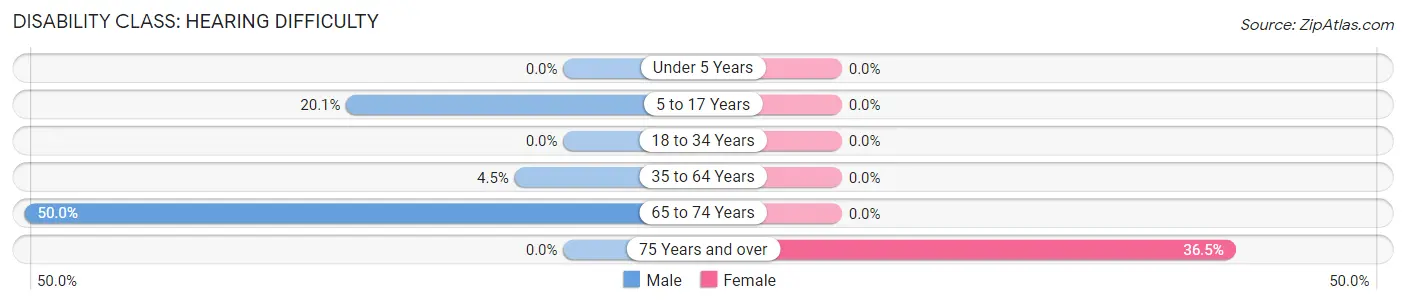
| Age Bracket | Male | Female |
| Under 5 Years | 0 (0.0%) | 0 (0.0%) |
| 5 to 17 Years | 29 (20.1%) | 0 (0.0%) |
| 18 to 34 Years | 0 (0.0%) | 0 (0.0%) |
| 35 to 64 Years | 16 (4.5%) | 0 (0.0%) |
| 65 to 74 Years | 8 (50.0%) | 0 (0.0%) |
| 75 Years and over | 0 (0.0%) | 19 (36.5%) |
Disability Class: Vision Difficulty
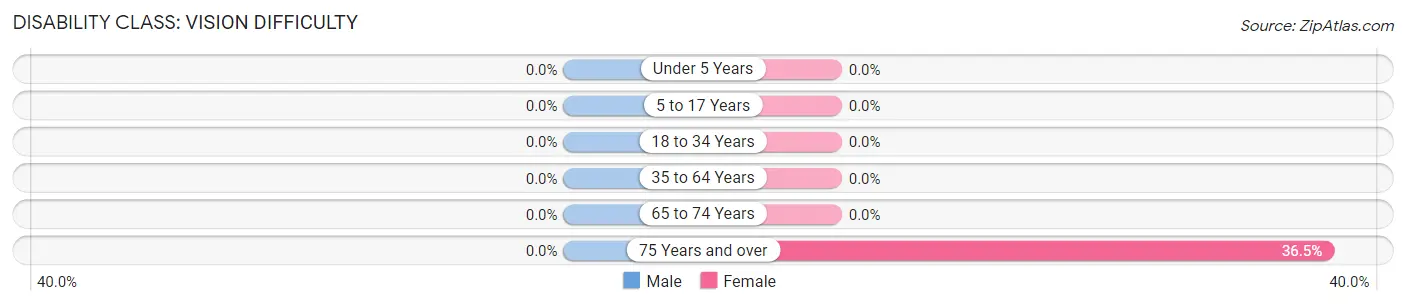
| Age Bracket | Male | Female |
| Under 5 Years | 0 (0.0%) | 0 (0.0%) |
| 5 to 17 Years | 0 (0.0%) | 0 (0.0%) |
| 18 to 34 Years | 0 (0.0%) | 0 (0.0%) |
| 35 to 64 Years | 0 (0.0%) | 0 (0.0%) |
| 65 to 74 Years | 0 (0.0%) | 0 (0.0%) |
| 75 Years and over | 0 (0.0%) | 19 (36.5%) |
Disability Class: Cognitive Difficulty
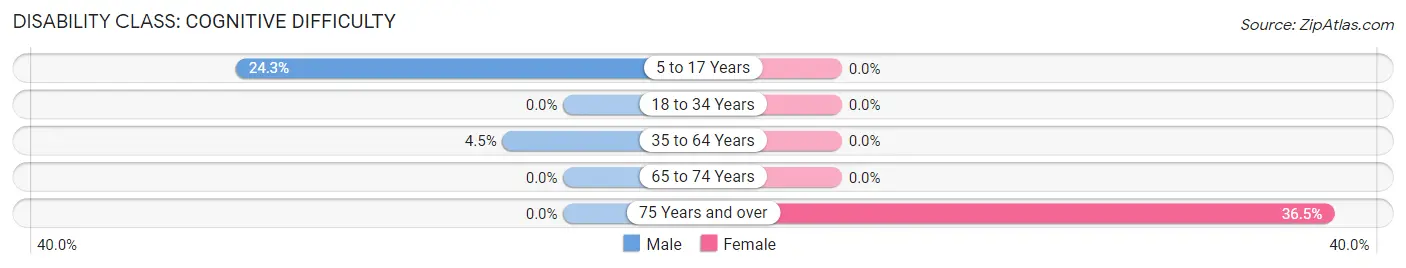
| Age Bracket | Male | Female |
| 5 to 17 Years | 35 (24.3%) | 0 (0.0%) |
| 18 to 34 Years | 0 (0.0%) | 0 (0.0%) |
| 35 to 64 Years | 16 (4.5%) | 0 (0.0%) |
| 65 to 74 Years | 0 (0.0%) | 0 (0.0%) |
| 75 Years and over | 0 (0.0%) | 19 (36.5%) |
Disability Class: Ambulatory Difficulty
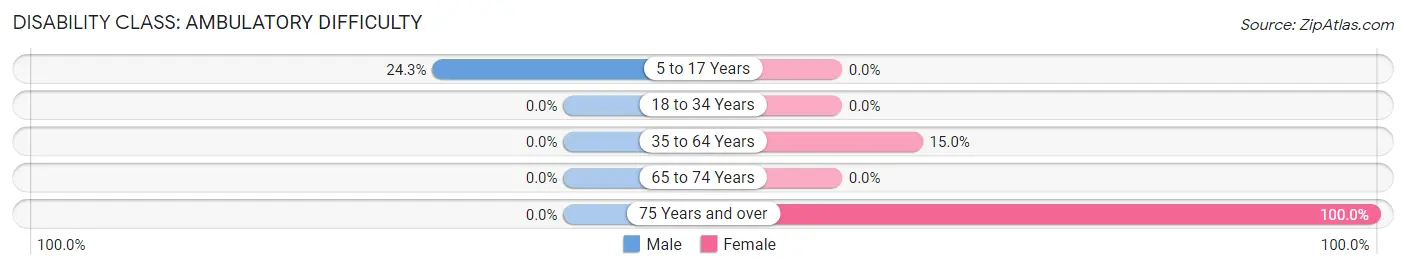
| Age Bracket | Male | Female |
| 5 to 17 Years | 35 (24.3%) | 0 (0.0%) |
| 18 to 34 Years | 0 (0.0%) | 0 (0.0%) |
| 35 to 64 Years | 0 (0.0%) | 56 (15.0%) |
| 65 to 74 Years | 0 (0.0%) | 0 (0.0%) |
| 75 Years and over | 0 (0.0%) | 52 (100.0%) |
Disability Class: Self-Care Difficulty
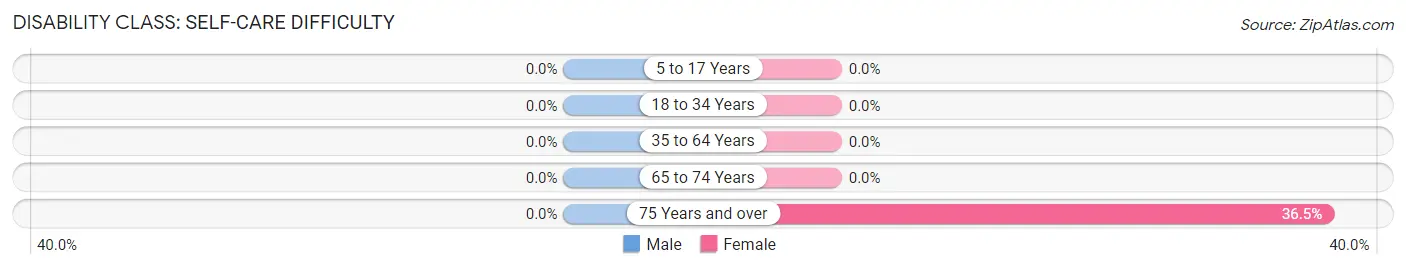
| Age Bracket | Male | Female |
| 5 to 17 Years | 0 (0.0%) | 0 (0.0%) |
| 18 to 34 Years | 0 (0.0%) | 0 (0.0%) |
| 35 to 64 Years | 0 (0.0%) | 0 (0.0%) |
| 65 to 74 Years | 0 (0.0%) | 0 (0.0%) |
| 75 Years and over | 0 (0.0%) | 19 (36.5%) |
Technology Access in Garberville
Computing Device Access in Garberville
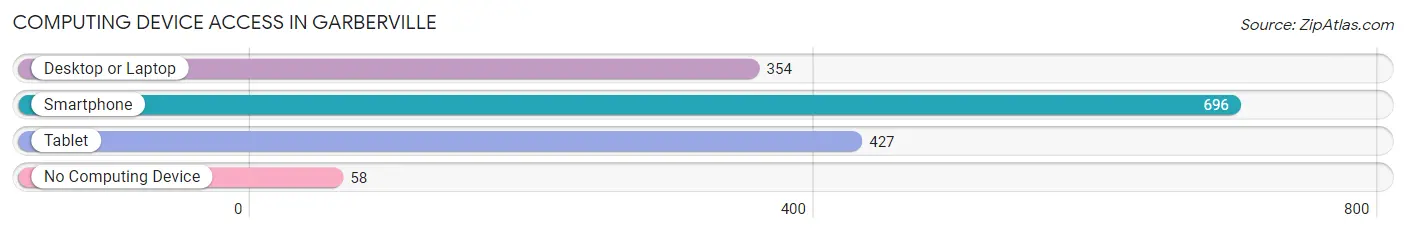
| Device Type | # Households | % Households |
| Desktop or Laptop | 354 | 43.6% |
| Smartphone | 696 | 85.7% |
| Tablet | 427 | 52.6% |
| No Computing Device | 58 | 7.1% |
| Total | 812 | 100.0% |
Internet Access in Garberville
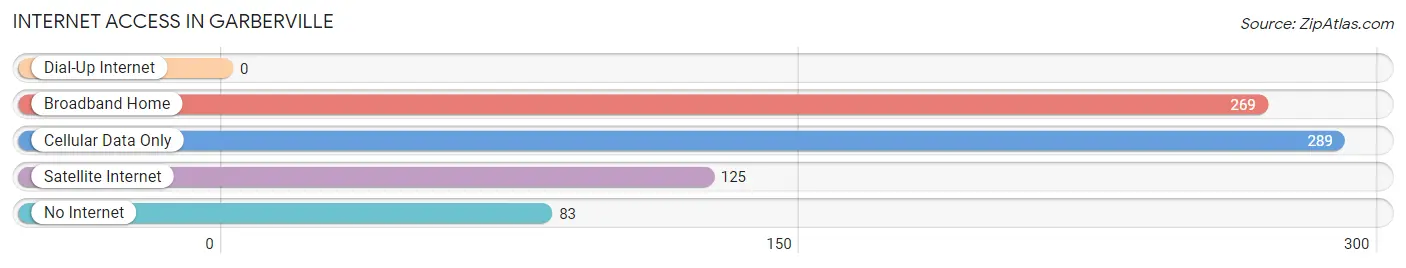
| Internet Type | # Households | % Households |
| Dial-Up Internet | 0 | 0.0% |
| Broadband Home | 269 | 33.1% |
| Cellular Data Only | 289 | 35.6% |
| Satellite Internet | 125 | 15.4% |
| No Internet | 83 | 10.2% |
| Total | 812 | 100.0% |
Garberville Summary
Garberville is a small town located in Humboldt County, California, United States. It is situated in the heart of the Redwood Empire, a region of Northern California known for its majestic redwood forests. The town is located along the Eel River, and is surrounded by the Six Rivers National Forest. The population of Garberville was 1,521 at the 2010 census.
History
Garberville was founded in 1854 by William Garber, a German immigrant who had come to California during the Gold Rush. He purchased a large tract of land in the area and began to develop it for farming and ranching. The town was originally known as Garber's Ranch, but the name was changed to Garberville in 1876.
The town grew slowly over the years, and by the early 1900s it had become a popular destination for tourists who wanted to experience the beauty of the redwood forests. The town was also home to a number of logging operations, which provided employment for many of the town's residents.
Geography
Garberville is located at 40°45'25" North, 123°50'25" West (40.756944, -123.840278). It is situated in the Eel River Valley, at an elevation of 1,067 feet (325 m). The town is surrounded by the Six Rivers National Forest, which covers an area of 1,878,000 acres (7,600 km2).
The climate in Garberville is mild and temperate, with warm summers and cool winters. The average annual temperature is 54°F (12°C), and the average annual precipitation is 55 inches (1,400 mm).
Economy
The economy of Garberville is largely based on tourism and logging. The town is a popular destination for visitors who want to experience the beauty of the redwood forests, and there are a number of hotels, restaurants, and other businesses catering to tourists. Logging is also an important part of the local economy, and there are several lumber mills in the area.
Demographics
As of the 2010 census, the population of Garberville was 1,521. The racial makeup of the town was 87.3% White, 0.7% African American, 2.2% Native American, 0.7% Asian, 0.1% Pacific Islander, 5.2% from other races, and 3.8% from two or more races. Hispanic or Latino of any race were 11.2% of the population.
The median income for a household in Garberville was $35,938, and the median income for a family was $41,250. The per capita income for the town was $17,945. About 17.2% of families and 20.7% of the population were below the poverty line, including 28.3% of those under age 18 and 8.3% of those age 65 or over.
Common Questions
What is Per Capita Income in Garberville?
Per Capita income in Garberville is $15,395.
What is the Median Family Income in Garberville?
Median Family Income in Garberville is $35,714.
What is the Median Household income in Garberville?
Median Household Income in Garberville is $34,167.
What is Income or Wage Gap in Garberville?
Income or Wage Gap in Garberville is 39.9%.
Women in Garberville earn 60.1 cents for every dollar earned by a man.
What is Inequality or Gini Index in Garberville?
Inequality or Gini Index in Garberville is 0.41.
What is the Total Population of Garberville?
Total Population of Garberville is 1,815.
What is the Total Male Population of Garberville?
Total Male Population of Garberville is 869.
What is the Total Female Population of Garberville?
Total Female Population of Garberville is 946.
What is the Ratio of Males per 100 Females in Garberville?
There are 91.86 Males per 100 Females in Garberville.
What is the Ratio of Females per 100 Males in Garberville?
There are 108.86 Females per 100 Males in Garberville.
What is the Median Population Age in Garberville?
Median Population Age in Garberville is 35.7 Years.
What is the Average Family Size in Garberville
Average Family Size in Garberville is 3.1 People.
What is the Average Household Size in Garberville
Average Household Size in Garberville is 2.2 People.
How Large is the Labor Force in Garberville?
There are 829 People in the Labor Forcein in Garberville.
What is the Percentage of People in the Labor Force in Garberville?
59.7% of People are in the Labor Force in Garberville.
What is the Unemployment Rate in Garberville?
Unemployment Rate in Garberville is 1.8%.