Cathedral City, CA Map & Demographics
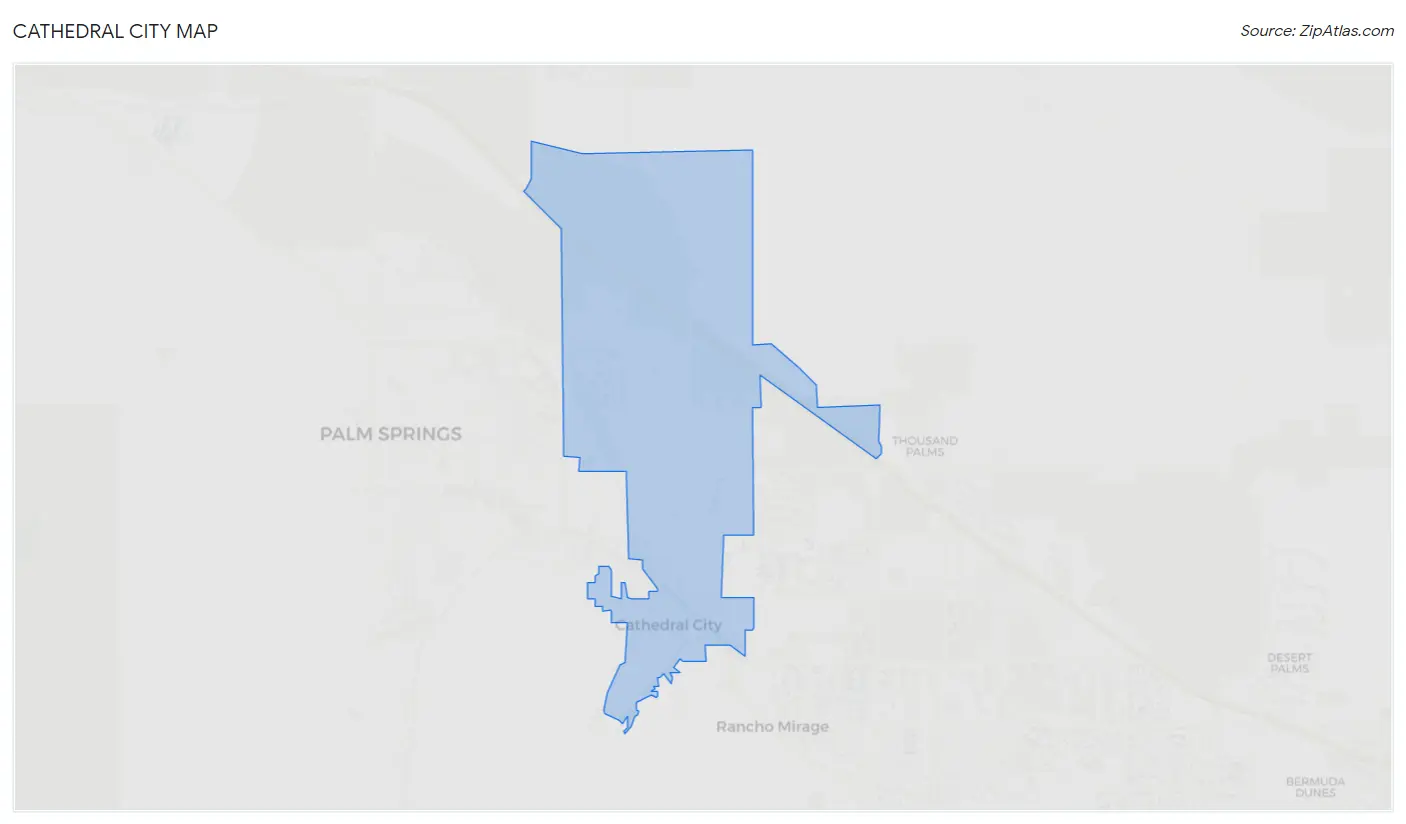
Cathedral City Map
Cathedral City Overview
$34,807
PER CAPITA INCOME
$79,866
AVG FAMILY INCOME
$63,209
AVG HOUSEHOLD INCOME
13.7%
WAGE / INCOME GAP [ % ]
86.3¢/ $1
WAGE / INCOME GAP [ $ ]
$9,745
FAMILY INCOME DEFICIT
0.50
INEQUALITY / GINI INDEX
51,964
TOTAL POPULATION
26,823
MALE POPULATION
25,141
FEMALE POPULATION
106.69
MALES / 100 FEMALES
93.73
FEMALES / 100 MALES
40.5
MEDIAN AGE
3.5
AVG FAMILY SIZE
2.7
AVG HOUSEHOLD SIZE
25,437
LABOR FORCE [ PEOPLE ]
59.3%
PERCENT IN LABOR FORCE
6.2%
UNEMPLOYMENT RATE
Cathedral City Zip Codes
Cathedral City Area Codes
Income in Cathedral City
Income Overview in Cathedral City
Per Capita Income in Cathedral City is $34,807, while median incomes of families and households are $79,866 and $63,209 respectively.
| Characteristic | Number | Measure |
| Per Capita Income | 51,964 | $34,807 |
| Median Family Income | 11,797 | $79,866 |
| Mean Family Income | 11,797 | $108,770 |
| Median Household Income | 18,868 | $63,209 |
| Mean Household Income | 18,868 | $91,605 |
| Income Deficit | 11,797 | $9,745 |
| Wage / Income Gap (%) | 51,964 | 13.72% |
| Wage / Income Gap ($) | 51,964 | 86.28¢ per $1 |
| Gini / Inequality Index | 51,964 | 0.50 |
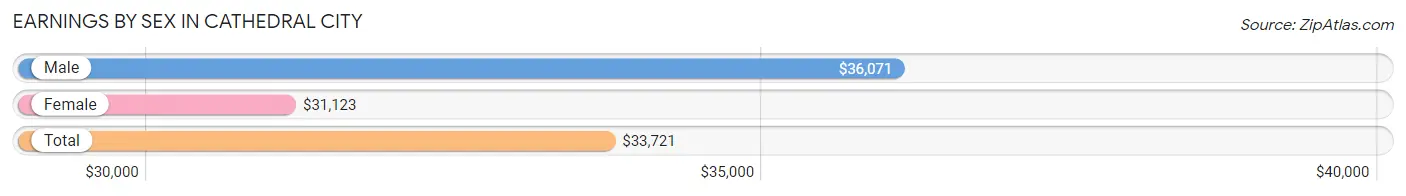
Earnings by Sex in Cathedral City
Average Earnings in Cathedral City are $33,721, $36,071 for men and $31,123 for women, a difference of 13.7%.
| Sex | Number | Average Earnings |
| Male | 14,602 (56.3%) | $36,071 |
| Female | 11,346 (43.7%) | $31,123 |
| Total | 25,948 (100.0%) | $33,721 |
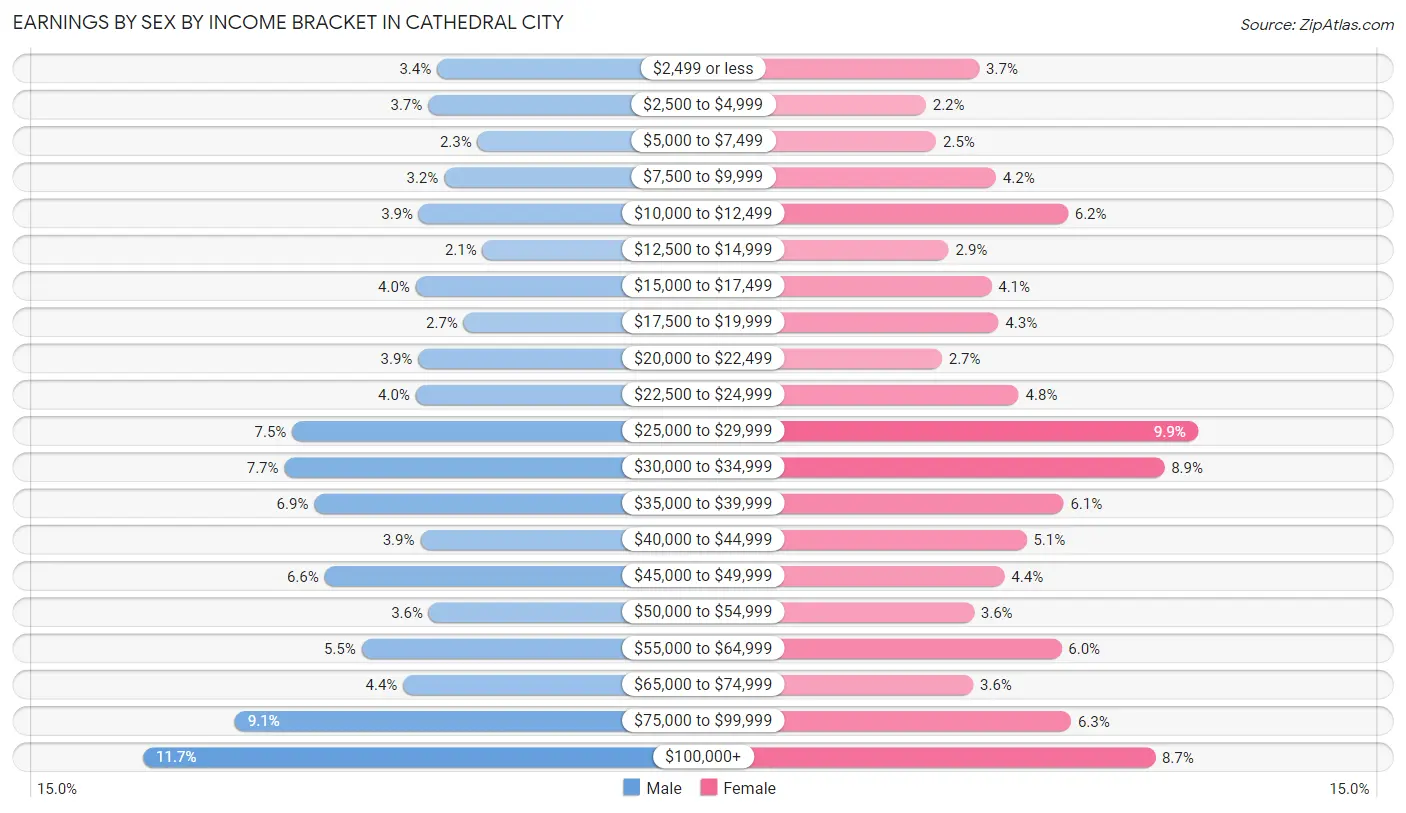
Earnings by Sex by Income Bracket in Cathedral City
The most common earnings brackets in Cathedral City are $100,000+ for men (1,704 | 11.7%) and $25,000 to $29,999 for women (1,119 | 9.9%).
| Income | Male | Female |
| $2,499 or less | 498 (3.4%) | 422 (3.7%) |
| $2,500 to $4,999 | 535 (3.7%) | 252 (2.2%) |
| $5,000 to $7,499 | 331 (2.3%) | 285 (2.5%) |
| $7,500 to $9,999 | 468 (3.2%) | 475 (4.2%) |
| $10,000 to $12,499 | 572 (3.9%) | 705 (6.2%) |
| $12,500 to $14,999 | 311 (2.1%) | 324 (2.9%) |
| $15,000 to $17,499 | 586 (4.0%) | 461 (4.1%) |
| $17,500 to $19,999 | 389 (2.7%) | 483 (4.3%) |
| $20,000 to $22,499 | 575 (3.9%) | 303 (2.7%) |
| $22,500 to $24,999 | 585 (4.0%) | 548 (4.8%) |
| $25,000 to $29,999 | 1,092 (7.5%) | 1,119 (9.9%) |
| $30,000 to $34,999 | 1,125 (7.7%) | 1,012 (8.9%) |
| $35,000 to $39,999 | 1,002 (6.9%) | 691 (6.1%) |
| $40,000 to $44,999 | 566 (3.9%) | 573 (5.1%) |
| $45,000 to $49,999 | 960 (6.6%) | 503 (4.4%) |
| $50,000 to $54,999 | 532 (3.6%) | 405 (3.6%) |
| $55,000 to $64,999 | 807 (5.5%) | 684 (6.0%) |
| $65,000 to $74,999 | 637 (4.4%) | 403 (3.5%) |
| $75,000 to $99,999 | 1,327 (9.1%) | 715 (6.3%) |
| $100,000+ | 1,704 (11.7%) | 983 (8.7%) |
| Total | 14,602 (100.0%) | 11,346 (100.0%) |
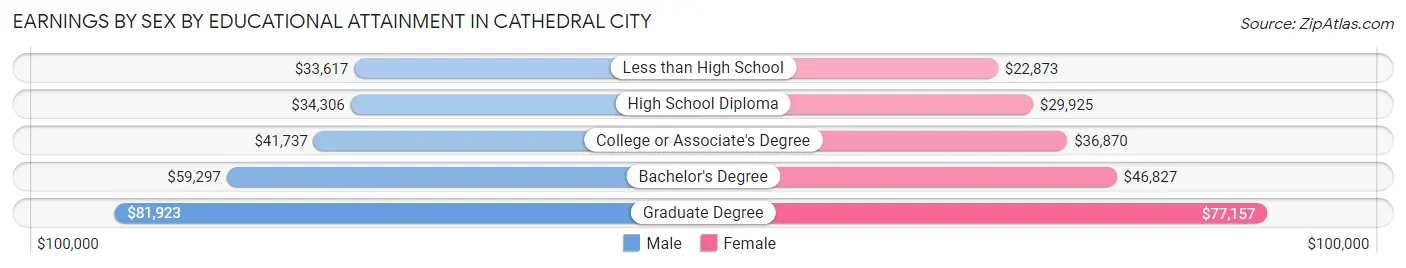
Earnings by Sex by Educational Attainment in Cathedral City
Average earnings in Cathedral City are $39,265 for men and $33,995 for women, a difference of 13.4%. Men with an educational attainment of graduate degree enjoy the highest average annual earnings of $81,923, while those with less than high school education earn the least with $33,617. Women with an educational attainment of graduate degree earn the most with the average annual earnings of $77,157, while those with less than high school education have the smallest earnings of $22,873.
| Educational Attainment | Male Income | Female Income |
| Less than High School | $33,617 | $22,873 |
| High School Diploma | $34,306 | $29,925 |
| College or Associate's Degree | $41,737 | $36,870 |
| Bachelor's Degree | $59,297 | $46,827 |
| Graduate Degree | $81,923 | $77,157 |
| Total | $39,265 | $33,995 |
Family Income in Cathedral City
Family Income Brackets in Cathedral City
According to the Cathedral City family income data, there are 2,265 families falling into the $100,000 to $149,999 income range, which is the most common income bracket and makes up 19.2% of all families. Conversely, the $10,000 to $14,999 income bracket is the least frequent group with only 94 families (0.8%) belonging to this category.
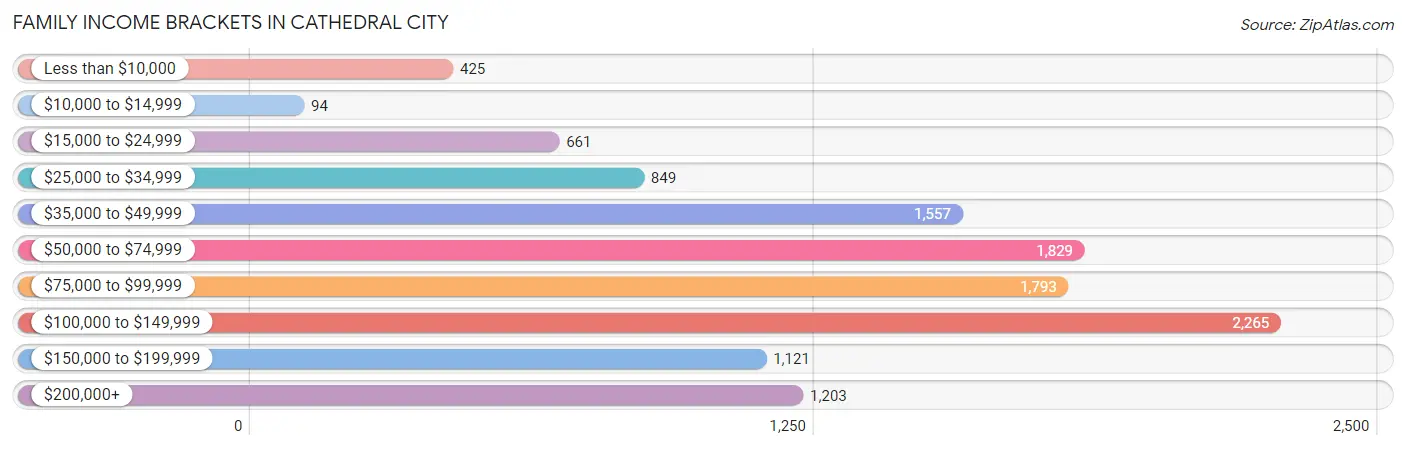
| Income Bracket | # Families | % Families |
| Less than $10,000 | 425 | 3.6% |
| $10,000 to $14,999 | 94 | 0.8% |
| $15,000 to $24,999 | 661 | 5.6% |
| $25,000 to $34,999 | 849 | 7.2% |
| $35,000 to $49,999 | 1,557 | 13.2% |
| $50,000 to $74,999 | 1,829 | 15.5% |
| $75,000 to $99,999 | 1,793 | 15.2% |
| $100,000 to $149,999 | 2,265 | 19.2% |
| $150,000 to $199,999 | 1,121 | 9.5% |
| $200,000+ | 1,203 | 10.2% |
Family Income by Famaliy Size in Cathedral City
7+ person families (456 | 3.9%) account for the highest median family income in Cathedral City with $107,721 per family, while 2-person families (5,220 | 44.3%) have the highest median income of $40,233 per family member.
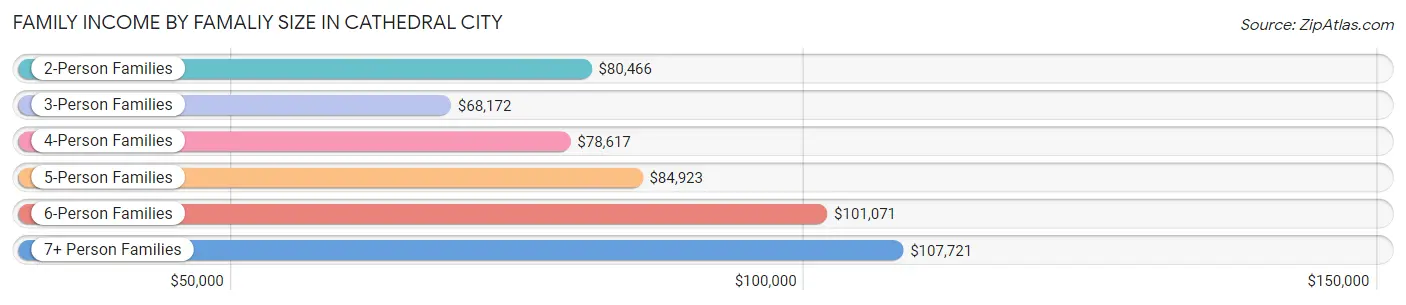
| Income Bracket | # Families | Median Income |
| 2-Person Families | 5,220 (44.3%) | $80,466 |
| 3-Person Families | 2,298 (19.5%) | $68,172 |
| 4-Person Families | 1,969 (16.7%) | $78,617 |
| 5-Person Families | 1,330 (11.3%) | $84,923 |
| 6-Person Families | 524 (4.4%) | $101,071 |
| 7+ Person Families | 456 (3.9%) | $107,721 |
| Total | 11,797 (100.0%) | $79,866 |
Family Income by Number of Earners in Cathedral City
The median family income in Cathedral City is $79,866, with families comprising 3+ earners (2,118) having the highest median family income of $106,184, while families with no earners (1,638) have the lowest median family income of $45,556, accounting for 17.9% and 13.9% of families, respectively.
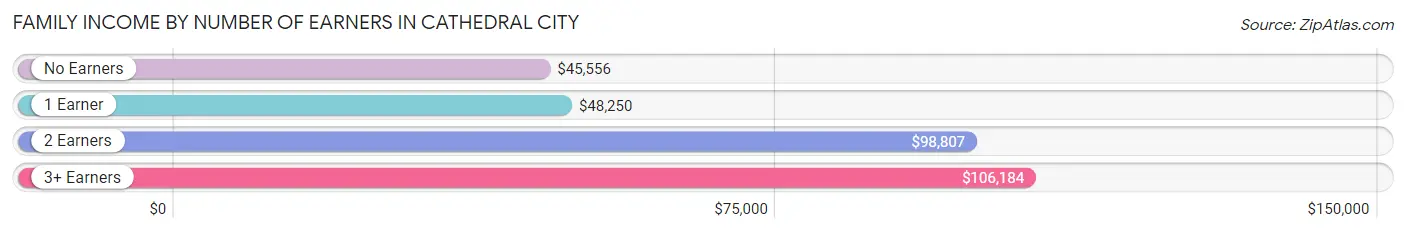
| Number of Earners | # Families | Median Income |
| No Earners | 1,638 (13.9%) | $45,556 |
| 1 Earner | 3,434 (29.1%) | $48,250 |
| 2 Earners | 4,607 (39.1%) | $98,807 |
| 3+ Earners | 2,118 (17.9%) | $106,184 |
| Total | 11,797 (100.0%) | $79,866 |
Household Income in Cathedral City
Household Income Brackets in Cathedral City
With 2,943 households falling in the category, the $100,000 to $149,999 income range is the most frequent in Cathedral City, accounting for 15.6% of all households. In contrast, only 830 households (4.4%) fall into the $10,000 to $14,999 income bracket, making it the least populous group.
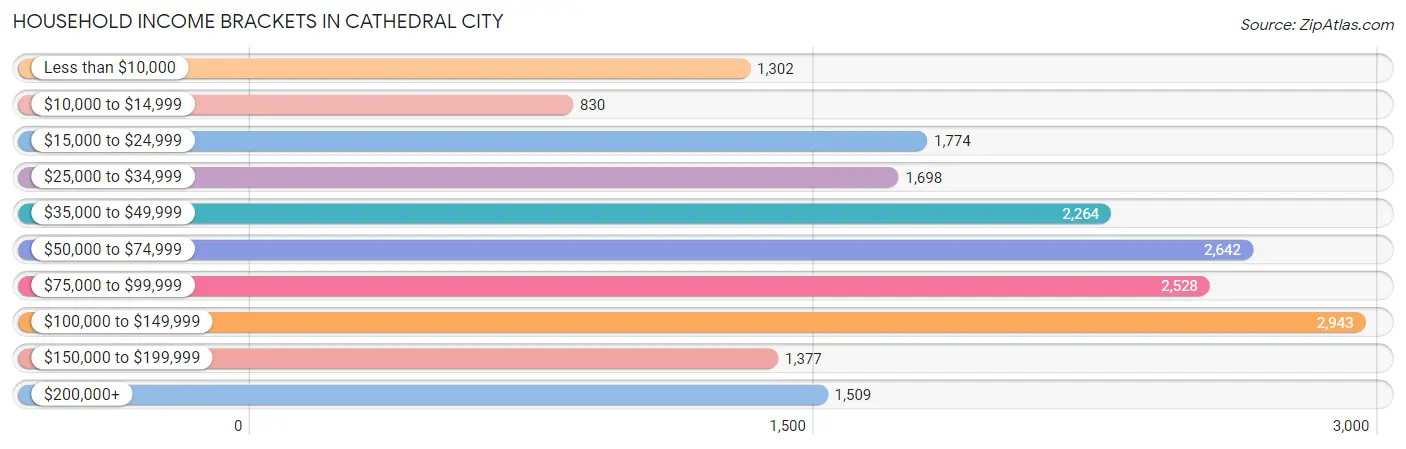
| Income Bracket | # Households | % Households |
| Less than $10,000 | 1,302 | 6.9% |
| $10,000 to $14,999 | 830 | 4.4% |
| $15,000 to $24,999 | 1,774 | 9.4% |
| $25,000 to $34,999 | 1,698 | 9.0% |
| $35,000 to $49,999 | 2,264 | 12.0% |
| $50,000 to $74,999 | 2,642 | 14.0% |
| $75,000 to $99,999 | 2,528 | 13.4% |
| $100,000 to $149,999 | 2,943 | 15.6% |
| $150,000 to $199,999 | 1,377 | 7.3% |
| $200,000+ | 1,509 | 8.0% |
Household Income by Householder Age in Cathedral City
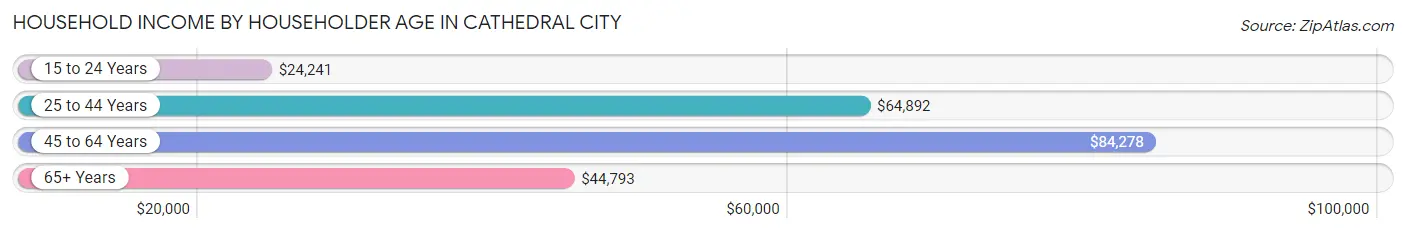
The median household income in Cathedral City is $63,209, with the highest median household income of $84,278 found in the 45 to 64 years age bracket for the primary householder. A total of 7,738 households (41.0%) fall into this category. Meanwhile, the 15 to 24 years age bracket for the primary householder has the lowest median household income of $24,241, with 303 households (1.6%) in this group.
| Income Bracket | # Households | Median Income |
| 15 to 24 Years | 303 (1.6%) | $24,241 |
| 25 to 44 Years | 4,867 (25.8%) | $64,892 |
| 45 to 64 Years | 7,738 (41.0%) | $84,278 |
| 65+ Years | 5,960 (31.6%) | $44,793 |
| Total | 18,868 (100.0%) | $63,209 |
Poverty in Cathedral City
Income Below Poverty by Sex and Age in Cathedral City
With 15.2% poverty level for males and 19.6% for females among the residents of Cathedral City, 5 year old males and 12 to 14 year old females are the most vulnerable to poverty, with 91 males (41.2%) and 371 females (39.7%) in their respective age groups living below the poverty level.
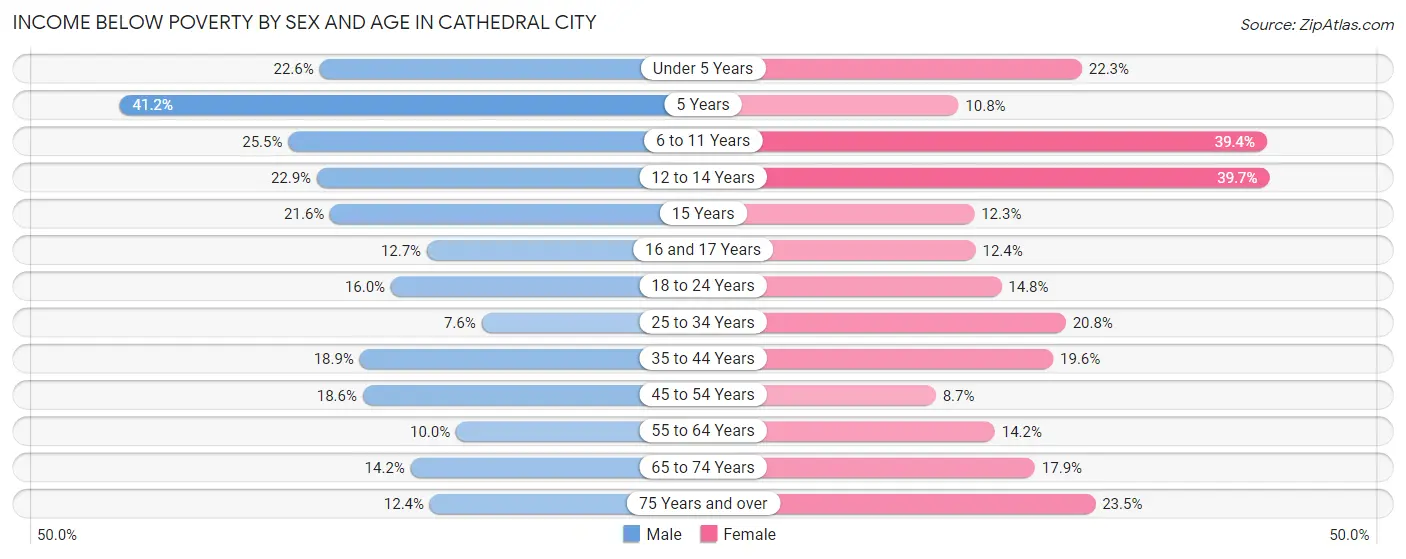
| Age Bracket | Male | Female |
| Under 5 Years | 251 (22.6%) | 327 (22.3%) |
| 5 Years | 91 (41.2%) | 29 (10.8%) |
| 6 to 11 Years | 360 (25.5%) | 790 (39.4%) |
| 12 to 14 Years | 233 (22.9%) | 371 (39.7%) |
| 15 Years | 74 (21.6%) | 36 (12.3%) |
| 16 and 17 Years | 106 (12.7%) | 72 (12.4%) |
| 18 to 24 Years | 372 (16.0%) | 364 (14.8%) |
| 25 to 34 Years | 283 (7.6%) | 599 (20.8%) |
| 35 to 44 Years | 611 (18.9%) | 658 (19.6%) |
| 45 to 54 Years | 578 (18.6%) | 282 (8.7%) |
| 55 to 64 Years | 466 (10.0%) | 445 (14.2%) |
| 65 to 74 Years | 411 (14.2%) | 395 (17.9%) |
| 75 Years and over | 232 (12.4%) | 542 (23.5%) |
| Total | 4,068 (15.2%) | 4,910 (19.6%) |
Income Above Poverty by Sex and Age in Cathedral City
According to the poverty statistics in Cathedral City, males aged 25 to 34 years and females aged 45 to 54 years are the age groups that are most secure financially, with 92.4% of males and 91.3% of females in these age groups living above the poverty line.
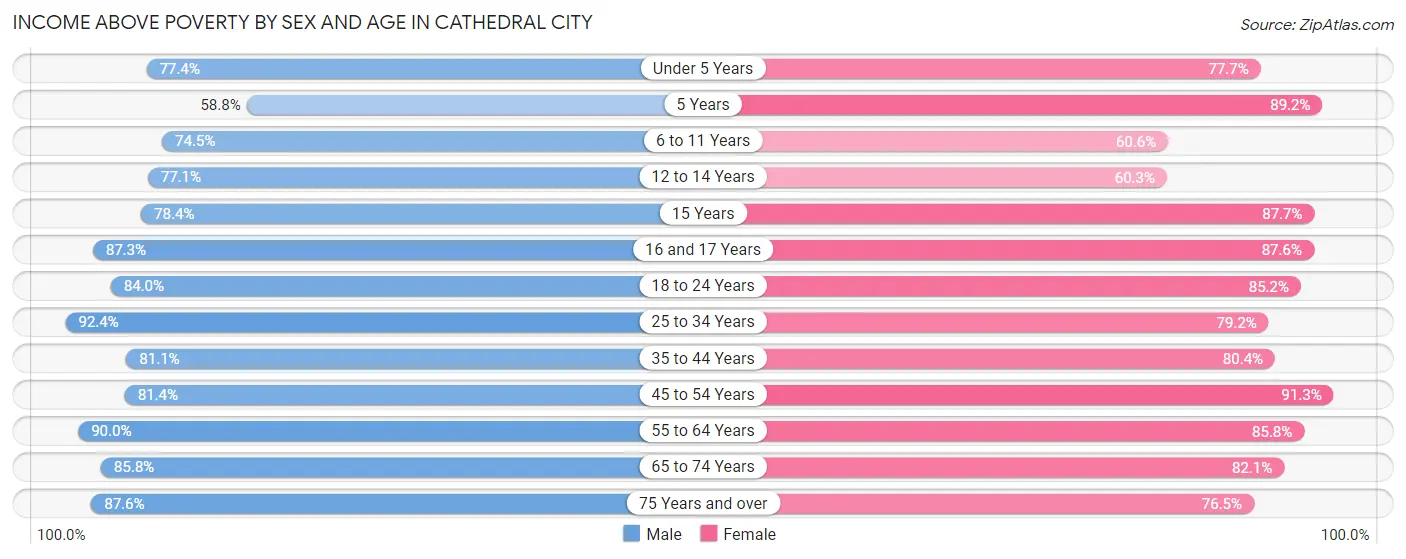
| Age Bracket | Male | Female |
| Under 5 Years | 858 (77.4%) | 1,141 (77.7%) |
| 5 Years | 130 (58.8%) | 239 (89.2%) |
| 6 to 11 Years | 1,050 (74.5%) | 1,213 (60.6%) |
| 12 to 14 Years | 786 (77.1%) | 564 (60.3%) |
| 15 Years | 268 (78.4%) | 257 (87.7%) |
| 16 and 17 Years | 731 (87.3%) | 508 (87.6%) |
| 18 to 24 Years | 1,953 (84.0%) | 2,093 (85.2%) |
| 25 to 34 Years | 3,445 (92.4%) | 2,283 (79.2%) |
| 35 to 44 Years | 2,622 (81.1%) | 2,697 (80.4%) |
| 45 to 54 Years | 2,528 (81.4%) | 2,953 (91.3%) |
| 55 to 64 Years | 4,214 (90.0%) | 2,688 (85.8%) |
| 65 to 74 Years | 2,490 (85.8%) | 1,809 (82.1%) |
| 75 Years and over | 1,640 (87.6%) | 1,762 (76.5%) |
| Total | 22,715 (84.8%) | 20,207 (80.4%) |
Income Below Poverty Among Married-Couple Families in Cathedral City
The poverty statistics for married-couple families in Cathedral City show that 9.2% or 787 of the total 8,532 families live below the poverty line. Families with 5 or more children have the highest poverty rate of 46.4%, comprising of 32 families. On the other hand, families with no children have the lowest poverty rate of 4.2%, which includes 231 families.
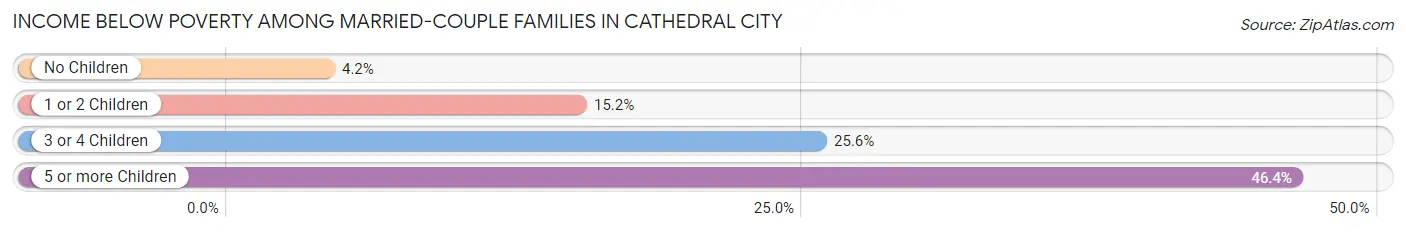
| Children | Above Poverty | Below Poverty |
| No Children | 5,241 (95.8%) | 231 (4.2%) |
| 1 or 2 Children | 1,971 (84.8%) | 353 (15.2%) |
| 3 or 4 Children | 496 (74.4%) | 171 (25.6%) |
| 5 or more Children | 37 (53.6%) | 32 (46.4%) |
| Total | 7,745 (90.8%) | 787 (9.2%) |
Income Below Poverty Among Single-Parent Households in Cathedral City
According to the poverty data in Cathedral City, 20.3% or 191 single-father households and 15.7% or 364 single-mother households are living below the poverty line. Among single-father households, those with 1 or 2 children have the highest poverty rate, with 109 households (31.8%) experiencing poverty. Likewise, among single-mother households, those with 3 or 4 children have the highest poverty rate, with 73 households (52.5%) falling below the poverty line.
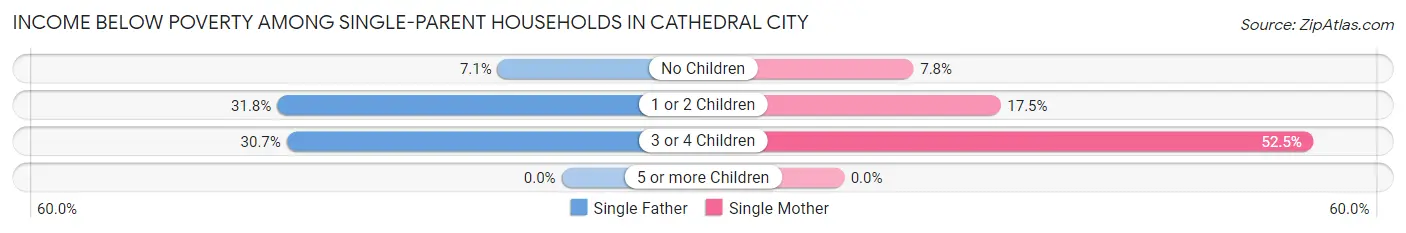
| Children | Single Father | Single Mother |
| No Children | 31 (7.1%) | 73 (7.8%) |
| 1 or 2 Children | 109 (31.8%) | 218 (17.5%) |
| 3 or 4 Children | 51 (30.7%) | 73 (52.5%) |
| 5 or more Children | 0 (0.0%) | 0 (0.0%) |
| Total | 191 (20.3%) | 364 (15.7%) |
Income Below Poverty Among Married-Couple vs Single-Parent Households in Cathedral City
The poverty data for Cathedral City shows that 787 of the married-couple family households (9.2%) and 555 of the single-parent households (17.0%) are living below the poverty level. Within the married-couple family households, those with 5 or more children have the highest poverty rate, with 32 households (46.4%) falling below the poverty line. Among the single-parent households, those with 3 or 4 children have the highest poverty rate, with 124 household (40.7%) living below poverty.
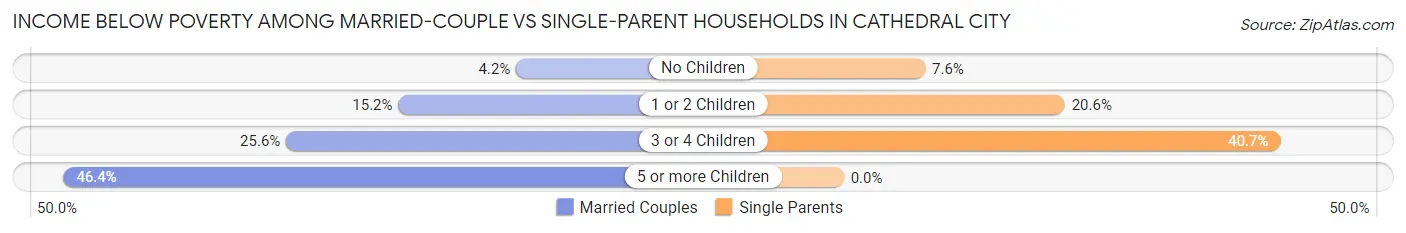
| Children | Married-Couple Families | Single-Parent Households |
| No Children | 231 (4.2%) | 104 (7.6%) |
| 1 or 2 Children | 353 (15.2%) | 327 (20.6%) |
| 3 or 4 Children | 171 (25.6%) | 124 (40.7%) |
| 5 or more Children | 32 (46.4%) | 0 (0.0%) |
| Total | 787 (9.2%) | 555 (17.0%) |
Race in Cathedral City
The most populous races in Cathedral City are Hispanic or Latino (30,625 | 58.9%), White / Caucasian (25,710 | 49.5%), and Two or more Races (10,460 | 20.1%).
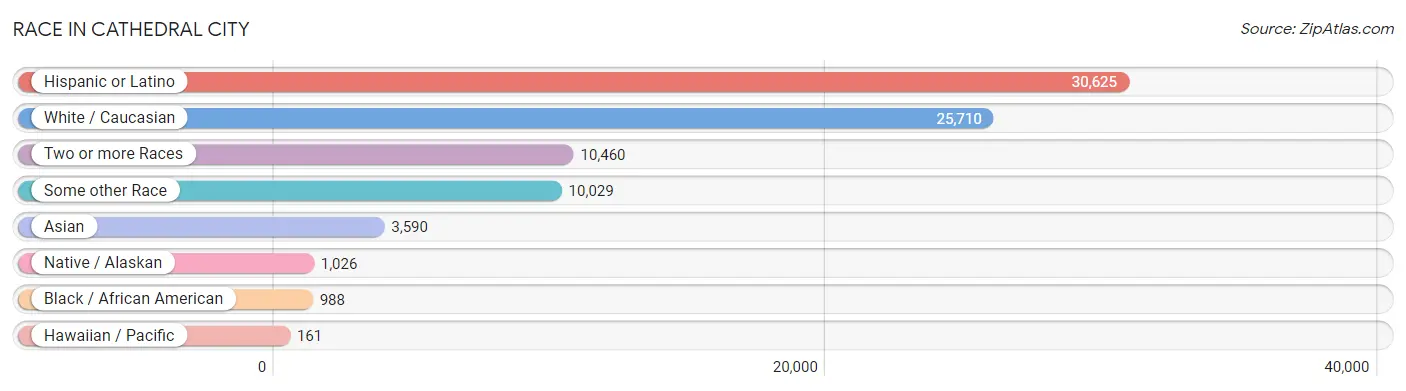
| Race | # Population | % Population |
| Asian | 3,590 | 6.9% |
| Black / African American | 988 | 1.9% |
| Hawaiian / Pacific | 161 | 0.3% |
| Hispanic or Latino | 30,625 | 58.9% |
| Native / Alaskan | 1,026 | 2.0% |
| White / Caucasian | 25,710 | 49.5% |
| Two or more Races | 10,460 | 20.1% |
| Some other Race | 10,029 | 19.3% |
| Total | 51,964 | 100.0% |
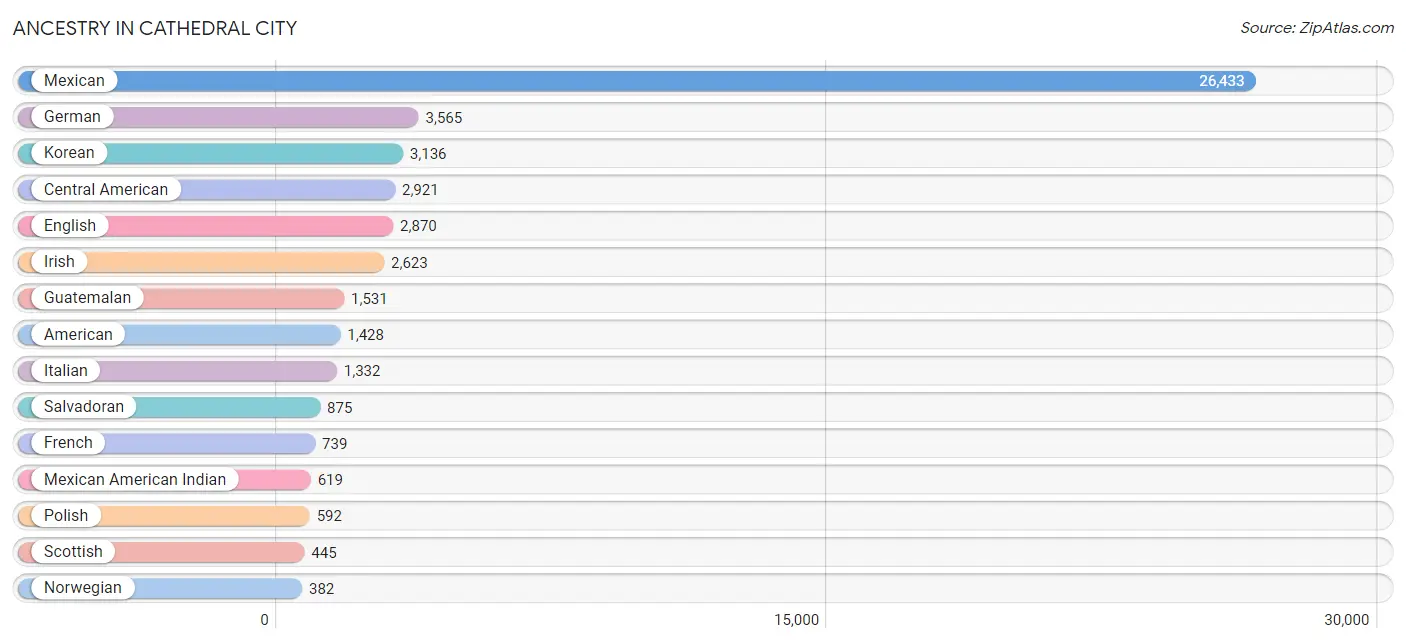
Ancestry in Cathedral City
The most populous ancestries reported in Cathedral City are Mexican (26,433 | 50.9%), German (3,565 | 6.9%), Korean (3,136 | 6.0%), Central American (2,921 | 5.6%), and English (2,870 | 5.5%), together accounting for 74.9% of all Cathedral City residents.
| Ancestry | # Population | % Population |
| African | 158 | 0.3% |
| American | 1,428 | 2.8% |
| Apache | 113 | 0.2% |
| Arab | 127 | 0.2% |
| Argentinean | 14 | 0.0% |
| Armenian | 30 | 0.1% |
| Australian | 10 | 0.0% |
| Austrian | 24 | 0.1% |
| Bangladeshi | 3 | 0.0% |
| Basque | 22 | 0.0% |
| Belgian | 18 | 0.0% |
| Belizean | 65 | 0.1% |
| Bhutanese | 166 | 0.3% |
| Bolivian | 13 | 0.0% |
| Brazilian | 5 | 0.0% |
| British | 214 | 0.4% |
| Bulgarian | 4 | 0.0% |
| Burmese | 106 | 0.2% |
| Canadian | 198 | 0.4% |
| Cape Verdean | 2 | 0.0% |
| Central American | 2,921 | 5.6% |
| Central American Indian | 184 | 0.4% |
| Cherokee | 50 | 0.1% |
| Chilean | 10 | 0.0% |
| Chippewa | 38 | 0.1% |
| Choctaw | 2 | 0.0% |
| Colombian | 125 | 0.2% |
| Comanche | 14 | 0.0% |
| Costa Rican | 15 | 0.0% |
| Creek | 35 | 0.1% |
| Croatian | 31 | 0.1% |
| Cuban | 67 | 0.1% |
| Czech | 82 | 0.2% |
| Czechoslovakian | 19 | 0.0% |
| Danish | 88 | 0.2% |
| Dominican | 15 | 0.0% |
| Dutch | 220 | 0.4% |
| Eastern European | 168 | 0.3% |
| Ecuadorian | 16 | 0.0% |
| Egyptian | 35 | 0.1% |
| English | 2,870 | 5.5% |
| European | 374 | 0.7% |
| Finnish | 19 | 0.0% |
| French | 739 | 1.4% |
| French American Indian | 2 | 0.0% |
| French Canadian | 125 | 0.2% |
| German | 3,565 | 6.9% |
| Greek | 187 | 0.4% |
| Guamanian / Chamorro | 55 | 0.1% |
| Guatemalan | 1,531 | 2.9% |
| Haitian | 8 | 0.0% |
| Honduran | 296 | 0.6% |
| Houma | 4 | 0.0% |
| Hungarian | 115 | 0.2% |
| Icelander | 15 | 0.0% |
| Indian (Asian) | 274 | 0.5% |
| Iranian | 56 | 0.1% |
| Iraqi | 10 | 0.0% |
| Irish | 2,623 | 5.1% |
| Iroquois | 9 | 0.0% |
| Israeli | 3 | 0.0% |
| Italian | 1,332 | 2.6% |
| Jamaican | 85 | 0.2% |
| Japanese | 2 | 0.0% |
| Korean | 3,136 | 6.0% |
| Laotian | 14 | 0.0% |
| Latvian | 6 | 0.0% |
| Lebanese | 46 | 0.1% |
| Lithuanian | 15 | 0.0% |
| Malaysian | 116 | 0.2% |
| Mexican | 26,433 | 50.9% |
| Mexican American Indian | 619 | 1.2% |
| Native Hawaiian | 93 | 0.2% |
| Navajo | 2 | 0.0% |
| Nicaraguan | 204 | 0.4% |
| Nigerian | 18 | 0.0% |
| Northern European | 71 | 0.1% |
| Norwegian | 382 | 0.7% |
| Pakistani | 3 | 0.0% |
| Paraguayan | 6 | 0.0% |
| Pennsylvania German | 9 | 0.0% |
| Peruvian | 100 | 0.2% |
| Polish | 592 | 1.1% |
| Portuguese | 149 | 0.3% |
| Potawatomi | 29 | 0.1% |
| Pueblo | 1 | 0.0% |
| Puerto Rican | 248 | 0.5% |
| Romanian | 145 | 0.3% |
| Russian | 313 | 0.6% |
| Salvadoran | 875 | 1.7% |
| Samoan | 24 | 0.1% |
| Scandinavian | 101 | 0.2% |
| Scotch-Irish | 284 | 0.5% |
| Scottish | 445 | 0.9% |
| Serbian | 36 | 0.1% |
| Shoshone | 1 | 0.0% |
| Sioux | 39 | 0.1% |
| Slavic | 21 | 0.0% |
| Slovak | 17 | 0.0% |
| Slovene | 22 | 0.0% |
| South African | 29 | 0.1% |
| South American | 296 | 0.6% |
| South American Indian | 24 | 0.1% |
| Spaniard | 246 | 0.5% |
| Spanish | 115 | 0.2% |
| Sri Lankan | 275 | 0.5% |
| Subsaharan African | 218 | 0.4% |
| Swedish | 225 | 0.4% |
| Swiss | 152 | 0.3% |
| Syrian | 26 | 0.1% |
| Thai | 108 | 0.2% |
| Ukrainian | 63 | 0.1% |
| Venezuelan | 12 | 0.0% |
| Welsh | 147 | 0.3% |
| West Indian | 6 | 0.0% |
| Yugoslavian | 30 | 0.1% | View All 116 Rows |
Immigrants in Cathedral City
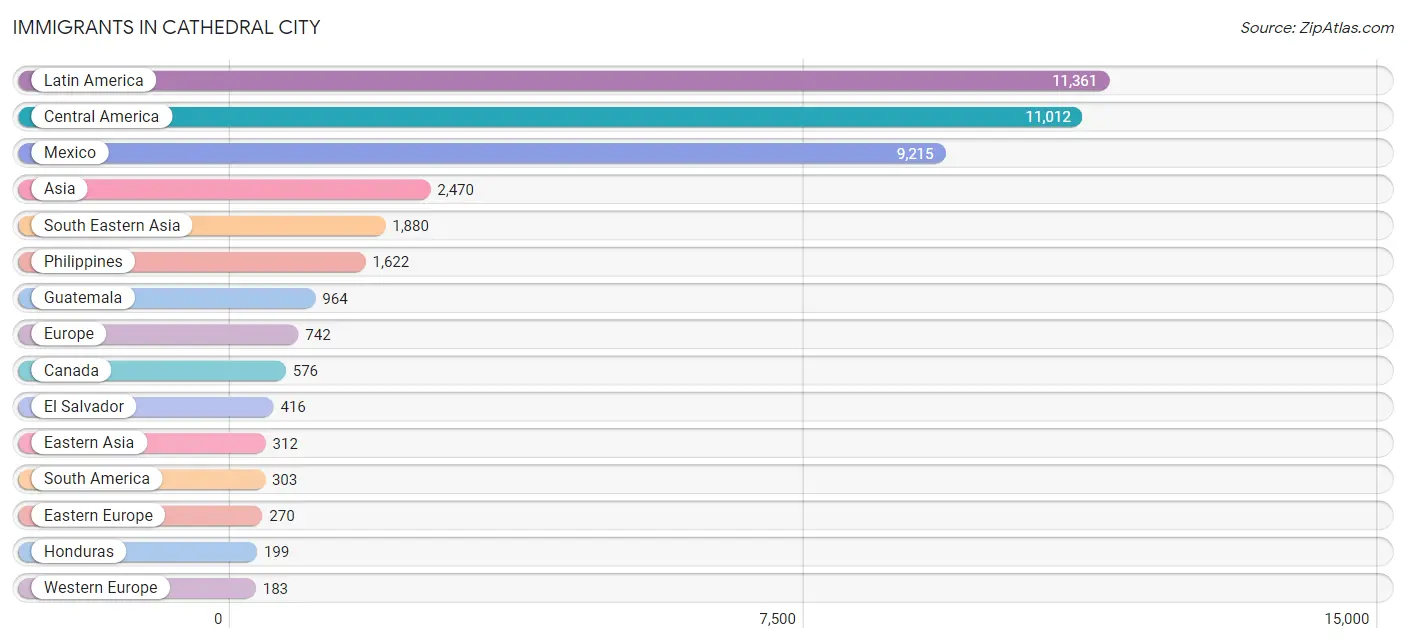
The most numerous immigrant groups reported in Cathedral City came from Latin America (11,361 | 21.9%), Central America (11,012 | 21.2%), Mexico (9,215 | 17.7%), Asia (2,470 | 4.8%), and South Eastern Asia (1,880 | 3.6%), together accounting for 69.2% of all Cathedral City residents.
| Immigration Origin | # Population | % Population |
| Africa | 101 | 0.2% |
| Argentina | 7 | 0.0% |
| Asia | 2,470 | 4.8% |
| Australia | 12 | 0.0% |
| Austria | 4 | 0.0% |
| Bangladesh | 14 | 0.0% |
| Belarus | 9 | 0.0% |
| Belgium | 15 | 0.0% |
| Belize | 65 | 0.1% |
| Bolivia | 13 | 0.0% |
| Bosnia and Herzegovina | 17 | 0.0% |
| Brazil | 10 | 0.0% |
| Bulgaria | 4 | 0.0% |
| Cambodia | 2 | 0.0% |
| Canada | 576 | 1.1% |
| Caribbean | 46 | 0.1% |
| Central America | 11,012 | 21.2% |
| Chile | 3 | 0.0% |
| China | 155 | 0.3% |
| Colombia | 112 | 0.2% |
| Costa Rica | 15 | 0.0% |
| Cuba | 39 | 0.1% |
| Denmark | 5 | 0.0% |
| Dominican Republic | 2 | 0.0% |
| Eastern Asia | 312 | 0.6% |
| Eastern Europe | 270 | 0.5% |
| Ecuador | 16 | 0.0% |
| Egypt | 26 | 0.1% |
| El Salvador | 416 | 0.8% |
| England | 88 | 0.2% |
| Europe | 742 | 1.4% |
| Fiji | 47 | 0.1% |
| France | 55 | 0.1% |
| Germany | 93 | 0.2% |
| Grenada | 2 | 0.0% |
| Guatemala | 964 | 1.9% |
| Honduras | 199 | 0.4% |
| Hong Kong | 22 | 0.0% |
| Hungary | 15 | 0.0% |
| India | 112 | 0.2% |
| Indonesia | 21 | 0.0% |
| Iran | 27 | 0.1% |
| Ireland | 5 | 0.0% |
| Israel | 36 | 0.1% |
| Italy | 42 | 0.1% |
| Japan | 66 | 0.1% |
| Korea | 91 | 0.2% |
| Laos | 51 | 0.1% |
| Latin America | 11,361 | 21.9% |
| Lebanon | 36 | 0.1% |
| Malaysia | 2 | 0.0% |
| Mexico | 9,215 | 17.7% |
| Morocco | 44 | 0.1% |
| Netherlands | 11 | 0.0% |
| Nicaragua | 48 | 0.1% |
| Northern Africa | 70 | 0.1% |
| Northern Europe | 176 | 0.3% |
| Norway | 8 | 0.0% |
| Oceania | 64 | 0.1% |
| Peru | 94 | 0.2% |
| Philippines | 1,622 | 3.1% |
| Poland | 36 | 0.1% |
| Portugal | 38 | 0.1% |
| Romania | 128 | 0.3% |
| Russia | 40 | 0.1% |
| Saudi Arabia | 10 | 0.0% |
| Scotland | 31 | 0.1% |
| South Africa | 31 | 0.1% |
| South America | 303 | 0.6% |
| South Central Asia | 179 | 0.3% |
| South Eastern Asia | 1,880 | 3.6% |
| Southern Europe | 113 | 0.2% |
| Spain | 33 | 0.1% |
| Sri Lanka | 26 | 0.1% |
| Sweden | 7 | 0.0% |
| Switzerland | 5 | 0.0% |
| Syria | 15 | 0.0% |
| Taiwan | 28 | 0.1% |
| Thailand | 3 | 0.0% |
| Trinidad and Tobago | 3 | 0.0% |
| Turkey | 2 | 0.0% |
| Ukraine | 3 | 0.0% |
| Venezuela | 15 | 0.0% |
| Vietnam | 177 | 0.3% |
| Western Asia | 99 | 0.2% |
| Western Europe | 183 | 0.4% | View All 86 Rows |
Sex and Age in Cathedral City
Sex and Age in Cathedral City
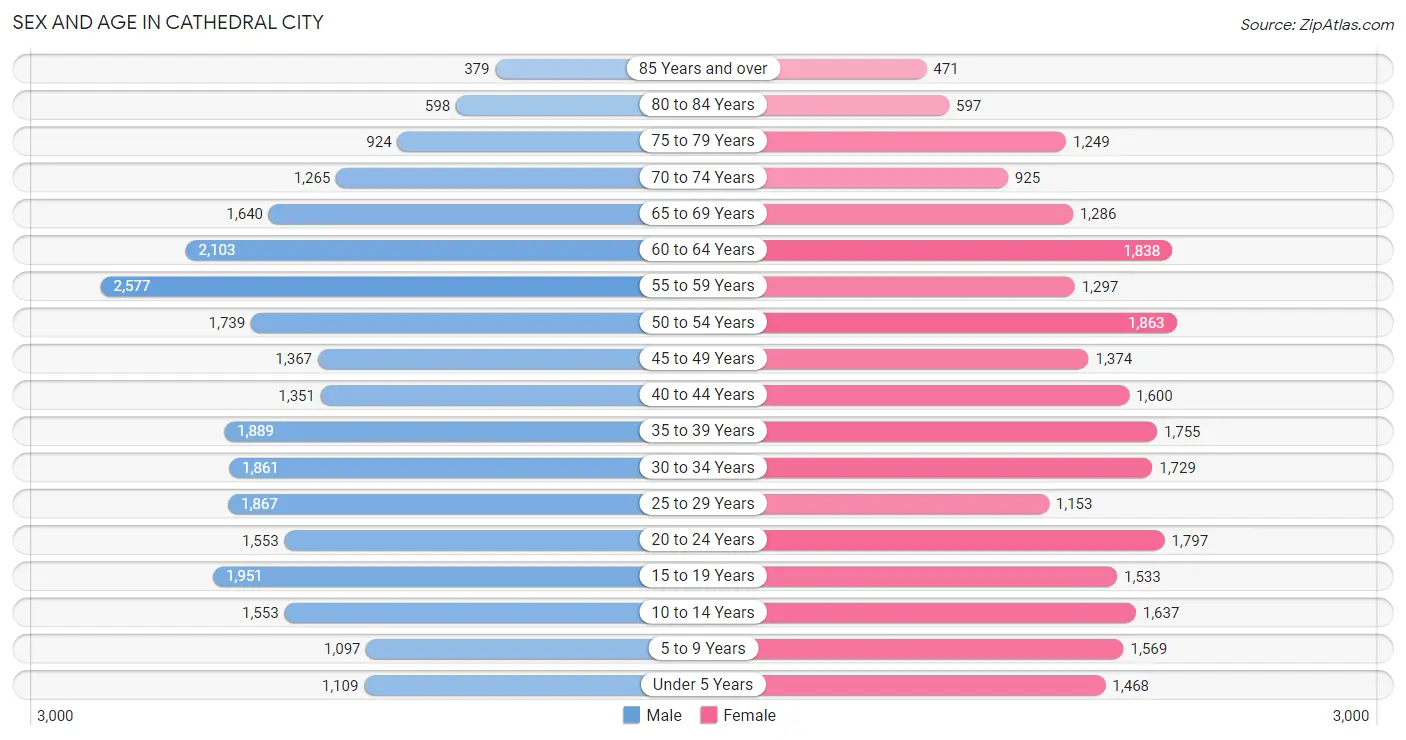
The most populous age groups in Cathedral City are 55 to 59 Years (2,577 | 9.6%) for men and 50 to 54 Years (1,863 | 7.4%) for women.
| Age Bracket | Male | Female |
| Under 5 Years | 1,109 (4.1%) | 1,468 (5.8%) |
| 5 to 9 Years | 1,097 (4.1%) | 1,569 (6.2%) |
| 10 to 14 Years | 1,553 (5.8%) | 1,637 (6.5%) |
| 15 to 19 Years | 1,951 (7.3%) | 1,533 (6.1%) |
| 20 to 24 Years | 1,553 (5.8%) | 1,797 (7.1%) |
| 25 to 29 Years | 1,867 (7.0%) | 1,153 (4.6%) |
| 30 to 34 Years | 1,861 (6.9%) | 1,729 (6.9%) |
| 35 to 39 Years | 1,889 (7.0%) | 1,755 (7.0%) |
| 40 to 44 Years | 1,351 (5.0%) | 1,600 (6.4%) |
| 45 to 49 Years | 1,367 (5.1%) | 1,374 (5.5%) |
| 50 to 54 Years | 1,739 (6.5%) | 1,863 (7.4%) |
| 55 to 59 Years | 2,577 (9.6%) | 1,297 (5.2%) |
| 60 to 64 Years | 2,103 (7.8%) | 1,838 (7.3%) |
| 65 to 69 Years | 1,640 (6.1%) | 1,286 (5.1%) |
| 70 to 74 Years | 1,265 (4.7%) | 925 (3.7%) |
| 75 to 79 Years | 924 (3.4%) | 1,249 (5.0%) |
| 80 to 84 Years | 598 (2.2%) | 597 (2.4%) |
| 85 Years and over | 379 (1.4%) | 471 (1.9%) |
| Total | 26,823 (100.0%) | 25,141 (100.0%) |
Families and Households in Cathedral City
Median Family Size in Cathedral City
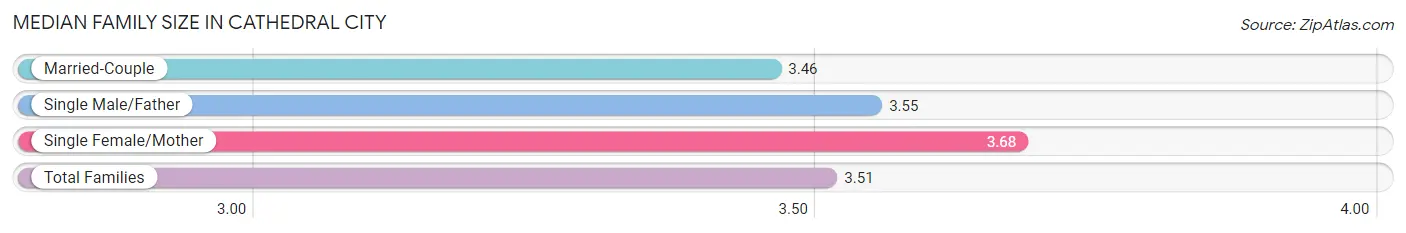
The median family size in Cathedral City is 3.51 persons per family, with single female/mother families (2,322 | 19.7%) accounting for the largest median family size of 3.68 persons per family. On the other hand, married-couple families (8,532 | 72.3%) represent the smallest median family size with 3.46 persons per family.
| Family Type | # Families | Family Size |
| Married-Couple | 8,532 (72.3%) | 3.46 |
| Single Male/Father | 943 (8.0%) | 3.55 |
| Single Female/Mother | 2,322 (19.7%) | 3.68 |
| Total Families | 11,797 (100.0%) | 3.51 |
Median Household Size in Cathedral City
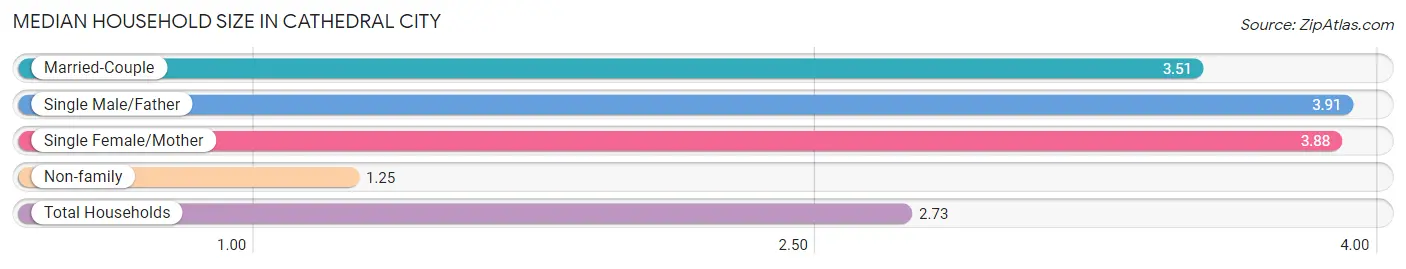
The median household size in Cathedral City is 2.73 persons per household, with single male/father households (943 | 5.0%) accounting for the largest median household size of 3.91 persons per household. non-family households (7,071 | 37.5%) represent the smallest median household size with 1.25 persons per household.
| Household Type | # Households | Household Size |
| Married-Couple | 8,532 (45.2%) | 3.51 |
| Single Male/Father | 943 (5.0%) | 3.91 |
| Single Female/Mother | 2,322 (12.3%) | 3.88 |
| Non-family | 7,071 (37.5%) | 1.25 |
| Total Households | 18,868 (100.0%) | 2.73 |
Household Size by Marriage Status in Cathedral City
Out of a total of 18,868 households in Cathedral City, 11,797 (62.5%) are family households, while 7,071 (37.5%) are nonfamily households. The most numerous type of family households are 2-person households, comprising 4,802, and the most common type of nonfamily households are 1-person households, comprising 5,783.
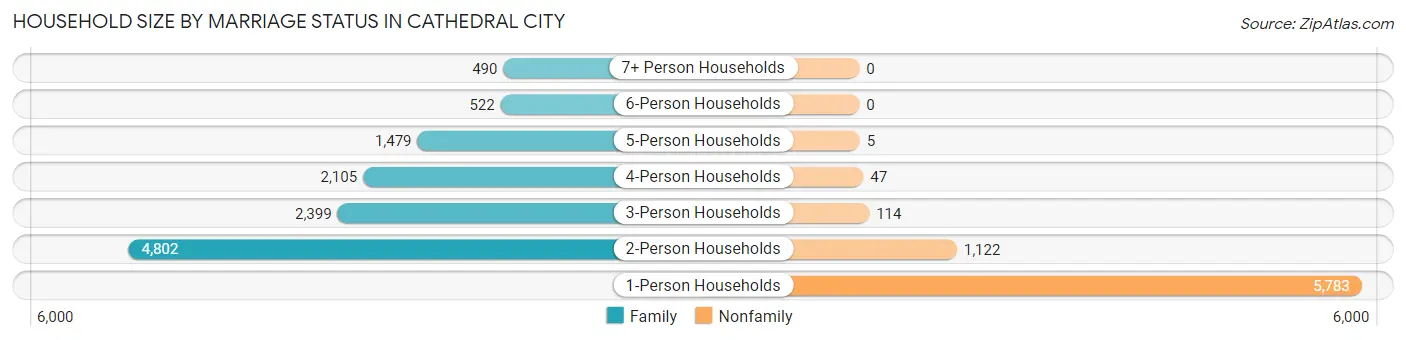
| Household Size | Family Households | Nonfamily Households |
| 1-Person Households | - | 5,783 (30.6%) |
| 2-Person Households | 4,802 (25.5%) | 1,122 (5.9%) |
| 3-Person Households | 2,399 (12.7%) | 114 (0.6%) |
| 4-Person Households | 2,105 (11.2%) | 47 (0.3%) |
| 5-Person Households | 1,479 (7.8%) | 5 (0.0%) |
| 6-Person Households | 522 (2.8%) | 0 (0.0%) |
| 7+ Person Households | 490 (2.6%) | 0 (0.0%) |
| Total | 11,797 (62.5%) | 7,071 (37.5%) |
Female Fertility in Cathedral City
Fertility by Age in Cathedral City
Average fertility rate in Cathedral City is 71.0 births per 1,000 women. Women in the age bracket of 20 to 34 years have the highest fertility rate with 119.0 births per 1,000 women. Women in the age bracket of 20 to 34 years acount for 69.2% of all women with births.
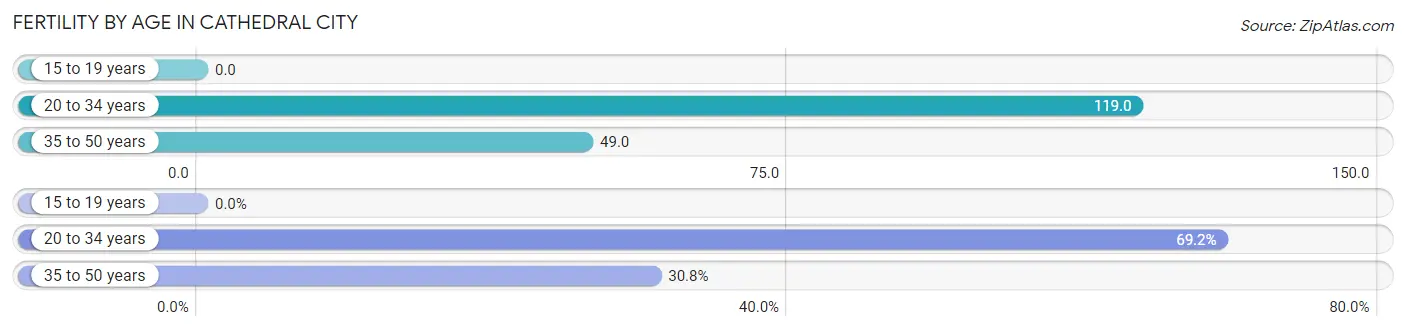
| Age Bracket | Women with Births | Births / 1,000 Women |
| 15 to 19 years | 0 (0.0%) | 0.0 |
| 20 to 34 years | 556 (69.2%) | 119.0 |
| 35 to 50 years | 247 (30.8%) | 49.0 |
| Total | 803 (100.0%) | 71.0 |
Fertility by Age by Marriage Status in Cathedral City
73.1% of women with births (803) in Cathedral City are married. The highest percentage of unmarried women with births falls into 35 to 50 years age bracket with 33.6% of them unmarried at the time of birth, while the lowest percentage of unmarried women with births belong to 20 to 34 years age bracket with 23.9% of them unmarried.
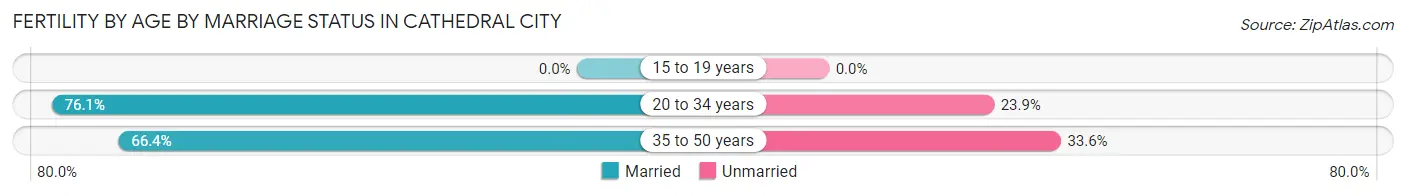
| Age Bracket | Married | Unmarried |
| 15 to 19 years | 0 (0.0%) | 0 (0.0%) |
| 20 to 34 years | 423 (76.1%) | 133 (23.9%) |
| 35 to 50 years | 164 (66.4%) | 83 (33.6%) |
| Total | 587 (73.1%) | 216 (26.9%) |
Fertility by Education in Cathedral City
Average fertility rate in Cathedral City is 71.0 births per 1,000 women. Women with the education attainment of graduate degree have the highest fertility rate of 125.0 births per 1,000 women, while women with the education attainment of less than high school have the lowest fertility at 28.0 births per 1,000 women. Women with the education attainment of high school diploma represent 44.7% of all women with births.
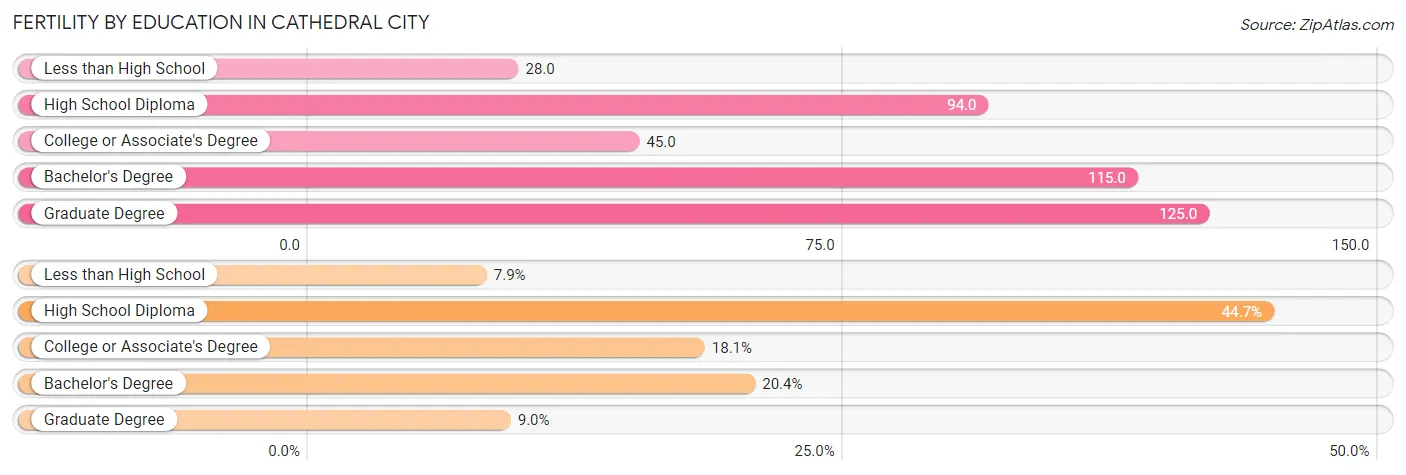
| Educational Attainment | Women with Births | Births / 1,000 Women |
| Less than High School | 63 (7.9%) | 28.0 |
| High School Diploma | 359 (44.7%) | 94.0 |
| College or Associate's Degree | 145 (18.1%) | 45.0 |
| Bachelor's Degree | 164 (20.4%) | 115.0 |
| Graduate Degree | 72 (9.0%) | 125.0 |
| Total | 803 (100.0%) | 71.0 |
Fertility by Education by Marriage Status in Cathedral City
26.9% of women with births in Cathedral City are unmarried. Women with the educational attainment of graduate degree are most likely to be married with 97.2% of them married at childbirth, while women with the educational attainment of college or associate's degree are least likely to be married with 82.1% of them unmarried at childbirth.
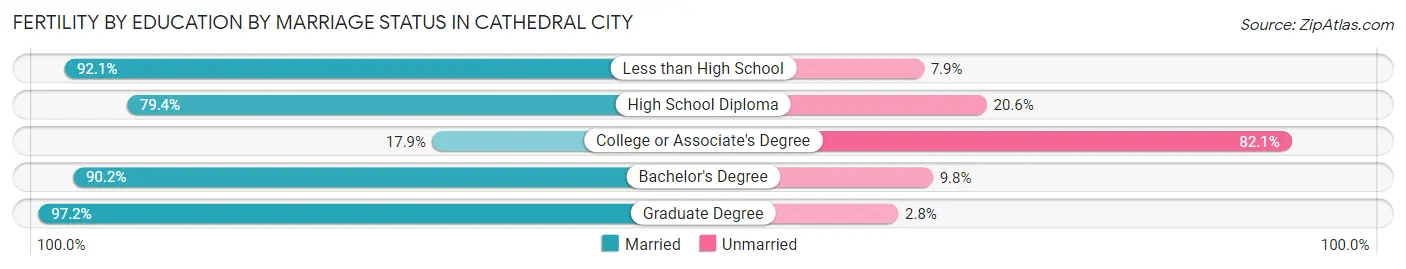
| Educational Attainment | Married | Unmarried |
| Less than High School | 58 (92.1%) | 5 (7.9%) |
| High School Diploma | 285 (79.4%) | 74 (20.6%) |
| College or Associate's Degree | 26 (17.9%) | 119 (82.1%) |
| Bachelor's Degree | 148 (90.2%) | 16 (9.8%) |
| Graduate Degree | 70 (97.2%) | 2 (2.8%) |
| Total | 587 (73.1%) | 216 (26.9%) |
Employment Characteristics in Cathedral City
Employment by Class of Employer in Cathedral City
Among the 23,402 employed individuals in Cathedral City, private company employees (16,269 | 69.5%), self-employed (not incorporated) (2,419 | 10.3%), and local government employees (1,407 | 6.0%) make up the most common classes of employment.
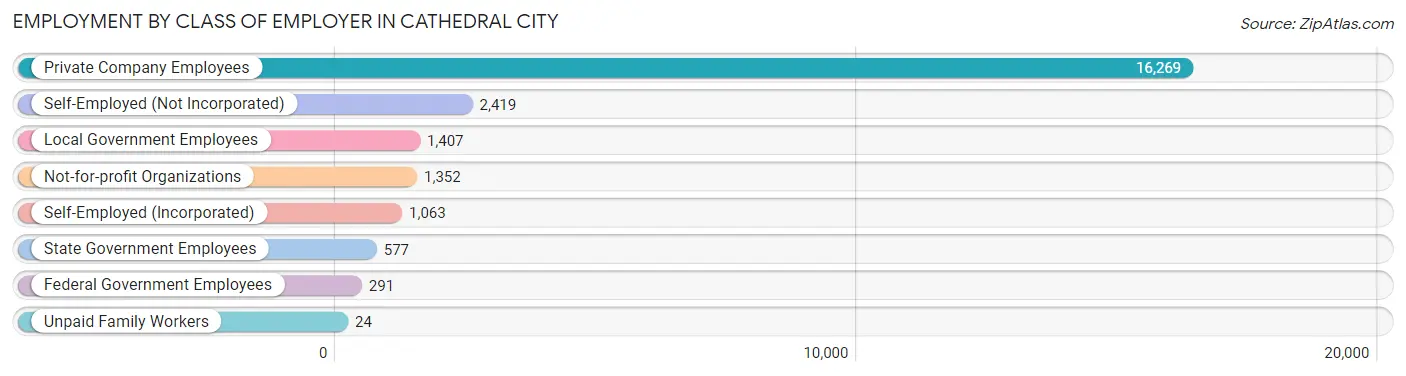
| Employer Class | # Employees | % Employees |
| Private Company Employees | 16,269 | 69.5% |
| Self-Employed (Incorporated) | 1,063 | 4.5% |
| Self-Employed (Not Incorporated) | 2,419 | 10.3% |
| Not-for-profit Organizations | 1,352 | 5.8% |
| Local Government Employees | 1,407 | 6.0% |
| State Government Employees | 577 | 2.5% |
| Federal Government Employees | 291 | 1.2% |
| Unpaid Family Workers | 24 | 0.1% |
| Total | 23,402 | 100.0% |
Employment Status by Age in Cathedral City
According to the labor force statistics for Cathedral City, out of the total population over 16 years of age (42,896), 59.3% or 25,437 individuals are in the labor force, with 6.2% or 1,577 of them unemployed. The age group with the highest labor force participation rate is 25 to 29 years, with 83.7% or 2,528 individuals in the labor force. Within the labor force, the 16 to 19 years age range has the highest percentage of unemployed individuals, with 15.8% or 112 of them being unemployed.
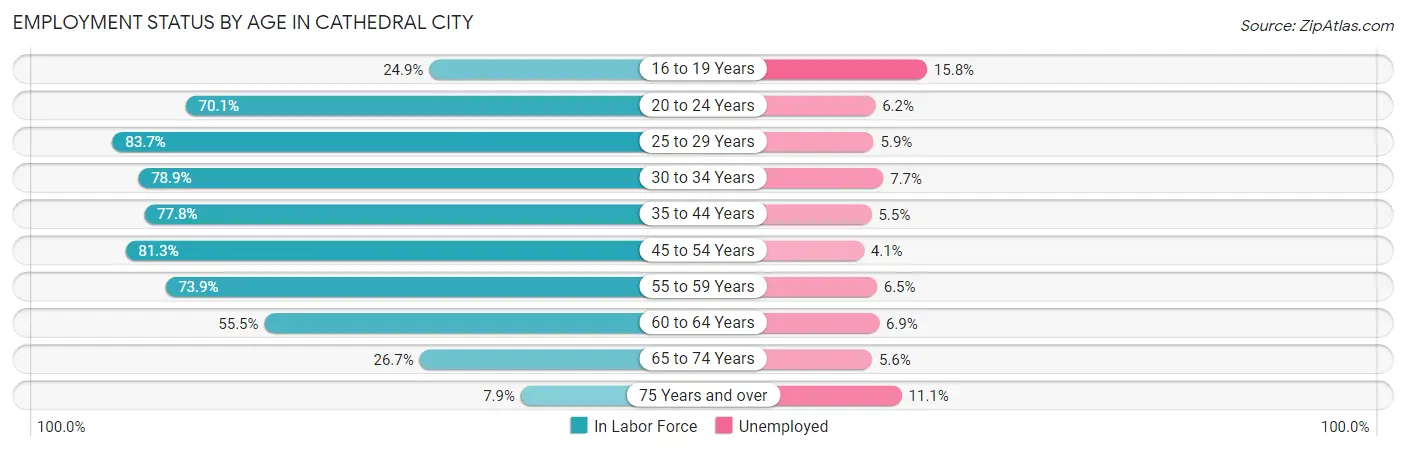
| Age Bracket | In Labor Force | Unemployed |
| 16 to 19 Years | 709 (24.9%) | 112 (15.8%) |
| 20 to 24 Years | 2,348 (70.1%) | 146 (6.2%) |
| 25 to 29 Years | 2,528 (83.7%) | 149 (5.9%) |
| 30 to 34 Years | 2,833 (78.9%) | 218 (7.7%) |
| 35 to 44 Years | 5,131 (77.8%) | 282 (5.5%) |
| 45 to 54 Years | 5,157 (81.3%) | 211 (4.1%) |
| 55 to 59 Years | 2,863 (73.9%) | 186 (6.5%) |
| 60 to 64 Years | 2,187 (55.5%) | 151 (6.9%) |
| 65 to 74 Years | 1,366 (26.7%) | 76 (5.6%) |
| 75 Years and over | 333 (7.9%) | 37 (11.1%) |
| Total | 25,437 (59.3%) | 1,577 (6.2%) |
Employment Status by Educational Attainment in Cathedral City
According to labor force statistics for Cathedral City, 75.6% of individuals (20,686) out of the total population between 25 and 64 years of age (27,363) are in the labor force, with 5.8% or 1,200 of them being unemployed. The group with the highest labor force participation rate are those with the educational attainment of college / associate degree, with 81.6% or 5,835 individuals in the labor force. Within the labor force, individuals with college / associate degree education have the highest percentage of unemployment, with 7.5% or 438 of them being unemployed.
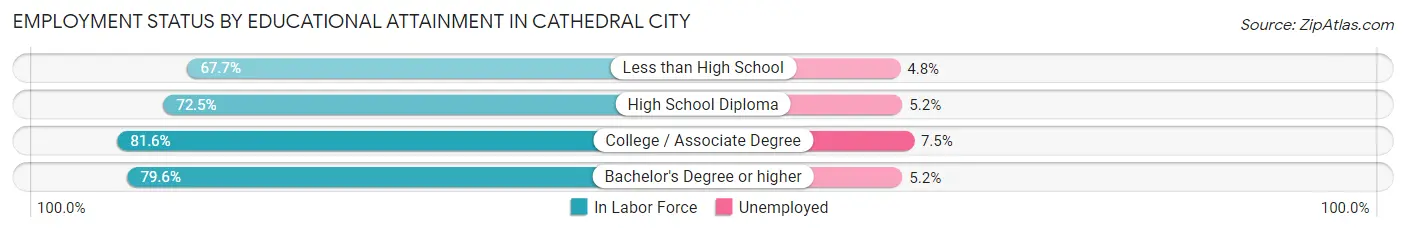
| Educational Attainment | In Labor Force | Unemployed |
| Less than High School | 3,545 (67.7%) | 251 (4.8%) |
| High School Diploma | 6,138 (72.5%) | 440 (5.2%) |
| College / Associate Degree | 5,835 (81.6%) | 536 (7.5%) |
| Bachelor's Degree or higher | 5,181 (79.6%) | 338 (5.2%) |
| Total | 20,686 (75.6%) | 1,587 (5.8%) |
Employment Occupations by Sex in Cathedral City
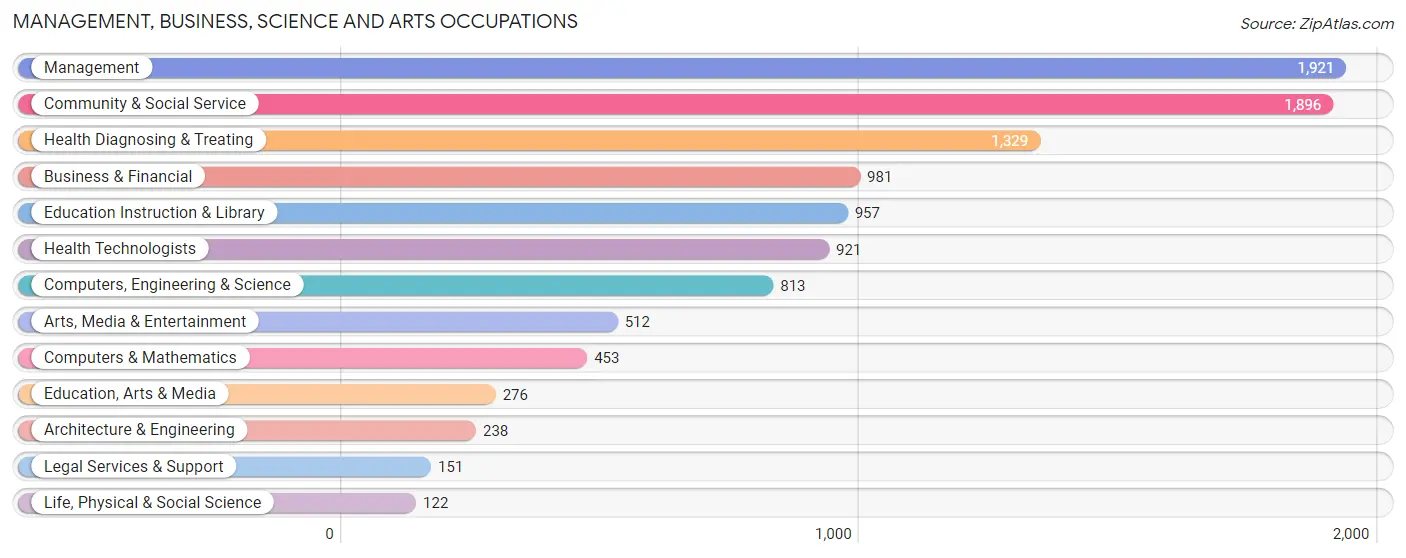
Management, Business, Science and Arts Occupations
The most common Management, Business, Science and Arts occupations in Cathedral City are Management (1,921 | 8.1%), Community & Social Service (1,896 | 8.0%), Health Diagnosing & Treating (1,329 | 5.6%), Business & Financial (981 | 4.1%), and Education Instruction & Library (957 | 4.0%).
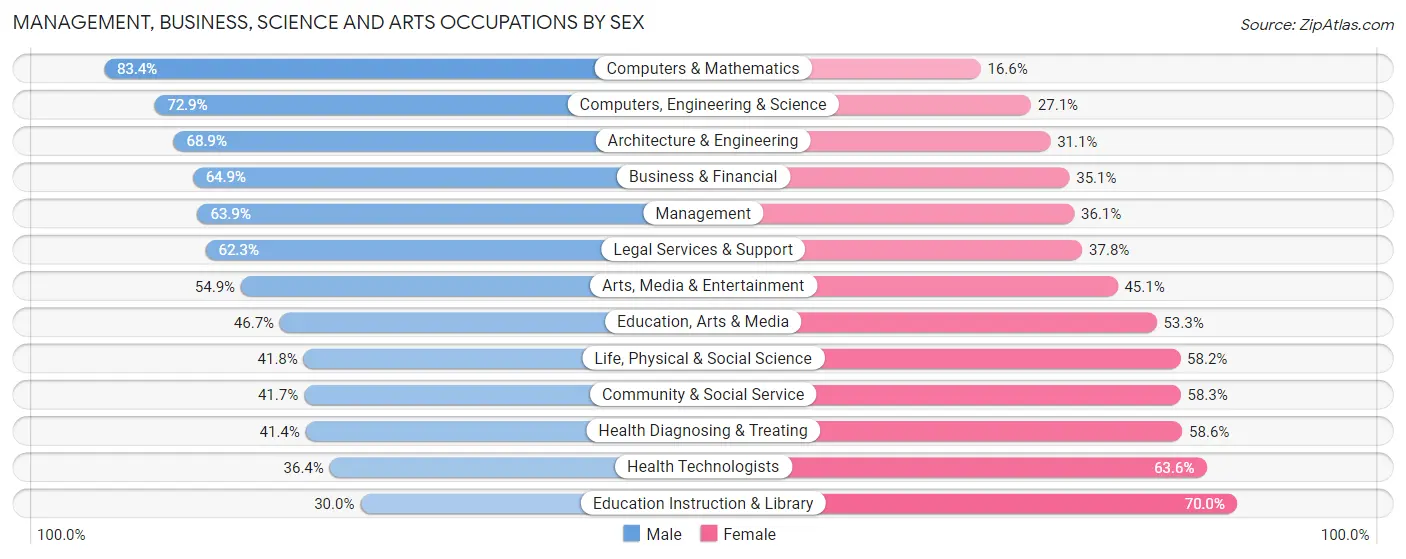
Management, Business, Science and Arts Occupations by Sex
Within the Management, Business, Science and Arts occupations in Cathedral City, the most male-oriented occupations are Computers & Mathematics (83.4%), Computers, Engineering & Science (72.9%), and Architecture & Engineering (68.9%), while the most female-oriented occupations are Education Instruction & Library (70.0%), Health Technologists (63.6%), and Health Diagnosing & Treating (58.6%).
| Occupation | Male | Female |
| Management | 1,228 (63.9%) | 693 (36.1%) |
| Business & Financial | 637 (64.9%) | 344 (35.1%) |
| Computers, Engineering & Science | 593 (72.9%) | 220 (27.1%) |
| Computers & Mathematics | 378 (83.4%) | 75 (16.6%) |
| Architecture & Engineering | 164 (68.9%) | 74 (31.1%) |
| Life, Physical & Social Science | 51 (41.8%) | 71 (58.2%) |
| Community & Social Service | 791 (41.7%) | 1,105 (58.3%) |
| Education, Arts & Media | 129 (46.7%) | 147 (53.3%) |
| Legal Services & Support | 94 (62.3%) | 57 (37.8%) |
| Education Instruction & Library | 287 (30.0%) | 670 (70.0%) |
| Arts, Media & Entertainment | 281 (54.9%) | 231 (45.1%) |
| Health Diagnosing & Treating | 550 (41.4%) | 779 (58.6%) |
| Health Technologists | 335 (36.4%) | 586 (63.6%) |
| Total (Category) | 3,799 (54.7%) | 3,141 (45.3%) |
| Total (Overall) | 13,466 (56.4%) | 10,391 (43.6%) |
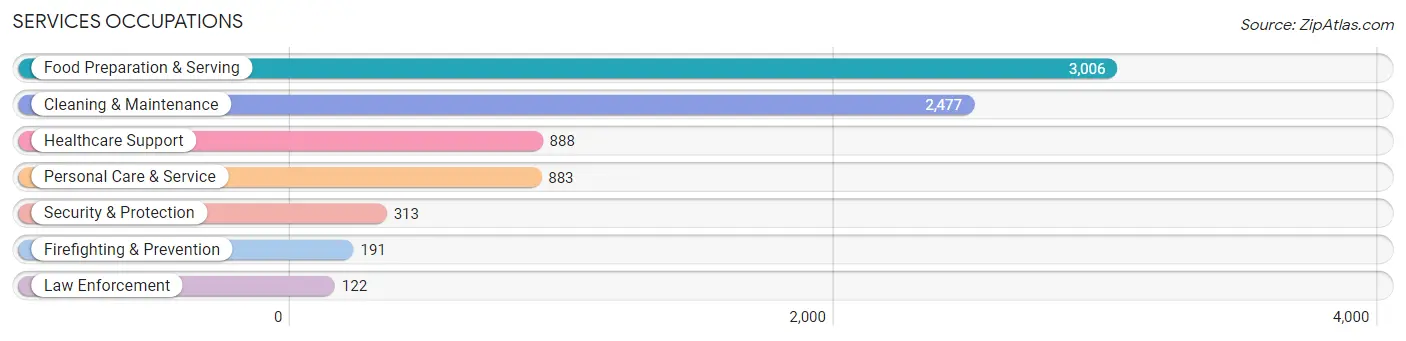
Services Occupations
The most common Services occupations in Cathedral City are Food Preparation & Serving (3,006 | 12.6%), Cleaning & Maintenance (2,477 | 10.4%), Healthcare Support (888 | 3.7%), Personal Care & Service (883 | 3.7%), and Security & Protection (313 | 1.3%).
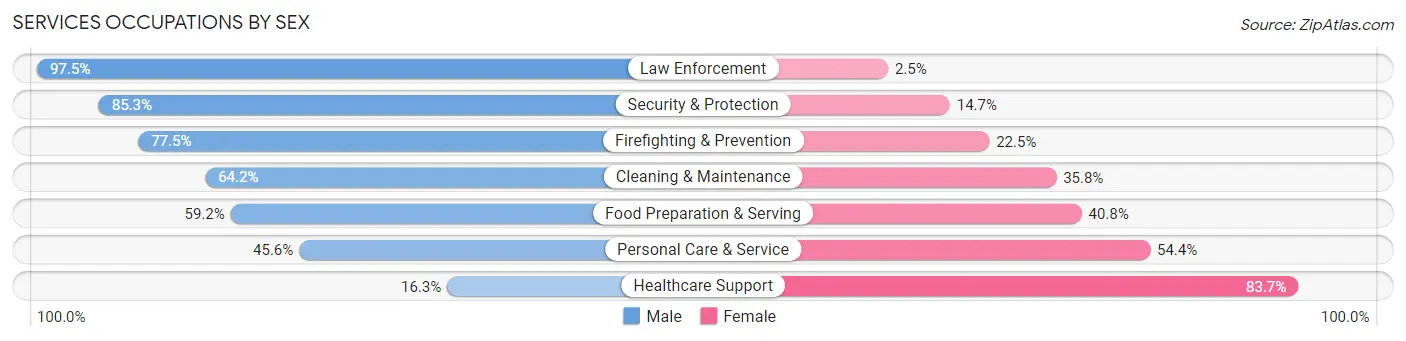
Services Occupations by Sex
Within the Services occupations in Cathedral City, the most male-oriented occupations are Law Enforcement (97.5%), Security & Protection (85.3%), and Firefighting & Prevention (77.5%), while the most female-oriented occupations are Healthcare Support (83.7%), Personal Care & Service (54.4%), and Food Preparation & Serving (40.8%).
| Occupation | Male | Female |
| Healthcare Support | 145 (16.3%) | 743 (83.7%) |
| Security & Protection | 267 (85.3%) | 46 (14.7%) |
| Firefighting & Prevention | 148 (77.5%) | 43 (22.5%) |
| Law Enforcement | 119 (97.5%) | 3 (2.5%) |
| Food Preparation & Serving | 1,780 (59.2%) | 1,226 (40.8%) |
| Cleaning & Maintenance | 1,591 (64.2%) | 886 (35.8%) |
| Personal Care & Service | 403 (45.6%) | 480 (54.4%) |
| Total (Category) | 4,186 (55.3%) | 3,381 (44.7%) |
| Total (Overall) | 13,466 (56.4%) | 10,391 (43.6%) |
Sales and Office Occupations
The most common Sales and Office occupations in Cathedral City are Sales & Related (2,652 | 11.1%), and Office & Administration (2,318 | 9.7%).

Sales and Office Occupations by Sex
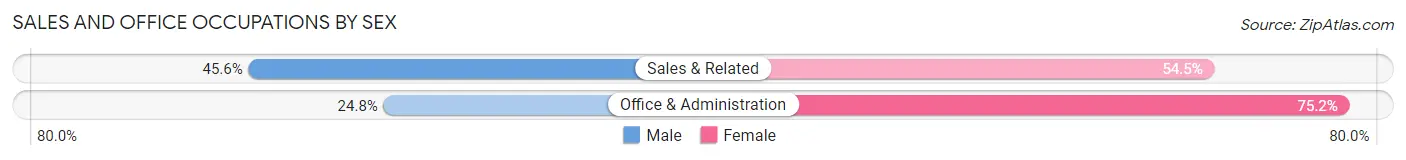
| Occupation | Male | Female |
| Sales & Related | 1,208 (45.6%) | 1,444 (54.4%) |
| Office & Administration | 574 (24.8%) | 1,744 (75.2%) |
| Total (Category) | 1,782 (35.9%) | 3,188 (64.1%) |
| Total (Overall) | 13,466 (56.4%) | 10,391 (43.6%) |
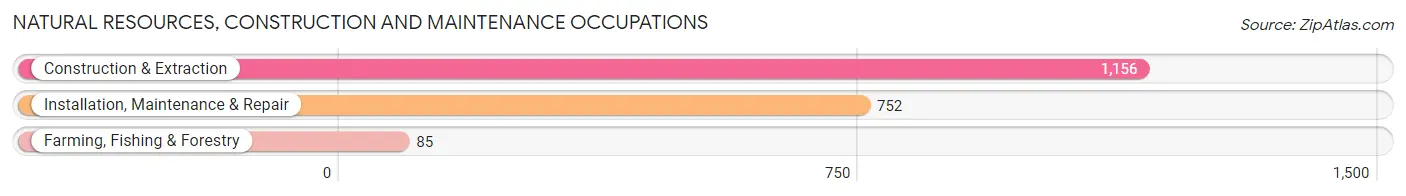
Natural Resources, Construction and Maintenance Occupations
The most common Natural Resources, Construction and Maintenance occupations in Cathedral City are Construction & Extraction (1,156 | 4.9%), Installation, Maintenance & Repair (752 | 3.2%), and Farming, Fishing & Forestry (85 | 0.4%).
Natural Resources, Construction and Maintenance Occupations by Sex
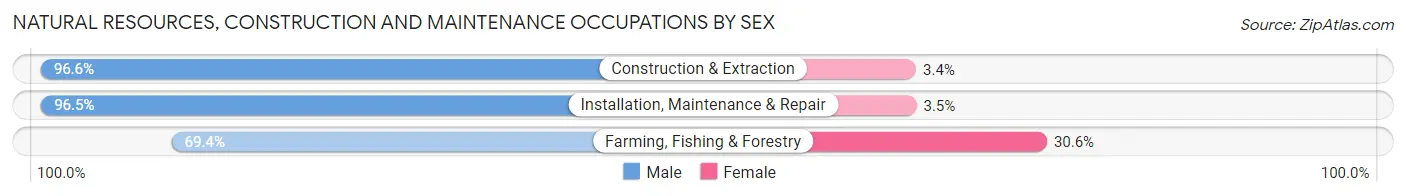
| Occupation | Male | Female |
| Farming, Fishing & Forestry | 59 (69.4%) | 26 (30.6%) |
| Construction & Extraction | 1,117 (96.6%) | 39 (3.4%) |
| Installation, Maintenance & Repair | 726 (96.5%) | 26 (3.5%) |
| Total (Category) | 1,902 (95.4%) | 91 (4.6%) |
| Total (Overall) | 13,466 (56.4%) | 10,391 (43.6%) |
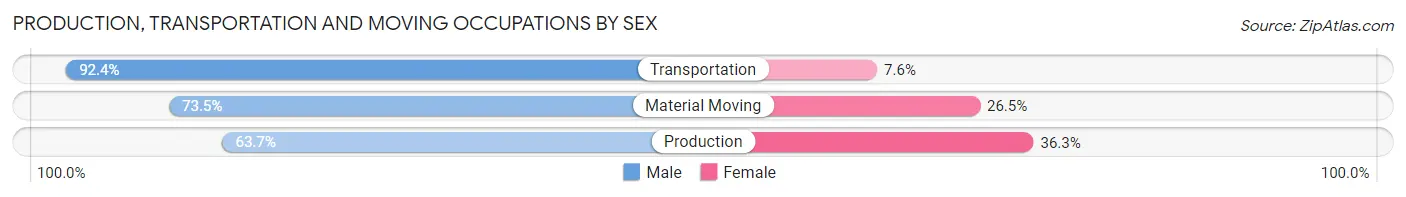
Production, Transportation and Moving Occupations
The most common Production, Transportation and Moving occupations in Cathedral City are Material Moving (1,026 | 4.3%), Production (746 | 3.1%), and Transportation (615 | 2.6%).
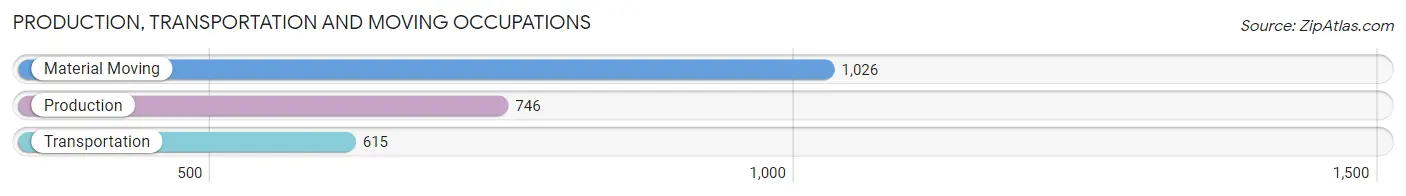
Production, Transportation and Moving Occupations by Sex
| Occupation | Male | Female |
| Production | 475 (63.7%) | 271 (36.3%) |
| Transportation | 568 (92.4%) | 47 (7.6%) |
| Material Moving | 754 (73.5%) | 272 (26.5%) |
| Total (Category) | 1,797 (75.3%) | 590 (24.7%) |
| Total (Overall) | 13,466 (56.4%) | 10,391 (43.6%) |
Employment Industries by Sex in Cathedral City
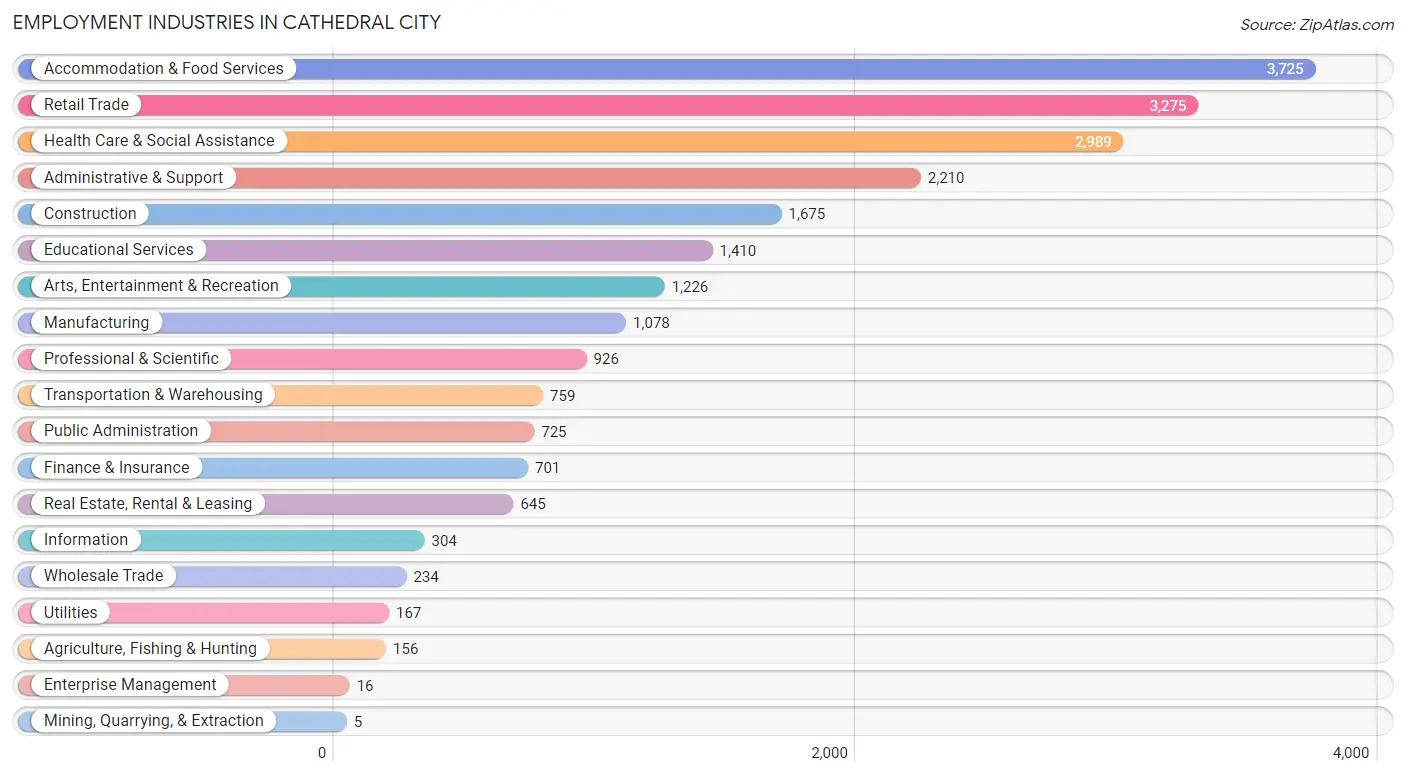
Employment Industries in Cathedral City
The major employment industries in Cathedral City include Accommodation & Food Services (3,725 | 15.6%), Retail Trade (3,275 | 13.7%), Health Care & Social Assistance (2,989 | 12.5%), Administrative & Support (2,210 | 9.3%), and Construction (1,675 | 7.0%).
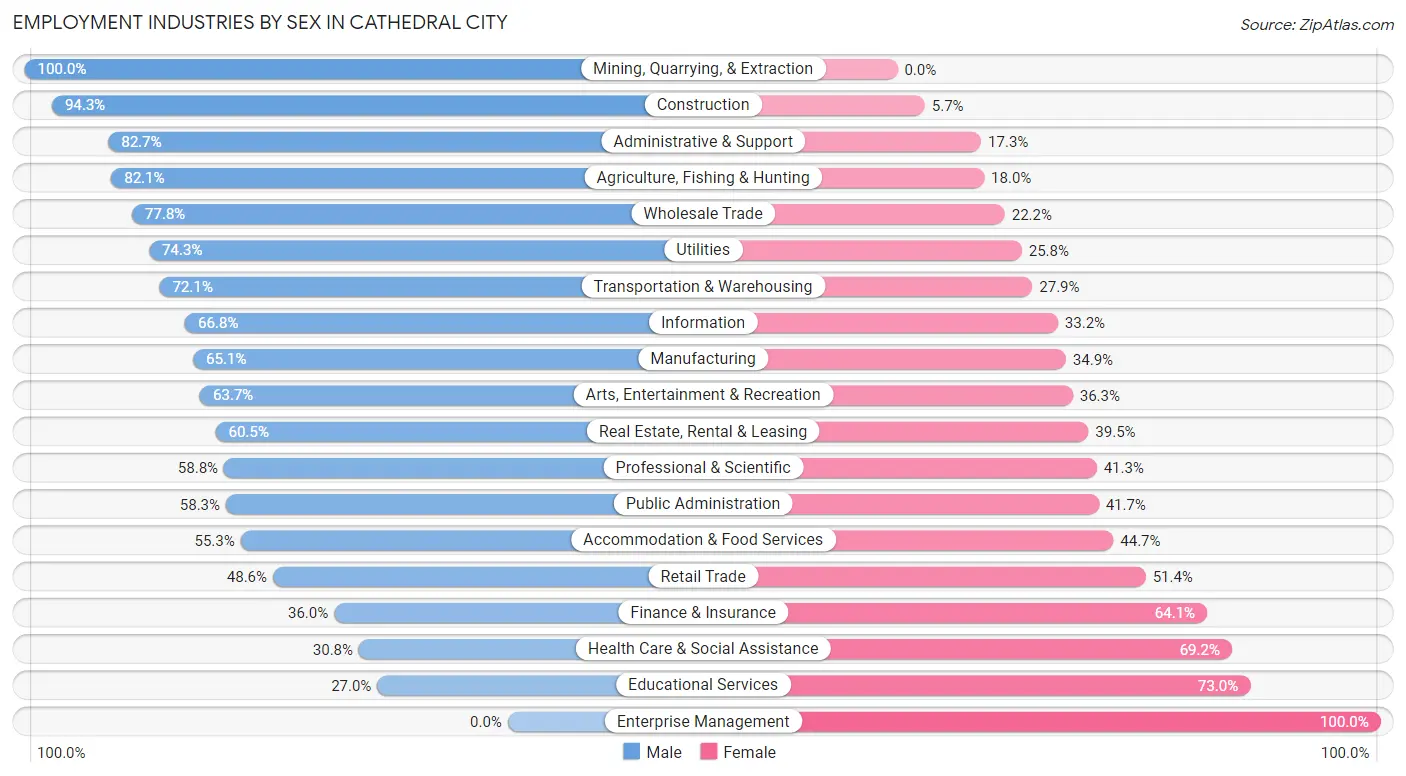
Employment Industries by Sex in Cathedral City
The Cathedral City industries that see more men than women are Mining, Quarrying, & Extraction (100.0%), Construction (94.3%), and Administrative & Support (82.7%), whereas the industries that tend to have a higher number of women are Enterprise Management (100.0%), Educational Services (73.0%), and Health Care & Social Assistance (69.2%).
| Industry | Male | Female |
| Agriculture, Fishing & Hunting | 128 (82.1%) | 28 (17.9%) |
| Mining, Quarrying, & Extraction | 5 (100.0%) | 0 (0.0%) |
| Construction | 1,580 (94.3%) | 95 (5.7%) |
| Manufacturing | 702 (65.1%) | 376 (34.9%) |
| Wholesale Trade | 182 (77.8%) | 52 (22.2%) |
| Retail Trade | 1,592 (48.6%) | 1,683 (51.4%) |
| Transportation & Warehousing | 547 (72.1%) | 212 (27.9%) |
| Utilities | 124 (74.3%) | 43 (25.8%) |
| Information | 203 (66.8%) | 101 (33.2%) |
| Finance & Insurance | 252 (35.9%) | 449 (64.0%) |
| Real Estate, Rental & Leasing | 390 (60.5%) | 255 (39.5%) |
| Professional & Scientific | 544 (58.8%) | 382 (41.2%) |
| Enterprise Management | 0 (0.0%) | 16 (100.0%) |
| Administrative & Support | 1,827 (82.7%) | 383 (17.3%) |
| Educational Services | 381 (27.0%) | 1,029 (73.0%) |
| Health Care & Social Assistance | 921 (30.8%) | 2,068 (69.2%) |
| Arts, Entertainment & Recreation | 781 (63.7%) | 445 (36.3%) |
| Accommodation & Food Services | 2,060 (55.3%) | 1,665 (44.7%) |
| Public Administration | 423 (58.3%) | 302 (41.7%) |
| Total | 13,466 (56.4%) | 10,391 (43.6%) |
Education in Cathedral City
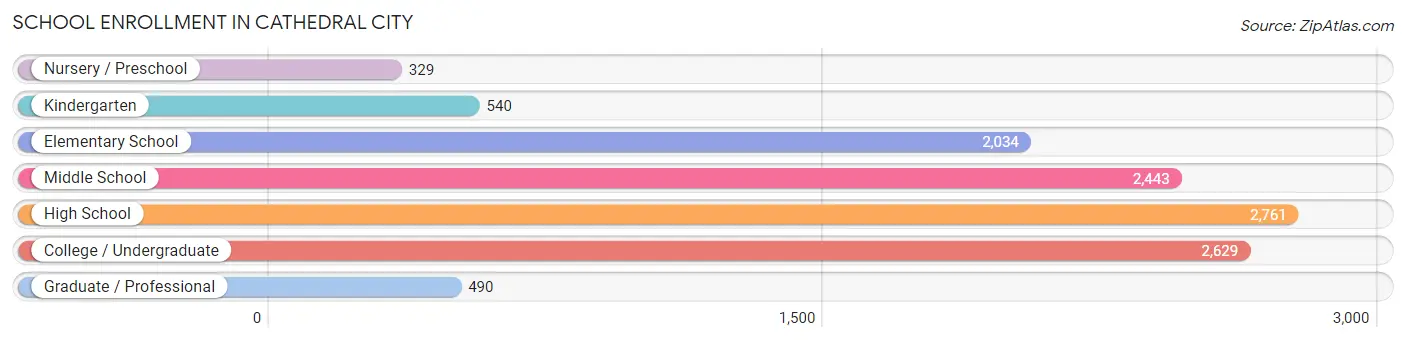
School Enrollment in Cathedral City
The most common levels of schooling among the 11,226 students in Cathedral City are high school (2,761 | 24.6%), college / undergraduate (2,629 | 23.4%), and middle school (2,443 | 21.8%).
| School Level | # Students | % Students |
| Nursery / Preschool | 329 | 2.9% |
| Kindergarten | 540 | 4.8% |
| Elementary School | 2,034 | 18.1% |
| Middle School | 2,443 | 21.8% |
| High School | 2,761 | 24.6% |
| College / Undergraduate | 2,629 | 23.4% |
| Graduate / Professional | 490 | 4.4% |
| Total | 11,226 | 100.0% |
School Enrollment by Age by Funding Source in Cathedral City
Out of a total of 11,226 students who are enrolled in schools in Cathedral City, 853 (7.6%) attend a private institution, while the remaining 10,373 (92.4%) are enrolled in public schools. The age group of 3 to 4 year olds has the highest likelihood of being enrolled in private schools, with 94 (39.8% in the age bracket) enrolled. Conversely, the age group of 15 to 17 year olds has the lowest likelihood of being enrolled in a private school, with 1,919 (97.0% in the age bracket) attending a public institution.
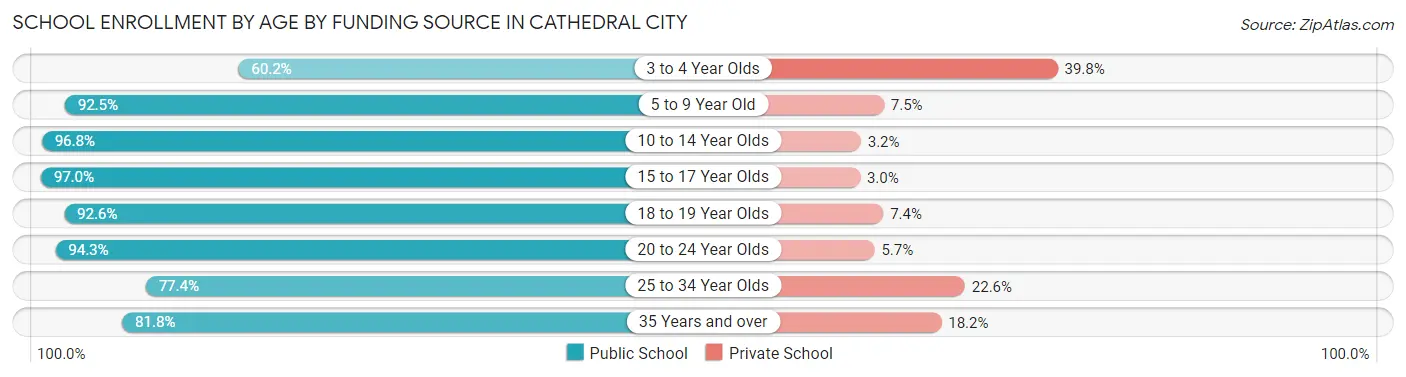
| Age Bracket | Public School | Private School |
| 3 to 4 Year Olds | 142 (60.2%) | 94 (39.8%) |
| 5 to 9 Year Old | 2,272 (92.5%) | 184 (7.5%) |
| 10 to 14 Year Olds | 3,037 (96.8%) | 100 (3.2%) |
| 15 to 17 Year Olds | 1,919 (97.0%) | 60 (3.0%) |
| 18 to 19 Year Olds | 893 (92.6%) | 71 (7.4%) |
| 20 to 24 Year Olds | 1,003 (94.3%) | 61 (5.7%) |
| 25 to 34 Year Olds | 446 (77.4%) | 130 (22.6%) |
| 35 Years and over | 666 (81.8%) | 148 (18.2%) |
| Total | 10,373 (92.4%) | 853 (7.6%) |
Educational Attainment by Field of Study in Cathedral City
Business (1,984 | 19.4%), education (1,018 | 10.0%), science & technology (1,011 | 9.9%), social sciences (824 | 8.1%), and psychology (817 | 8.0%) are the most common fields of study among 10,204 individuals in Cathedral City who have obtained a bachelor's degree or higher.
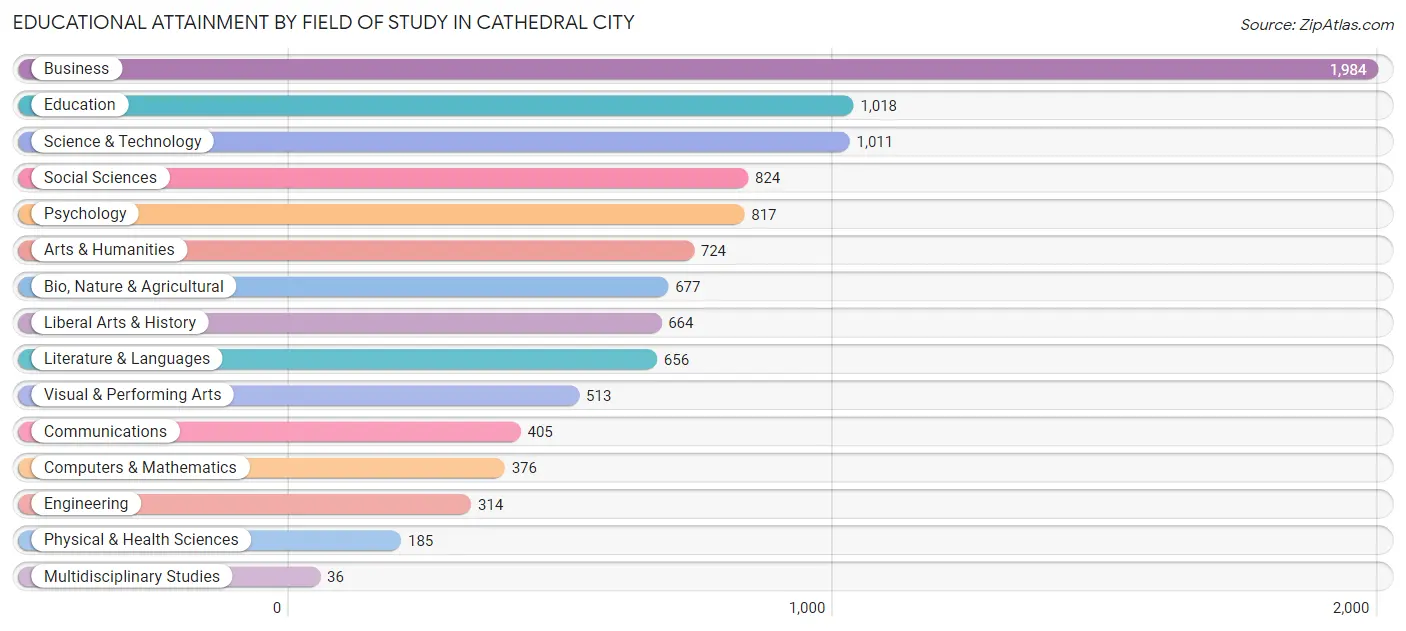
| Field of Study | # Graduates | % Graduates |
| Computers & Mathematics | 376 | 3.7% |
| Bio, Nature & Agricultural | 677 | 6.6% |
| Physical & Health Sciences | 185 | 1.8% |
| Psychology | 817 | 8.0% |
| Social Sciences | 824 | 8.1% |
| Engineering | 314 | 3.1% |
| Multidisciplinary Studies | 36 | 0.4% |
| Science & Technology | 1,011 | 9.9% |
| Business | 1,984 | 19.4% |
| Education | 1,018 | 10.0% |
| Literature & Languages | 656 | 6.4% |
| Liberal Arts & History | 664 | 6.5% |
| Visual & Performing Arts | 513 | 5.0% |
| Communications | 405 | 4.0% |
| Arts & Humanities | 724 | 7.1% |
| Total | 10,204 | 100.0% |
Transportation & Commute in Cathedral City
Vehicle Availability by Sex in Cathedral City
The most prevalent vehicle ownership categories in Cathedral City are males with 2 vehicles (4,376, accounting for 33.2%) and females with 2 vehicles (3,341, making up 43.1%).
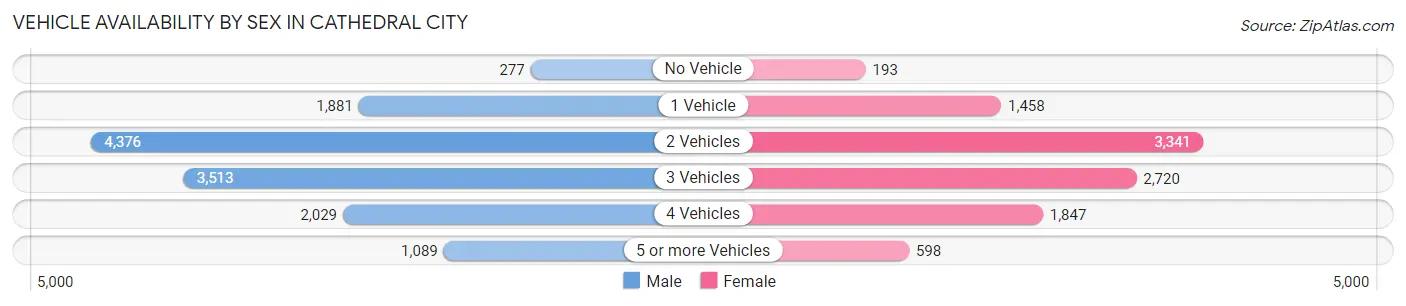
| Vehicles Available | Male | Female |
| No Vehicle | 277 (2.1%) | 193 (1.9%) |
| 1 Vehicle | 1,881 (14.3%) | 1,458 (14.3%) |
| 2 Vehicles | 4,376 (33.2%) | 3,341 (32.9%) |
| 3 Vehicles | 3,513 (26.7%) | 2,720 (26.8%) |
| 4 Vehicles | 2,029 (15.4%) | 1,847 (18.2%) |
| 5 or more Vehicles | 1,089 (8.3%) | 598 (5.9%) |
| Total | 13,165 (100.0%) | 10,157 (100.0%) |
Commute Time in Cathedral City
The most frequently occuring commute durations in Cathedral City are 15 to 19 minutes (5,217 commuters, 24.2%), 20 to 24 minutes (5,134 commuters, 23.8%), and 10 to 14 minutes (4,219 commuters, 19.6%).
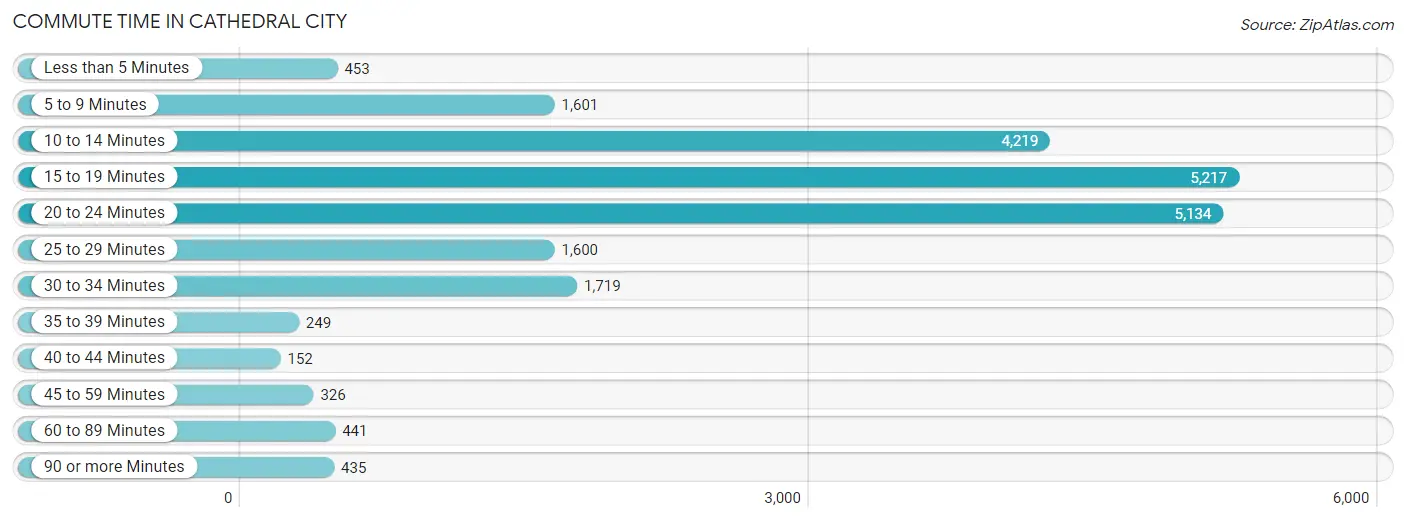
| Commute Time | # Commuters | % Commuters |
| Less than 5 Minutes | 453 | 2.1% |
| 5 to 9 Minutes | 1,601 | 7.4% |
| 10 to 14 Minutes | 4,219 | 19.6% |
| 15 to 19 Minutes | 5,217 | 24.2% |
| 20 to 24 Minutes | 5,134 | 23.8% |
| 25 to 29 Minutes | 1,600 | 7.4% |
| 30 to 34 Minutes | 1,719 | 8.0% |
| 35 to 39 Minutes | 249 | 1.2% |
| 40 to 44 Minutes | 152 | 0.7% |
| 45 to 59 Minutes | 326 | 1.5% |
| 60 to 89 Minutes | 441 | 2.1% |
| 90 or more Minutes | 435 | 2.0% |
Commute Time by Sex in Cathedral City
The most common commute times in Cathedral City are 15 to 19 minutes (3,055 commuters, 25.0%) for males and 20 to 24 minutes (2,321 commuters, 24.9%) for females.
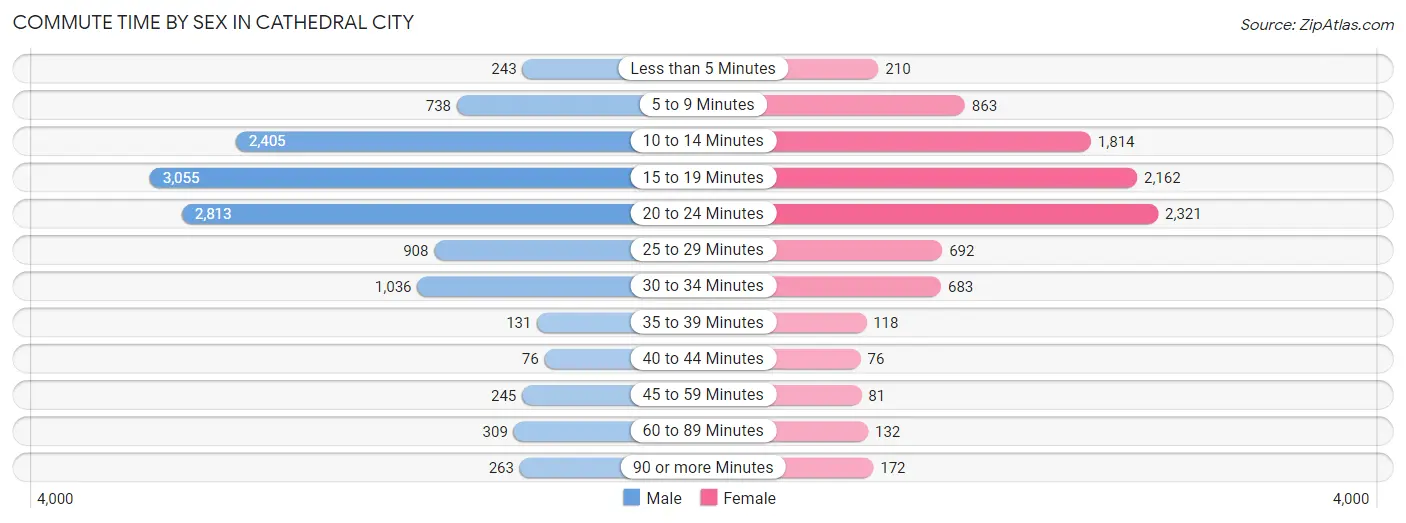
| Commute Time | Male | Female |
| Less than 5 Minutes | 243 (2.0%) | 210 (2.2%) |
| 5 to 9 Minutes | 738 (6.0%) | 863 (9.3%) |
| 10 to 14 Minutes | 2,405 (19.7%) | 1,814 (19.5%) |
| 15 to 19 Minutes | 3,055 (25.0%) | 2,162 (23.2%) |
| 20 to 24 Minutes | 2,813 (23.0%) | 2,321 (24.9%) |
| 25 to 29 Minutes | 908 (7.4%) | 692 (7.4%) |
| 30 to 34 Minutes | 1,036 (8.5%) | 683 (7.3%) |
| 35 to 39 Minutes | 131 (1.1%) | 118 (1.3%) |
| 40 to 44 Minutes | 76 (0.6%) | 76 (0.8%) |
| 45 to 59 Minutes | 245 (2.0%) | 81 (0.9%) |
| 60 to 89 Minutes | 309 (2.5%) | 132 (1.4%) |
| 90 or more Minutes | 263 (2.1%) | 172 (1.8%) |
Time of Departure to Work by Sex in Cathedral City
The most frequent times of departure to work in Cathedral City are 7:00 AM to 7:29 AM (2,133, 17.4%) for males and 7:00 AM to 7:29 AM (1,595, 17.1%) for females.
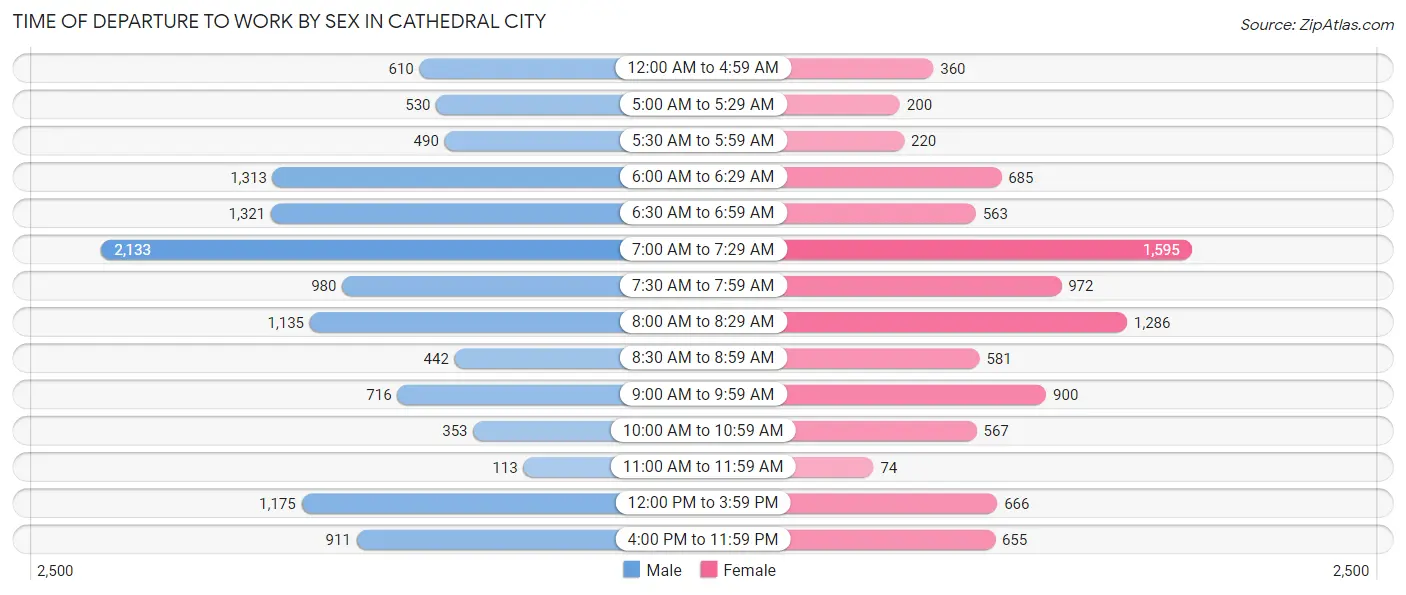
| Time of Departure | Male | Female |
| 12:00 AM to 4:59 AM | 610 (5.0%) | 360 (3.9%) |
| 5:00 AM to 5:29 AM | 530 (4.3%) | 200 (2.1%) |
| 5:30 AM to 5:59 AM | 490 (4.0%) | 220 (2.4%) |
| 6:00 AM to 6:29 AM | 1,313 (10.7%) | 685 (7.3%) |
| 6:30 AM to 6:59 AM | 1,321 (10.8%) | 563 (6.0%) |
| 7:00 AM to 7:29 AM | 2,133 (17.4%) | 1,595 (17.1%) |
| 7:30 AM to 7:59 AM | 980 (8.0%) | 972 (10.4%) |
| 8:00 AM to 8:29 AM | 1,135 (9.3%) | 1,286 (13.8%) |
| 8:30 AM to 8:59 AM | 442 (3.6%) | 581 (6.2%) |
| 9:00 AM to 9:59 AM | 716 (5.9%) | 900 (9.7%) |
| 10:00 AM to 10:59 AM | 353 (2.9%) | 567 (6.1%) |
| 11:00 AM to 11:59 AM | 113 (0.9%) | 74 (0.8%) |
| 12:00 PM to 3:59 PM | 1,175 (9.6%) | 666 (7.1%) |
| 4:00 PM to 11:59 PM | 911 (7.4%) | 655 (7.0%) |
| Total | 12,222 (100.0%) | 9,324 (100.0%) |
Housing Occupancy in Cathedral City
Occupancy by Ownership in Cathedral City
Of the total 18,868 dwellings in Cathedral City, owner-occupied units account for 12,133 (64.3%), while renter-occupied units make up 6,735 (35.7%).
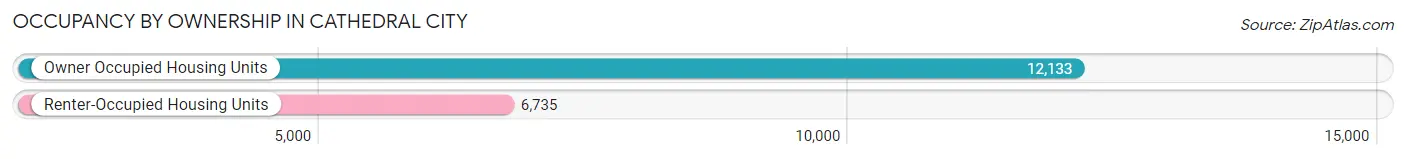
| Occupancy | # Housing Units | % Housing Units |
| Owner Occupied Housing Units | 12,133 | 64.3% |
| Renter-Occupied Housing Units | 6,735 | 35.7% |
| Total Occupied Housing Units | 18,868 | 100.0% |
Occupancy by Household Size in Cathedral City
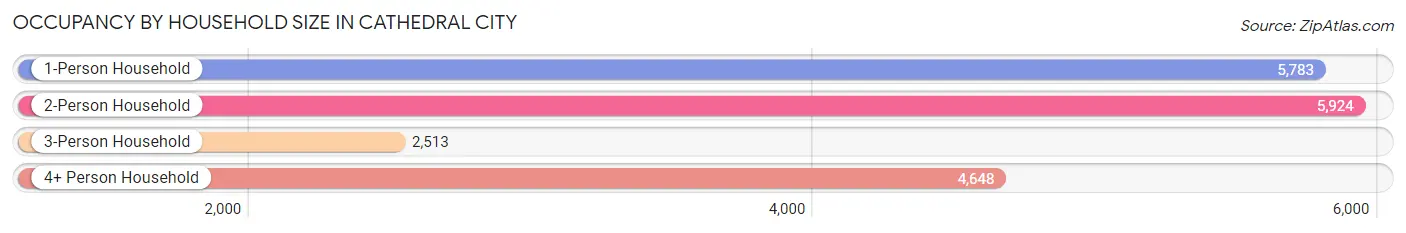
| Household Size | # Housing Units | % Housing Units |
| 1-Person Household | 5,783 | 30.6% |
| 2-Person Household | 5,924 | 31.4% |
| 3-Person Household | 2,513 | 13.3% |
| 4+ Person Household | 4,648 | 24.6% |
| Total Housing Units | 18,868 | 100.0% |
Occupancy by Ownership by Household Size in Cathedral City
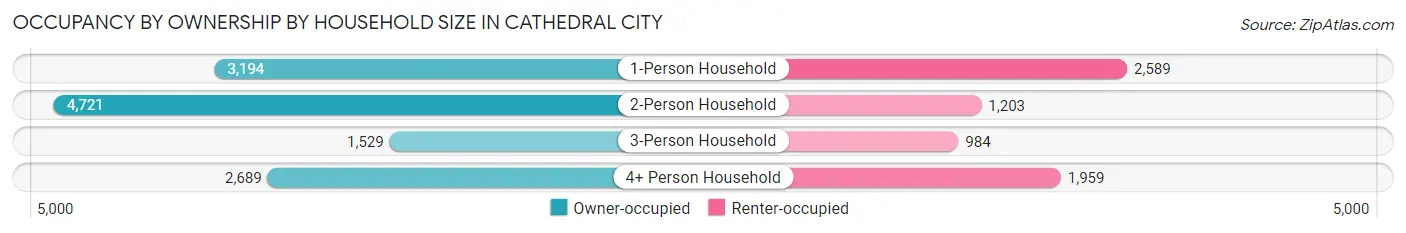
| Household Size | Owner-occupied | Renter-occupied |
| 1-Person Household | 3,194 (55.2%) | 2,589 (44.8%) |
| 2-Person Household | 4,721 (79.7%) | 1,203 (20.3%) |
| 3-Person Household | 1,529 (60.8%) | 984 (39.2%) |
| 4+ Person Household | 2,689 (57.9%) | 1,959 (42.1%) |
| Total Housing Units | 12,133 (64.3%) | 6,735 (35.7%) |
Occupancy by Educational Attainment in Cathedral City
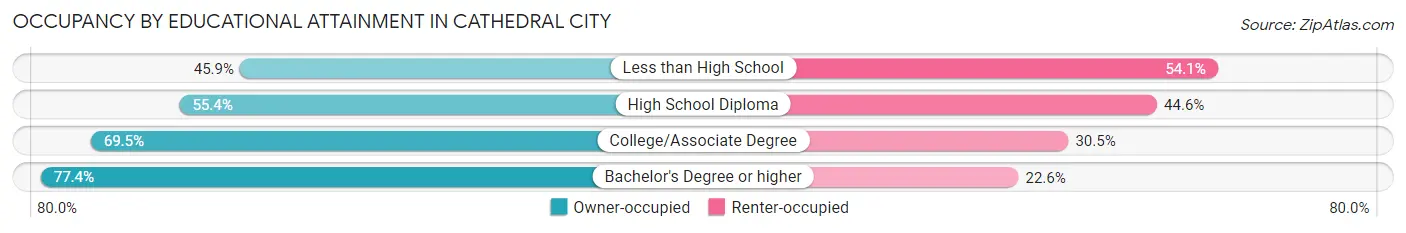
| Household Size | Owner-occupied | Renter-occupied |
| Less than High School | 1,523 (45.9%) | 1,797 (54.1%) |
| High School Diploma | 2,496 (55.4%) | 2,007 (44.6%) |
| College/Associate Degree | 3,832 (69.5%) | 1,682 (30.5%) |
| Bachelor's Degree or higher | 4,282 (77.4%) | 1,249 (22.6%) |
Occupancy by Age of Householder in Cathedral City
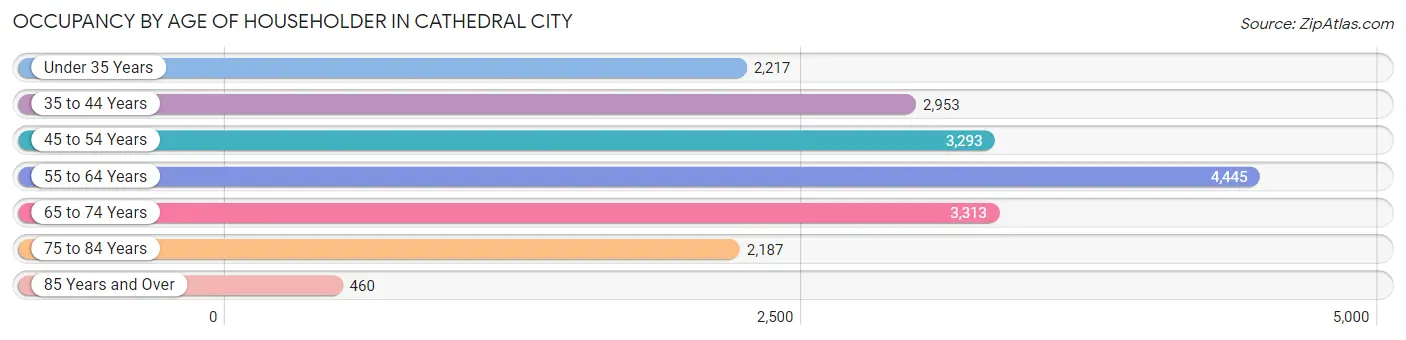
| Age Bracket | # Households | % Households |
| Under 35 Years | 2,217 | 11.7% |
| 35 to 44 Years | 2,953 | 15.7% |
| 45 to 54 Years | 3,293 | 17.4% |
| 55 to 64 Years | 4,445 | 23.6% |
| 65 to 74 Years | 3,313 | 17.6% |
| 75 to 84 Years | 2,187 | 11.6% |
| 85 Years and Over | 460 | 2.4% |
| Total | 18,868 | 100.0% |
Housing Finances in Cathedral City
Median Income by Occupancy in Cathedral City
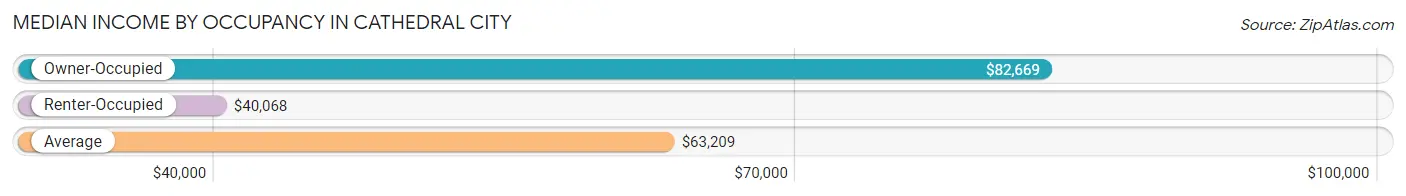
| Occupancy Type | # Households | Median Income |
| Owner-Occupied | 12,133 (64.3%) | $82,669 |
| Renter-Occupied | 6,735 (35.7%) | $40,068 |
| Average | 18,868 (100.0%) | $63,209 |
Occupancy by Householder Income Bracket in Cathedral City
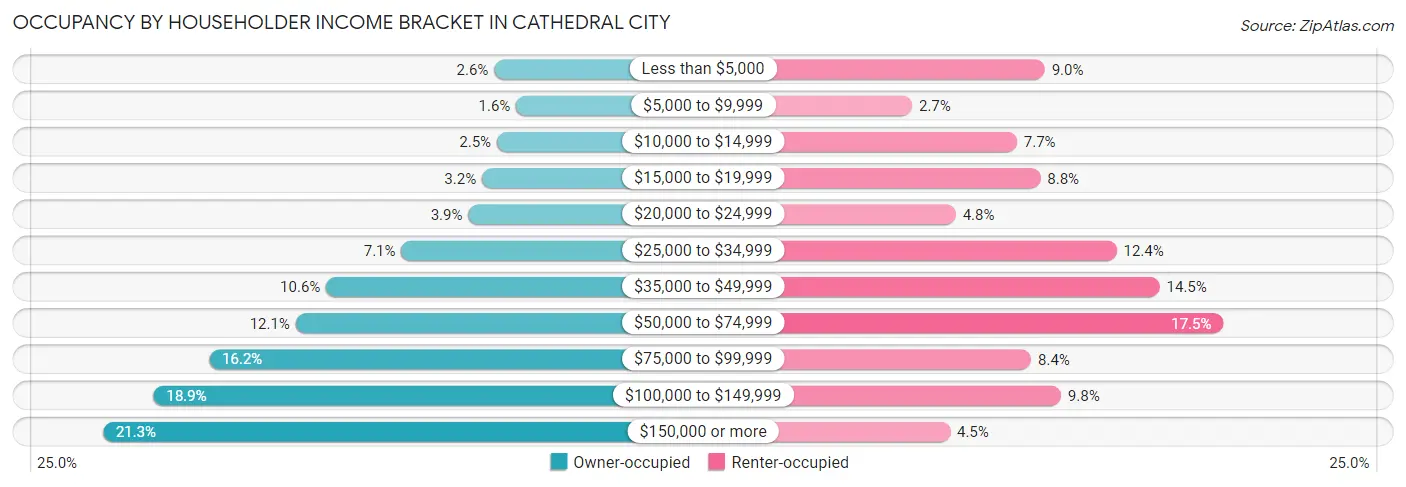
| Income Bracket | Owner-occupied | Renter-occupied |
| Less than $5,000 | 320 (2.6%) | 607 (9.0%) |
| $5,000 to $9,999 | 193 (1.6%) | 181 (2.7%) |
| $10,000 to $14,999 | 305 (2.5%) | 517 (7.7%) |
| $15,000 to $19,999 | 391 (3.2%) | 593 (8.8%) |
| $20,000 to $24,999 | 469 (3.9%) | 321 (4.8%) |
| $25,000 to $34,999 | 857 (7.1%) | 837 (12.4%) |
| $35,000 to $49,999 | 1,291 (10.6%) | 975 (14.5%) |
| $50,000 to $74,999 | 1,467 (12.1%) | 1,179 (17.5%) |
| $75,000 to $99,999 | 1,968 (16.2%) | 563 (8.4%) |
| $100,000 to $149,999 | 2,290 (18.9%) | 659 (9.8%) |
| $150,000 or more | 2,582 (21.3%) | 303 (4.5%) |
| Total | 12,133 (100.0%) | 6,735 (100.0%) |
Monthly Housing Cost Tiers in Cathedral City
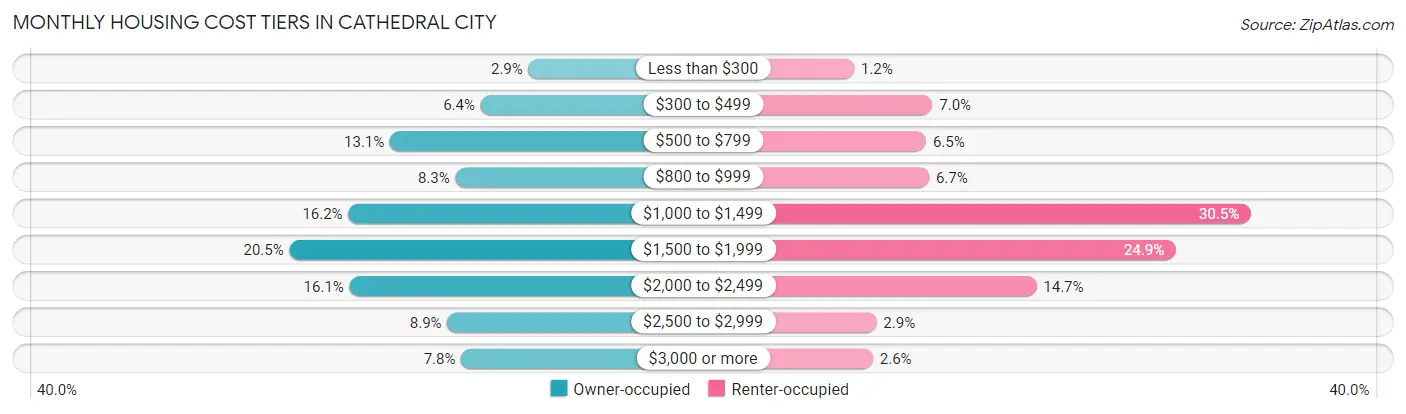
| Monthly Cost | Owner-occupied | Renter-occupied |
| Less than $300 | 349 (2.9%) | 82 (1.2%) |
| $300 to $499 | 776 (6.4%) | 471 (7.0%) |
| $500 to $799 | 1,587 (13.1%) | 439 (6.5%) |
| $800 to $999 | 1,002 (8.3%) | 454 (6.7%) |
| $1,000 to $1,499 | 1,959 (16.2%) | 2,052 (30.5%) |
| $1,500 to $1,999 | 2,486 (20.5%) | 1,680 (24.9%) |
| $2,000 to $2,499 | 1,948 (16.1%) | 987 (14.6%) |
| $2,500 to $2,999 | 1,075 (8.9%) | 193 (2.9%) |
| $3,000 or more | 951 (7.8%) | 176 (2.6%) |
| Total | 12,133 (100.0%) | 6,735 (100.0%) |
Physical Housing Characteristics in Cathedral City
Housing Structures in Cathedral City
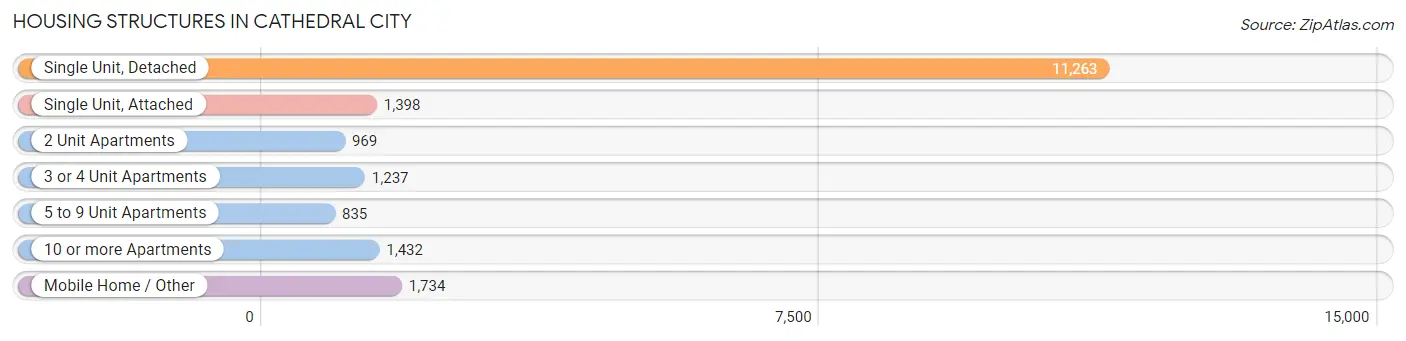
| Structure Type | # Housing Units | % Housing Units |
| Single Unit, Detached | 11,263 | 59.7% |
| Single Unit, Attached | 1,398 | 7.4% |
| 2 Unit Apartments | 969 | 5.1% |
| 3 or 4 Unit Apartments | 1,237 | 6.6% |
| 5 to 9 Unit Apartments | 835 | 4.4% |
| 10 or more Apartments | 1,432 | 7.6% |
| Mobile Home / Other | 1,734 | 9.2% |
| Total | 18,868 | 100.0% |
Housing Structures by Occupancy in Cathedral City
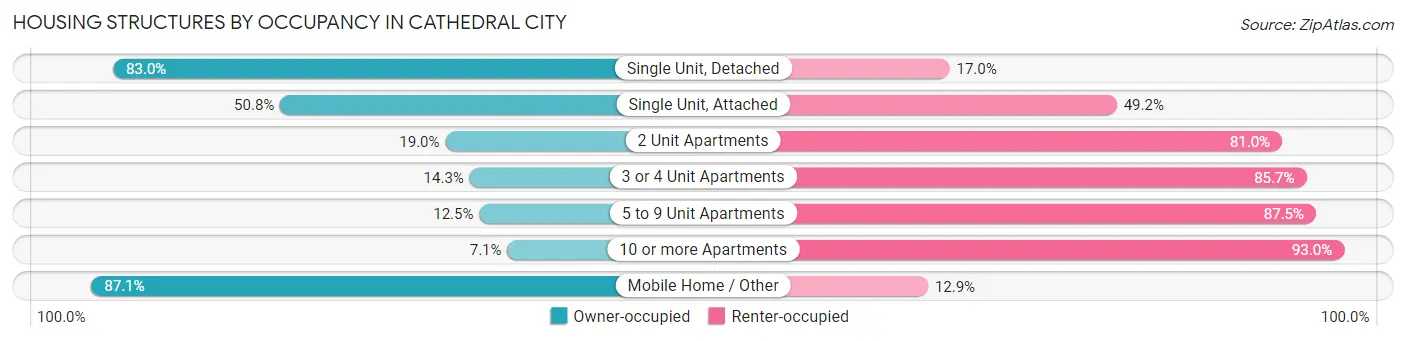
| Structure Type | Owner-occupied | Renter-occupied |
| Single Unit, Detached | 9,346 (83.0%) | 1,917 (17.0%) |
| Single Unit, Attached | 710 (50.8%) | 688 (49.2%) |
| 2 Unit Apartments | 184 (19.0%) | 785 (81.0%) |
| 3 or 4 Unit Apartments | 177 (14.3%) | 1,060 (85.7%) |
| 5 to 9 Unit Apartments | 104 (12.5%) | 731 (87.5%) |
| 10 or more Apartments | 101 (7.0%) | 1,331 (92.9%) |
| Mobile Home / Other | 1,511 (87.1%) | 223 (12.9%) |
| Total | 12,133 (64.3%) | 6,735 (35.7%) |
Housing Structures by Number of Rooms in Cathedral City
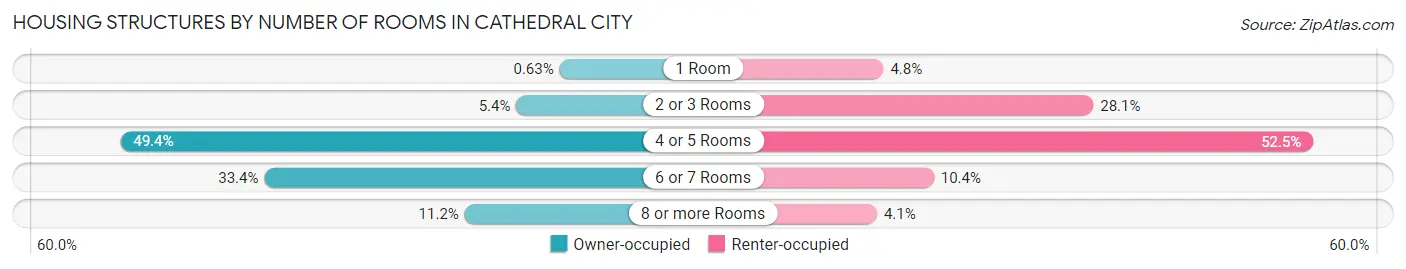
| Number of Rooms | Owner-occupied | Renter-occupied |
| 1 Room | 77 (0.6%) | 325 (4.8%) |
| 2 or 3 Rooms | 659 (5.4%) | 1,894 (28.1%) |
| 4 or 5 Rooms | 5,991 (49.4%) | 3,537 (52.5%) |
| 6 or 7 Rooms | 4,052 (33.4%) | 702 (10.4%) |
| 8 or more Rooms | 1,354 (11.2%) | 277 (4.1%) |
| Total | 12,133 (100.0%) | 6,735 (100.0%) |
Housing Structure by Heating Type in Cathedral City
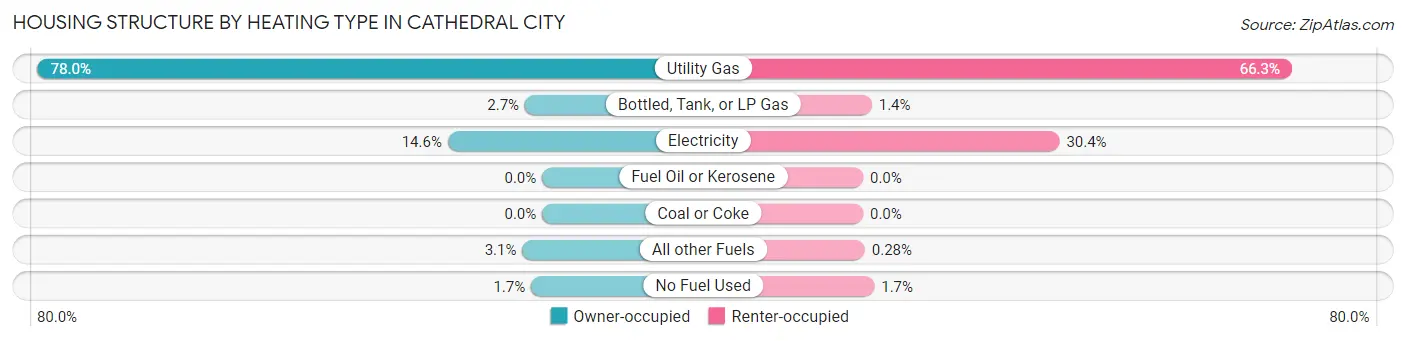
| Heating Type | Owner-occupied | Renter-occupied |
| Utility Gas | 9,461 (78.0%) | 4,463 (66.3%) |
| Bottled, Tank, or LP Gas | 323 (2.7%) | 91 (1.3%) |
| Electricity | 1,770 (14.6%) | 2,045 (30.4%) |
| Fuel Oil or Kerosene | 0 (0.0%) | 0 (0.0%) |
| Coal or Coke | 0 (0.0%) | 0 (0.0%) |
| All other Fuels | 371 (3.1%) | 19 (0.3%) |
| No Fuel Used | 208 (1.7%) | 117 (1.7%) |
| Total | 12,133 (100.0%) | 6,735 (100.0%) |
Household Vehicle Usage in Cathedral City
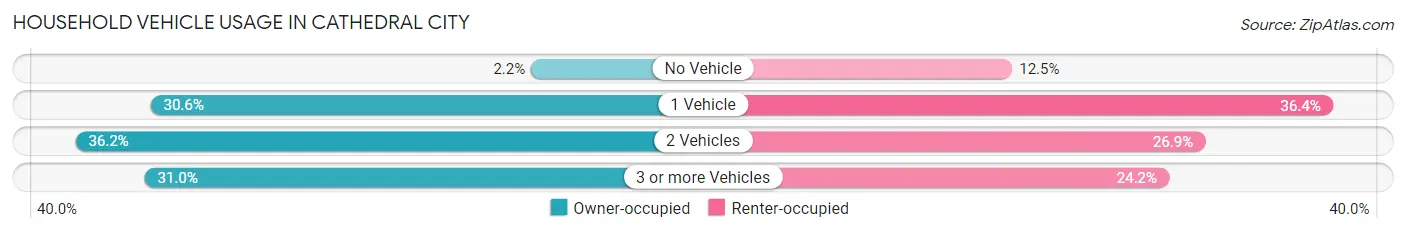
| Vehicles per Household | Owner-occupied | Renter-occupied |
| No Vehicle | 264 (2.2%) | 842 (12.5%) |
| 1 Vehicle | 3,711 (30.6%) | 2,453 (36.4%) |
| 2 Vehicles | 4,392 (36.2%) | 1,811 (26.9%) |
| 3 or more Vehicles | 3,766 (31.0%) | 1,629 (24.2%) |
| Total | 12,133 (100.0%) | 6,735 (100.0%) |
Real Estate & Mortgages in Cathedral City
Real Estate and Mortgage Overview in Cathedral City
| Characteristic | Without Mortgage | With Mortgage |
| Housing Units | 4,787 | 7,346 |
| Median Property Value | $320,700 | $412,000 |
| Median Household Income | $58,430 | $1,773 |
| Monthly Housing Costs | $767 | $871 |
| Real Estate Taxes | $2,763 | $200 |
Property Value by Mortgage Status in Cathedral City
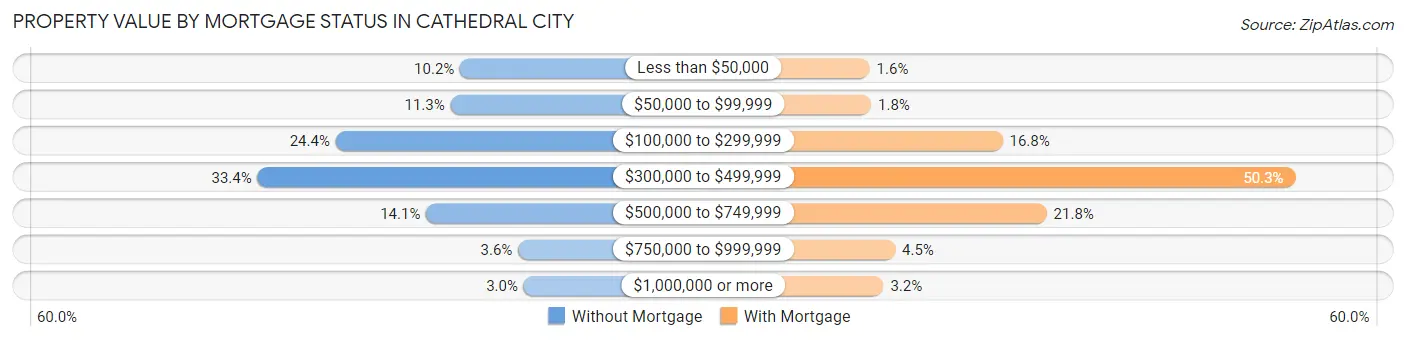
| Property Value | Without Mortgage | With Mortgage |
| Less than $50,000 | 489 (10.2%) | 118 (1.6%) |
| $50,000 to $99,999 | 542 (11.3%) | 131 (1.8%) |
| $100,000 to $299,999 | 1,170 (24.4%) | 1,234 (16.8%) |
| $300,000 to $499,999 | 1,598 (33.4%) | 3,693 (50.3%) |
| $500,000 to $749,999 | 675 (14.1%) | 1,604 (21.8%) |
| $750,000 to $999,999 | 172 (3.6%) | 332 (4.5%) |
| $1,000,000 or more | 141 (2.9%) | 234 (3.2%) |
| Total | 4,787 (100.0%) | 7,346 (100.0%) |
Household Income by Mortgage Status in Cathedral City
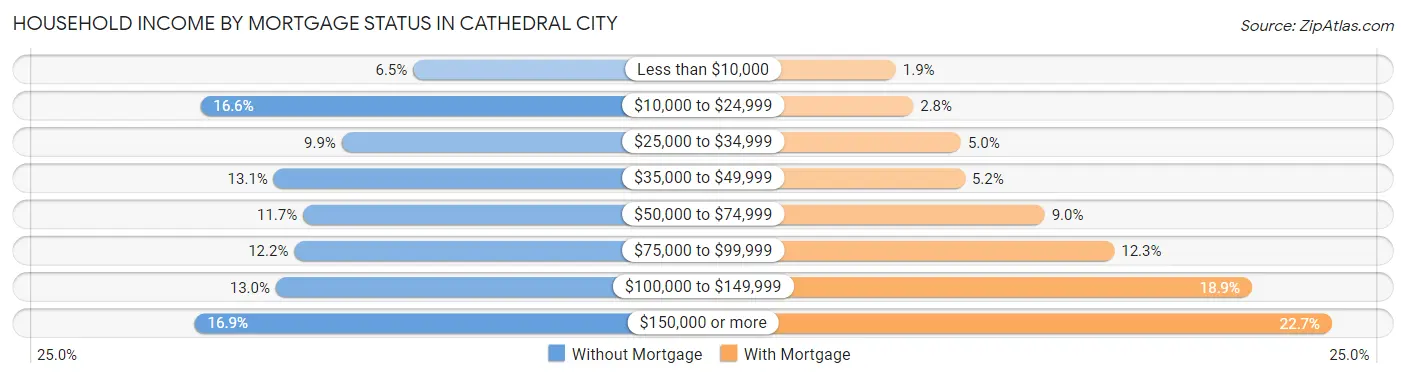
| Household Income | Without Mortgage | With Mortgage |
| Less than $10,000 | 311 (6.5%) | 141 (1.9%) |
| $10,000 to $24,999 | 796 (16.6%) | 202 (2.8%) |
| $25,000 to $34,999 | 474 (9.9%) | 369 (5.0%) |
| $35,000 to $49,999 | 629 (13.1%) | 383 (5.2%) |
| $50,000 to $74,999 | 562 (11.7%) | 662 (9.0%) |
| $75,000 to $99,999 | 582 (12.2%) | 905 (12.3%) |
| $100,000 to $149,999 | 624 (13.0%) | 1,386 (18.9%) |
| $150,000 or more | 809 (16.9%) | 1,666 (22.7%) |
| Total | 4,787 (100.0%) | 7,346 (100.0%) |
Property Value to Household Income Ratio in Cathedral City
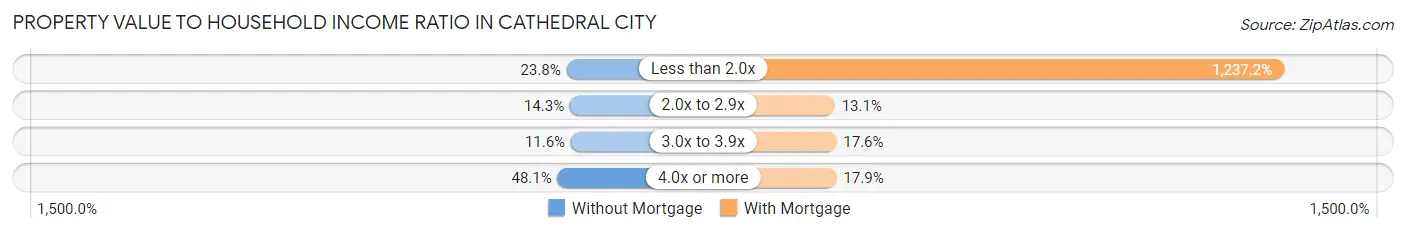
| Value-to-Income Ratio | Without Mortgage | With Mortgage |
| Less than 2.0x | 1,140 (23.8%) | 90,886 (1,237.2%) |
| 2.0x to 2.9x | 683 (14.3%) | 959 (13.1%) |
| 3.0x to 3.9x | 556 (11.6%) | 1,292 (17.6%) |
| 4.0x or more | 2,303 (48.1%) | 1,315 (17.9%) |
| Total | 4,787 (100.0%) | 7,346 (100.0%) |
Real Estate Taxes by Mortgage Status in Cathedral City
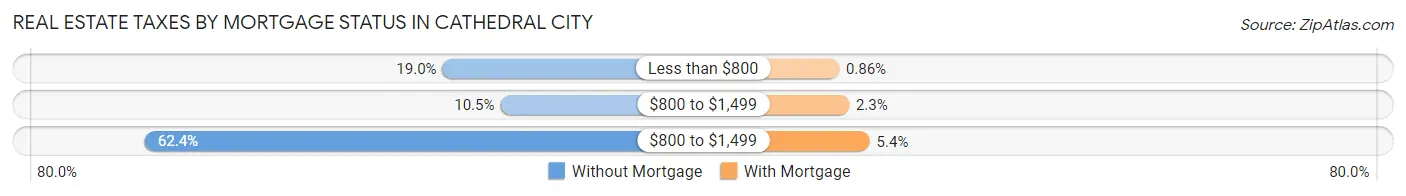
| Property Taxes | Without Mortgage | With Mortgage |
| Less than $800 | 907 (19.0%) | 63 (0.9%) |
| $800 to $1,499 | 502 (10.5%) | 171 (2.3%) |
| $800 to $1,499 | 2,988 (62.4%) | 393 (5.3%) |
| Total | 4,787 (100.0%) | 7,346 (100.0%) |
Health & Disability in Cathedral City
Health Insurance Coverage by Age in Cathedral City
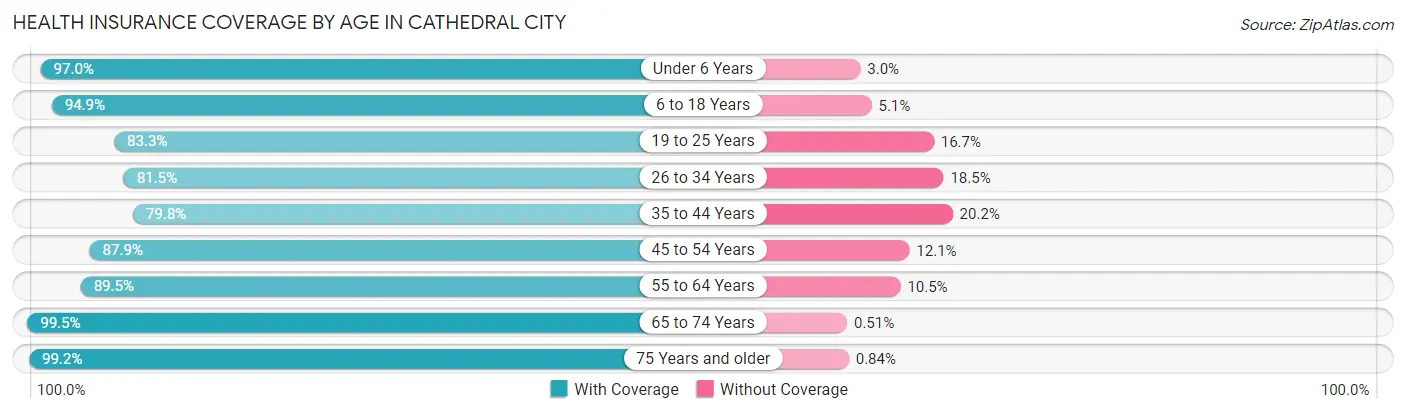
| Age Bracket | With Coverage | Without Coverage |
| Under 6 Years | 2,974 (97.0%) | 92 (3.0%) |
| 6 to 18 Years | 7,844 (94.9%) | 420 (5.1%) |
| 19 to 25 Years | 3,709 (83.3%) | 743 (16.7%) |
| 26 to 34 Years | 4,947 (81.5%) | 1,123 (18.5%) |
| 35 to 44 Years | 5,255 (79.8%) | 1,331 (20.2%) |
| 45 to 54 Years | 5,571 (87.9%) | 770 (12.1%) |
| 55 to 64 Years | 6,995 (89.5%) | 818 (10.5%) |
| 65 to 74 Years | 5,079 (99.5%) | 26 (0.5%) |
| 75 Years and older | 4,141 (99.2%) | 35 (0.8%) |
| Total | 46,515 (89.7%) | 5,358 (10.3%) |
Health Insurance Coverage by Citizenship Status in Cathedral City
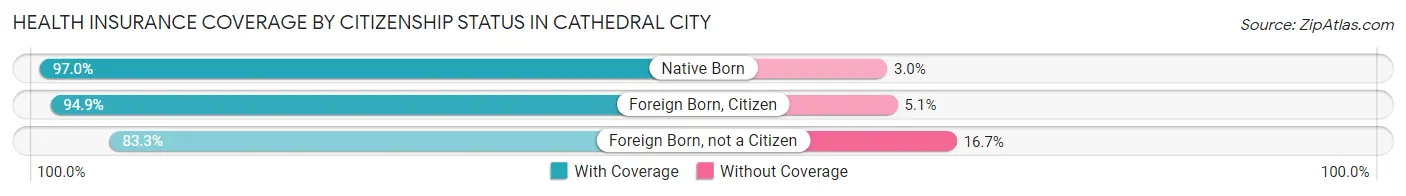
| Citizenship Status | With Coverage | Without Coverage |
| Native Born | 2,974 (97.0%) | 92 (3.0%) |
| Foreign Born, Citizen | 7,844 (94.9%) | 420 (5.1%) |
| Foreign Born, not a Citizen | 3,709 (83.3%) | 743 (16.7%) |
Health Insurance Coverage by Household Income in Cathedral City
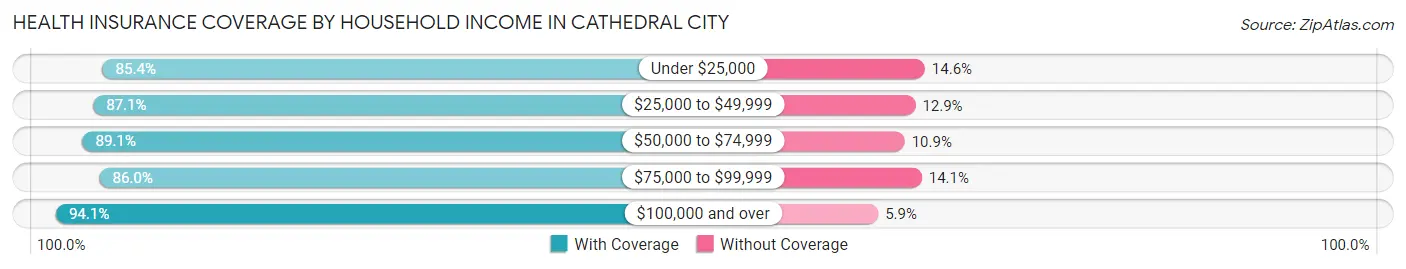
| Household Income | With Coverage | Without Coverage |
| Under $25,000 | 5,717 (85.4%) | 980 (14.6%) |
| $25,000 to $49,999 | 9,127 (87.1%) | 1,347 (12.9%) |
| $50,000 to $74,999 | 6,195 (89.1%) | 755 (10.9%) |
| $75,000 to $99,999 | 6,900 (86.0%) | 1,128 (14.1%) |
| $100,000 and over | 18,123 (94.1%) | 1,134 (5.9%) |
Public vs Private Health Insurance Coverage by Age in Cathedral City
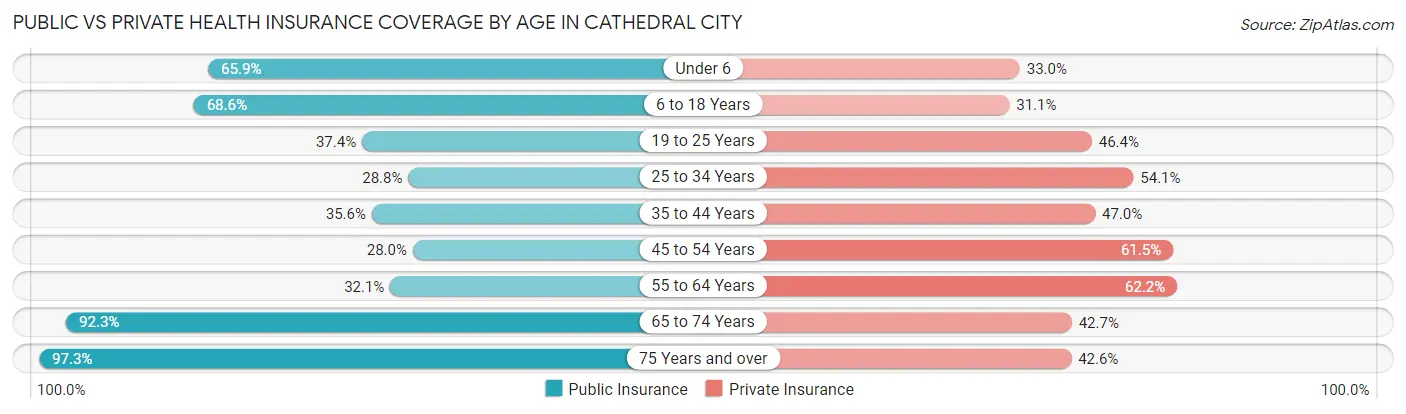
| Age Bracket | Public Insurance | Private Insurance |
| Under 6 | 2,021 (65.9%) | 1,013 (33.0%) |
| 6 to 18 Years | 5,669 (68.6%) | 2,569 (31.1%) |
| 19 to 25 Years | 1,664 (37.4%) | 2,066 (46.4%) |
| 25 to 34 Years | 1,747 (28.8%) | 3,285 (54.1%) |
| 35 to 44 Years | 2,341 (35.5%) | 3,096 (47.0%) |
| 45 to 54 Years | 1,772 (28.0%) | 3,898 (61.5%) |
| 55 to 64 Years | 2,511 (32.1%) | 4,862 (62.2%) |
| 65 to 74 Years | 4,711 (92.3%) | 2,179 (42.7%) |
| 75 Years and over | 4,063 (97.3%) | 1,778 (42.6%) |
| Total | 26,499 (51.1%) | 24,746 (47.7%) |
Disability Status by Sex by Age in Cathedral City
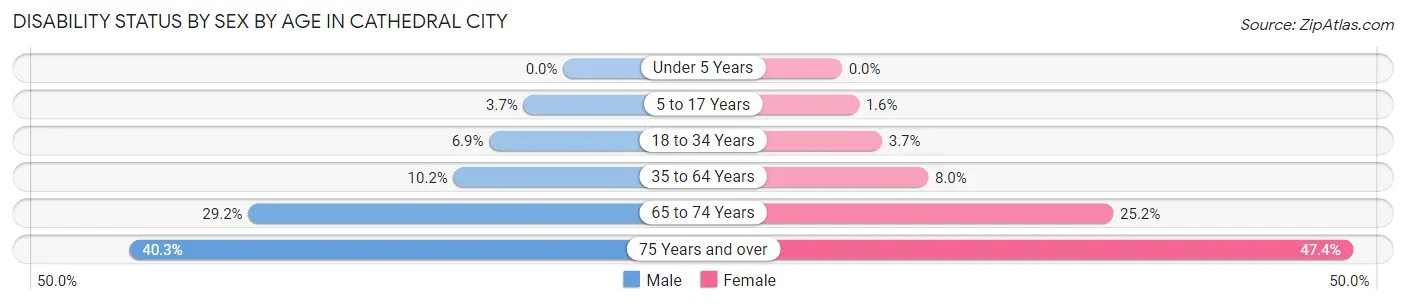
| Age Bracket | Male | Female |
| Under 5 Years | 0 (0.0%) | 0 (0.0%) |
| 5 to 17 Years | 141 (3.7%) | 64 (1.6%) |
| 18 to 34 Years | 414 (6.9%) | 198 (3.7%) |
| 35 to 64 Years | 1,122 (10.2%) | 778 (8.0%) |
| 65 to 74 Years | 848 (29.2%) | 555 (25.2%) |
| 75 Years and over | 754 (40.3%) | 1,092 (47.4%) |
Disability Class by Sex by Age in Cathedral City
Disability Class: Hearing Difficulty
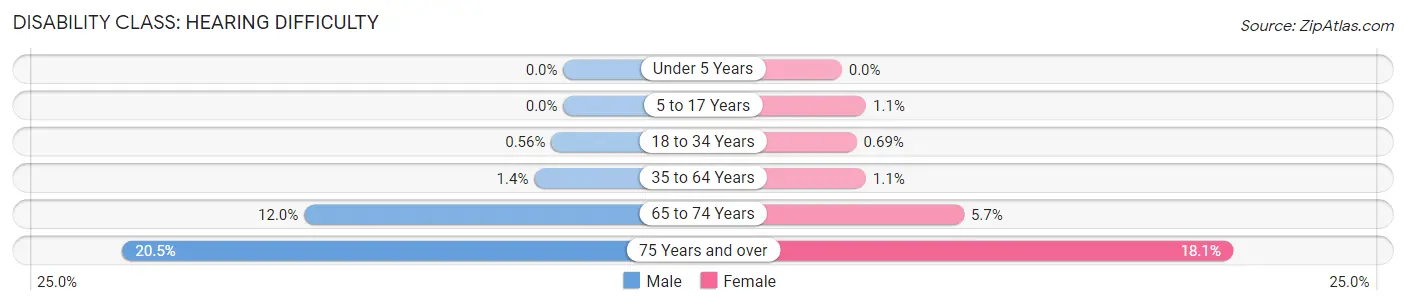
| Age Bracket | Male | Female |
| Under 5 Years | 0 (0.0%) | 0 (0.0%) |
| 5 to 17 Years | 0 (0.0%) | 46 (1.1%) |
| 18 to 34 Years | 34 (0.6%) | 37 (0.7%) |
| 35 to 64 Years | 149 (1.3%) | 109 (1.1%) |
| 65 to 74 Years | 349 (12.0%) | 125 (5.7%) |
| 75 Years and over | 383 (20.5%) | 418 (18.1%) |
Disability Class: Vision Difficulty
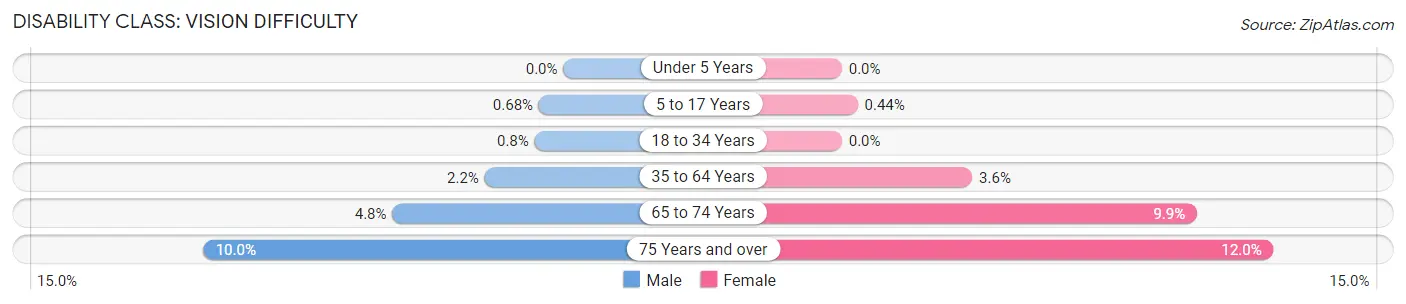
| Age Bracket | Male | Female |
| Under 5 Years | 0 (0.0%) | 0 (0.0%) |
| 5 to 17 Years | 26 (0.7%) | 18 (0.4%) |
| 18 to 34 Years | 48 (0.8%) | 0 (0.0%) |
| 35 to 64 Years | 241 (2.2%) | 353 (3.6%) |
| 65 to 74 Years | 138 (4.8%) | 218 (9.9%) |
| 75 Years and over | 188 (10.0%) | 277 (12.0%) |
Disability Class: Cognitive Difficulty
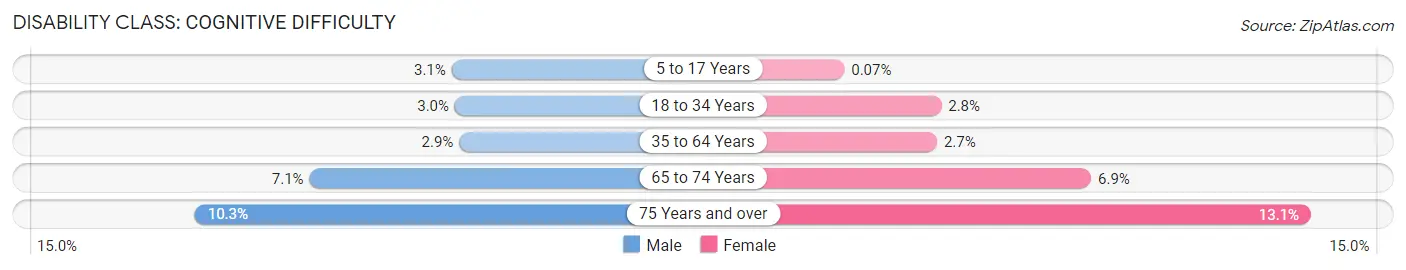
| Age Bracket | Male | Female |
| 5 to 17 Years | 119 (3.1%) | 3 (0.1%) |
| 18 to 34 Years | 182 (3.0%) | 148 (2.8%) |
| 35 to 64 Years | 320 (2.9%) | 258 (2.6%) |
| 65 to 74 Years | 205 (7.1%) | 153 (6.9%) |
| 75 Years and over | 192 (10.3%) | 301 (13.1%) |
Disability Class: Ambulatory Difficulty
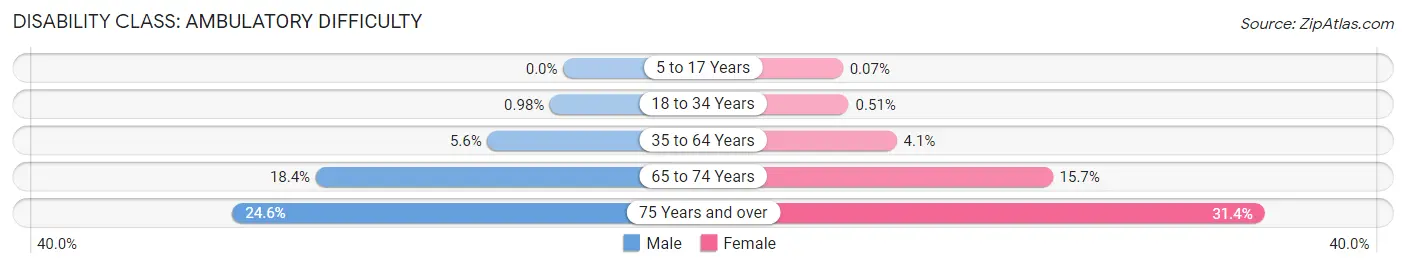
| Age Bracket | Male | Female |
| 5 to 17 Years | 0 (0.0%) | 3 (0.1%) |
| 18 to 34 Years | 59 (1.0%) | 27 (0.5%) |
| 35 to 64 Years | 620 (5.6%) | 396 (4.1%) |
| 65 to 74 Years | 533 (18.4%) | 345 (15.7%) |
| 75 Years and over | 460 (24.6%) | 723 (31.4%) |
Disability Class: Self-Care Difficulty
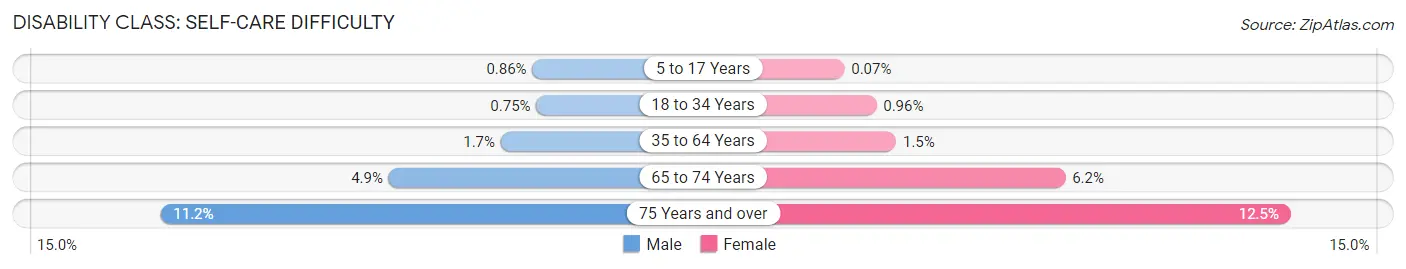
| Age Bracket | Male | Female |
| 5 to 17 Years | 33 (0.9%) | 3 (0.1%) |
| 18 to 34 Years | 45 (0.7%) | 51 (1.0%) |
| 35 to 64 Years | 192 (1.7%) | 147 (1.5%) |
| 65 to 74 Years | 141 (4.9%) | 137 (6.2%) |
| 75 Years and over | 210 (11.2%) | 288 (12.5%) |
Technology Access in Cathedral City
Computing Device Access in Cathedral City
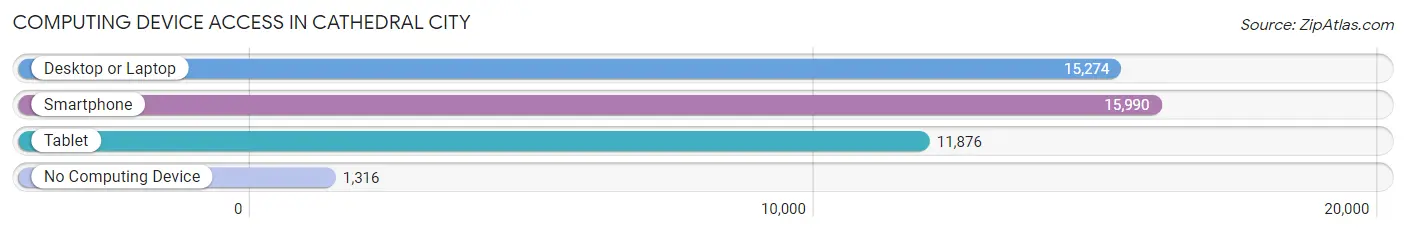
| Device Type | # Households | % Households |
| Desktop or Laptop | 15,274 | 80.9% |
| Smartphone | 15,990 | 84.8% |
| Tablet | 11,876 | 62.9% |
| No Computing Device | 1,316 | 7.0% |
| Total | 18,868 | 100.0% |
Internet Access in Cathedral City
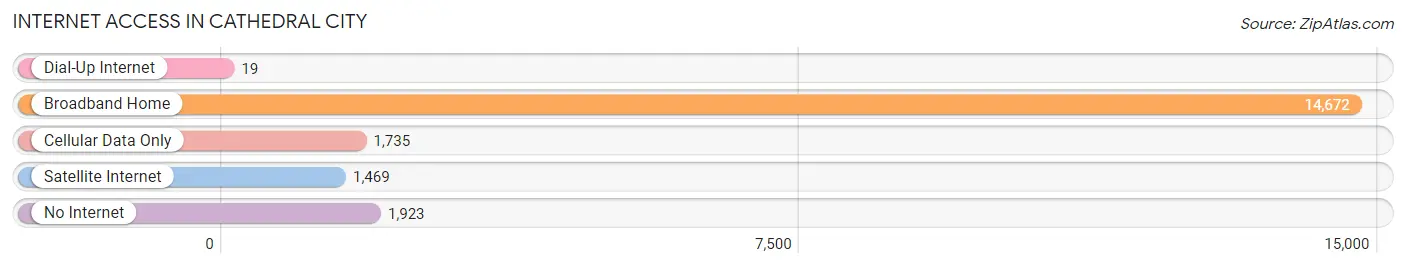
| Internet Type | # Households | % Households |
| Dial-Up Internet | 19 | 0.1% |
| Broadband Home | 14,672 | 77.8% |
| Cellular Data Only | 1,735 | 9.2% |
| Satellite Internet | 1,469 | 7.8% |
| No Internet | 1,923 | 10.2% |
| Total | 18,868 | 100.0% |
Cathedral City Summary
Cathedral City is a city located in Riverside County, California, United States. It is situated in the Coachella Valley, approximately 11 miles east of Palm Springs and 122 miles east of Los Angeles. The city was incorporated in 1981 and has a population of 54,364 as of the 2010 census.
History
The area that is now Cathedral City was originally inhabited by the Cahuilla Indians. The first non-native settlers arrived in the area in the late 1800s, and the area was known as "Cathedral City" due to its resemblance to a cathedral. The city was officially incorporated in 1981.
Geography
Cathedral City is located in the Coachella Valley, which is part of the Sonoran Desert. The city is situated at the base of the San Jacinto Mountains, and is bordered by Palm Springs to the west, Rancho Mirage to the north, and Desert Hot Springs to the east. The city covers an area of 24.3 square miles, and has an elevation of 545 feet.
Climate
Cathedral City has a hot desert climate, with hot summers and mild winters. The average high temperature in the summer is around 100°F, and the average low temperature in the winter is around 50°F. The city receives an average of 4.5 inches of precipitation per year.
Economy
The economy of Cathedral City is largely based on tourism and retail. The city is home to several resorts and golf courses, as well as a variety of shopping centers and restaurants. The city is also home to several manufacturing and technology companies, including the headquarters of the Coachella Valley Water District.
Demographics
As of the 2010 census, the population of Cathedral City was 54,364. The racial makeup of the city was 68.3% White, 5.2% African American, 0.7% Native American, 2.2% Asian, 0.1% Pacific Islander, 20.2% from other races, and 3.3% from two or more races. Hispanic or Latino of any race were 40.2% of the population.
The median household income in Cathedral City was $45,845, and the median family income was $50,945. The per capita income was $25,845. About 15.3% of the population was below the poverty line.
Conclusion
Cathedral City is a city located in Riverside County, California, United States. It is situated in the Coachella Valley, approximately 11 miles east of Palm Springs and 122 miles east of Los Angeles. The city was incorporated in 1981 and has a population of 54,364 as of the 2010 census. The economy of Cathedral City is largely based on tourism and retail, and the city is home to several resorts and golf courses, as well as a variety of shopping centers and restaurants. The racial makeup of the city was 68.3% White, 5.2% African American, 0.7% Native American, 2.2% Asian, 0.1% Pacific Islander, 20.2% from other races, and 3.3% from two or more races. The median household income in Cathedral City was $45,845, and the median family income was $50,945.
Common Questions
What is Per Capita Income in Cathedral City?
Per Capita income in Cathedral City is $34,807.
What is the Median Family Income in Cathedral City?
Median Family Income in Cathedral City is $79,866.
What is the Median Household income in Cathedral City?
Median Household Income in Cathedral City is $63,209.
What is Income or Wage Gap in Cathedral City?
Income or Wage Gap in Cathedral City is 13.7%.
Women in Cathedral City earn 86.3 cents for every dollar earned by a man.
What is Family Income Deficit in Cathedral City?
Family Income Deficit in Cathedral City is $9,745.
Families that are below poverty line in Cathedral City earn $9,745 less on average than the poverty threshold level.
What is Inequality or Gini Index in Cathedral City?
Inequality or Gini Index in Cathedral City is 0.50.
What is the Total Population of Cathedral City?
Total Population of Cathedral City is 51,964.
What is the Total Male Population of Cathedral City?
Total Male Population of Cathedral City is 26,823.
What is the Total Female Population of Cathedral City?
Total Female Population of Cathedral City is 25,141.
What is the Ratio of Males per 100 Females in Cathedral City?
There are 106.69 Males per 100 Females in Cathedral City.
What is the Ratio of Females per 100 Males in Cathedral City?
There are 93.73 Females per 100 Males in Cathedral City.
What is the Median Population Age in Cathedral City?
Median Population Age in Cathedral City is 40.5 Years.
What is the Average Family Size in Cathedral City
Average Family Size in Cathedral City is 3.5 People.
What is the Average Household Size in Cathedral City
Average Household Size in Cathedral City is 2.7 People.
How Large is the Labor Force in Cathedral City?
There are 25,437 People in the Labor Forcein in Cathedral City.
What is the Percentage of People in the Labor Force in Cathedral City?
59.3% of People are in the Labor Force in Cathedral City.
What is the Unemployment Rate in Cathedral City?
Unemployment Rate in Cathedral City is 6.2%.