Bloomfield, CA Map & Demographics
Bloomfield Map
Bloomfield Overview
$55,843
PER CAPITA INCOME
$155,357
AVG FAMILY INCOME
$124,250
AVG HOUSEHOLD INCOME
0.41
INEQUALITY / GINI INDEX
197
TOTAL POPULATION
66
MALE POPULATION
131
FEMALE POPULATION
50.38
MALES / 100 FEMALES
198.48
FEMALES / 100 MALES
51.6
MEDIAN AGE
2.9
AVG FAMILY SIZE
2.1
AVG HOUSEHOLD SIZE
120
LABOR FORCE [ PEOPLE ]
71.0%
PERCENT IN LABOR FORCE
Income in Bloomfield
Income Overview in Bloomfield
Per Capita Income in Bloomfield is $55,843, while median incomes of families and households are $155,357 and $124,250 respectively.
| Characteristic | Number | Measure |
| Per Capita Income | 197 | $55,843 |
| Median Family Income | 44 | $155,357 |
| Mean Family Income | 44 | $183,439 |
| Median Household Income | 95 | $124,250 |
| Mean Household Income | 95 | $117,053 |
| Income Deficit | 44 | $0 |
| Wage / Income Gap (%) | 197 | 0.00% |
| Wage / Income Gap ($) | 197 | 100.00¢ per $1 |
| Gini / Inequality Index | 197 | 0.41 |
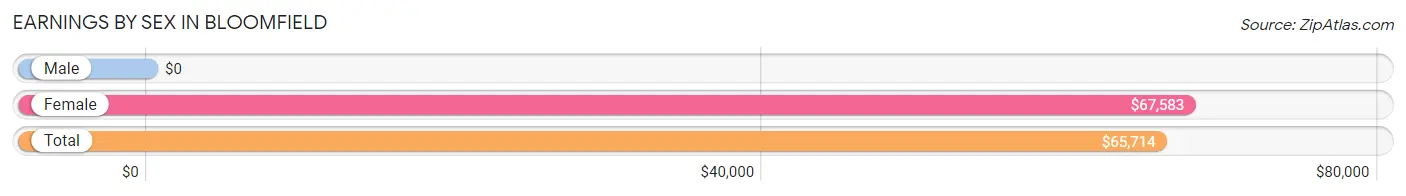
Earnings by Sex in Bloomfield
| Sex | Number | Average Earnings |
| Male | 57 (47.5%) | $0 |
| Female | 63 (52.5%) | $67,583 |
| Total | 120 (100.0%) | $65,714 |
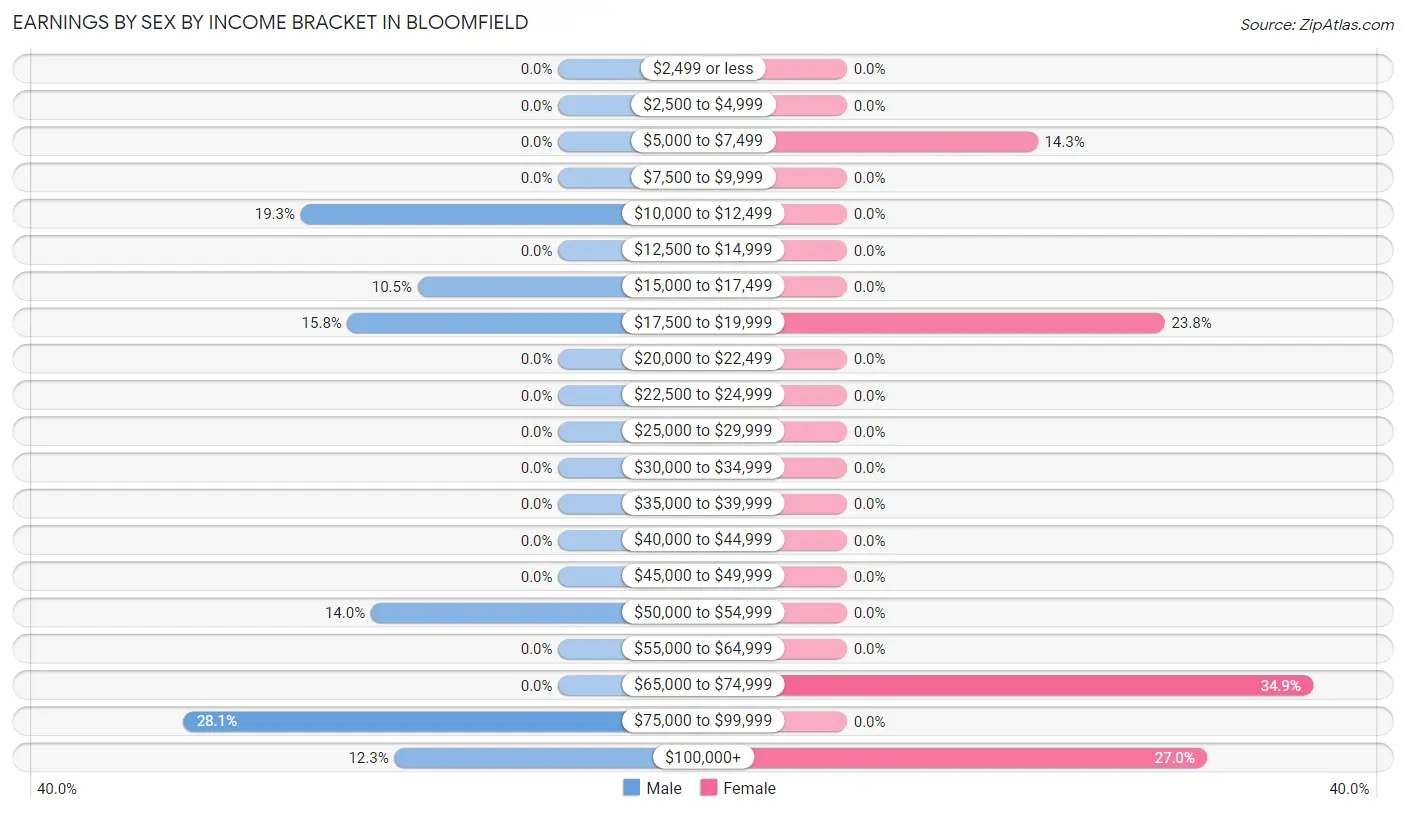
Earnings by Sex by Income Bracket in Bloomfield
The most common earnings brackets in Bloomfield are $75,000 to $99,999 for men (16 | 28.1%) and $65,000 to $74,999 for women (22 | 34.9%).
| Income | Male | Female |
| $2,499 or less | 0 (0.0%) | 0 (0.0%) |
| $2,500 to $4,999 | 0 (0.0%) | 0 (0.0%) |
| $5,000 to $7,499 | 0 (0.0%) | 9 (14.3%) |
| $7,500 to $9,999 | 0 (0.0%) | 0 (0.0%) |
| $10,000 to $12,499 | 11 (19.3%) | 0 (0.0%) |
| $12,500 to $14,999 | 0 (0.0%) | 0 (0.0%) |
| $15,000 to $17,499 | 6 (10.5%) | 0 (0.0%) |
| $17,500 to $19,999 | 9 (15.8%) | 15 (23.8%) |
| $20,000 to $22,499 | 0 (0.0%) | 0 (0.0%) |
| $22,500 to $24,999 | 0 (0.0%) | 0 (0.0%) |
| $25,000 to $29,999 | 0 (0.0%) | 0 (0.0%) |
| $30,000 to $34,999 | 0 (0.0%) | 0 (0.0%) |
| $35,000 to $39,999 | 0 (0.0%) | 0 (0.0%) |
| $40,000 to $44,999 | 0 (0.0%) | 0 (0.0%) |
| $45,000 to $49,999 | 0 (0.0%) | 0 (0.0%) |
| $50,000 to $54,999 | 8 (14.0%) | 0 (0.0%) |
| $55,000 to $64,999 | 0 (0.0%) | 0 (0.0%) |
| $65,000 to $74,999 | 0 (0.0%) | 22 (34.9%) |
| $75,000 to $99,999 | 16 (28.1%) | 0 (0.0%) |
| $100,000+ | 7 (12.3%) | 17 (27.0%) |
| Total | 57 (100.0%) | 63 (100.0%) |
Earnings by Sex by Educational Attainment in Bloomfield
| Educational Attainment | Male Income | Female Income |
| Less than High School | - | - |
| High School Diploma | - | - |
| College or Associate's Degree | - | - |
| Bachelor's Degree | - | - |
| Graduate Degree | - | - |
| Total | - | - |
Family Income in Bloomfield
Family Income Brackets in Bloomfield
According to the Bloomfield family income data, there are 21 families falling into the $100,000 to $149,999 income range, which is the most common income bracket and makes up 47.7% of all families.
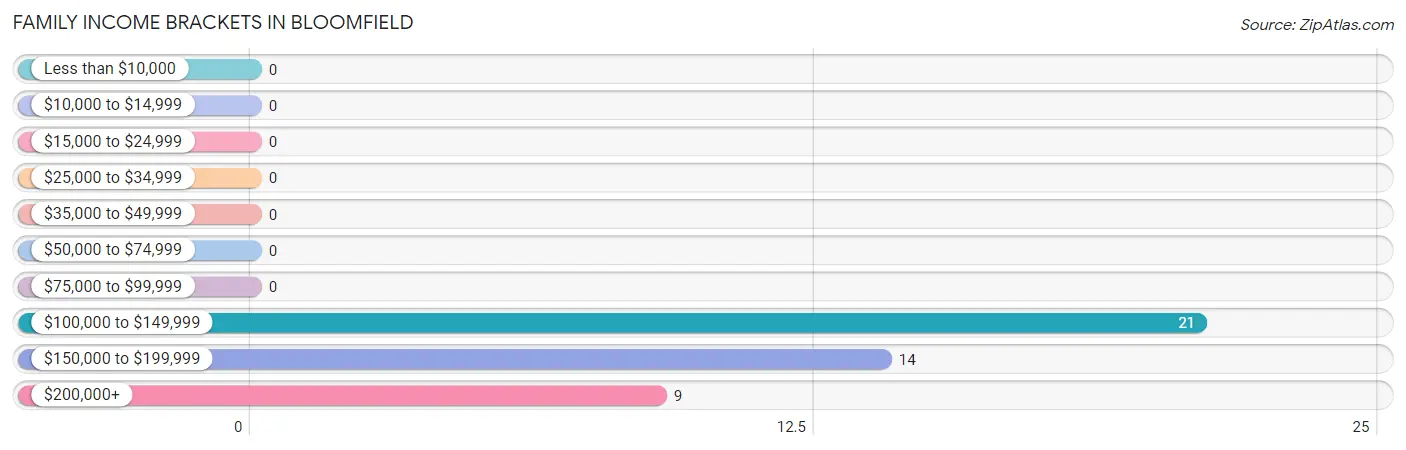
| Income Bracket | # Families | % Families |
| Less than $10,000 | 0 | 0.0% |
| $10,000 to $14,999 | 0 | 0.0% |
| $15,000 to $24,999 | 0 | 0.0% |
| $25,000 to $34,999 | 0 | 0.0% |
| $35,000 to $49,999 | 0 | 0.0% |
| $50,000 to $74,999 | 0 | 0.0% |
| $75,000 to $99,999 | 0 | 0.0% |
| $100,000 to $149,999 | 21 | 47.7% |
| $150,000 to $199,999 | 14 | 31.8% |
| $200,000+ | 9 | 20.5% |
Family Income by Famaliy Size in Bloomfield
2-person families (28 | 63.6%) account for the highest median family income in Bloomfield with $140,313 per family, while 2-person families (28 | 63.6%) have the highest median income of $70,156 per family member.
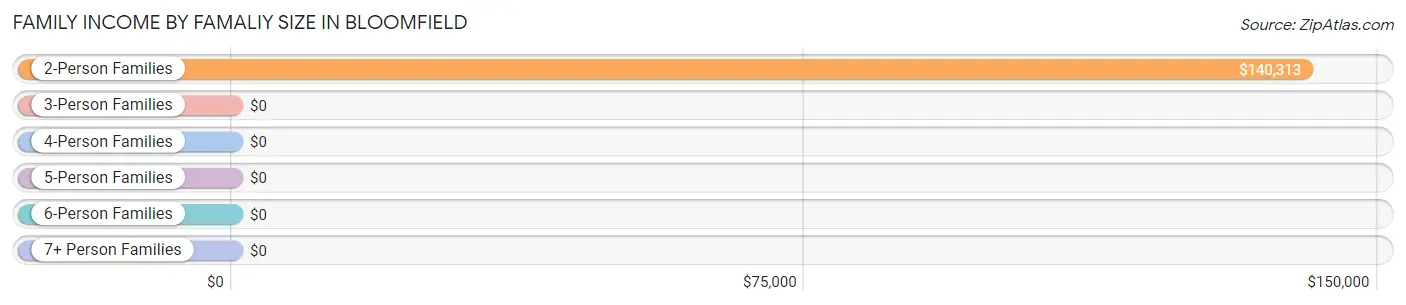
| Income Bracket | # Families | Median Income |
| 2-Person Families | 28 (63.6%) | $140,313 |
| 3-Person Families | 7 (15.9%) | $0 |
| 4-Person Families | 0 (0.0%) | $0 |
| 5-Person Families | 9 (20.4%) | $0 |
| 6-Person Families | 0 (0.0%) | $0 |
| 7+ Person Families | 0 (0.0%) | $0 |
| Total | 44 (100.0%) | $155,357 |
Family Income by Number of Earners in Bloomfield
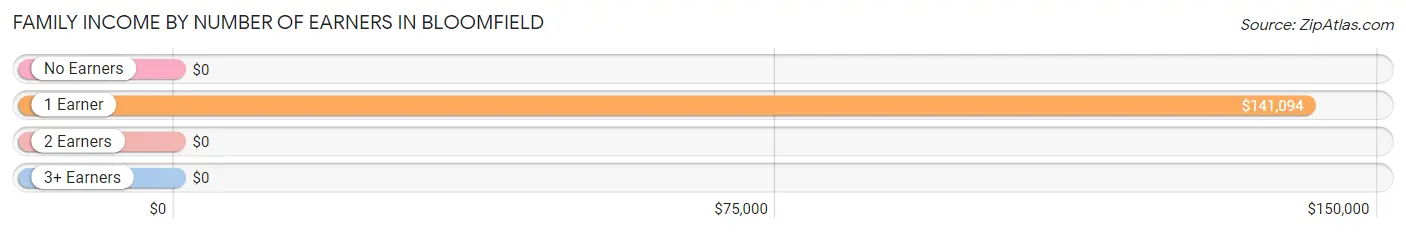
| Number of Earners | # Families | Median Income |
| No Earners | 0 (0.0%) | $0 |
| 1 Earner | 23 (52.3%) | $141,094 |
| 2 Earners | 14 (31.8%) | $0 |
| 3+ Earners | 7 (15.9%) | $0 |
| Total | 44 (100.0%) | $155,357 |
Household Income in Bloomfield
Household Income Brackets in Bloomfield
With 36 households falling in the category, the $100,000 to $149,999 income range is the most frequent in Bloomfield, accounting for 37.9% of all households.
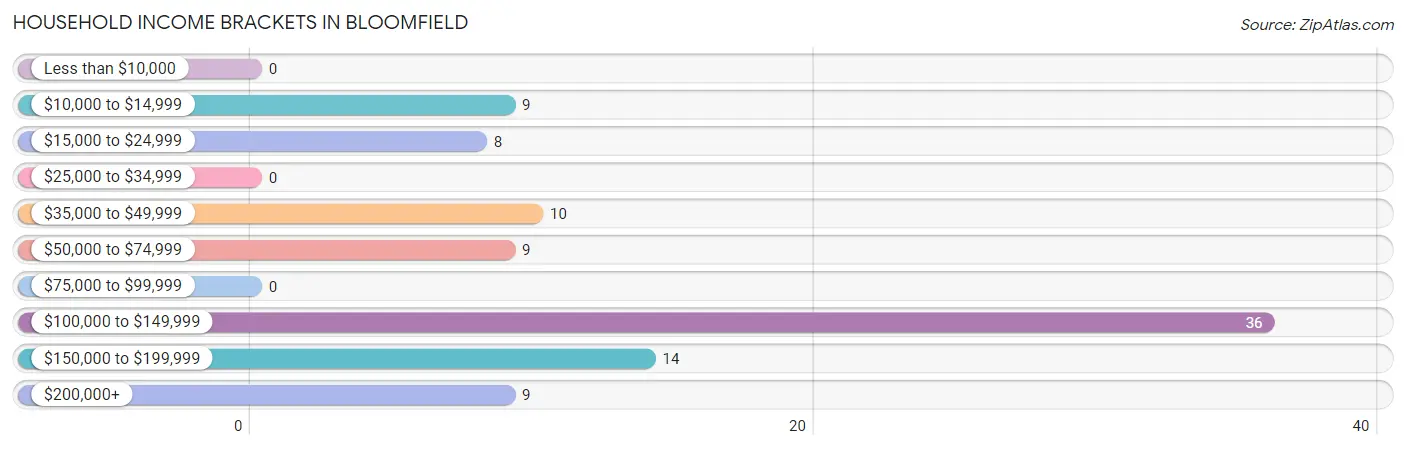
| Income Bracket | # Households | % Households |
| Less than $10,000 | 0 | 0.0% |
| $10,000 to $14,999 | 9 | 9.5% |
| $15,000 to $24,999 | 8 | 8.4% |
| $25,000 to $34,999 | 0 | 0.0% |
| $35,000 to $49,999 | 10 | 10.5% |
| $50,000 to $74,999 | 9 | 9.5% |
| $75,000 to $99,999 | 0 | 0.0% |
| $100,000 to $149,999 | 36 | 37.9% |
| $150,000 to $199,999 | 14 | 14.7% |
| $200,000+ | 9 | 9.5% |
Household Income by Householder Age in Bloomfield
The median household income in Bloomfield is $124,250, with the highest median household income of $136,250 found in the 45 to 64 years age bracket for the primary householder. A total of 30 households (31.6%) fall into this category.
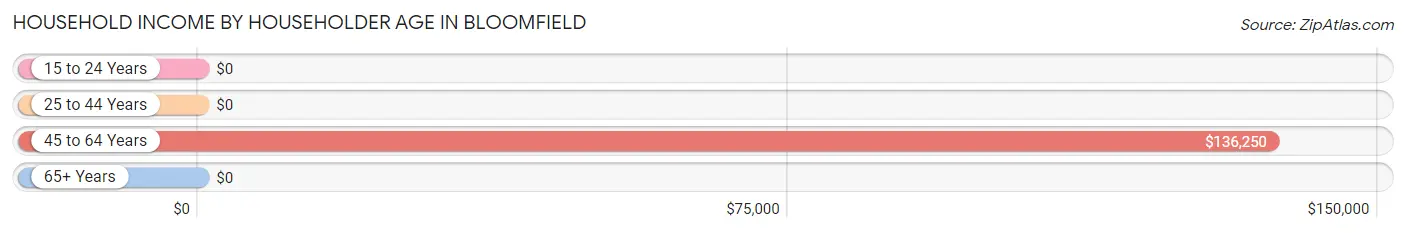
| Income Bracket | # Households | Median Income |
| 15 to 24 Years | 0 (0.0%) | $0 |
| 25 to 44 Years | 19 (20.0%) | $0 |
| 45 to 64 Years | 30 (31.6%) | $136,250 |
| 65+ Years | 46 (48.4%) | $0 |
| Total | 95 (100.0%) | $124,250 |
Poverty in Bloomfield
Income Below Poverty by Sex and Age in Bloomfield
With 16.7% poverty level for males and 6.9% for females among the residents of Bloomfield, 45 to 54 year old males and 75 year old and over females are the most vulnerable to poverty, with 11 males (61.1%) and 9 females (52.9%) in their respective age groups living below the poverty level.
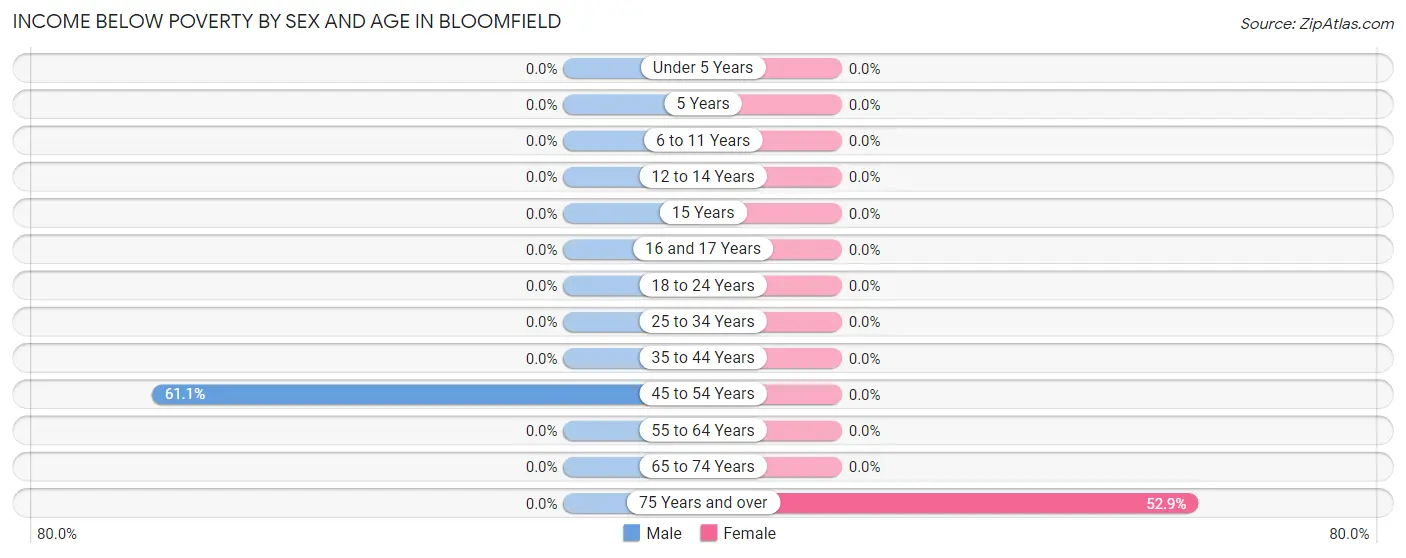
| Age Bracket | Male | Female |
| Under 5 Years | 0 (0.0%) | 0 (0.0%) |
| 5 Years | 0 (0.0%) | 0 (0.0%) |
| 6 to 11 Years | 0 (0.0%) | 0 (0.0%) |
| 12 to 14 Years | 0 (0.0%) | 0 (0.0%) |
| 15 Years | 0 (0.0%) | 0 (0.0%) |
| 16 and 17 Years | 0 (0.0%) | 0 (0.0%) |
| 18 to 24 Years | 0 (0.0%) | 0 (0.0%) |
| 25 to 34 Years | 0 (0.0%) | 0 (0.0%) |
| 35 to 44 Years | 0 (0.0%) | 0 (0.0%) |
| 45 to 54 Years | 11 (61.1%) | 0 (0.0%) |
| 55 to 64 Years | 0 (0.0%) | 0 (0.0%) |
| 65 to 74 Years | 0 (0.0%) | 0 (0.0%) |
| 75 Years and over | 0 (0.0%) | 9 (52.9%) |
| Total | 11 (16.7%) | 9 (6.9%) |
Income Above Poverty by Sex and Age in Bloomfield
According to the poverty statistics in Bloomfield, males aged 18 to 24 years and females aged under 5 years are the age groups that are most secure financially, with 100.0% of males and 100.0% of females in these age groups living above the poverty line.
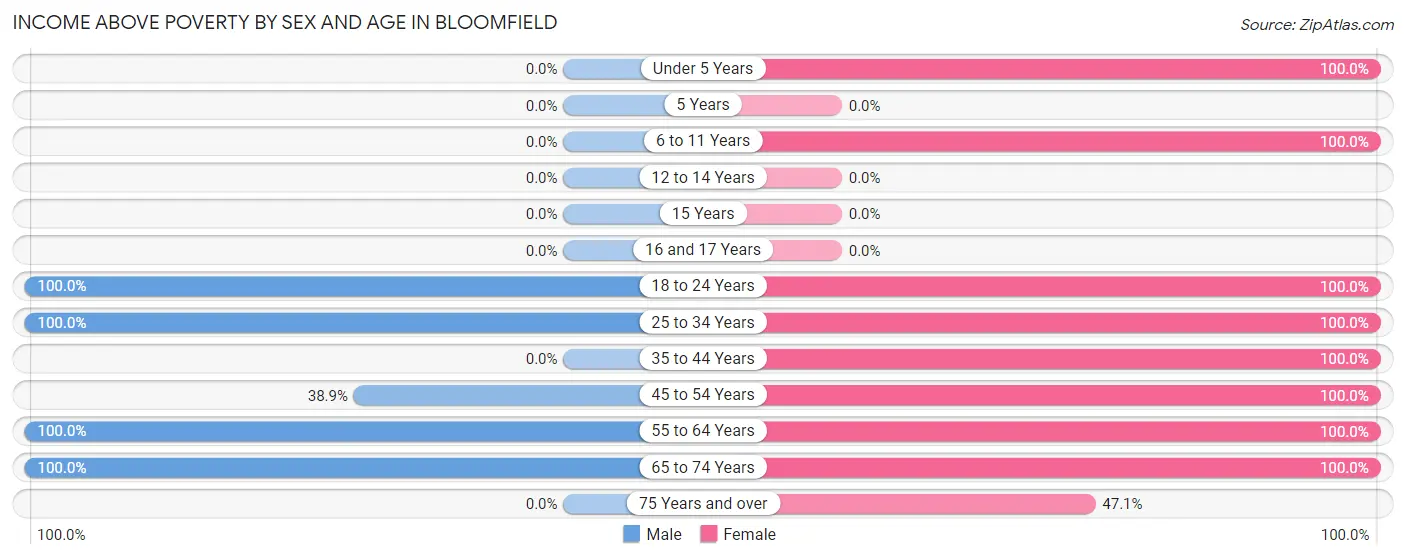
| Age Bracket | Male | Female |
| Under 5 Years | 0 (0.0%) | 6 (100.0%) |
| 5 Years | 0 (0.0%) | 0 (0.0%) |
| 6 to 11 Years | 0 (0.0%) | 22 (100.0%) |
| 12 to 14 Years | 0 (0.0%) | 0 (0.0%) |
| 15 Years | 0 (0.0%) | 0 (0.0%) |
| 16 and 17 Years | 0 (0.0%) | 0 (0.0%) |
| 18 to 24 Years | 9 (100.0%) | 9 (100.0%) |
| 25 to 34 Years | 6 (100.0%) | 10 (100.0%) |
| 35 to 44 Years | 0 (0.0%) | 17 (100.0%) |
| 45 to 54 Years | 7 (38.9%) | 22 (100.0%) |
| 55 to 64 Years | 9 (100.0%) | 8 (100.0%) |
| 65 to 74 Years | 24 (100.0%) | 20 (100.0%) |
| 75 Years and over | 0 (0.0%) | 8 (47.1%) |
| Total | 55 (83.3%) | 122 (93.1%) |
Income Below Poverty Among Married-Couple Families in Bloomfield
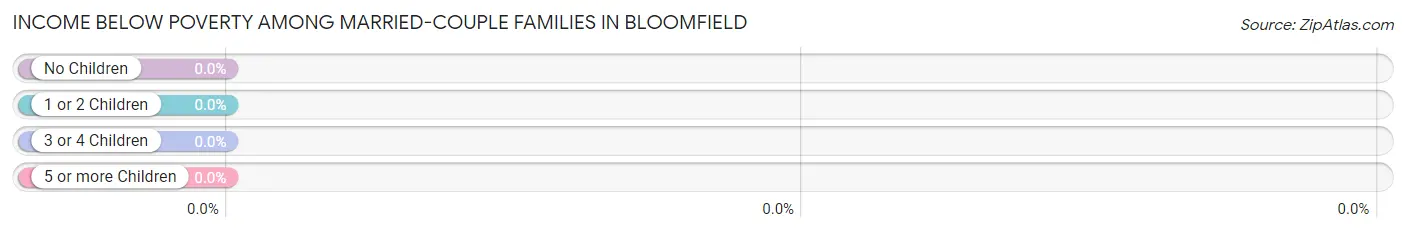
| Children | Above Poverty | Below Poverty |
| No Children | 30 (100.0%) | 0 (0.0%) |
| 1 or 2 Children | 0 (0.0%) | 0 (0.0%) |
| 3 or 4 Children | 9 (100.0%) | 0 (0.0%) |
| 5 or more Children | 0 (0.0%) | 0 (0.0%) |
| Total | 39 (100.0%) | 0 (0.0%) |
Income Below Poverty Among Single-Parent Households in Bloomfield
| Children | Single Father | Single Mother |
| No Children | 0 (0.0%) | 0 (0.0%) |
| 1 or 2 Children | 0 (0.0%) | 0 (0.0%) |
| 3 or 4 Children | 0 (0.0%) | 0 (0.0%) |
| 5 or more Children | 0 (0.0%) | 0 (0.0%) |
| Total | 0 (0.0%) | 0 (0.0%) |
Income Below Poverty Among Married-Couple vs Single-Parent Households in Bloomfield
| Children | Married-Couple Families | Single-Parent Households |
| No Children | 0 (0.0%) | 0 (0.0%) |
| 1 or 2 Children | 0 (0.0%) | 0 (0.0%) |
| 3 or 4 Children | 0 (0.0%) | 0 (0.0%) |
| 5 or more Children | 0 (0.0%) | 0 (0.0%) |
| Total | 0 (0.0%) | 0 (0.0%) |
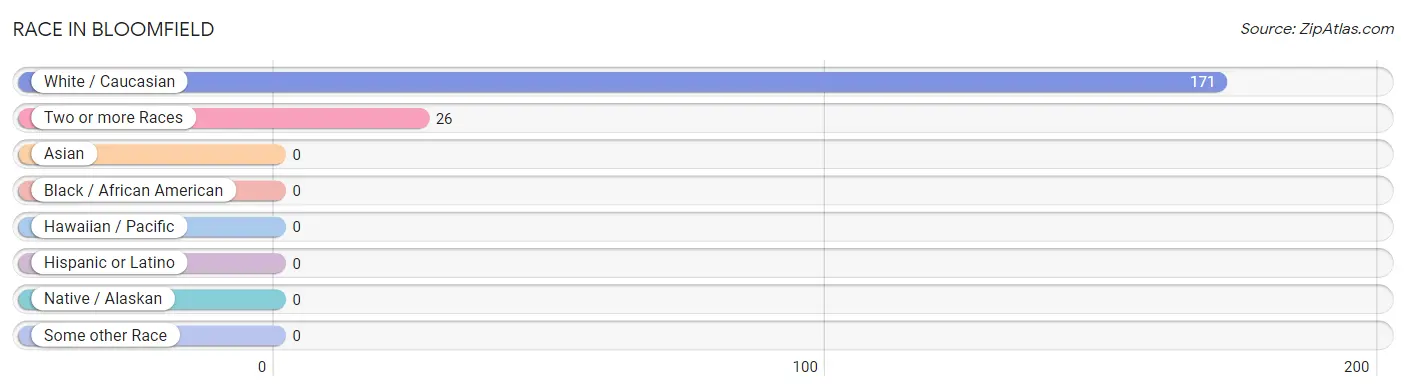
Race in Bloomfield
The most populous races in Bloomfield are White / Caucasian (171 | 86.8%), and Two or more Races (26 | 13.2%).
| Race | # Population | % Population |
| Asian | 0 | 0.0% |
| Black / African American | 0 | 0.0% |
| Hawaiian / Pacific | 0 | 0.0% |
| Hispanic or Latino | 0 | 0.0% |
| Native / Alaskan | 0 | 0.0% |
| White / Caucasian | 171 | 86.8% |
| Two or more Races | 26 | 13.2% |
| Some other Race | 0 | 0.0% |
| Total | 197 | 100.0% |
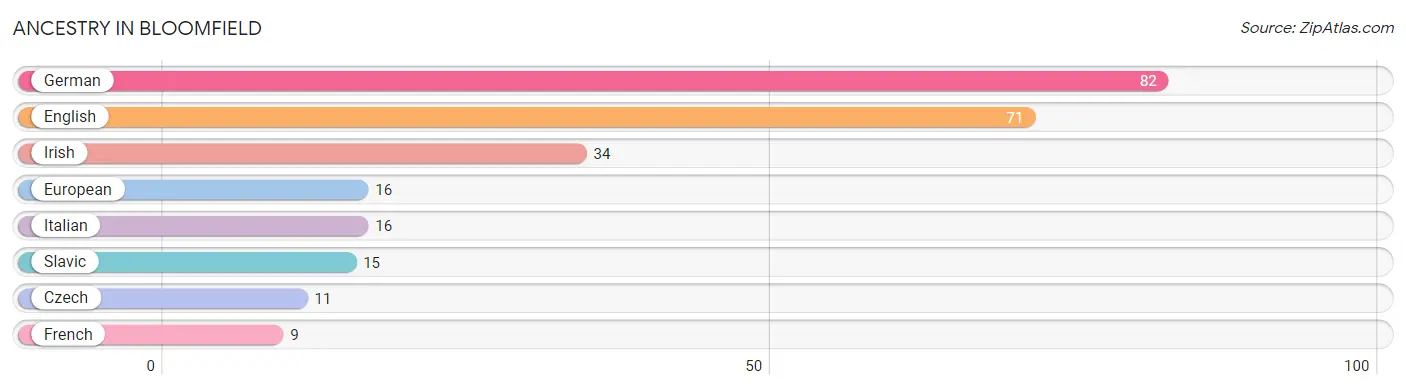
Ancestry in Bloomfield
The most populous ancestries reported in Bloomfield are German (82 | 41.6%), English (71 | 36.0%), Irish (34 | 17.3%), European (16 | 8.1%), and Italian (16 | 8.1%), together accounting for 111.2% of all Bloomfield residents.
| Ancestry | # Population | % Population |
| Czech | 11 | 5.6% |
| English | 71 | 36.0% |
| European | 16 | 8.1% |
| French | 9 | 4.6% |
| German | 82 | 41.6% |
| Irish | 34 | 17.3% |
| Italian | 16 | 8.1% |
| Slavic | 15 | 7.6% | View All 8 Rows |
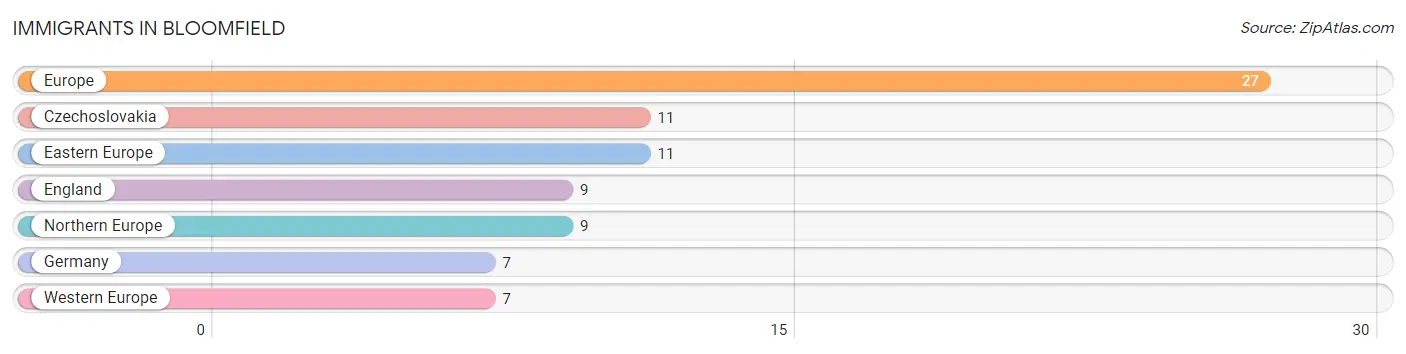
Immigrants in Bloomfield
The most numerous immigrant groups reported in Bloomfield came from Europe (27 | 13.7%), Czechoslovakia (11 | 5.6%), Eastern Europe (11 | 5.6%), England (9 | 4.6%), and Northern Europe (9 | 4.6%), together accounting for 34.0% of all Bloomfield residents.
| Immigration Origin | # Population | % Population |
| Czechoslovakia | 11 | 5.6% |
| Eastern Europe | 11 | 5.6% |
| England | 9 | 4.6% |
| Europe | 27 | 13.7% |
| Germany | 7 | 3.5% |
| Northern Europe | 9 | 4.6% |
| Western Europe | 7 | 3.5% | View All 7 Rows |
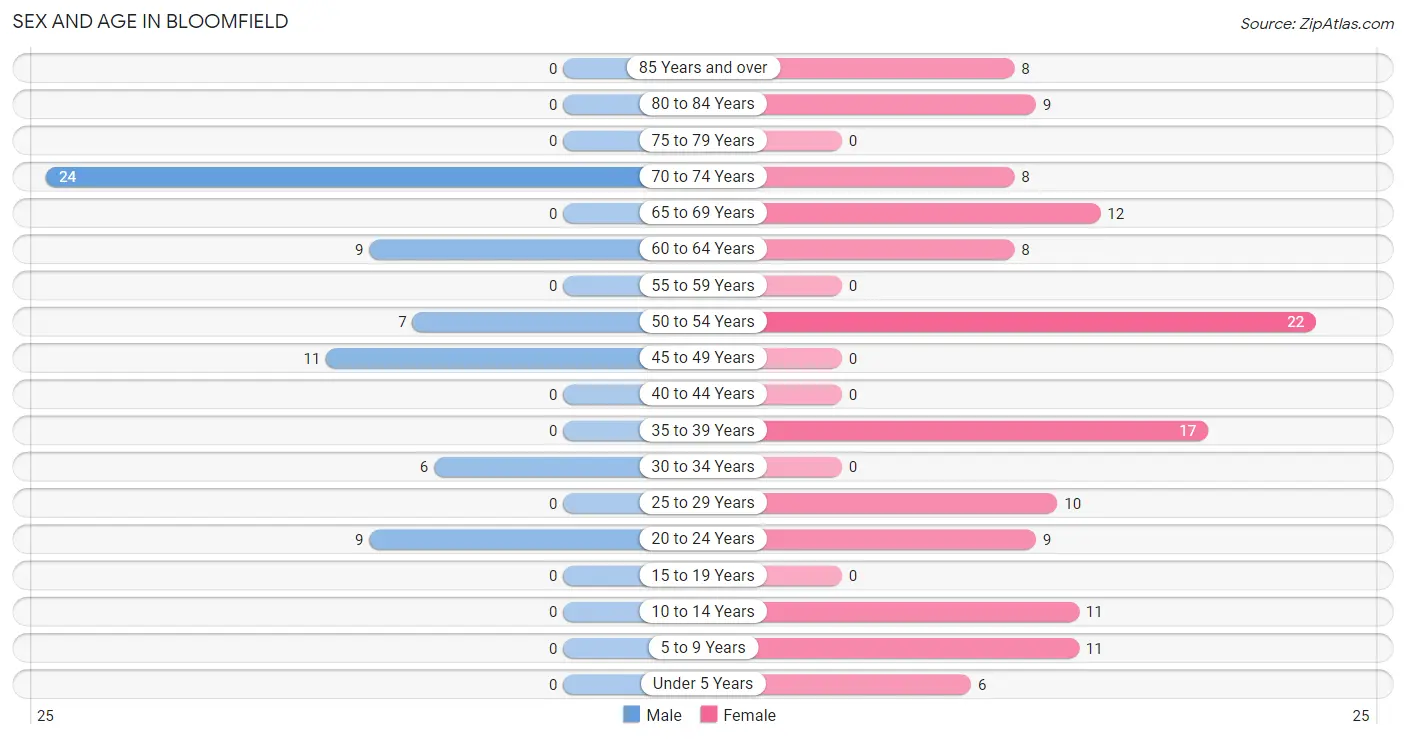
Sex and Age in Bloomfield
Sex and Age in Bloomfield
The most populous age groups in Bloomfield are 70 to 74 Years (24 | 36.4%) for men and 50 to 54 Years (22 | 16.8%) for women.
| Age Bracket | Male | Female |
| Under 5 Years | 0 (0.0%) | 6 (4.6%) |
| 5 to 9 Years | 0 (0.0%) | 11 (8.4%) |
| 10 to 14 Years | 0 (0.0%) | 11 (8.4%) |
| 15 to 19 Years | 0 (0.0%) | 0 (0.0%) |
| 20 to 24 Years | 9 (13.6%) | 9 (6.9%) |
| 25 to 29 Years | 0 (0.0%) | 10 (7.6%) |
| 30 to 34 Years | 6 (9.1%) | 0 (0.0%) |
| 35 to 39 Years | 0 (0.0%) | 17 (13.0%) |
| 40 to 44 Years | 0 (0.0%) | 0 (0.0%) |
| 45 to 49 Years | 11 (16.7%) | 0 (0.0%) |
| 50 to 54 Years | 7 (10.6%) | 22 (16.8%) |
| 55 to 59 Years | 0 (0.0%) | 0 (0.0%) |
| 60 to 64 Years | 9 (13.6%) | 8 (6.1%) |
| 65 to 69 Years | 0 (0.0%) | 12 (9.2%) |
| 70 to 74 Years | 24 (36.4%) | 8 (6.1%) |
| 75 to 79 Years | 0 (0.0%) | 0 (0.0%) |
| 80 to 84 Years | 0 (0.0%) | 9 (6.9%) |
| 85 Years and over | 0 (0.0%) | 8 (6.1%) |
| Total | 66 (100.0%) | 131 (100.0%) |
Families and Households in Bloomfield
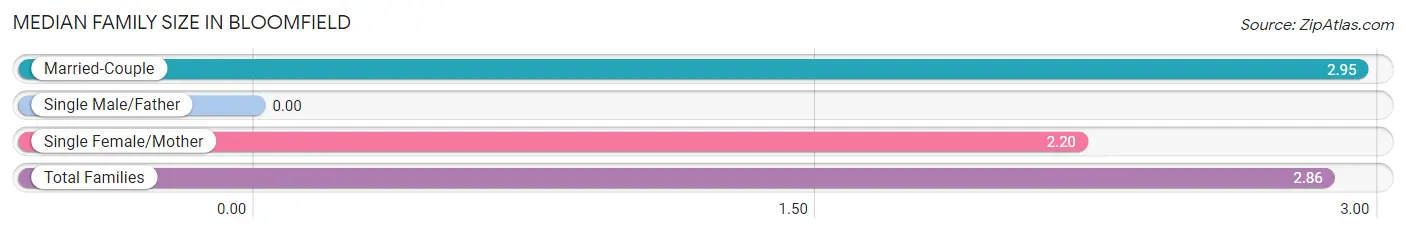
Median Family Size in Bloomfield
| Family Type | # Families | Family Size |
| Married-Couple | 39 (88.6%) | 2.95 |
| Single Male/Father | 0 (0.0%) | - |
| Single Female/Mother | 5 (11.4%) | 2.20 |
| Total Families | 44 (100.0%) | 2.86 |
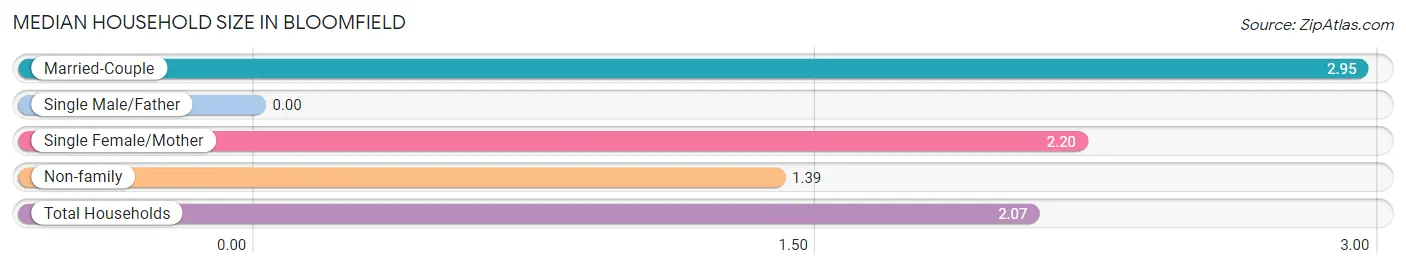
Median Household Size in Bloomfield
| Household Type | # Households | Household Size |
| Married-Couple | 39 (41.0%) | 2.95 |
| Single Male/Father | 0 (0.0%) | - |
| Single Female/Mother | 5 (5.3%) | 2.20 |
| Non-family | 51 (53.7%) | 1.39 |
| Total Households | 95 (100.0%) | 2.07 |
Household Size by Marriage Status in Bloomfield
Out of a total of 95 households in Bloomfield, 44 (46.3%) are family households, while 51 (53.7%) are nonfamily households. The most numerous type of family households are 2-person households, comprising 28, and the most common type of nonfamily households are 1-person households, comprising 26.
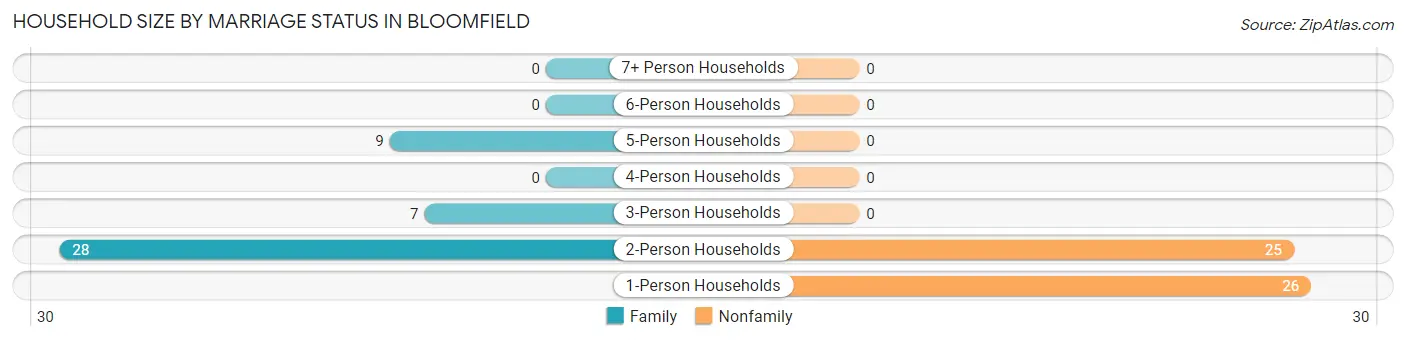
| Household Size | Family Households | Nonfamily Households |
| 1-Person Households | - | 26 (27.4%) |
| 2-Person Households | 28 (29.5%) | 25 (26.3%) |
| 3-Person Households | 7 (7.4%) | 0 (0.0%) |
| 4-Person Households | 0 (0.0%) | 0 (0.0%) |
| 5-Person Households | 9 (9.5%) | 0 (0.0%) |
| 6-Person Households | 0 (0.0%) | 0 (0.0%) |
| 7+ Person Households | 0 (0.0%) | 0 (0.0%) |
| Total | 44 (46.3%) | 51 (53.7%) |
Female Fertility in Bloomfield
Fertility by Age in Bloomfield
| Age Bracket | Women with Births | Births / 1,000 Women |
| 15 to 19 years | 0 (0.0%) | 0.0 |
| 20 to 34 years | 0 (0.0%) | 0.0 |
| 35 to 50 years | 0 (0.0%) | 0.0 |
| Total | 0 (0.0%) | 0.0 |
Fertility by Age by Marriage Status in Bloomfield
| Age Bracket | Married | Unmarried |
| 15 to 19 years | 0 (0.0%) | 0 (0.0%) |
| 20 to 34 years | 0 (0.0%) | 0 (0.0%) |
| 35 to 50 years | 0 (0.0%) | 0 (0.0%) |
| Total | 0 (0.0%) | 0 (0.0%) |
Fertility by Education in Bloomfield
| Educational Attainment | Women with Births | Births / 1,000 Women |
| Less than High School | 0 (0.0%) | 0.0 |
| High School Diploma | 0 (0.0%) | 0.0 |
| College or Associate's Degree | 0 (0.0%) | 0.0 |
| Bachelor's Degree | 0 (0.0%) | 0.0 |
| Graduate Degree | 0 (0.0%) | 0.0 |
| Total | 0 (0.0%) | 0.0 |
Fertility by Education by Marriage Status in Bloomfield
| Educational Attainment | Married | Unmarried |
| Less than High School | 0 (0.0%) | 0 (0.0%) |
| High School Diploma | 0 (0.0%) | 0 (0.0%) |
| College or Associate's Degree | 0 (0.0%) | 0 (0.0%) |
| Bachelor's Degree | 0 (0.0%) | 0 (0.0%) |
| Graduate Degree | 0 (0.0%) | 0 (0.0%) |
| Total | 0 (0.0%) | 0 (0.0%) |
Employment Characteristics in Bloomfield
Employment by Class of Employer in Bloomfield
Among the 109 employed individuals in Bloomfield, private company employees (35 | 32.1%), local government employees (20 | 18.3%), and not-for-profit organizations (17 | 15.6%) make up the most common classes of employment.
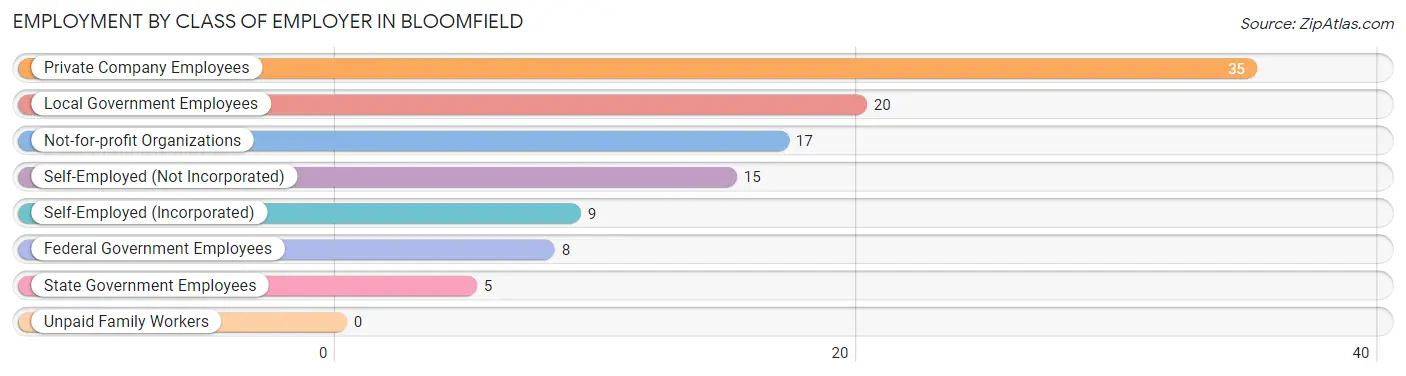
| Employer Class | # Employees | % Employees |
| Private Company Employees | 35 | 32.1% |
| Self-Employed (Incorporated) | 9 | 8.3% |
| Self-Employed (Not Incorporated) | 15 | 13.8% |
| Not-for-profit Organizations | 17 | 15.6% |
| Local Government Employees | 20 | 18.3% |
| State Government Employees | 5 | 4.6% |
| Federal Government Employees | 8 | 7.3% |
| Unpaid Family Workers | 0 | 0.0% |
| Total | 109 | 100.0% |
Employment Status by Age in Bloomfield
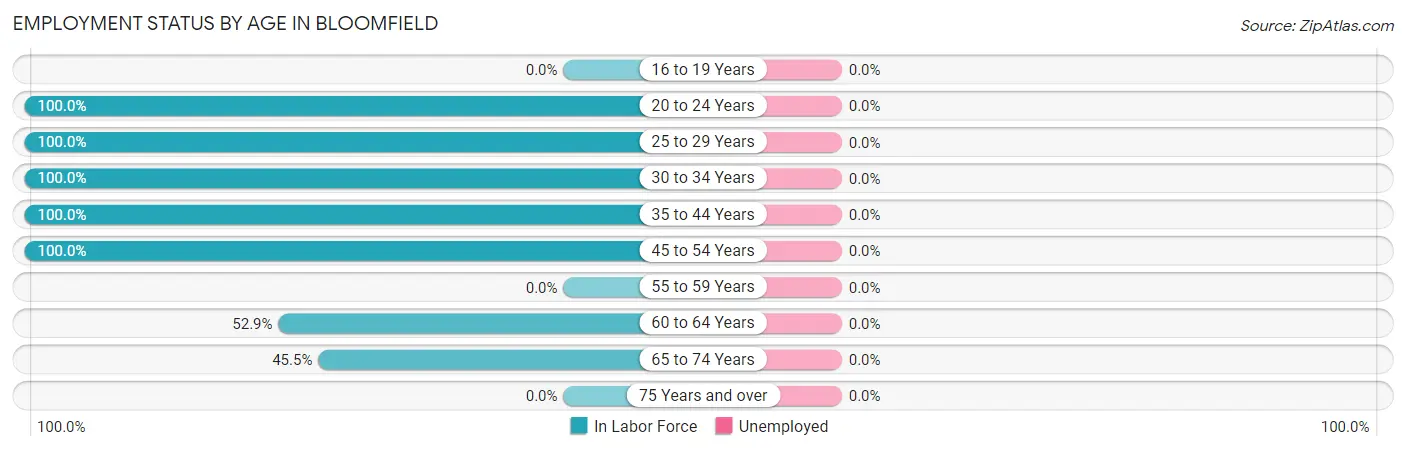
| Age Bracket | In Labor Force | Unemployed |
| 16 to 19 Years | 0 (0.0%) | 0 (0.0%) |
| 20 to 24 Years | 18 (100.0%) | 0 (0.0%) |
| 25 to 29 Years | 10 (100.0%) | 0 (0.0%) |
| 30 to 34 Years | 6 (100.0%) | 0 (0.0%) |
| 35 to 44 Years | 17 (100.0%) | 0 (0.0%) |
| 45 to 54 Years | 40 (100.0%) | 0 (0.0%) |
| 55 to 59 Years | 0 (0.0%) | 0 (0.0%) |
| 60 to 64 Years | 9 (52.9%) | 0 (0.0%) |
| 65 to 74 Years | 20 (45.5%) | 0 (0.0%) |
| 75 Years and over | 0 (0.0%) | 0 (0.0%) |
| Total | 120 (71.0%) | 0 (0.0%) |
Employment Status by Educational Attainment in Bloomfield
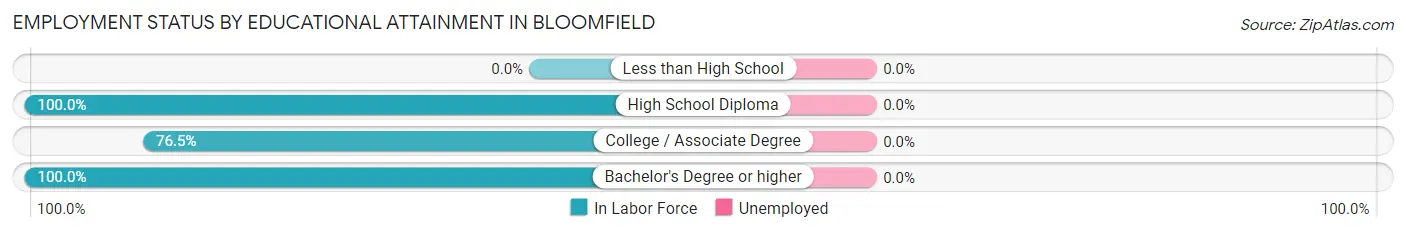
| Educational Attainment | In Labor Force | Unemployed |
| Less than High School | 0 (0.0%) | 0 (0.0%) |
| High School Diploma | 18 (100.0%) | 0 (0.0%) |
| College / Associate Degree | 26 (76.5%) | 0 (0.0%) |
| Bachelor's Degree or higher | 38 (100.0%) | 0 (0.0%) |
| Total | 82 (91.1%) | 0 (0.0%) |
Employment Occupations by Sex in Bloomfield
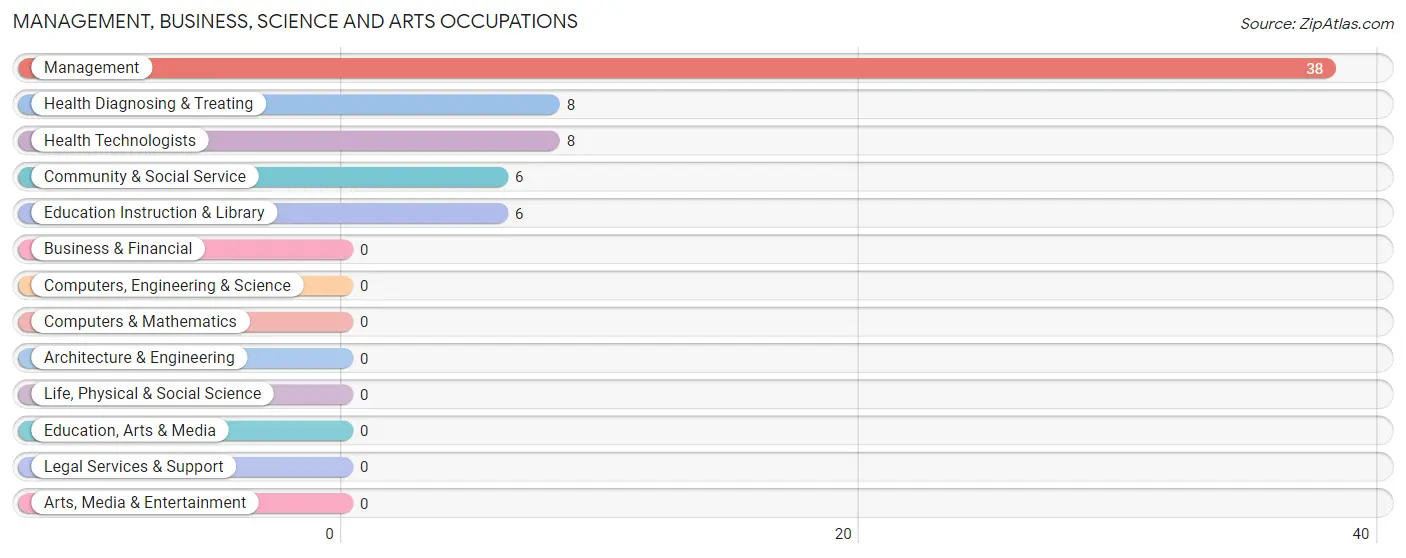
Management, Business, Science and Arts Occupations
The most common Management, Business, Science and Arts occupations in Bloomfield are Management (38 | 31.7%), Health Diagnosing & Treating (8 | 6.7%), Health Technologists (8 | 6.7%), Community & Social Service (6 | 5.0%), and Education Instruction & Library (6 | 5.0%).
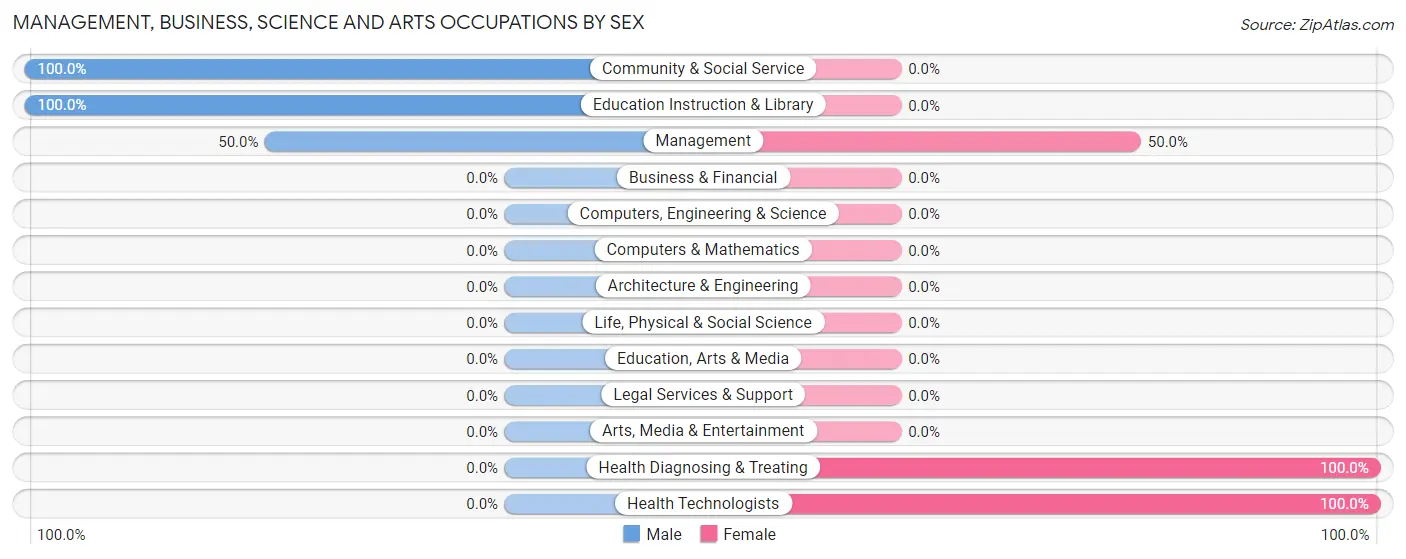
Management, Business, Science and Arts Occupations by Sex
Within the Management, Business, Science and Arts occupations in Bloomfield, the most male-oriented occupations are Community & Social Service (100.0%), Education Instruction & Library (100.0%), and Management (50.0%), while the most female-oriented occupations are Health Diagnosing & Treating (100.0%), Health Technologists (100.0%), and Management (50.0%).
| Occupation | Male | Female |
| Management | 19 (50.0%) | 19 (50.0%) |
| Business & Financial | 0 (0.0%) | 0 (0.0%) |
| Computers, Engineering & Science | 0 (0.0%) | 0 (0.0%) |
| Computers & Mathematics | 0 (0.0%) | 0 (0.0%) |
| Architecture & Engineering | 0 (0.0%) | 0 (0.0%) |
| Life, Physical & Social Science | 0 (0.0%) | 0 (0.0%) |
| Community & Social Service | 6 (100.0%) | 0 (0.0%) |
| Education, Arts & Media | 0 (0.0%) | 0 (0.0%) |
| Legal Services & Support | 0 (0.0%) | 0 (0.0%) |
| Education Instruction & Library | 6 (100.0%) | 0 (0.0%) |
| Arts, Media & Entertainment | 0 (0.0%) | 0 (0.0%) |
| Health Diagnosing & Treating | 0 (0.0%) | 8 (100.0%) |
| Health Technologists | 0 (0.0%) | 8 (100.0%) |
| Total (Category) | 25 (48.1%) | 27 (51.9%) |
| Total (Overall) | 57 (47.5%) | 63 (52.5%) |
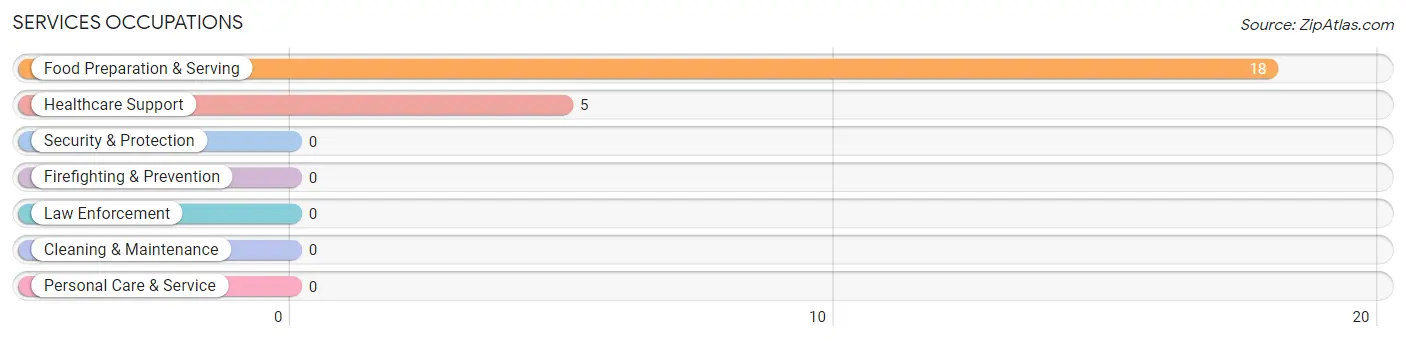
Services Occupations
The most common Services occupations in Bloomfield are Food Preparation & Serving (18 | 15.0%), and Healthcare Support (5 | 4.2%).
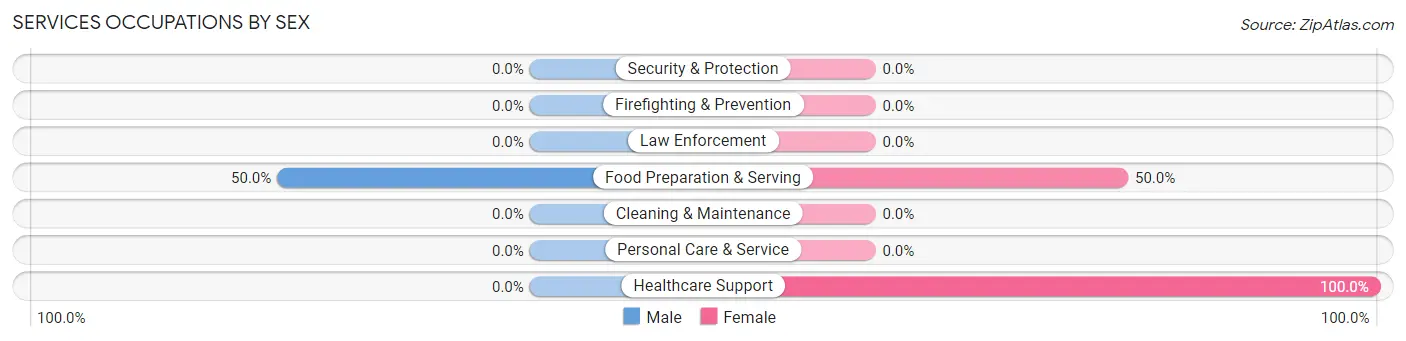
Services Occupations by Sex
| Occupation | Male | Female |
| Healthcare Support | 0 (0.0%) | 5 (100.0%) |
| Security & Protection | 0 (0.0%) | 0 (0.0%) |
| Firefighting & Prevention | 0 (0.0%) | 0 (0.0%) |
| Law Enforcement | 0 (0.0%) | 0 (0.0%) |
| Food Preparation & Serving | 9 (50.0%) | 9 (50.0%) |
| Cleaning & Maintenance | 0 (0.0%) | 0 (0.0%) |
| Personal Care & Service | 0 (0.0%) | 0 (0.0%) |
| Total (Category) | 9 (39.1%) | 14 (60.9%) |
| Total (Overall) | 57 (47.5%) | 63 (52.5%) |
Sales and Office Occupations
The most common Sales and Office occupations in Bloomfield are , and Office & Administration (15 | 12.5%).
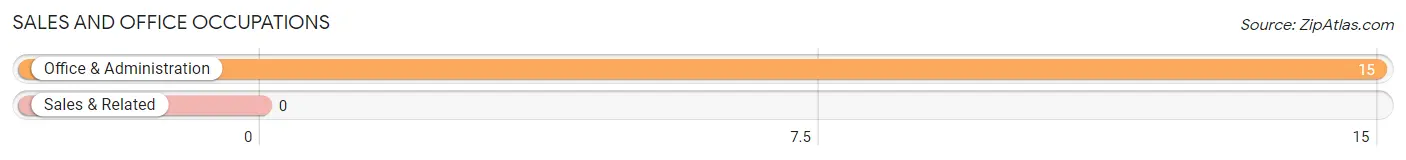
Sales and Office Occupations by Sex
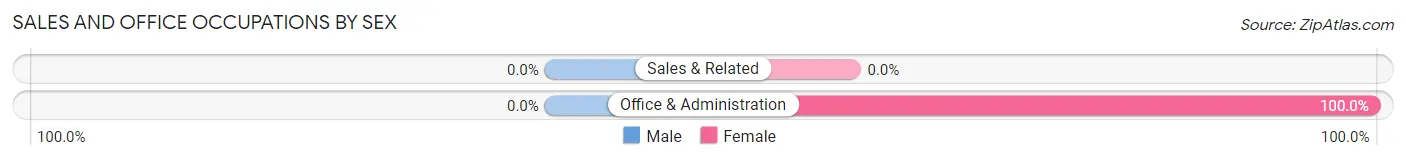
| Occupation | Male | Female |
| Sales & Related | 0 (0.0%) | 0 (0.0%) |
| Office & Administration | 0 (0.0%) | 15 (100.0%) |
| Total (Category) | 0 (0.0%) | 15 (100.0%) |
| Total (Overall) | 57 (47.5%) | 63 (52.5%) |
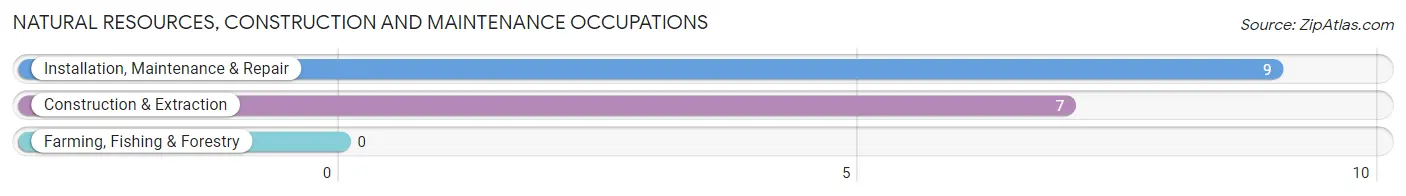
Natural Resources, Construction and Maintenance Occupations
The most common Natural Resources, Construction and Maintenance occupations in Bloomfield are Installation, Maintenance & Repair (9 | 7.5%), and Construction & Extraction (7 | 5.8%).
Natural Resources, Construction and Maintenance Occupations by Sex
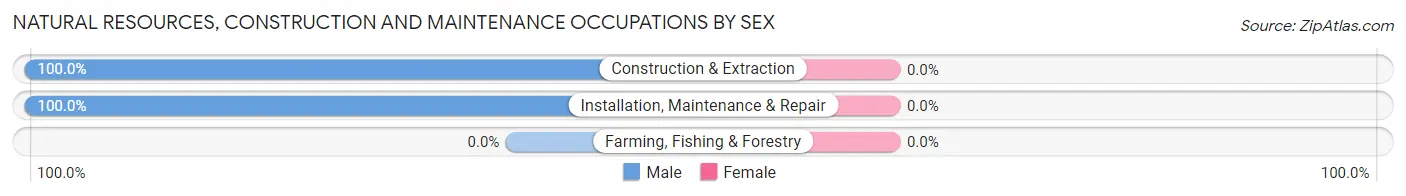
| Occupation | Male | Female |
| Farming, Fishing & Forestry | 0 (0.0%) | 0 (0.0%) |
| Construction & Extraction | 7 (100.0%) | 0 (0.0%) |
| Installation, Maintenance & Repair | 9 (100.0%) | 0 (0.0%) |
| Total (Category) | 16 (100.0%) | 0 (0.0%) |
| Total (Overall) | 57 (47.5%) | 63 (52.5%) |
Production, Transportation and Moving Occupations
The most common Production, Transportation and Moving occupations in Bloomfield are Production (7 | 5.8%), and Transportation (7 | 5.8%).
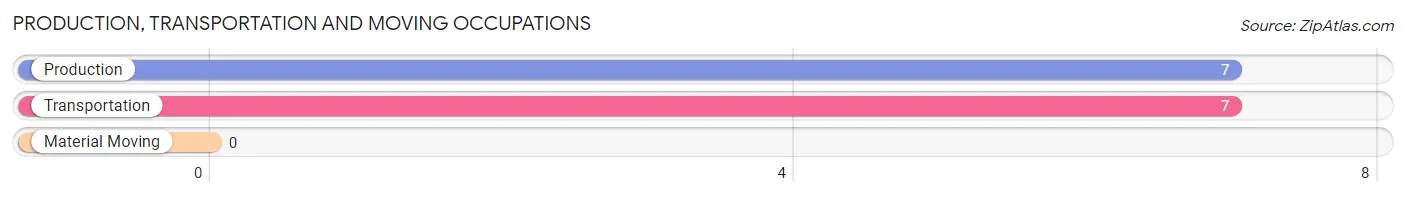
Production, Transportation and Moving Occupations by Sex
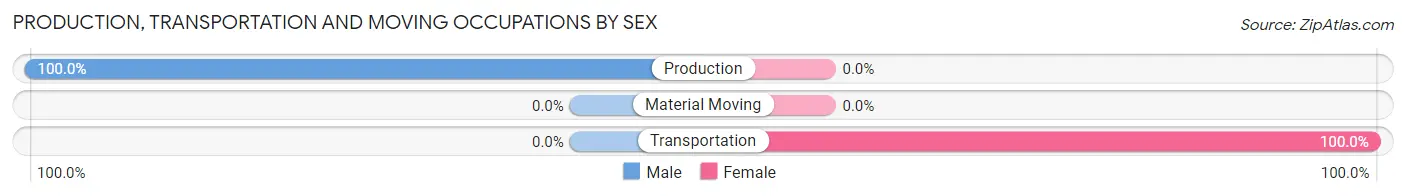
| Occupation | Male | Female |
| Production | 7 (100.0%) | 0 (0.0%) |
| Transportation | 0 (0.0%) | 7 (100.0%) |
| Material Moving | 0 (0.0%) | 0 (0.0%) |
| Total (Category) | 7 (50.0%) | 7 (50.0%) |
| Total (Overall) | 57 (47.5%) | 63 (52.5%) |
Employment Industries by Sex in Bloomfield
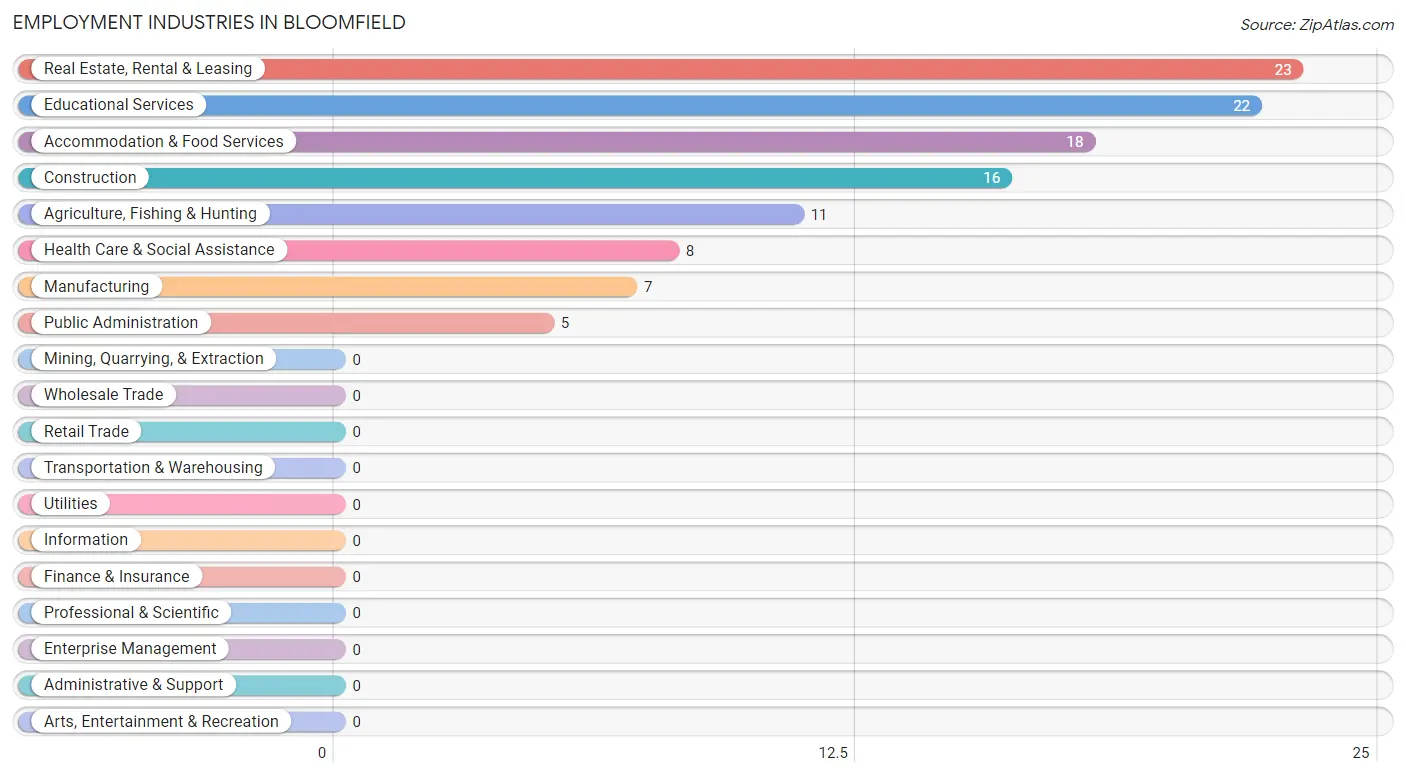
Employment Industries in Bloomfield
The major employment industries in Bloomfield include Real Estate, Rental & Leasing (23 | 19.2%), Educational Services (22 | 18.3%), Accommodation & Food Services (18 | 15.0%), Construction (16 | 13.3%), and Agriculture, Fishing & Hunting (11 | 9.2%).
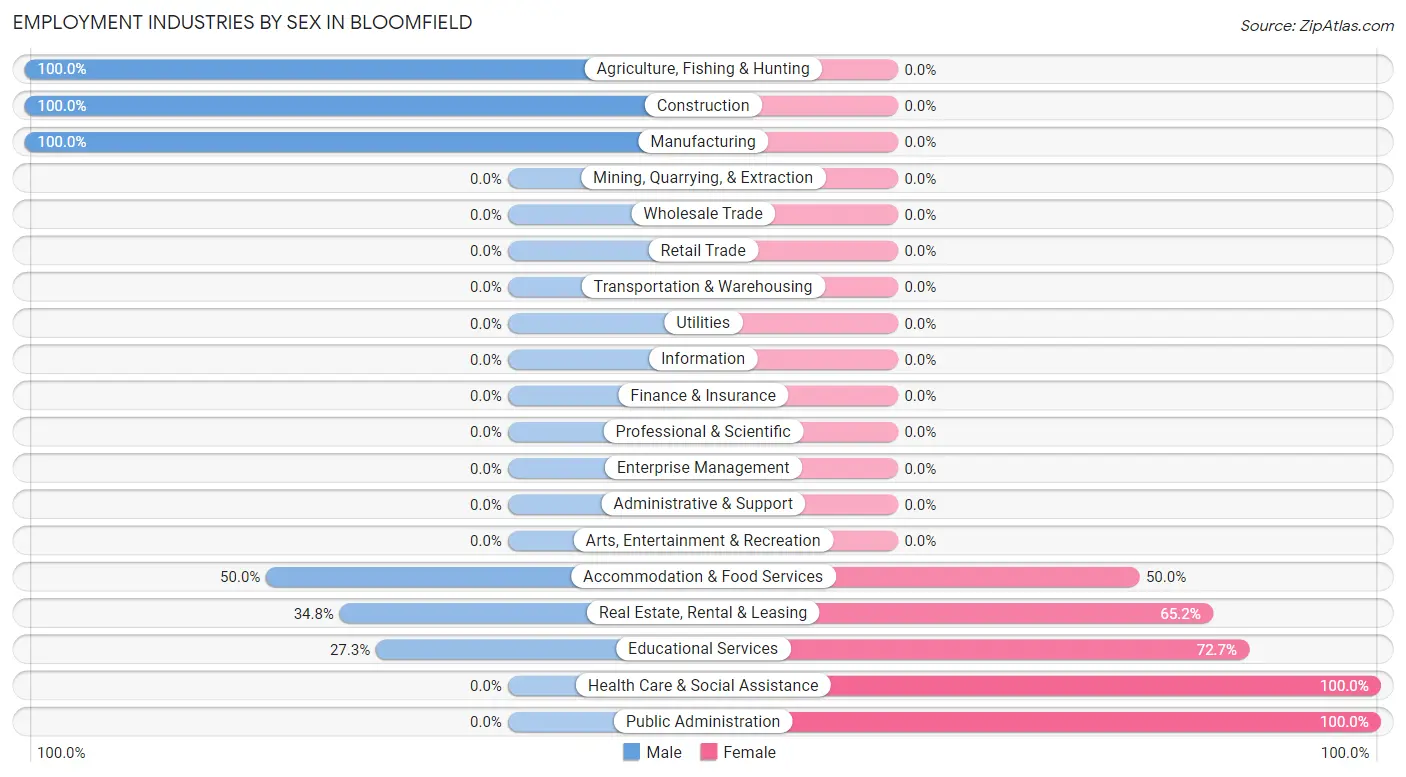
Employment Industries by Sex in Bloomfield
The Bloomfield industries that see more men than women are Agriculture, Fishing & Hunting (100.0%), Construction (100.0%), and Manufacturing (100.0%), whereas the industries that tend to have a higher number of women are Health Care & Social Assistance (100.0%), Public Administration (100.0%), and Educational Services (72.7%).
| Industry | Male | Female |
| Agriculture, Fishing & Hunting | 11 (100.0%) | 0 (0.0%) |
| Mining, Quarrying, & Extraction | 0 (0.0%) | 0 (0.0%) |
| Construction | 16 (100.0%) | 0 (0.0%) |
| Manufacturing | 7 (100.0%) | 0 (0.0%) |
| Wholesale Trade | 0 (0.0%) | 0 (0.0%) |
| Retail Trade | 0 (0.0%) | 0 (0.0%) |
| Transportation & Warehousing | 0 (0.0%) | 0 (0.0%) |
| Utilities | 0 (0.0%) | 0 (0.0%) |
| Information | 0 (0.0%) | 0 (0.0%) |
| Finance & Insurance | 0 (0.0%) | 0 (0.0%) |
| Real Estate, Rental & Leasing | 8 (34.8%) | 15 (65.2%) |
| Professional & Scientific | 0 (0.0%) | 0 (0.0%) |
| Enterprise Management | 0 (0.0%) | 0 (0.0%) |
| Administrative & Support | 0 (0.0%) | 0 (0.0%) |
| Educational Services | 6 (27.3%) | 16 (72.7%) |
| Health Care & Social Assistance | 0 (0.0%) | 8 (100.0%) |
| Arts, Entertainment & Recreation | 0 (0.0%) | 0 (0.0%) |
| Accommodation & Food Services | 9 (50.0%) | 9 (50.0%) |
| Public Administration | 0 (0.0%) | 5 (100.0%) |
| Total | 57 (47.5%) | 63 (52.5%) |
Education in Bloomfield
School Enrollment in Bloomfield
The most common levels of schooling among the 48 students in Bloomfield are elementary school (11 | 22.9%), middle school (11 | 22.9%), and graduate / professional (11 | 22.9%).
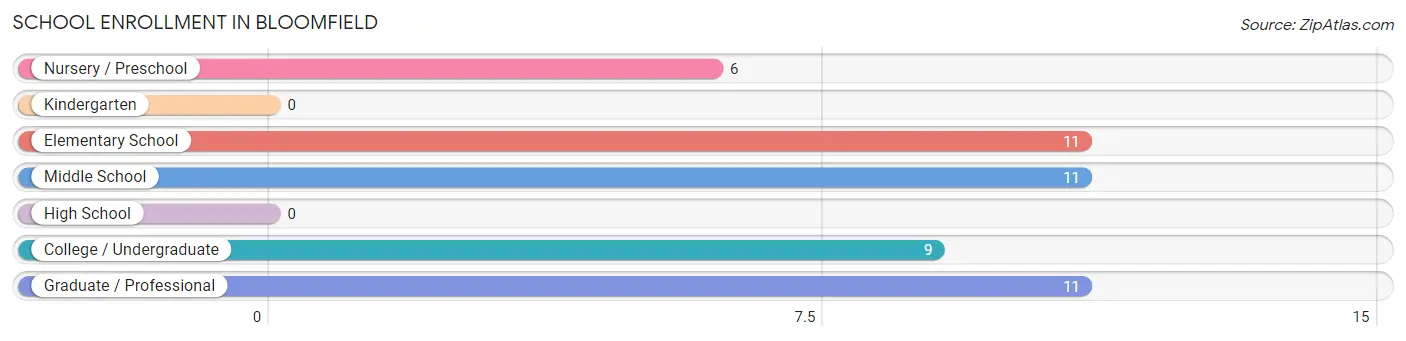
| School Level | # Students | % Students |
| Nursery / Preschool | 6 | 12.5% |
| Kindergarten | 0 | 0.0% |
| Elementary School | 11 | 22.9% |
| Middle School | 11 | 22.9% |
| High School | 0 | 0.0% |
| College / Undergraduate | 9 | 18.8% |
| Graduate / Professional | 11 | 22.9% |
| Total | 48 | 100.0% |
School Enrollment by Age by Funding Source in Bloomfield
Out of a total of 48 students who are enrolled in schools in Bloomfield, 28 (58.3%) attend a private institution, while the remaining 20 (41.7%) are enrolled in public schools. The age group of 3 to 4 year olds has the highest likelihood of being enrolled in private schools, with 6 (100.0% in the age bracket) enrolled. Conversely, the age group of 20 to 24 year olds has the lowest likelihood of being enrolled in a private school, with 9 (100.0% in the age bracket) attending a public institution.
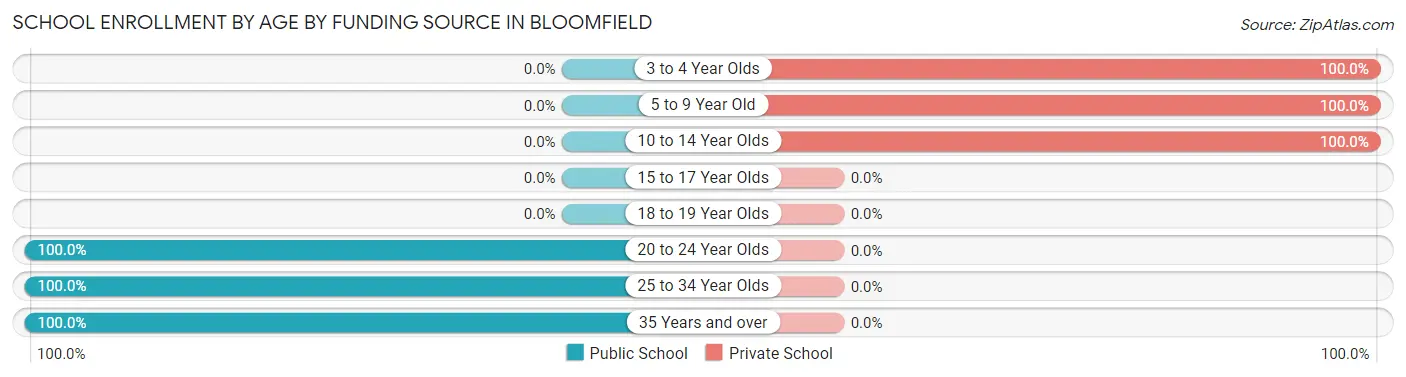
| Age Bracket | Public School | Private School |
| 3 to 4 Year Olds | 0 (0.0%) | 6 (100.0%) |
| 5 to 9 Year Old | 0 (0.0%) | 11 (100.0%) |
| 10 to 14 Year Olds | 0 (0.0%) | 11 (100.0%) |
| 15 to 17 Year Olds | 0 (0.0%) | 0 (0.0%) |
| 18 to 19 Year Olds | 0 (0.0%) | 0 (0.0%) |
| 20 to 24 Year Olds | 9 (100.0%) | 0 (0.0%) |
| 25 to 34 Year Olds | 6 (100.0%) | 0 (0.0%) |
| 35 Years and over | 5 (100.0%) | 0 (0.0%) |
| Total | 20 (41.7%) | 28 (58.3%) |
Educational Attainment by Field of Study in Bloomfield
Business (15 | 23.1%), visual & performing arts (14 | 21.5%), liberal arts & history (13 | 20.0%), engineering (8 | 12.3%), and communications (8 | 12.3%) are the most common fields of study among 65 individuals in Bloomfield who have obtained a bachelor's degree or higher.
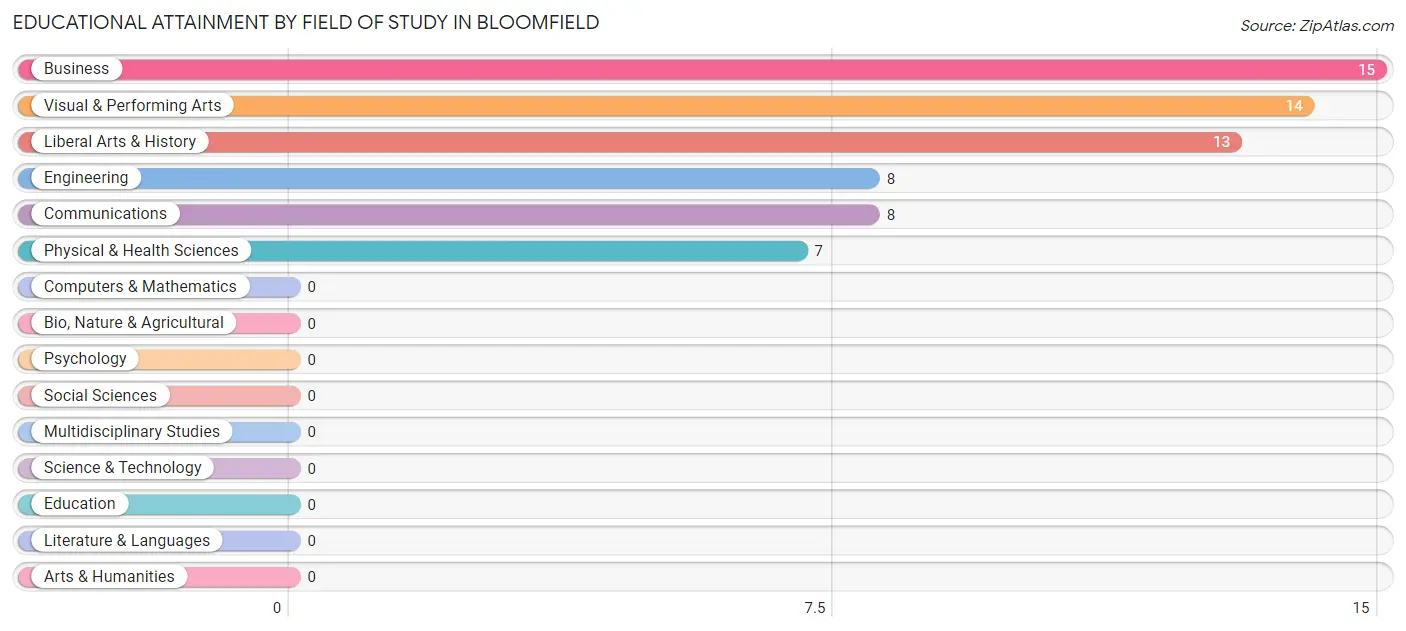
| Field of Study | # Graduates | % Graduates |
| Computers & Mathematics | 0 | 0.0% |
| Bio, Nature & Agricultural | 0 | 0.0% |
| Physical & Health Sciences | 7 | 10.8% |
| Psychology | 0 | 0.0% |
| Social Sciences | 0 | 0.0% |
| Engineering | 8 | 12.3% |
| Multidisciplinary Studies | 0 | 0.0% |
| Science & Technology | 0 | 0.0% |
| Business | 15 | 23.1% |
| Education | 0 | 0.0% |
| Literature & Languages | 0 | 0.0% |
| Liberal Arts & History | 13 | 20.0% |
| Visual & Performing Arts | 14 | 21.5% |
| Communications | 8 | 12.3% |
| Arts & Humanities | 0 | 0.0% |
| Total | 65 | 100.0% |
Transportation & Commute in Bloomfield
Vehicle Availability by Sex in Bloomfield
The most prevalent vehicle ownership categories in Bloomfield are males with 2 vehicles (30, accounting for 65.2%) and females with 2 vehicles (47, making up 47.6%).
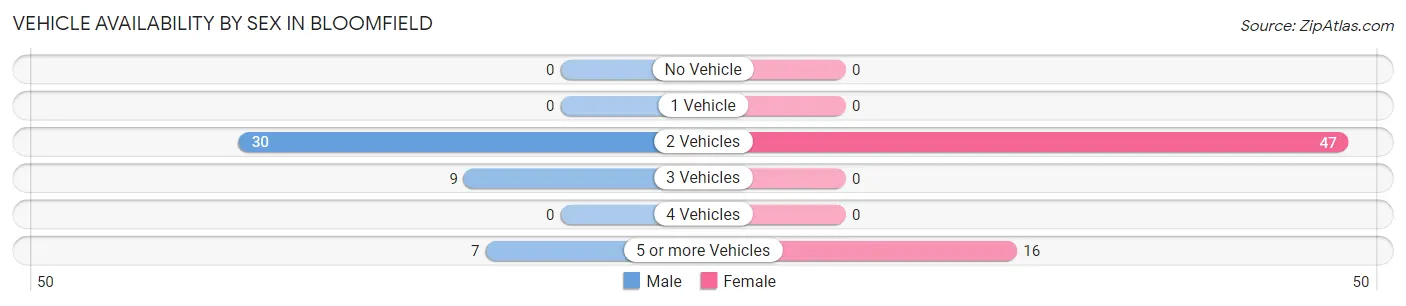
| Vehicles Available | Male | Female |
| No Vehicle | 0 (0.0%) | 0 (0.0%) |
| 1 Vehicle | 0 (0.0%) | 0 (0.0%) |
| 2 Vehicles | 30 (65.2%) | 47 (74.6%) |
| 3 Vehicles | 9 (19.6%) | 0 (0.0%) |
| 4 Vehicles | 0 (0.0%) | 0 (0.0%) |
| 5 or more Vehicles | 7 (15.2%) | 16 (25.4%) |
| Total | 46 (100.0%) | 63 (100.0%) |
Commute Time in Bloomfield
The most frequently occuring commute durations in Bloomfield are 10 to 14 minutes (16 commuters, 18.6%), 20 to 24 minutes (16 commuters, 18.6%), and 5 to 9 minutes (13 commuters, 15.1%).
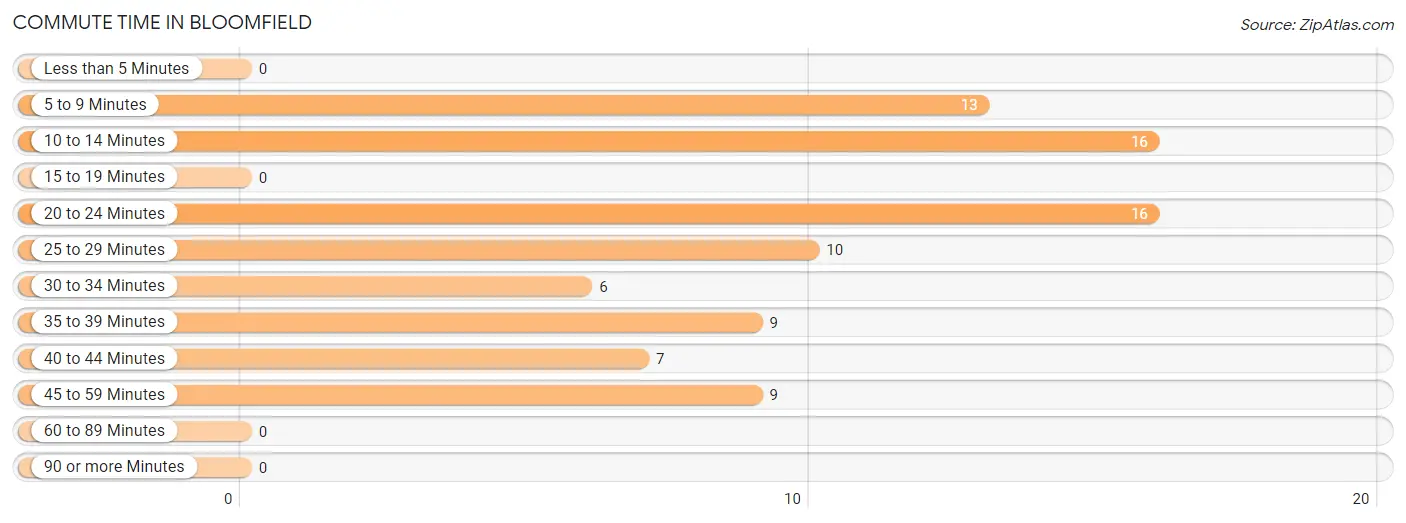
| Commute Time | # Commuters | % Commuters |
| Less than 5 Minutes | 0 | 0.0% |
| 5 to 9 Minutes | 13 | 15.1% |
| 10 to 14 Minutes | 16 | 18.6% |
| 15 to 19 Minutes | 0 | 0.0% |
| 20 to 24 Minutes | 16 | 18.6% |
| 25 to 29 Minutes | 10 | 11.6% |
| 30 to 34 Minutes | 6 | 7.0% |
| 35 to 39 Minutes | 9 | 10.5% |
| 40 to 44 Minutes | 7 | 8.1% |
| 45 to 59 Minutes | 9 | 10.5% |
| 60 to 89 Minutes | 0 | 0.0% |
| 90 or more Minutes | 0 | 0.0% |
Commute Time by Sex in Bloomfield
The most common commute times in Bloomfield are 35 to 39 minutes (9 commuters, 23.7%) for males and 10 to 14 minutes (16 commuters, 33.3%) for females.
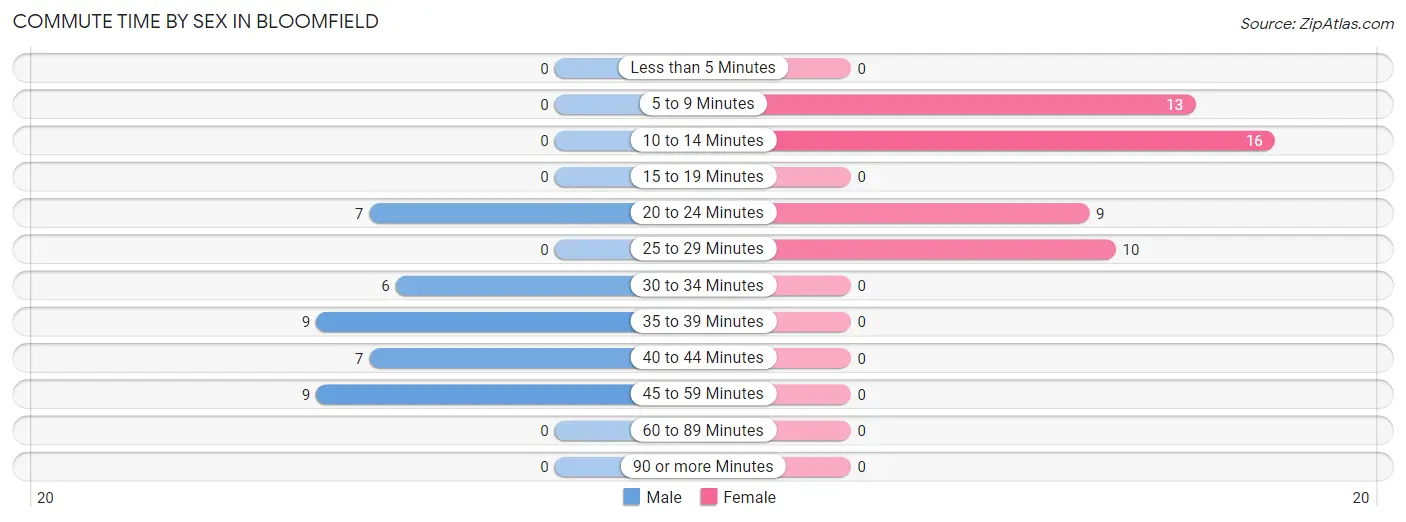
| Commute Time | Male | Female |
| Less than 5 Minutes | 0 (0.0%) | 0 (0.0%) |
| 5 to 9 Minutes | 0 (0.0%) | 13 (27.1%) |
| 10 to 14 Minutes | 0 (0.0%) | 16 (33.3%) |
| 15 to 19 Minutes | 0 (0.0%) | 0 (0.0%) |
| 20 to 24 Minutes | 7 (18.4%) | 9 (18.8%) |
| 25 to 29 Minutes | 0 (0.0%) | 10 (20.8%) |
| 30 to 34 Minutes | 6 (15.8%) | 0 (0.0%) |
| 35 to 39 Minutes | 9 (23.7%) | 0 (0.0%) |
| 40 to 44 Minutes | 7 (18.4%) | 0 (0.0%) |
| 45 to 59 Minutes | 9 (23.7%) | 0 (0.0%) |
| 60 to 89 Minutes | 0 (0.0%) | 0 (0.0%) |
| 90 or more Minutes | 0 (0.0%) | 0 (0.0%) |
Time of Departure to Work by Sex in Bloomfield
The most frequent times of departure to work in Bloomfield are 6:30 AM to 6:59 AM (9, 23.7%) for males and 12:00 PM to 3:59 PM (14, 29.2%) for females.
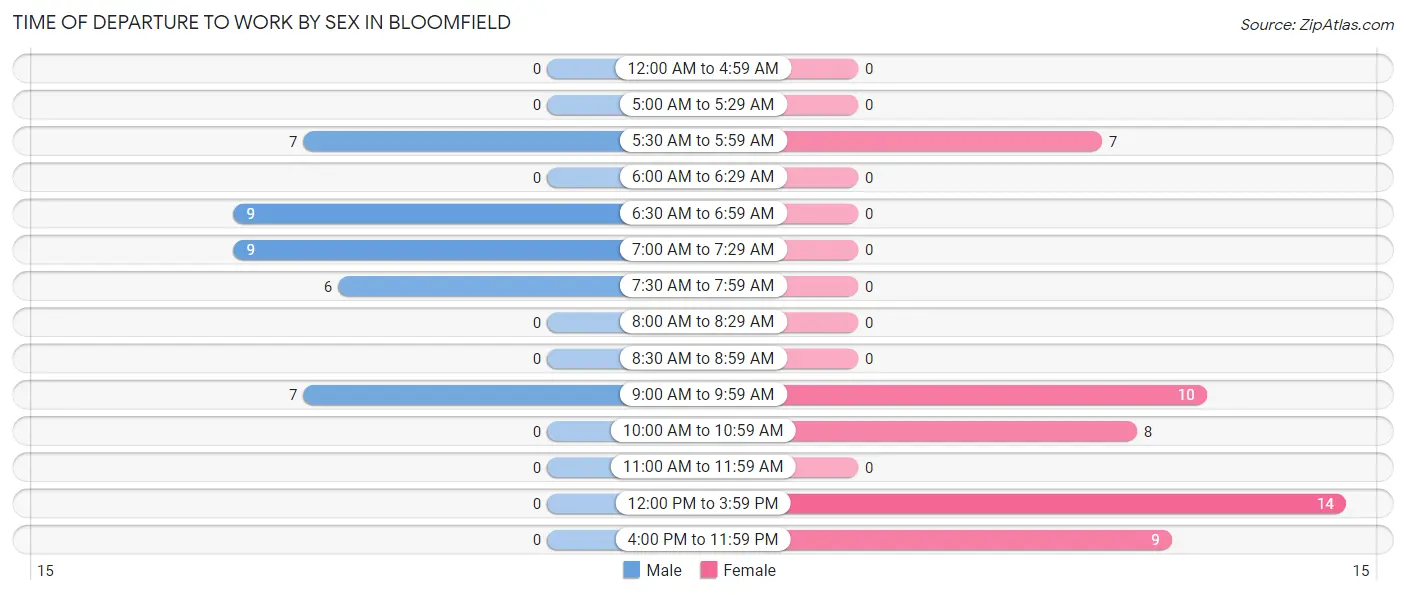
| Time of Departure | Male | Female |
| 12:00 AM to 4:59 AM | 0 (0.0%) | 0 (0.0%) |
| 5:00 AM to 5:29 AM | 0 (0.0%) | 0 (0.0%) |
| 5:30 AM to 5:59 AM | 7 (18.4%) | 7 (14.6%) |
| 6:00 AM to 6:29 AM | 0 (0.0%) | 0 (0.0%) |
| 6:30 AM to 6:59 AM | 9 (23.7%) | 0 (0.0%) |
| 7:00 AM to 7:29 AM | 9 (23.7%) | 0 (0.0%) |
| 7:30 AM to 7:59 AM | 6 (15.8%) | 0 (0.0%) |
| 8:00 AM to 8:29 AM | 0 (0.0%) | 0 (0.0%) |
| 8:30 AM to 8:59 AM | 0 (0.0%) | 0 (0.0%) |
| 9:00 AM to 9:59 AM | 7 (18.4%) | 10 (20.8%) |
| 10:00 AM to 10:59 AM | 0 (0.0%) | 8 (16.7%) |
| 11:00 AM to 11:59 AM | 0 (0.0%) | 0 (0.0%) |
| 12:00 PM to 3:59 PM | 0 (0.0%) | 14 (29.2%) |
| 4:00 PM to 11:59 PM | 0 (0.0%) | 9 (18.8%) |
| Total | 38 (100.0%) | 48 (100.0%) |
Housing Occupancy in Bloomfield
Occupancy by Ownership in Bloomfield
Of the total 95 dwellings in Bloomfield, owner-occupied units account for 76 (80.0%), while renter-occupied units make up 19 (20.0%).
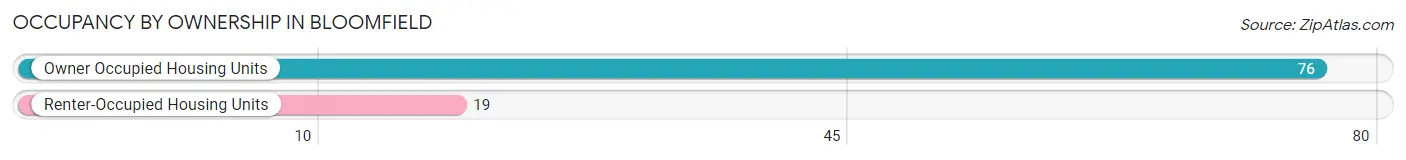
| Occupancy | # Housing Units | % Housing Units |
| Owner Occupied Housing Units | 76 | 80.0% |
| Renter-Occupied Housing Units | 19 | 20.0% |
| Total Occupied Housing Units | 95 | 100.0% |
Occupancy by Household Size in Bloomfield
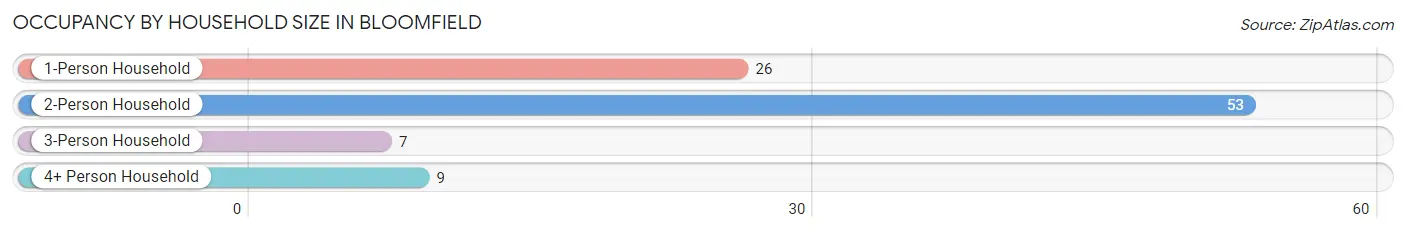
| Household Size | # Housing Units | % Housing Units |
| 1-Person Household | 26 | 27.4% |
| 2-Person Household | 53 | 55.8% |
| 3-Person Household | 7 | 7.4% |
| 4+ Person Household | 9 | 9.5% |
| Total Housing Units | 95 | 100.0% |
Occupancy by Ownership by Household Size in Bloomfield
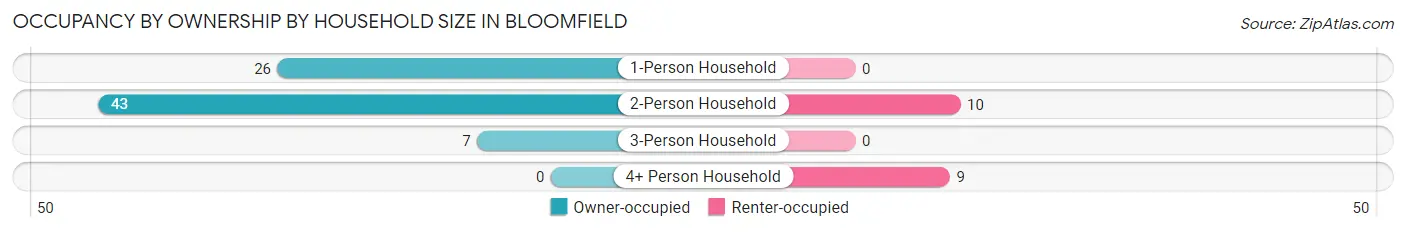
| Household Size | Owner-occupied | Renter-occupied |
| 1-Person Household | 26 (100.0%) | 0 (0.0%) |
| 2-Person Household | 43 (81.1%) | 10 (18.9%) |
| 3-Person Household | 7 (100.0%) | 0 (0.0%) |
| 4+ Person Household | 0 (0.0%) | 9 (100.0%) |
| Total Housing Units | 76 (80.0%) | 19 (20.0%) |
Occupancy by Educational Attainment in Bloomfield
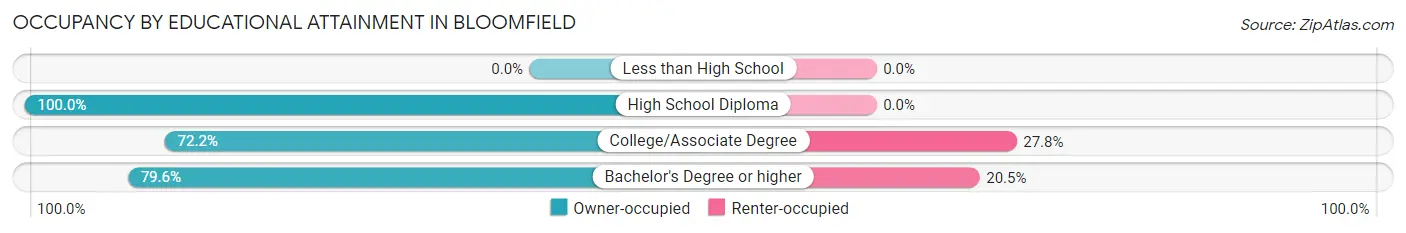
| Household Size | Owner-occupied | Renter-occupied |
| Less than High School | 0 (0.0%) | 0 (0.0%) |
| High School Diploma | 15 (100.0%) | 0 (0.0%) |
| College/Associate Degree | 26 (72.2%) | 10 (27.8%) |
| Bachelor's Degree or higher | 35 (79.5%) | 9 (20.4%) |
Occupancy by Age of Householder in Bloomfield
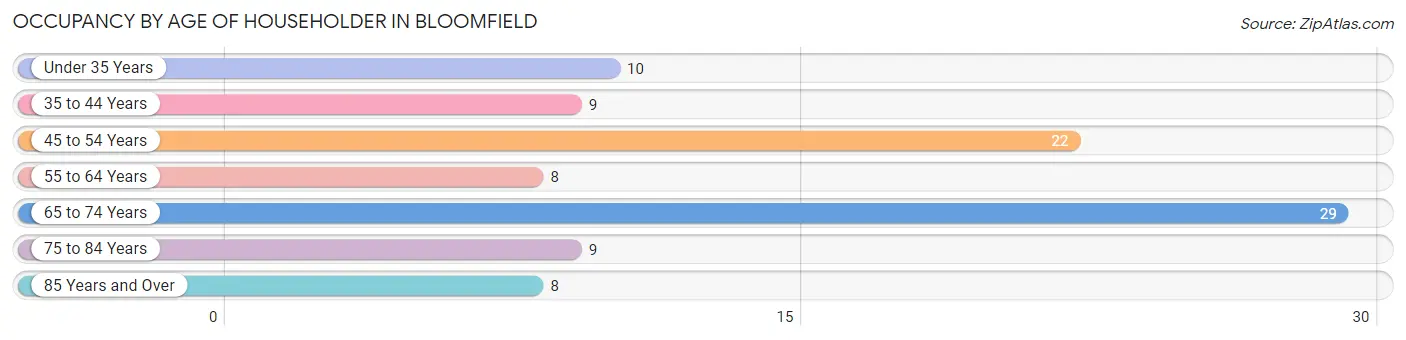
| Age Bracket | # Households | % Households |
| Under 35 Years | 10 | 10.5% |
| 35 to 44 Years | 9 | 9.5% |
| 45 to 54 Years | 22 | 23.2% |
| 55 to 64 Years | 8 | 8.4% |
| 65 to 74 Years | 29 | 30.5% |
| 75 to 84 Years | 9 | 9.5% |
| 85 Years and Over | 8 | 8.4% |
| Total | 95 | 100.0% |
Housing Finances in Bloomfield
Median Income by Occupancy in Bloomfield
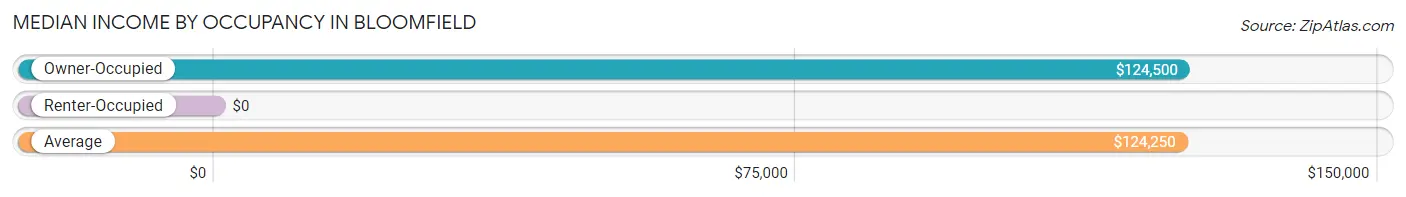
| Occupancy Type | # Households | Median Income |
| Owner-Occupied | 76 (80.0%) | $124,500 |
| Renter-Occupied | 19 (20.0%) | $0 |
| Average | 95 (100.0%) | $124,250 |
Occupancy by Householder Income Bracket in Bloomfield
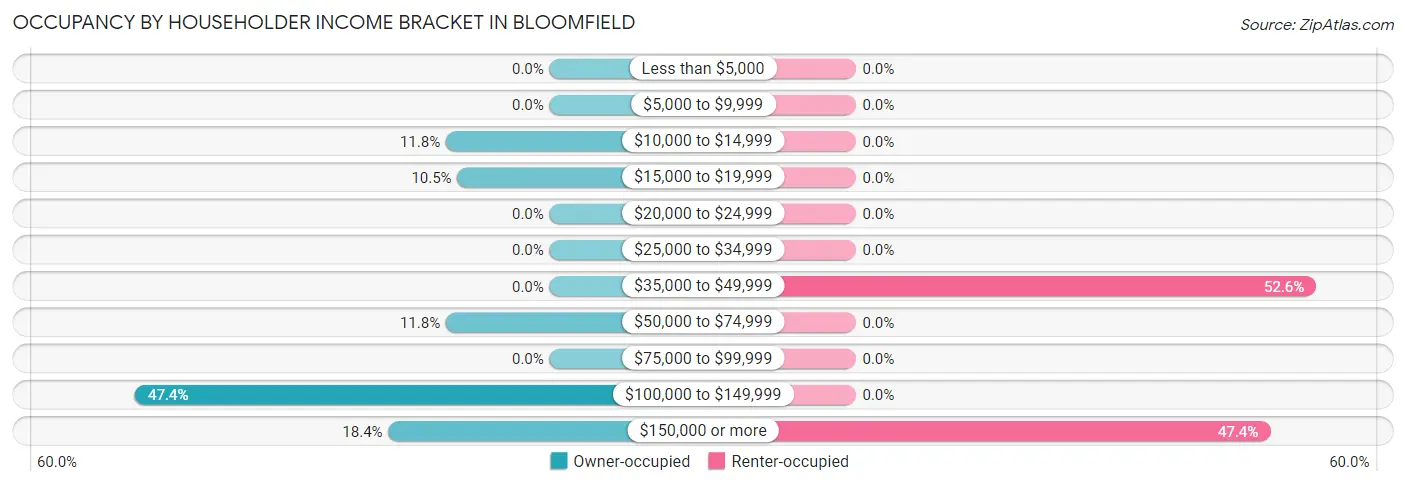
| Income Bracket | Owner-occupied | Renter-occupied |
| Less than $5,000 | 0 (0.0%) | 0 (0.0%) |
| $5,000 to $9,999 | 0 (0.0%) | 0 (0.0%) |
| $10,000 to $14,999 | 9 (11.8%) | 0 (0.0%) |
| $15,000 to $19,999 | 8 (10.5%) | 0 (0.0%) |
| $20,000 to $24,999 | 0 (0.0%) | 0 (0.0%) |
| $25,000 to $34,999 | 0 (0.0%) | 0 (0.0%) |
| $35,000 to $49,999 | 0 (0.0%) | 10 (52.6%) |
| $50,000 to $74,999 | 9 (11.8%) | 0 (0.0%) |
| $75,000 to $99,999 | 0 (0.0%) | 0 (0.0%) |
| $100,000 to $149,999 | 36 (47.4%) | 0 (0.0%) |
| $150,000 or more | 14 (18.4%) | 9 (47.4%) |
| Total | 76 (100.0%) | 19 (100.0%) |
Monthly Housing Cost Tiers in Bloomfield
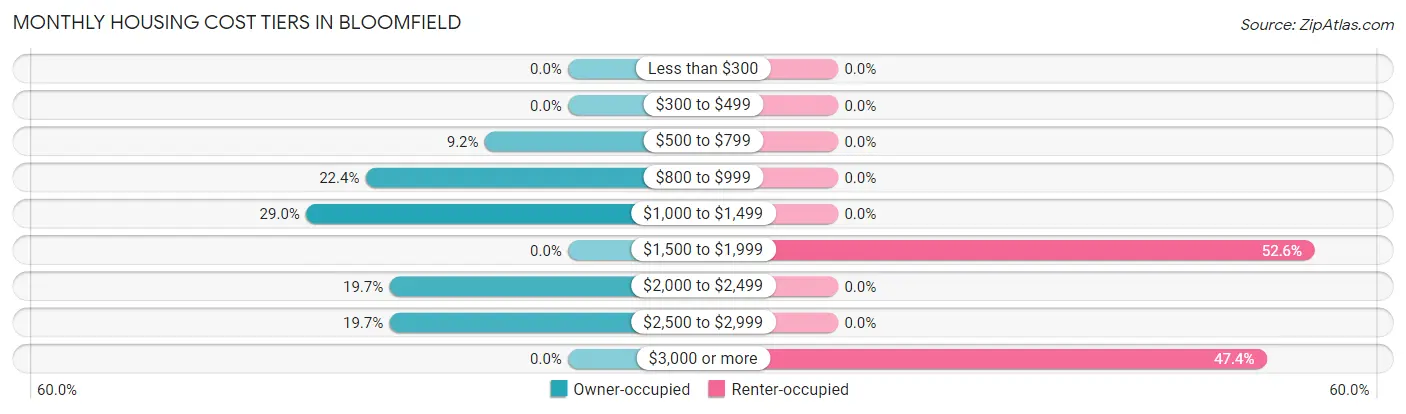
| Monthly Cost | Owner-occupied | Renter-occupied |
| Less than $300 | 0 (0.0%) | 0 (0.0%) |
| $300 to $499 | 0 (0.0%) | 0 (0.0%) |
| $500 to $799 | 7 (9.2%) | 0 (0.0%) |
| $800 to $999 | 17 (22.4%) | 0 (0.0%) |
| $1,000 to $1,499 | 22 (28.9%) | 0 (0.0%) |
| $1,500 to $1,999 | 0 (0.0%) | 10 (52.6%) |
| $2,000 to $2,499 | 15 (19.7%) | 0 (0.0%) |
| $2,500 to $2,999 | 15 (19.7%) | 0 (0.0%) |
| $3,000 or more | 0 (0.0%) | 9 (47.4%) |
| Total | 76 (100.0%) | 19 (100.0%) |
Physical Housing Characteristics in Bloomfield
Housing Structures in Bloomfield
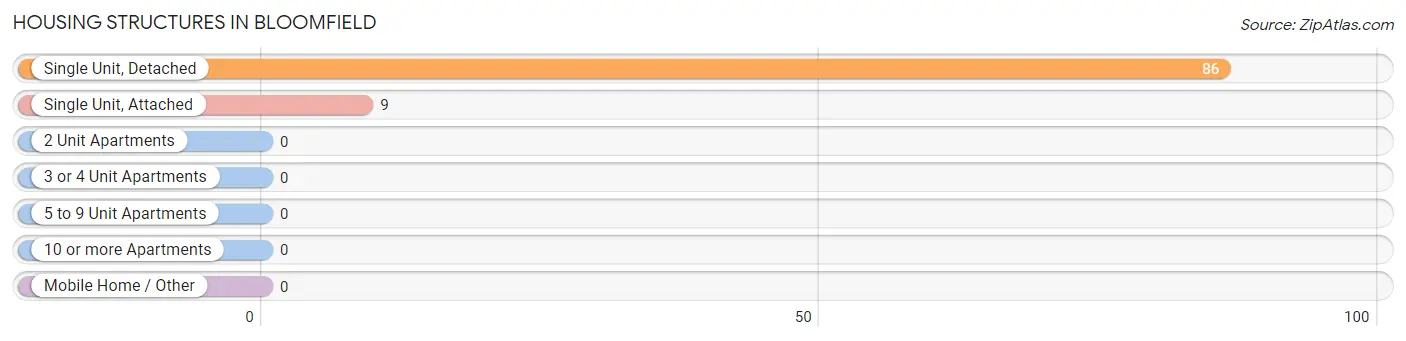
| Structure Type | # Housing Units | % Housing Units |
| Single Unit, Detached | 86 | 90.5% |
| Single Unit, Attached | 9 | 9.5% |
| 2 Unit Apartments | 0 | 0.0% |
| 3 or 4 Unit Apartments | 0 | 0.0% |
| 5 to 9 Unit Apartments | 0 | 0.0% |
| 10 or more Apartments | 0 | 0.0% |
| Mobile Home / Other | 0 | 0.0% |
| Total | 95 | 100.0% |
Housing Structures by Occupancy in Bloomfield
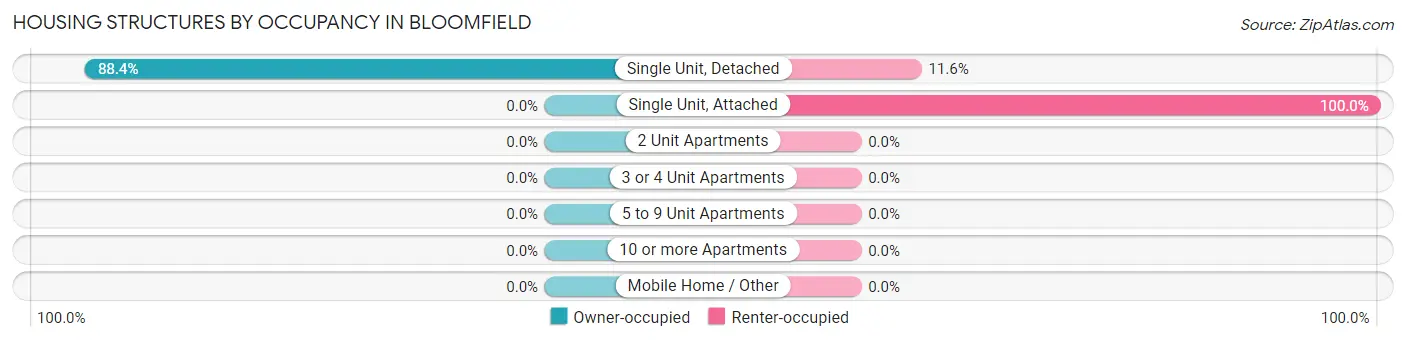
| Structure Type | Owner-occupied | Renter-occupied |
| Single Unit, Detached | 76 (88.4%) | 10 (11.6%) |
| Single Unit, Attached | 0 (0.0%) | 9 (100.0%) |
| 2 Unit Apartments | 0 (0.0%) | 0 (0.0%) |
| 3 or 4 Unit Apartments | 0 (0.0%) | 0 (0.0%) |
| 5 to 9 Unit Apartments | 0 (0.0%) | 0 (0.0%) |
| 10 or more Apartments | 0 (0.0%) | 0 (0.0%) |
| Mobile Home / Other | 0 (0.0%) | 0 (0.0%) |
| Total | 76 (80.0%) | 19 (20.0%) |
Housing Structures by Number of Rooms in Bloomfield
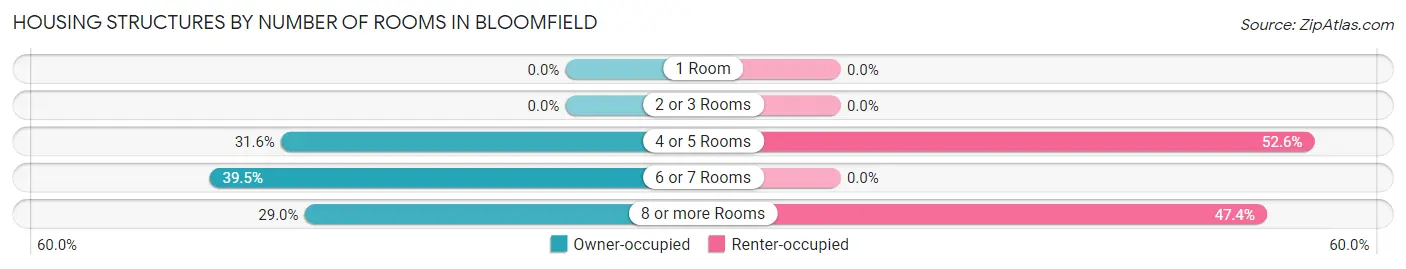
| Number of Rooms | Owner-occupied | Renter-occupied |
| 1 Room | 0 (0.0%) | 0 (0.0%) |
| 2 or 3 Rooms | 0 (0.0%) | 0 (0.0%) |
| 4 or 5 Rooms | 24 (31.6%) | 10 (52.6%) |
| 6 or 7 Rooms | 30 (39.5%) | 0 (0.0%) |
| 8 or more Rooms | 22 (28.9%) | 9 (47.4%) |
| Total | 76 (100.0%) | 19 (100.0%) |
Housing Structure by Heating Type in Bloomfield
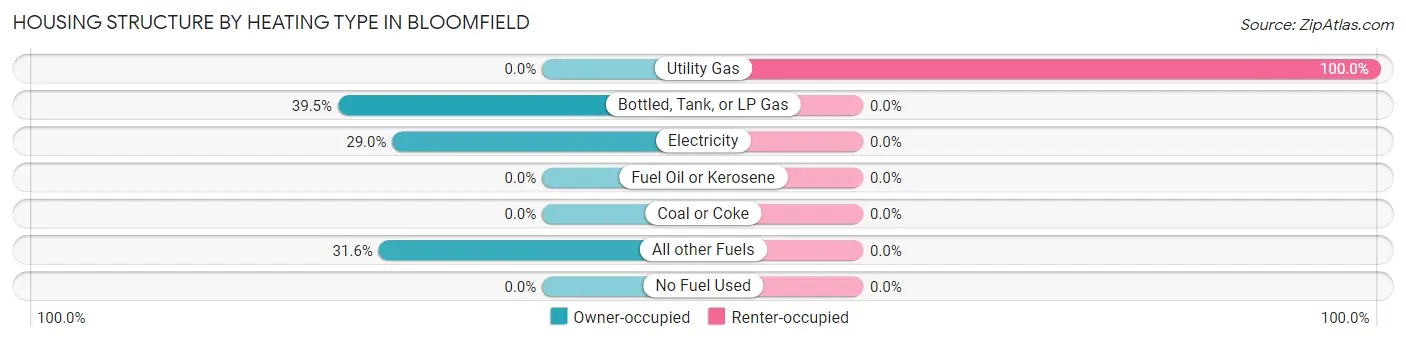
| Heating Type | Owner-occupied | Renter-occupied |
| Utility Gas | 0 (0.0%) | 19 (100.0%) |
| Bottled, Tank, or LP Gas | 30 (39.5%) | 0 (0.0%) |
| Electricity | 22 (28.9%) | 0 (0.0%) |
| Fuel Oil or Kerosene | 0 (0.0%) | 0 (0.0%) |
| Coal or Coke | 0 (0.0%) | 0 (0.0%) |
| All other Fuels | 24 (31.6%) | 0 (0.0%) |
| No Fuel Used | 0 (0.0%) | 0 (0.0%) |
| Total | 76 (100.0%) | 19 (100.0%) |
Household Vehicle Usage in Bloomfield
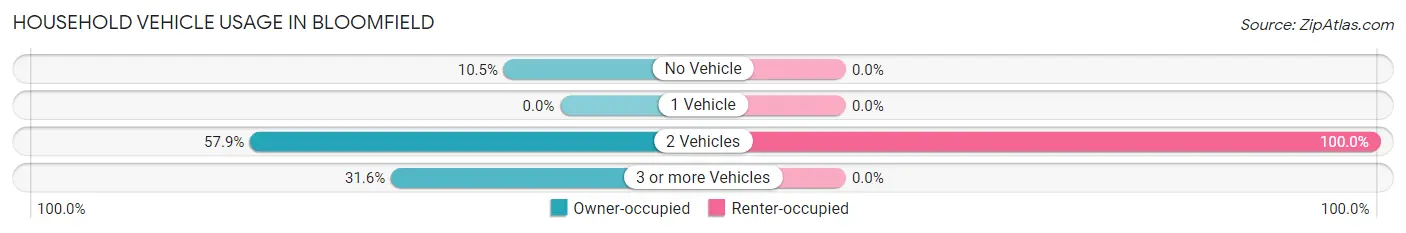
| Vehicles per Household | Owner-occupied | Renter-occupied |
| No Vehicle | 8 (10.5%) | 0 (0.0%) |
| 1 Vehicle | 0 (0.0%) | 0 (0.0%) |
| 2 Vehicles | 44 (57.9%) | 19 (100.0%) |
| 3 or more Vehicles | 24 (31.6%) | 0 (0.0%) |
| Total | 76 (100.0%) | 19 (100.0%) |
Real Estate & Mortgages in Bloomfield
Real Estate and Mortgage Overview in Bloomfield
| Characteristic | Without Mortgage | With Mortgage |
| Housing Units | 46 | 30 |
| Median Property Value | $1,235,300 | $0 |
| Median Household Income | - | - |
| Monthly Housing Costs | $989 | $0 |
| Real Estate Taxes | $6,618 | $0 |
Property Value by Mortgage Status in Bloomfield
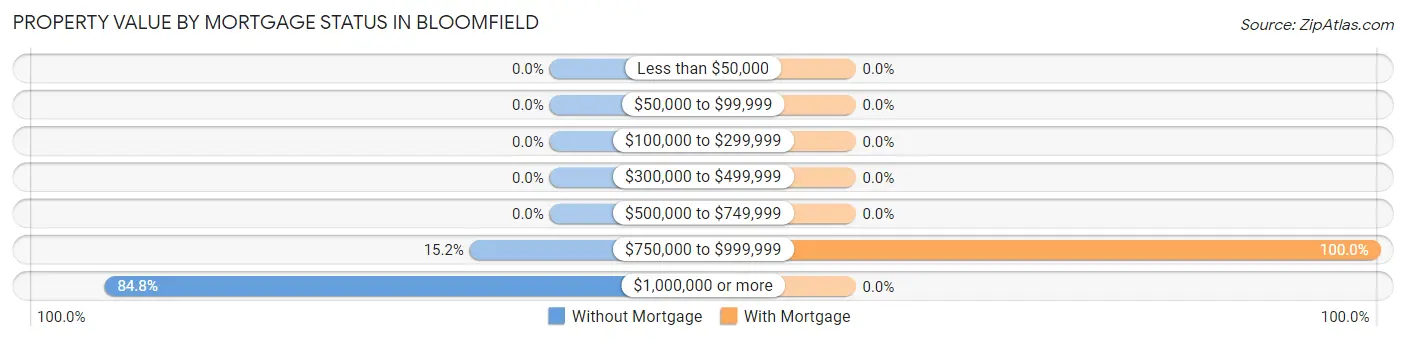
| Property Value | Without Mortgage | With Mortgage |
| Less than $50,000 | 0 (0.0%) | 0 (0.0%) |
| $50,000 to $99,999 | 0 (0.0%) | 0 (0.0%) |
| $100,000 to $299,999 | 0 (0.0%) | 0 (0.0%) |
| $300,000 to $499,999 | 0 (0.0%) | 0 (0.0%) |
| $500,000 to $749,999 | 0 (0.0%) | 0 (0.0%) |
| $750,000 to $999,999 | 7 (15.2%) | 30 (100.0%) |
| $1,000,000 or more | 39 (84.8%) | 0 (0.0%) |
| Total | 46 (100.0%) | 30 (100.0%) |
Household Income by Mortgage Status in Bloomfield
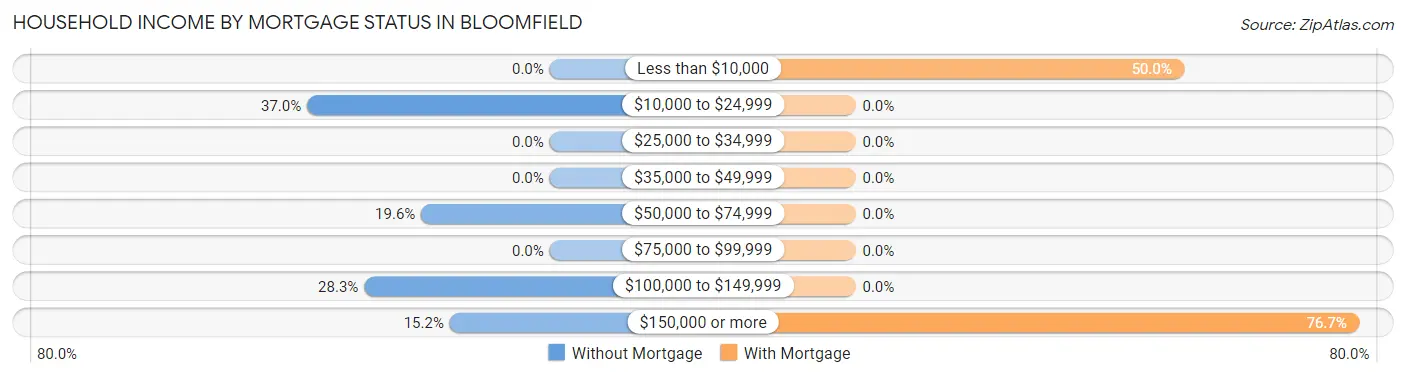
| Household Income | Without Mortgage | With Mortgage |
| Less than $10,000 | 0 (0.0%) | 15 (50.0%) |
| $10,000 to $24,999 | 17 (37.0%) | 0 (0.0%) |
| $25,000 to $34,999 | 0 (0.0%) | 0 (0.0%) |
| $35,000 to $49,999 | 0 (0.0%) | 0 (0.0%) |
| $50,000 to $74,999 | 9 (19.6%) | 0 (0.0%) |
| $75,000 to $99,999 | 0 (0.0%) | 0 (0.0%) |
| $100,000 to $149,999 | 13 (28.3%) | 0 (0.0%) |
| $150,000 or more | 7 (15.2%) | 23 (76.7%) |
| Total | 46 (100.0%) | 30 (100.0%) |
Property Value to Household Income Ratio in Bloomfield
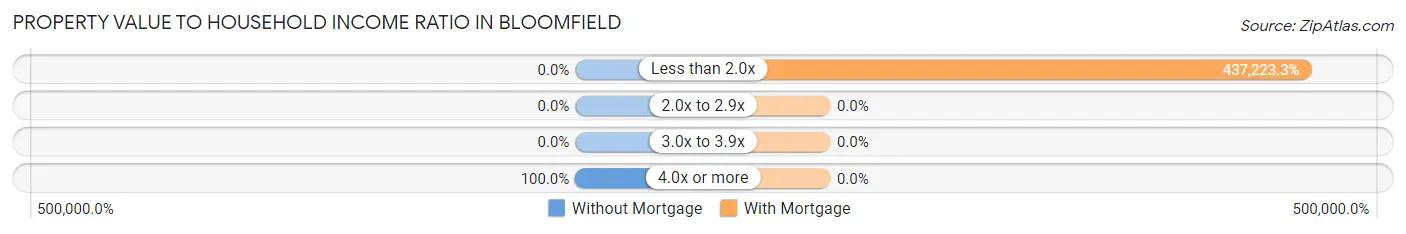
| Value-to-Income Ratio | Without Mortgage | With Mortgage |
| Less than 2.0x | 0 (0.0%) | 131,167 (437,223.3%) |
| 2.0x to 2.9x | 0 (0.0%) | 0 (0.0%) |
| 3.0x to 3.9x | 0 (0.0%) | 0 (0.0%) |
| 4.0x or more | 46 (100.0%) | 0 (0.0%) |
| Total | 46 (100.0%) | 30 (100.0%) |
Real Estate Taxes by Mortgage Status in Bloomfield
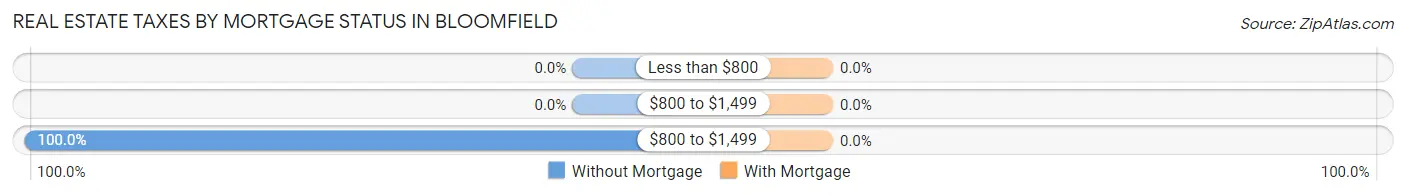
| Property Taxes | Without Mortgage | With Mortgage |
| Less than $800 | 0 (0.0%) | 0 (0.0%) |
| $800 to $1,499 | 0 (0.0%) | 0 (0.0%) |
| $800 to $1,499 | 46 (100.0%) | 0 (0.0%) |
| Total | 46 (100.0%) | 30 (100.0%) |
Health & Disability in Bloomfield
Health Insurance Coverage by Age in Bloomfield
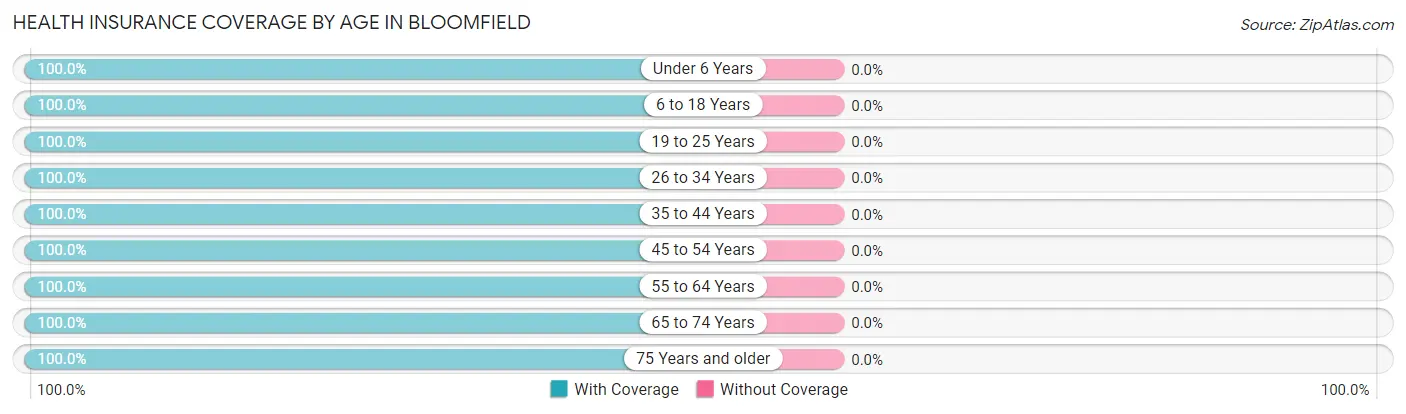
| Age Bracket | With Coverage | Without Coverage |
| Under 6 Years | 6 (100.0%) | 0 (0.0%) |
| 6 to 18 Years | 22 (100.0%) | 0 (0.0%) |
| 19 to 25 Years | 18 (100.0%) | 0 (0.0%) |
| 26 to 34 Years | 16 (100.0%) | 0 (0.0%) |
| 35 to 44 Years | 17 (100.0%) | 0 (0.0%) |
| 45 to 54 Years | 40 (100.0%) | 0 (0.0%) |
| 55 to 64 Years | 17 (100.0%) | 0 (0.0%) |
| 65 to 74 Years | 44 (100.0%) | 0 (0.0%) |
| 75 Years and older | 17 (100.0%) | 0 (0.0%) |
| Total | 197 (100.0%) | 0 (0.0%) |
Health Insurance Coverage by Citizenship Status in Bloomfield
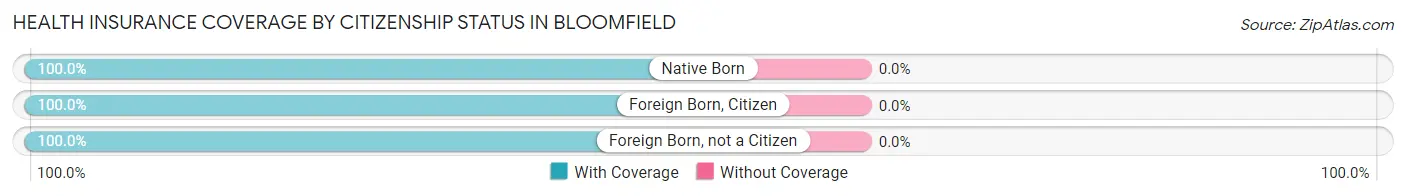
| Citizenship Status | With Coverage | Without Coverage |
| Native Born | 6 (100.0%) | 0 (0.0%) |
| Foreign Born, Citizen | 22 (100.0%) | 0 (0.0%) |
| Foreign Born, not a Citizen | 18 (100.0%) | 0 (0.0%) |
Health Insurance Coverage by Household Income in Bloomfield
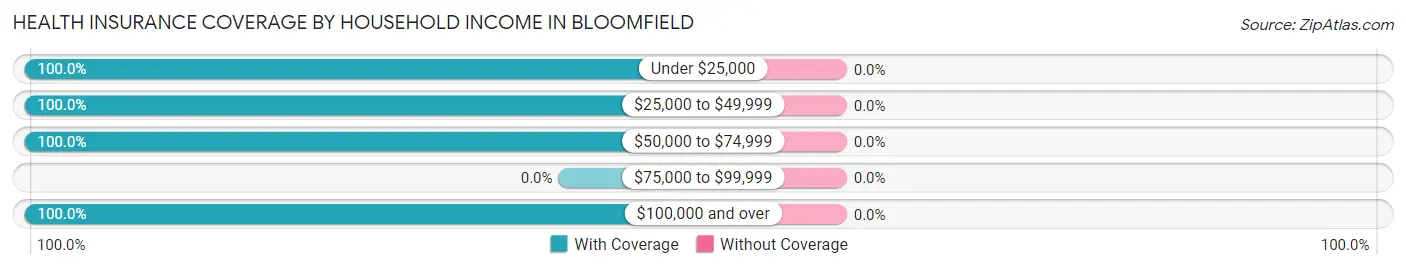
| Household Income | With Coverage | Without Coverage |
| Under $25,000 | 17 (100.0%) | 0 (0.0%) |
| $25,000 to $49,999 | 19 (100.0%) | 0 (0.0%) |
| $50,000 to $74,999 | 9 (100.0%) | 0 (0.0%) |
| $75,000 to $99,999 | 0 (0.0%) | 0 (0.0%) |
| $100,000 and over | 152 (100.0%) | 0 (0.0%) |
Public vs Private Health Insurance Coverage by Age in Bloomfield
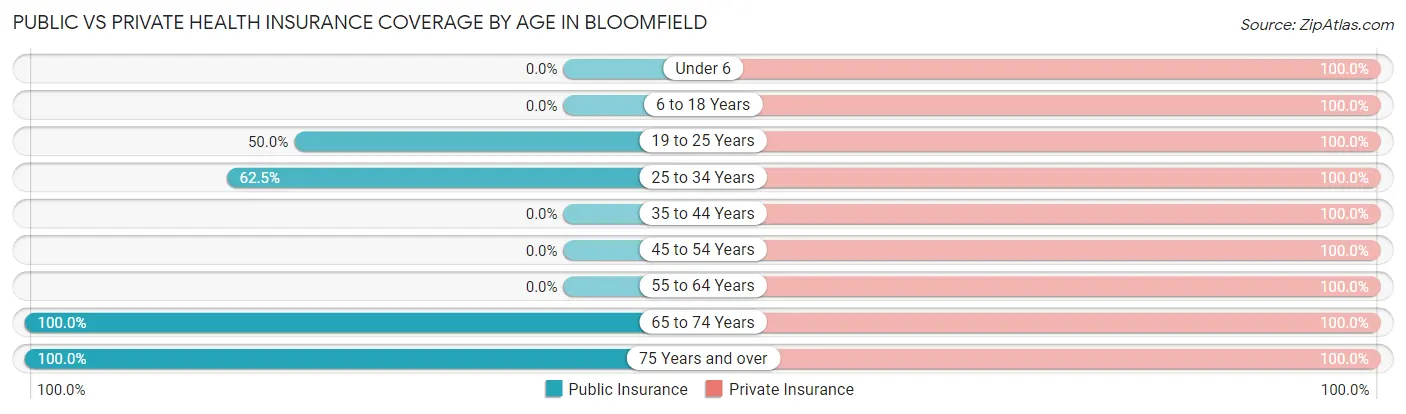
| Age Bracket | Public Insurance | Private Insurance |
| Under 6 | 0 (0.0%) | 6 (100.0%) |
| 6 to 18 Years | 0 (0.0%) | 22 (100.0%) |
| 19 to 25 Years | 9 (50.0%) | 18 (100.0%) |
| 25 to 34 Years | 10 (62.5%) | 16 (100.0%) |
| 35 to 44 Years | 0 (0.0%) | 17 (100.0%) |
| 45 to 54 Years | 0 (0.0%) | 40 (100.0%) |
| 55 to 64 Years | 0 (0.0%) | 17 (100.0%) |
| 65 to 74 Years | 44 (100.0%) | 44 (100.0%) |
| 75 Years and over | 17 (100.0%) | 17 (100.0%) |
| Total | 80 (40.6%) | 197 (100.0%) |
Disability Status by Sex by Age in Bloomfield
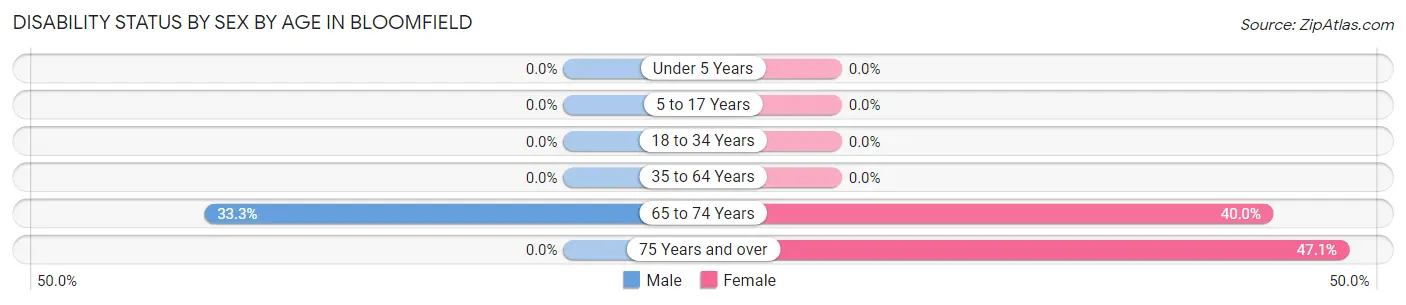
| Age Bracket | Male | Female |
| Under 5 Years | 0 (0.0%) | 0 (0.0%) |
| 5 to 17 Years | 0 (0.0%) | 0 (0.0%) |
| 18 to 34 Years | 0 (0.0%) | 0 (0.0%) |
| 35 to 64 Years | 0 (0.0%) | 0 (0.0%) |
| 65 to 74 Years | 8 (33.3%) | 8 (40.0%) |
| 75 Years and over | 0 (0.0%) | 8 (47.1%) |
Disability Class by Sex by Age in Bloomfield
Disability Class: Hearing Difficulty
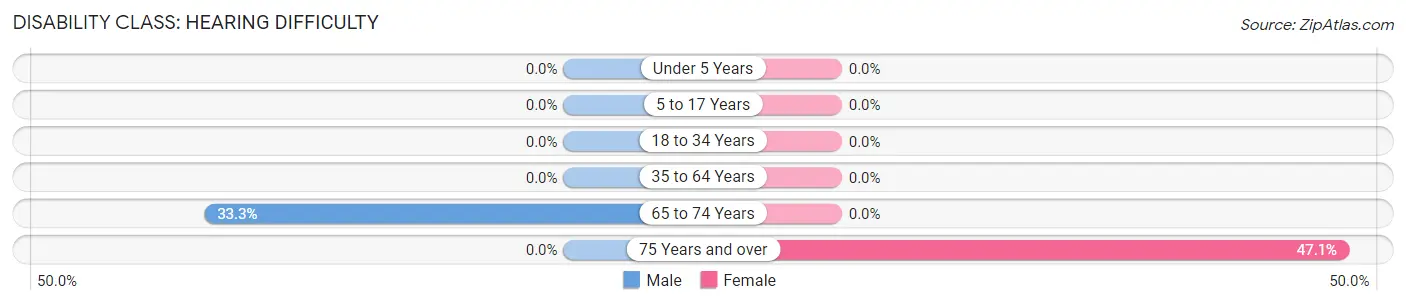
| Age Bracket | Male | Female |
| Under 5 Years | 0 (0.0%) | 0 (0.0%) |
| 5 to 17 Years | 0 (0.0%) | 0 (0.0%) |
| 18 to 34 Years | 0 (0.0%) | 0 (0.0%) |
| 35 to 64 Years | 0 (0.0%) | 0 (0.0%) |
| 65 to 74 Years | 8 (33.3%) | 0 (0.0%) |
| 75 Years and over | 0 (0.0%) | 8 (47.1%) |
Disability Class: Vision Difficulty
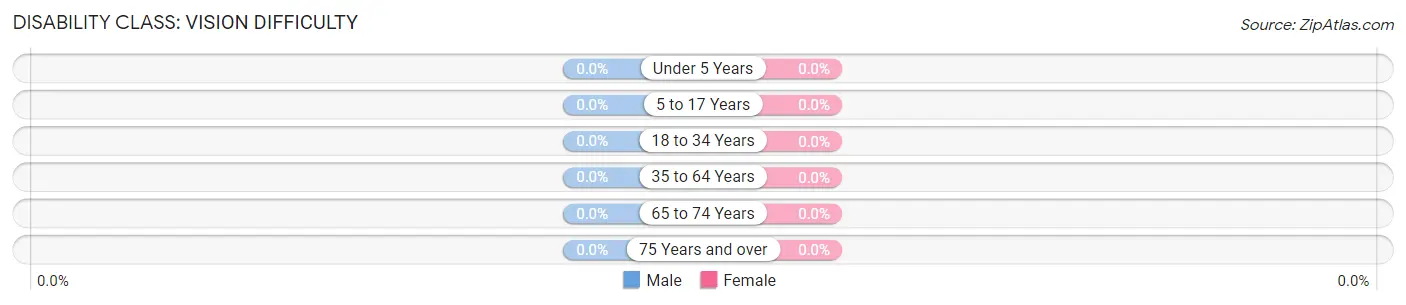
| Age Bracket | Male | Female |
| Under 5 Years | 0 (0.0%) | 0 (0.0%) |
| 5 to 17 Years | 0 (0.0%) | 0 (0.0%) |
| 18 to 34 Years | 0 (0.0%) | 0 (0.0%) |
| 35 to 64 Years | 0 (0.0%) | 0 (0.0%) |
| 65 to 74 Years | 0 (0.0%) | 0 (0.0%) |
| 75 Years and over | 0 (0.0%) | 0 (0.0%) |
Disability Class: Cognitive Difficulty

| Age Bracket | Male | Female |
| 5 to 17 Years | 0 (0.0%) | 0 (0.0%) |
| 18 to 34 Years | 0 (0.0%) | 0 (0.0%) |
| 35 to 64 Years | 0 (0.0%) | 0 (0.0%) |
| 65 to 74 Years | 0 (0.0%) | 0 (0.0%) |
| 75 Years and over | 0 (0.0%) | 0 (0.0%) |
Disability Class: Ambulatory Difficulty
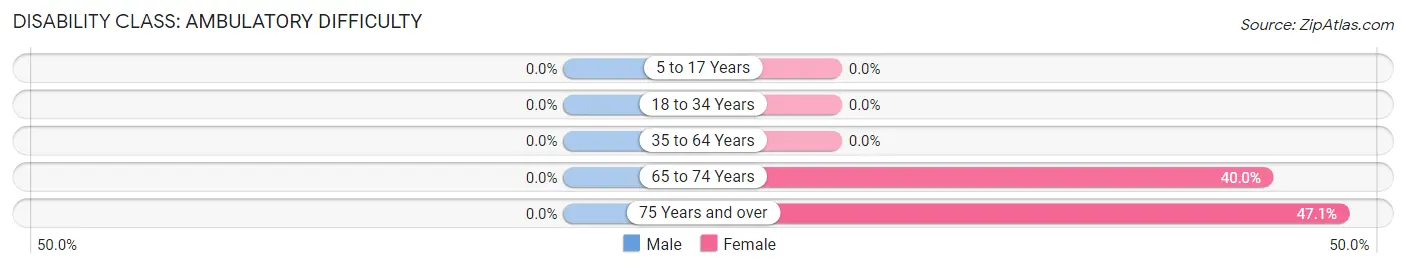
| Age Bracket | Male | Female |
| 5 to 17 Years | 0 (0.0%) | 0 (0.0%) |
| 18 to 34 Years | 0 (0.0%) | 0 (0.0%) |
| 35 to 64 Years | 0 (0.0%) | 0 (0.0%) |
| 65 to 74 Years | 0 (0.0%) | 8 (40.0%) |
| 75 Years and over | 0 (0.0%) | 8 (47.1%) |
Disability Class: Self-Care Difficulty
| Age Bracket | Male | Female |
| 5 to 17 Years | 0 (0.0%) | 0 (0.0%) |
| 18 to 34 Years | 0 (0.0%) | 0 (0.0%) |
| 35 to 64 Years | 0 (0.0%) | 0 (0.0%) |
| 65 to 74 Years | 0 (0.0%) | 0 (0.0%) |
| 75 Years and over | 0 (0.0%) | 0 (0.0%) |
Technology Access in Bloomfield
Computing Device Access in Bloomfield
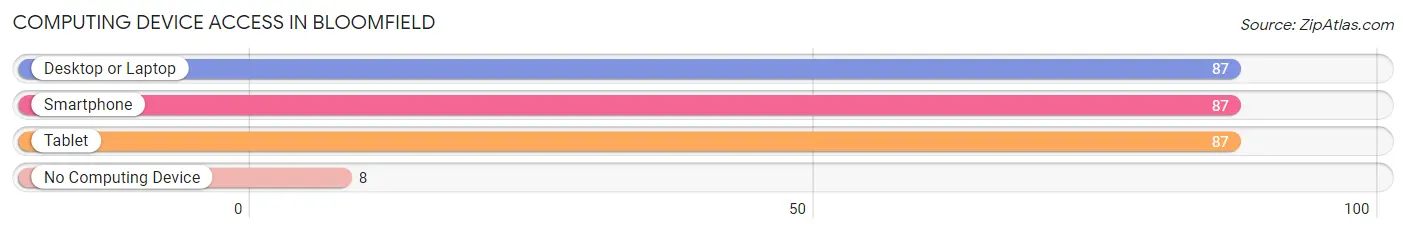
| Device Type | # Households | % Households |
| Desktop or Laptop | 87 | 91.6% |
| Smartphone | 87 | 91.6% |
| Tablet | 87 | 91.6% |
| No Computing Device | 8 | 8.4% |
| Total | 95 | 100.0% |
Internet Access in Bloomfield
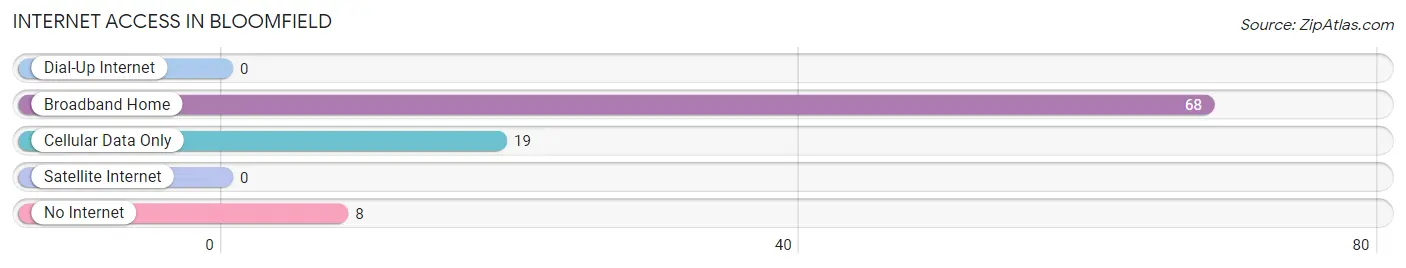
| Internet Type | # Households | % Households |
| Dial-Up Internet | 0 | 0.0% |
| Broadband Home | 68 | 71.6% |
| Cellular Data Only | 19 | 20.0% |
| Satellite Internet | 0 | 0.0% |
| No Internet | 8 | 8.4% |
| Total | 95 | 100.0% |
Bloomfield Summary
Bloomfield is a small town located in Sonoma County, California. It is situated in the northern part of the county, about 10 miles east of the city of Santa Rosa. The town has a population of about 1,500 people and covers an area of 1.2 square miles.
History
The area that is now Bloomfield was originally inhabited by the Coast Miwok Native Americans. The first European settlers arrived in the area in the mid-1800s. The town was founded in 1876 by William Bloomfield, who named it after himself. He built a hotel and a general store, and the town quickly grew. By the early 1900s, Bloomfield had become a popular destination for tourists, and the town had several hotels, restaurants, and stores.
In the early 1900s, the town was also home to a large dairy farm. The dairy farm was owned by the Bloomfield family, and it was one of the largest in the area. The dairy farm was eventually sold in the 1950s, and the town began to decline. In the late 1970s, the town was revitalized when a group of local residents formed the Bloomfield Historical Society. The society worked to preserve the town’s history and to promote tourism.
Geography
Bloomfield is located in the northern part of Sonoma County, about 10 miles east of the city of Santa Rosa. The town is situated in a valley surrounded by rolling hills. The town is located at an elevation of about 500 feet above sea level. The climate in Bloomfield is mild, with temperatures ranging from the low 40s in the winter to the high 80s in the summer.
Economy
The economy of Bloomfield is largely based on tourism. The town is home to several wineries, and it is a popular destination for wine tasting. The town also has several restaurants, shops, and art galleries. In addition, the town is home to a number of small businesses, including a bakery, a hardware store, and a gas station.
Demographics
As of the 2010 census, the population of Bloomfield was 1,500. The racial makeup of the town was 87.3% White, 4.3% Hispanic or Latino, 2.7% Asian, and 1.7% African American. The median household income in Bloomfield was $60,000, and the median home value was $400,000. The town has a high rate of homeownership, with nearly 80% of residents owning their own homes.
Common Questions
What is Per Capita Income in Bloomfield?
Per Capita income in Bloomfield is $55,843.
What is the Median Family Income in Bloomfield?
Median Family Income in Bloomfield is $155,357.
What is the Median Household income in Bloomfield?
Median Household Income in Bloomfield is $124,250.
What is Inequality or Gini Index in Bloomfield?
Inequality or Gini Index in Bloomfield is 0.41.
What is the Total Population of Bloomfield?
Total Population of Bloomfield is 197.
What is the Total Male Population of Bloomfield?
Total Male Population of Bloomfield is 66.
What is the Total Female Population of Bloomfield?
Total Female Population of Bloomfield is 131.
What is the Ratio of Males per 100 Females in Bloomfield?
There are 50.38 Males per 100 Females in Bloomfield.
What is the Ratio of Females per 100 Males in Bloomfield?
There are 198.48 Females per 100 Males in Bloomfield.
What is the Median Population Age in Bloomfield?
Median Population Age in Bloomfield is 51.6 Years.
What is the Average Family Size in Bloomfield
Average Family Size in Bloomfield is 2.9 People.
What is the Average Household Size in Bloomfield
Average Household Size in Bloomfield is 2.1 People.
How Large is the Labor Force in Bloomfield?
There are 120 People in the Labor Forcein in Bloomfield.
What is the Percentage of People in the Labor Force in Bloomfield?
71.0% of People are in the Labor Force in Bloomfield.