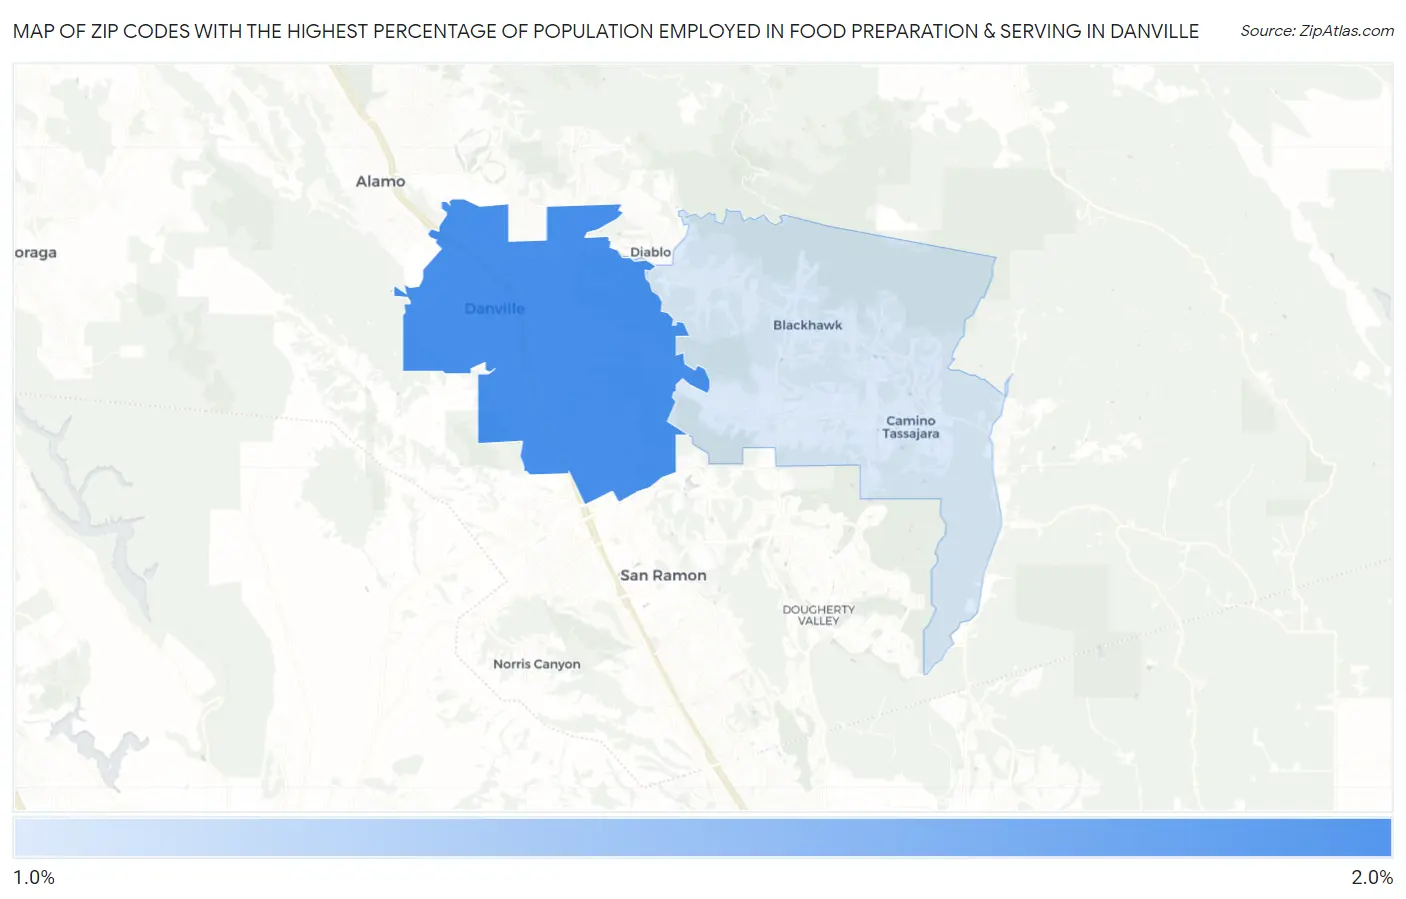
Zip Codes with the Highest Percentage of Population Employed in Food Preparation & Serving in Danville, CA
RELATED REPORTS & OPTIONS
Food Preparation & Serving
Danville
Compare Zip Codes
Map of Zip Codes with the Highest Percentage of Population Employed in Food Preparation & Serving in Danville
1.5%
1.8%
Zip Codes with the Highest Percentage of Population Employed in Food Preparation & Serving in Danville, CA
| Zip Code | % Employed | vs State | vs National | |
| 1. | 94526 | 1.8% | 5.4%(-3.60)#1,414 | 5.3%(-3.51)#25,317 |
| 2. | 94506 | 1.5% | 5.4%(-3.89)#1,442 | 5.3%(-3.79)#26,012 |
1
Common Questions
What are the Top Zip Codes with the Highest Percentage of Population Employed in Food Preparation & Serving in Danville, CA?
Top Zip Codes with the Highest Percentage of Population Employed in Food Preparation & Serving in Danville, CA are:
What zip code has the Highest Percentage of Population Employed in Food Preparation & Serving in Danville, CA?
94526 has the Highest Percentage of Population Employed in Food Preparation & Serving in Danville, CA with 1.8%.
What is the Percentage of Population Employed in Food Preparation & Serving in Danville, CA?
Percentage of Population Employed in Food Preparation & Serving in Danville is 1.6%.
What is the Percentage of Population Employed in Food Preparation & Serving in California?
Percentage of Population Employed in Food Preparation & Serving in California is 5.4%.
What is the Percentage of Population Employed in Food Preparation & Serving in the United States?
Percentage of Population Employed in Food Preparation & Serving in the United States is 5.3%.