Zip Codes with the Highest Percentage of Population Employed in Food Preparation & Serving in Grass Valley, CA
RELATED REPORTS & OPTIONS
Food Preparation & Serving
Grass Valley
Compare Zip Codes
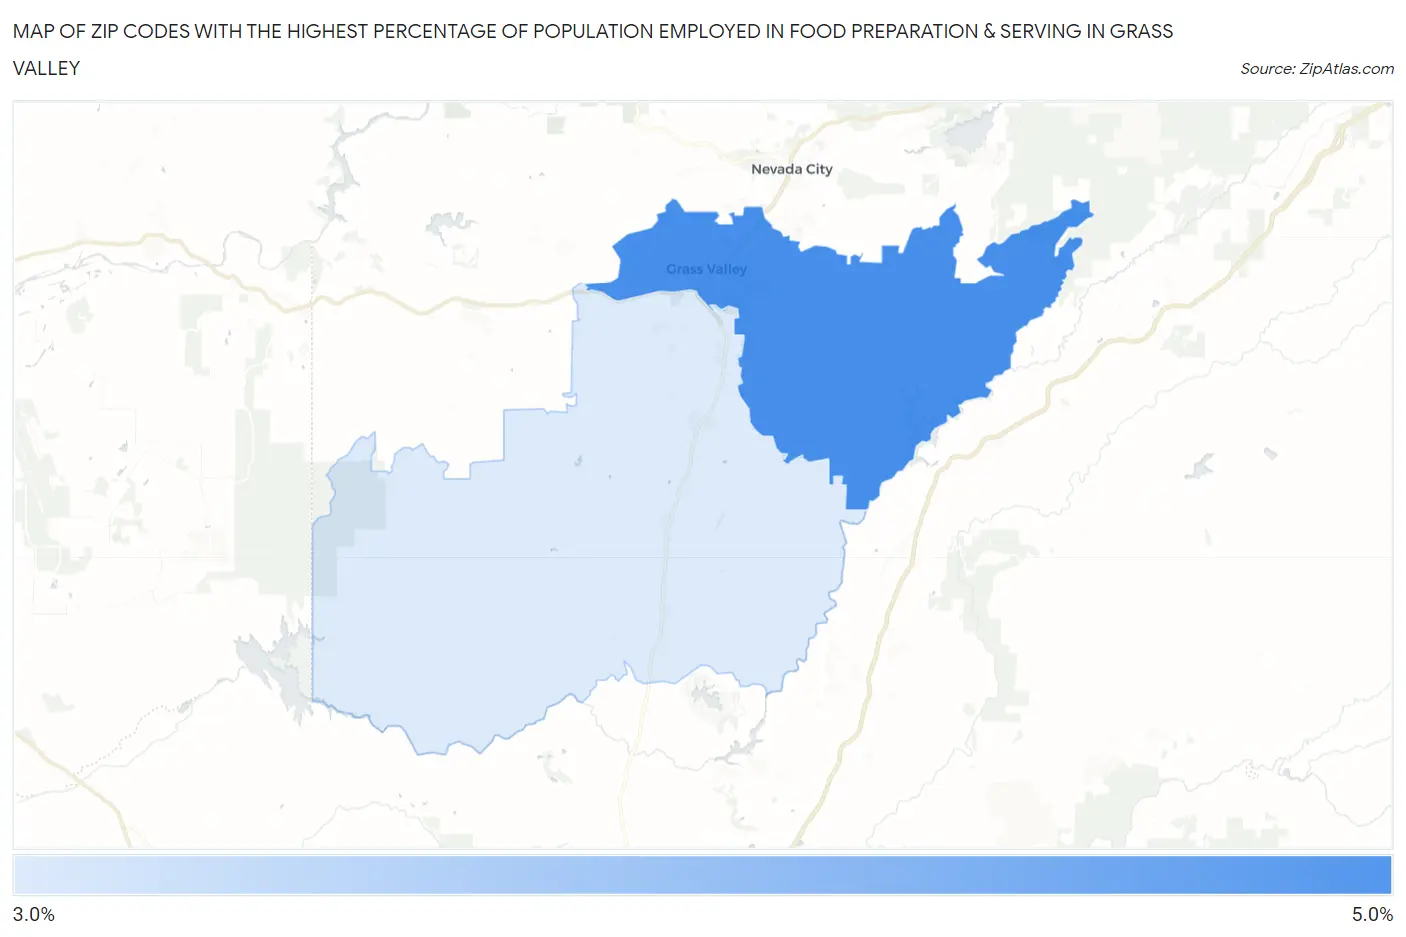
Map of Zip Codes with the Highest Percentage of Population Employed in Food Preparation & Serving in Grass Valley
3.4%
4.5%
Zip Codes with the Highest Percentage of Population Employed in Food Preparation & Serving in Grass Valley, CA
| Zip Code | % Employed | vs State | vs National | |
| 1. | 95945 | 4.5% | 5.4%(-0.877)#910 | 5.3%(-0.780)#15,005 |
| 2. | 95949 | 3.4% | 5.4%(-1.96)#1,135 | 5.3%(-1.86)#19,520 |
1
Common Questions
What are the Top Zip Codes with the Highest Percentage of Population Employed in Food Preparation & Serving in Grass Valley, CA?
Top Zip Codes with the Highest Percentage of Population Employed in Food Preparation & Serving in Grass Valley, CA are:
What zip code has the Highest Percentage of Population Employed in Food Preparation & Serving in Grass Valley, CA?
95945 has the Highest Percentage of Population Employed in Food Preparation & Serving in Grass Valley, CA with 4.5%.
What is the Percentage of Population Employed in Food Preparation & Serving in Grass Valley, CA?
Percentage of Population Employed in Food Preparation & Serving in Grass Valley is 5.0%.
What is the Percentage of Population Employed in Food Preparation & Serving in California?
Percentage of Population Employed in Food Preparation & Serving in California is 5.4%.
What is the Percentage of Population Employed in Food Preparation & Serving in the United States?
Percentage of Population Employed in Food Preparation & Serving in the United States is 5.3%.