Covelo, CA Map & Demographics
Covelo Map
Covelo Overview
$18,649
PER CAPITA INCOME
$36,921
AVG FAMILY INCOME
$45,162
AVG HOUSEHOLD INCOME
39.3%
WAGE / INCOME GAP [ % ]
60.7¢/ $1
WAGE / INCOME GAP [ $ ]
0.45
INEQUALITY / GINI INDEX
1,359
TOTAL POPULATION
703
MALE POPULATION
656
FEMALE POPULATION
107.16
MALES / 100 FEMALES
93.31
FEMALES / 100 MALES
34.5
MEDIAN AGE
3.4
AVG FAMILY SIZE
3.1
AVG HOUSEHOLD SIZE
497
LABOR FORCE [ PEOPLE ]
52.6%
PERCENT IN LABOR FORCE
26.4%
UNEMPLOYMENT RATE
Covelo Zip Codes
Covelo Area Codes
Income in Covelo
Income Overview in Covelo
Per Capita Income in Covelo is $18,649, while median incomes of families and households are $36,921 and $45,162 respectively.
| Characteristic | Number | Measure |
| Per Capita Income | 1,359 | $18,649 |
| Median Family Income | 315 | $36,921 |
| Mean Family Income | 315 | $45,913 |
| Median Household Income | 431 | $45,162 |
| Mean Household Income | 431 | $51,812 |
| Income Deficit | 315 | $0 |
| Wage / Income Gap (%) | 1,359 | 39.27% |
| Wage / Income Gap ($) | 1,359 | 60.73¢ per $1 |
| Gini / Inequality Index | 1,359 | 0.45 |
Earnings by Sex in Covelo
Average Earnings in Covelo are $25,045, $35,221 for men and $21,389 for women, a difference of 39.3%.
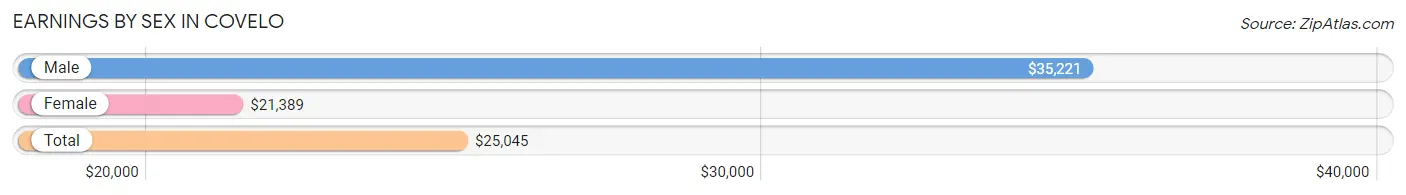
| Sex | Number | Average Earnings |
| Male | 295 (59.8%) | $35,221 |
| Female | 198 (40.2%) | $21,389 |
| Total | 493 (100.0%) | $25,045 |
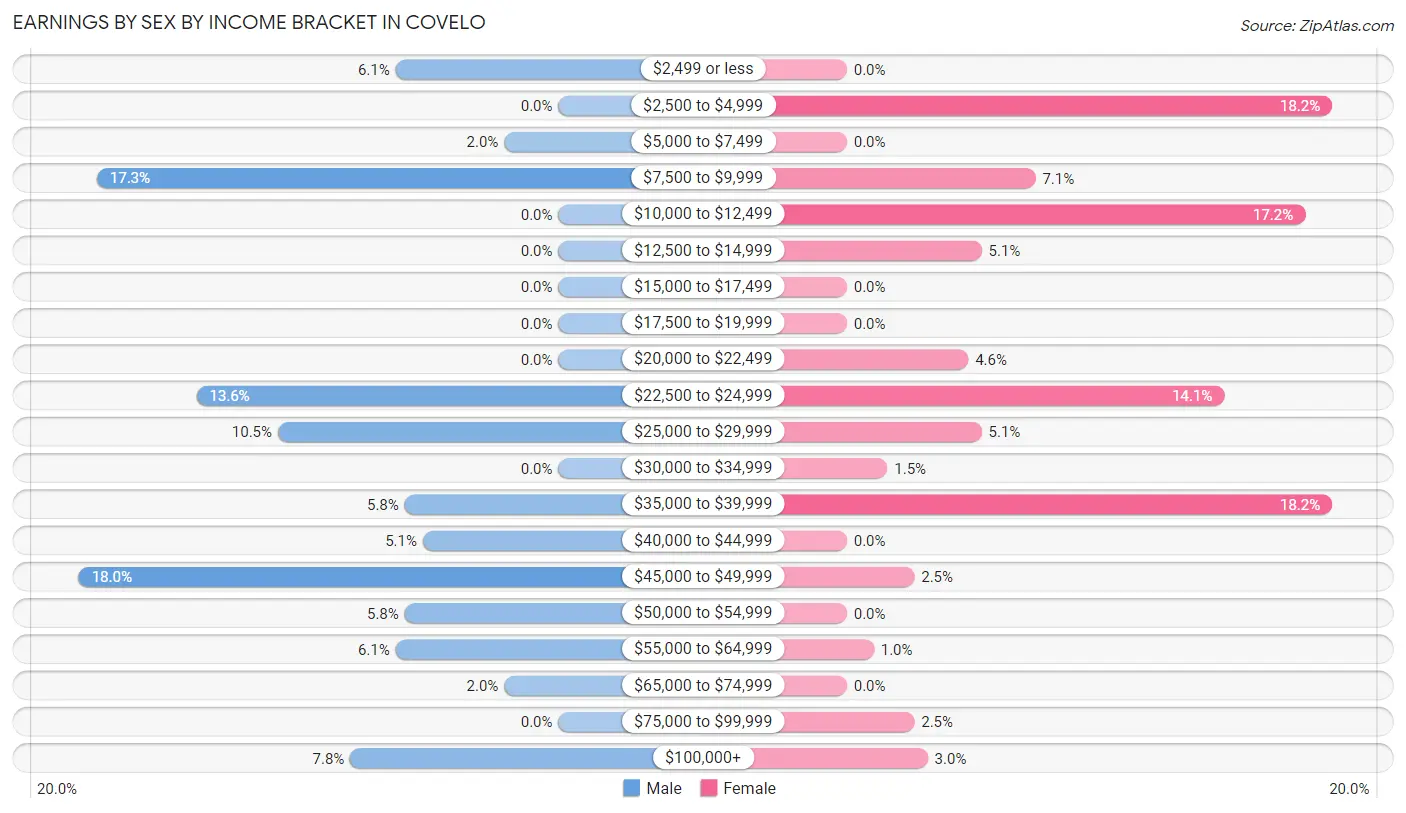
Earnings by Sex by Income Bracket in Covelo
The most common earnings brackets in Covelo are $45,000 to $49,999 for men (53 | 18.0%) and $2,500 to $4,999 for women (36 | 18.2%).
| Income | Male | Female |
| $2,499 or less | 18 (6.1%) | 0 (0.0%) |
| $2,500 to $4,999 | 0 (0.0%) | 36 (18.2%) |
| $5,000 to $7,499 | 6 (2.0%) | 0 (0.0%) |
| $7,500 to $9,999 | 51 (17.3%) | 14 (7.1%) |
| $10,000 to $12,499 | 0 (0.0%) | 34 (17.2%) |
| $12,500 to $14,999 | 0 (0.0%) | 10 (5.1%) |
| $15,000 to $17,499 | 0 (0.0%) | 0 (0.0%) |
| $17,500 to $19,999 | 0 (0.0%) | 0 (0.0%) |
| $20,000 to $22,499 | 0 (0.0%) | 9 (4.5%) |
| $22,500 to $24,999 | 40 (13.6%) | 28 (14.1%) |
| $25,000 to $29,999 | 31 (10.5%) | 10 (5.1%) |
| $30,000 to $34,999 | 0 (0.0%) | 3 (1.5%) |
| $35,000 to $39,999 | 17 (5.8%) | 36 (18.2%) |
| $40,000 to $44,999 | 15 (5.1%) | 0 (0.0%) |
| $45,000 to $49,999 | 53 (18.0%) | 5 (2.5%) |
| $50,000 to $54,999 | 17 (5.8%) | 0 (0.0%) |
| $55,000 to $64,999 | 18 (6.1%) | 2 (1.0%) |
| $65,000 to $74,999 | 6 (2.0%) | 0 (0.0%) |
| $75,000 to $99,999 | 0 (0.0%) | 5 (2.5%) |
| $100,000+ | 23 (7.8%) | 6 (3.0%) |
| Total | 295 (100.0%) | 198 (100.0%) |
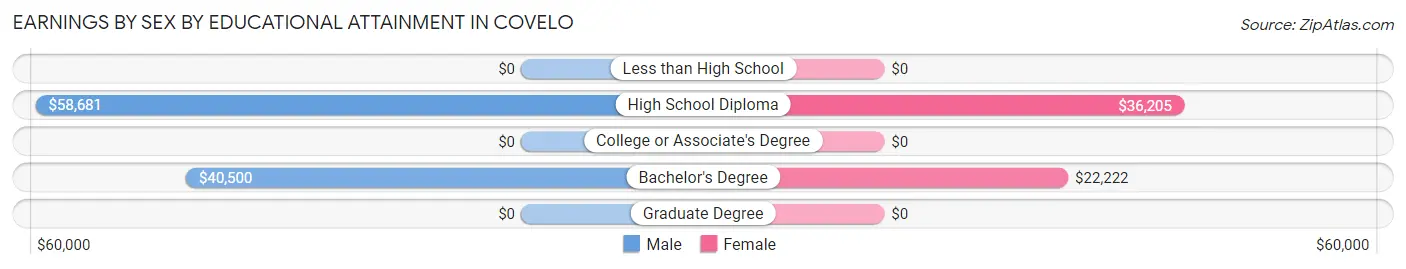
Earnings by Sex by Educational Attainment in Covelo
Average earnings in Covelo are $35,809 for men and $20,278 for women, a difference of 43.4%. Men with an educational attainment of high school diploma enjoy the highest average annual earnings of $58,681, while those with bachelor's degree education earn the least with $40,500. Women with an educational attainment of high school diploma earn the most with the average annual earnings of $36,205, while those with bachelor's degree education have the smallest earnings of $22,222.
| Educational Attainment | Male Income | Female Income |
| Less than High School | - | - |
| High School Diploma | $58,681 | $36,205 |
| College or Associate's Degree | - | - |
| Bachelor's Degree | $40,500 | $22,222 |
| Graduate Degree | - | - |
| Total | $35,809 | $20,278 |
Family Income in Covelo
Family Income Brackets in Covelo
According to the Covelo family income data, there are 93 families falling into the $35,000 to $49,999 income range, which is the most common income bracket and makes up 29.5% of all families. Conversely, the $150,000 to $199,999 income bracket is the least frequent group with only 2 families (0.6%) belonging to this category.
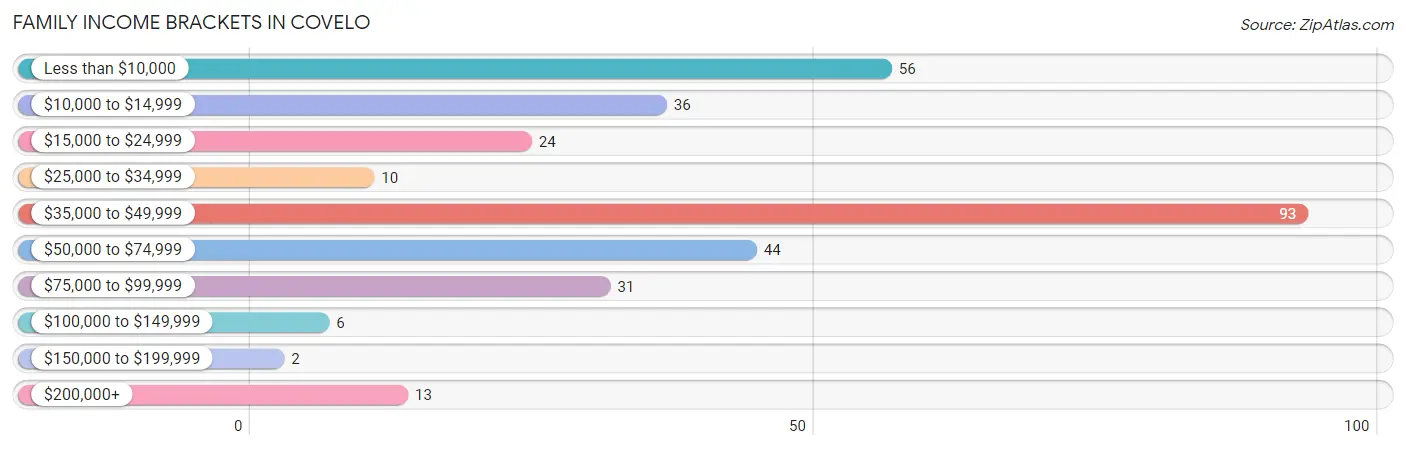
| Income Bracket | # Families | % Families |
| Less than $10,000 | 56 | 17.8% |
| $10,000 to $14,999 | 36 | 11.4% |
| $15,000 to $24,999 | 24 | 7.6% |
| $25,000 to $34,999 | 10 | 3.2% |
| $35,000 to $49,999 | 93 | 29.5% |
| $50,000 to $74,999 | 44 | 14.0% |
| $75,000 to $99,999 | 31 | 9.8% |
| $100,000 to $149,999 | 6 | 1.9% |
| $150,000 to $199,999 | 2 | 0.6% |
| $200,000+ | 13 | 4.1% |
Family Income by Famaliy Size in Covelo
2-person families (114 | 36.2%) account for the highest median family income in Covelo with $46,500 per family, while 2-person families (114 | 36.2%) have the highest median income of $23,250 per family member.
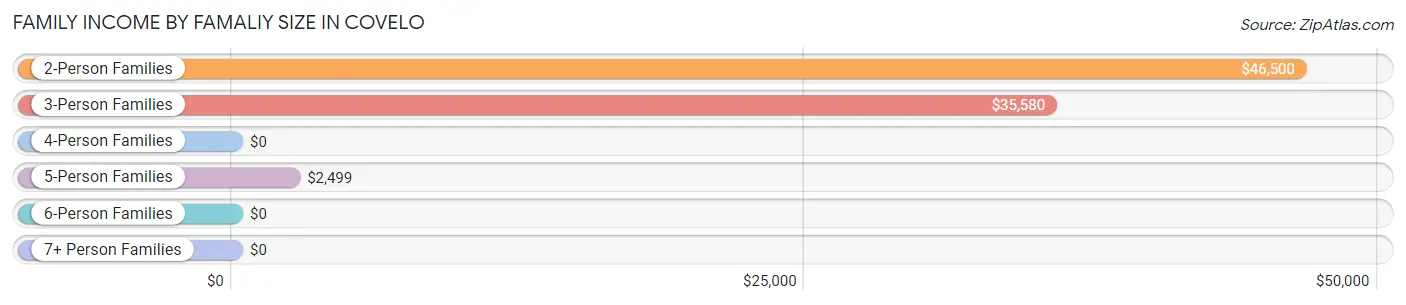
| Income Bracket | # Families | Median Income |
| 2-Person Families | 114 (36.2%) | $46,500 |
| 3-Person Families | 113 (35.9%) | $35,580 |
| 4-Person Families | 20 (6.4%) | $0 |
| 5-Person Families | 41 (13.0%) | $2,499 |
| 6-Person Families | 27 (8.6%) | $0 |
| 7+ Person Families | 0 (0.0%) | $0 |
| Total | 315 (100.0%) | $36,921 |
Family Income by Number of Earners in Covelo
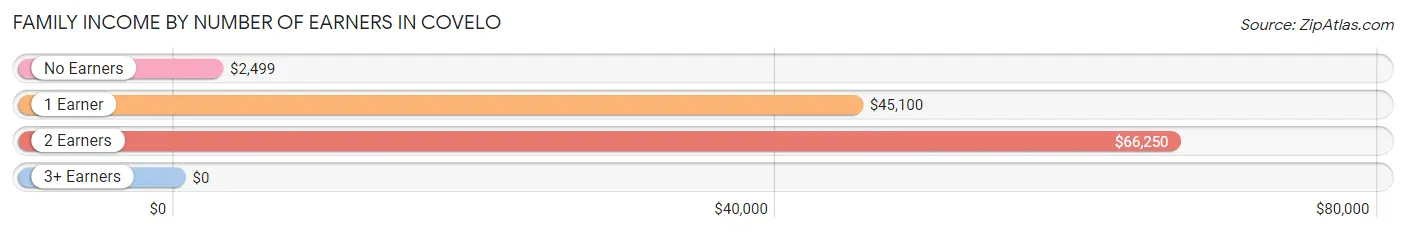
| Number of Earners | # Families | Median Income |
| No Earners | 81 (25.7%) | $2,499 |
| 1 Earner | 176 (55.9%) | $45,100 |
| 2 Earners | 56 (17.8%) | $66,250 |
| 3+ Earners | 2 (0.6%) | $0 |
| Total | 315 (100.0%) | $36,921 |
Household Income in Covelo
Household Income Brackets in Covelo
With 120 households falling in the category, the $35,000 to $49,999 income range is the most frequent in Covelo, accounting for 27.8% of all households. In contrast, only 10 households (2.3%) fall into the $150,000 to $199,999 income bracket, making it the least populous group.
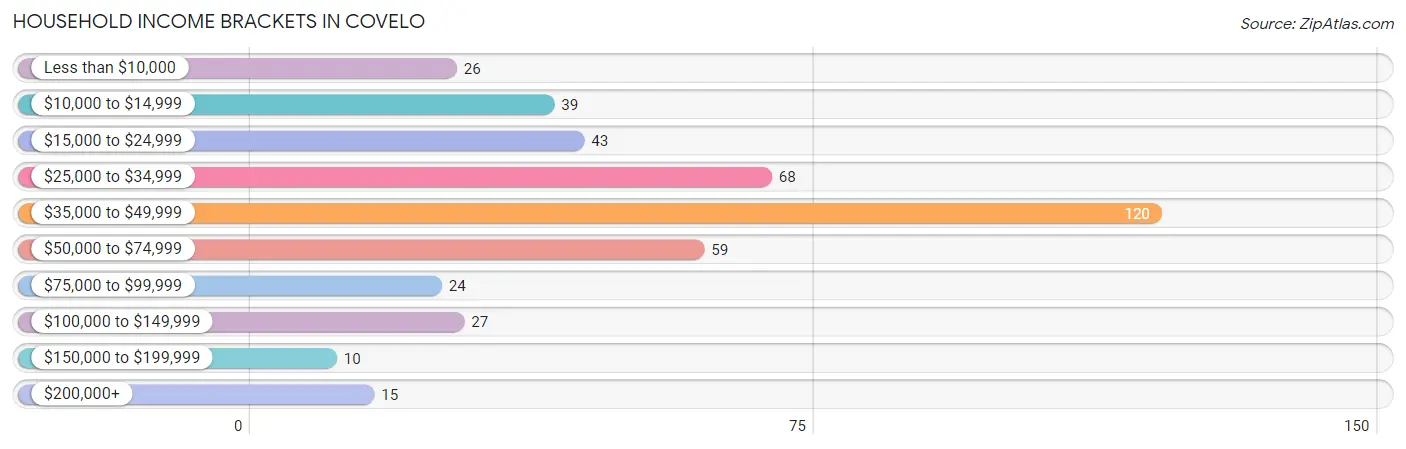
| Income Bracket | # Households | % Households |
| Less than $10,000 | 26 | 6.0% |
| $10,000 to $14,999 | 39 | 9.0% |
| $15,000 to $24,999 | 43 | 10.0% |
| $25,000 to $34,999 | 68 | 15.8% |
| $35,000 to $49,999 | 120 | 27.8% |
| $50,000 to $74,999 | 59 | 13.7% |
| $75,000 to $99,999 | 24 | 5.6% |
| $100,000 to $149,999 | 27 | 6.3% |
| $150,000 to $199,999 | 10 | 2.3% |
| $200,000+ | 15 | 3.5% |
Household Income by Householder Age in Covelo
The median household income in Covelo is $45,162, with the highest median household income of $46,400 found in the 45 to 64 years age bracket for the primary householder. A total of 68 households (15.8%) fall into this category.
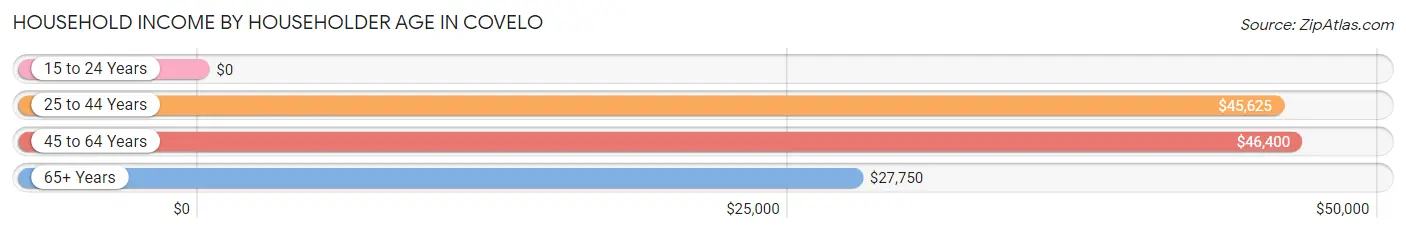
| Income Bracket | # Households | Median Income |
| 15 to 24 Years | 0 (0.0%) | $0 |
| 25 to 44 Years | 214 (49.6%) | $45,625 |
| 45 to 64 Years | 68 (15.8%) | $46,400 |
| 65+ Years | 149 (34.6%) | $27,750 |
| Total | 431 (100.0%) | $45,162 |
Poverty in Covelo
Income Below Poverty by Sex and Age in Covelo
With 36.3% poverty level for males and 37.7% for females among the residents of Covelo, 5 year old males and 15 year old females are the most vulnerable to poverty, with 12 males (100.0%) and 8 females (100.0%) in their respective age groups living below the poverty level.
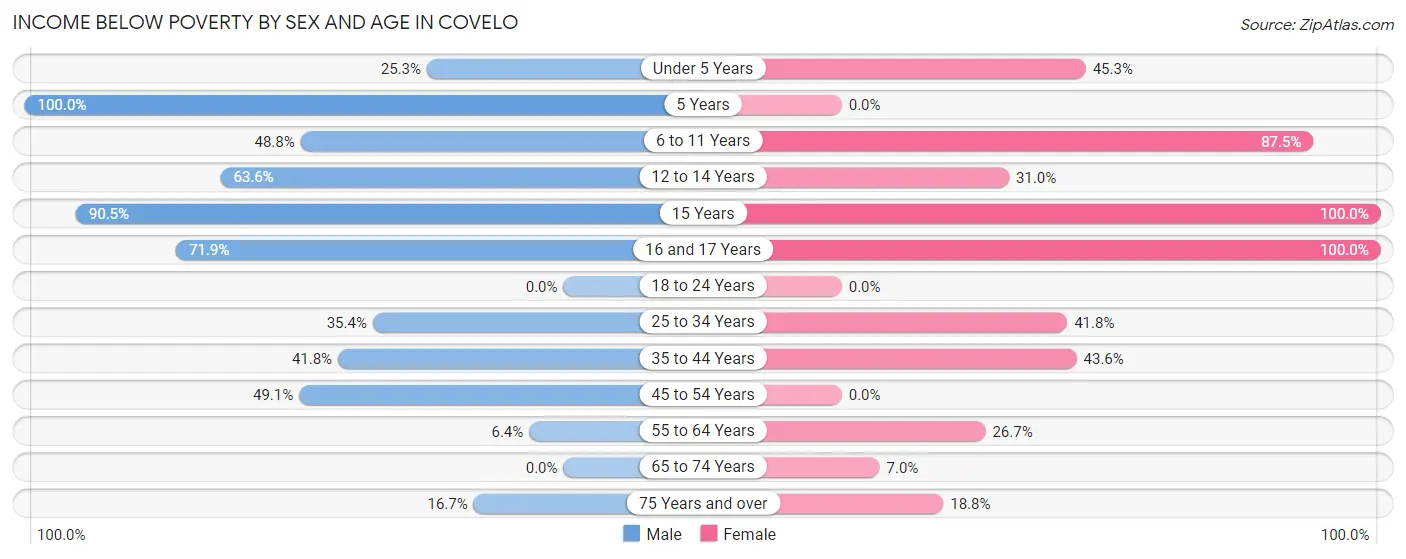
| Age Bracket | Male | Female |
| Under 5 Years | 19 (25.3%) | 48 (45.3%) |
| 5 Years | 12 (100.0%) | 0 (0.0%) |
| 6 to 11 Years | 40 (48.8%) | 49 (87.5%) |
| 12 to 14 Years | 14 (63.6%) | 9 (31.0%) |
| 15 Years | 19 (90.5%) | 8 (100.0%) |
| 16 and 17 Years | 23 (71.9%) | 20 (100.0%) |
| 18 to 24 Years | 0 (0.0%) | 0 (0.0%) |
| 25 to 34 Years | 23 (35.4%) | 41 (41.8%) |
| 35 to 44 Years | 41 (41.8%) | 51 (43.6%) |
| 45 to 54 Years | 52 (49.1%) | 0 (0.0%) |
| 55 to 64 Years | 4 (6.4%) | 4 (26.7%) |
| 65 to 74 Years | 0 (0.0%) | 4 (7.0%) |
| 75 Years and over | 6 (16.7%) | 13 (18.8%) |
| Total | 253 (36.3%) | 247 (37.7%) |
Income Above Poverty by Sex and Age in Covelo
According to the poverty statistics in Covelo, males aged 18 to 24 years and females aged 18 to 24 years are the age groups that are most secure financially, with 100.0% of males and 100.0% of females in these age groups living above the poverty line.
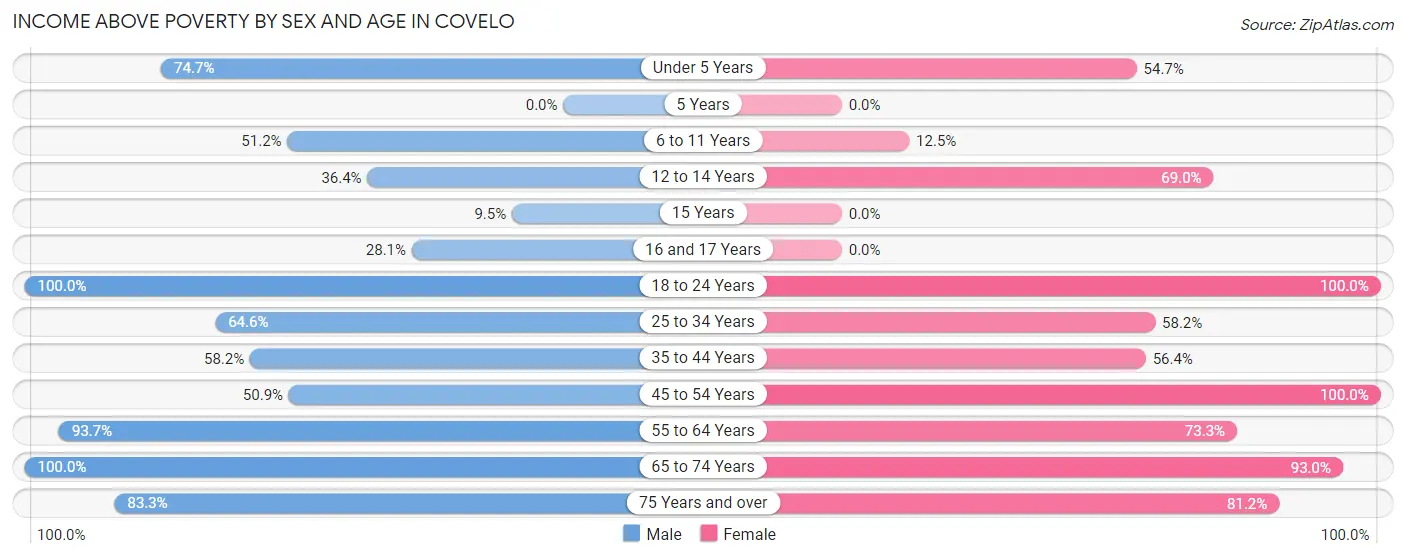
| Age Bracket | Male | Female |
| Under 5 Years | 56 (74.7%) | 58 (54.7%) |
| 5 Years | 0 (0.0%) | 0 (0.0%) |
| 6 to 11 Years | 42 (51.2%) | 7 (12.5%) |
| 12 to 14 Years | 8 (36.4%) | 20 (69.0%) |
| 15 Years | 2 (9.5%) | 0 (0.0%) |
| 16 and 17 Years | 9 (28.1%) | 0 (0.0%) |
| 18 to 24 Years | 24 (100.0%) | 43 (100.0%) |
| 25 to 34 Years | 42 (64.6%) | 57 (58.2%) |
| 35 to 44 Years | 57 (58.2%) | 66 (56.4%) |
| 45 to 54 Years | 54 (50.9%) | 38 (100.0%) |
| 55 to 64 Years | 59 (93.6%) | 11 (73.3%) |
| 65 to 74 Years | 60 (100.0%) | 53 (93.0%) |
| 75 Years and over | 30 (83.3%) | 56 (81.2%) |
| Total | 443 (63.6%) | 409 (62.4%) |
Income Below Poverty Among Married-Couple Families in Covelo
The poverty statistics for married-couple families in Covelo show that 16.2% or 19 of the total 117 families live below the poverty line. Families with 3 or 4 children have the highest poverty rate of 41.9%, comprising of 13 families. On the other hand, families with 1 or 2 children have the lowest poverty rate of 0.0%, which includes 0 families.
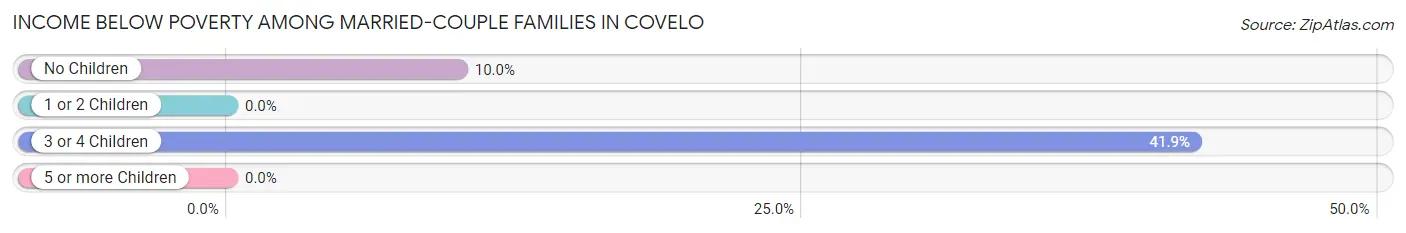
| Children | Above Poverty | Below Poverty |
| No Children | 54 (90.0%) | 6 (10.0%) |
| 1 or 2 Children | 26 (100.0%) | 0 (0.0%) |
| 3 or 4 Children | 18 (58.1%) | 13 (41.9%) |
| 5 or more Children | 0 (0.0%) | 0 (0.0%) |
| Total | 98 (83.8%) | 19 (16.2%) |
Income Below Poverty Among Single-Parent Households in Covelo
According to the poverty data in Covelo, 43.1% or 28 single-father households and 61.7% or 82 single-mother households are living below the poverty line. Among single-father households, those with 5 or more children have the highest poverty rate, with 4 households (100.0%) experiencing poverty. Likewise, among single-mother households, those with 3 or 4 children have the highest poverty rate, with 30 households (100.0%) falling below the poverty line.
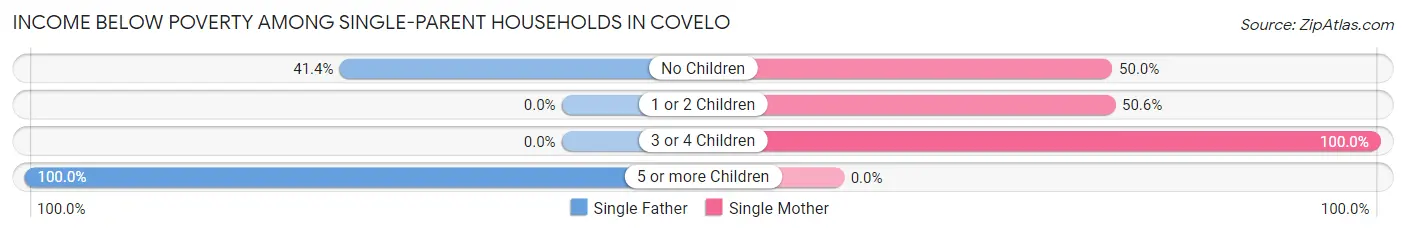
| Children | Single Father | Single Mother |
| No Children | 24 (41.4%) | 6 (50.0%) |
| 1 or 2 Children | 0 (0.0%) | 46 (50.5%) |
| 3 or 4 Children | 0 (0.0%) | 30 (100.0%) |
| 5 or more Children | 4 (100.0%) | 0 (0.0%) |
| Total | 28 (43.1%) | 82 (61.7%) |
Income Below Poverty Among Married-Couple vs Single-Parent Households in Covelo
The poverty data for Covelo shows that 19 of the married-couple family households (16.2%) and 110 of the single-parent households (55.6%) are living below the poverty level. Within the married-couple family households, those with 3 or 4 children have the highest poverty rate, with 13 households (41.9%) falling below the poverty line. Among the single-parent households, those with 3 or 4 children have the highest poverty rate, with 30 household (100.0%) living below poverty.
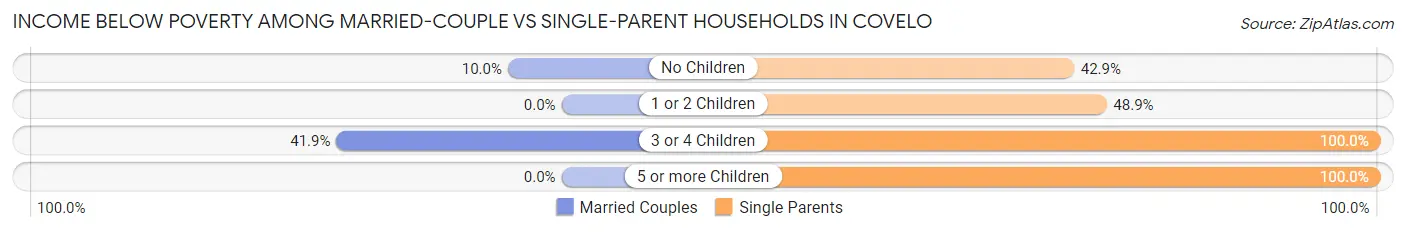
| Children | Married-Couple Families | Single-Parent Households |
| No Children | 6 (10.0%) | 30 (42.9%) |
| 1 or 2 Children | 0 (0.0%) | 46 (48.9%) |
| 3 or 4 Children | 13 (41.9%) | 30 (100.0%) |
| 5 or more Children | 0 (0.0%) | 4 (100.0%) |
| Total | 19 (16.2%) | 110 (55.6%) |
Race in Covelo
The most populous races in Covelo are White / Caucasian (833 | 61.3%), Hispanic or Latino (572 | 42.1%), and Two or more Races (210 | 15.4%).
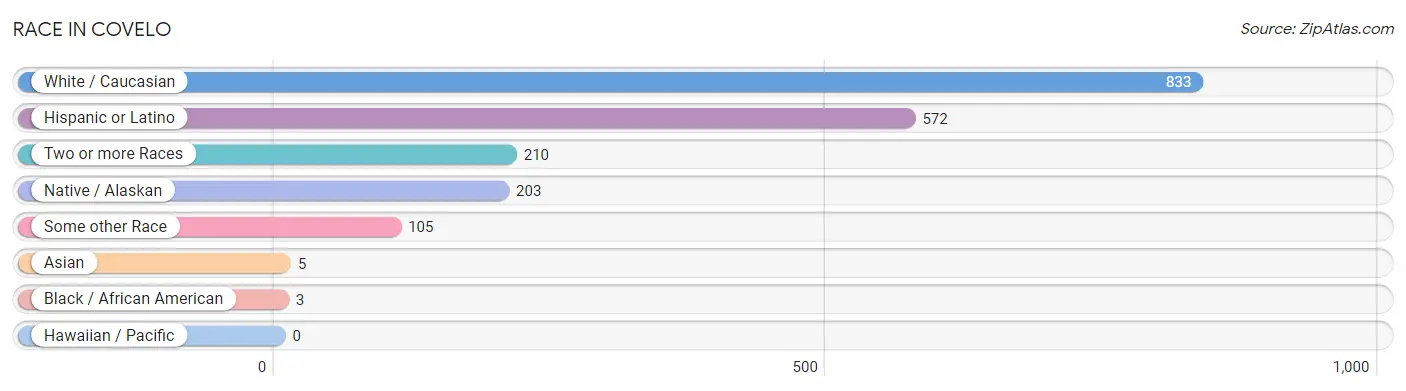
| Race | # Population | % Population |
| Asian | 5 | 0.4% |
| Black / African American | 3 | 0.2% |
| Hawaiian / Pacific | 0 | 0.0% |
| Hispanic or Latino | 572 | 42.1% |
| Native / Alaskan | 203 | 14.9% |
| White / Caucasian | 833 | 61.3% |
| Two or more Races | 210 | 15.4% |
| Some other Race | 105 | 7.7% |
| Total | 1,359 | 100.0% |
Ancestry in Covelo
The most populous ancestries reported in Covelo are Mexican (572 | 42.1%), German (157 | 11.6%), Irish (113 | 8.3%), English (61 | 4.5%), and Scotch-Irish (59 | 4.3%), together accounting for 70.8% of all Covelo residents.
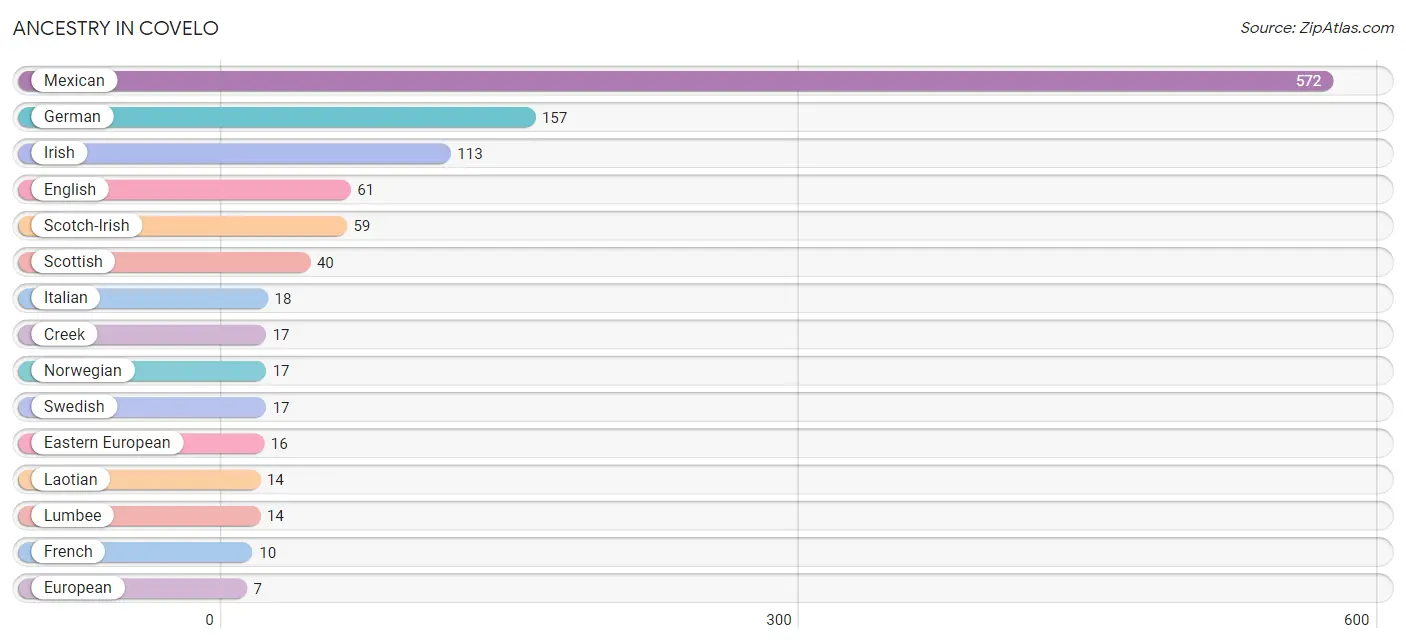
| Ancestry | # Population | % Population |
| Creek | 17 | 1.3% |
| Dutch | 4 | 0.3% |
| Eastern European | 16 | 1.2% |
| English | 61 | 4.5% |
| European | 7 | 0.5% |
| French | 10 | 0.7% |
| German | 157 | 11.6% |
| Irish | 113 | 8.3% |
| Italian | 18 | 1.3% |
| Korean | 5 | 0.4% |
| Laotian | 14 | 1.0% |
| Lithuanian | 6 | 0.4% |
| Lumbee | 14 | 1.0% |
| Mexican | 572 | 42.1% |
| Norwegian | 17 | 1.3% |
| Scotch-Irish | 59 | 4.3% |
| Scottish | 40 | 2.9% |
| Sioux | 6 | 0.4% |
| Swedish | 17 | 1.3% | View All 19 Rows |
Immigrants in Covelo
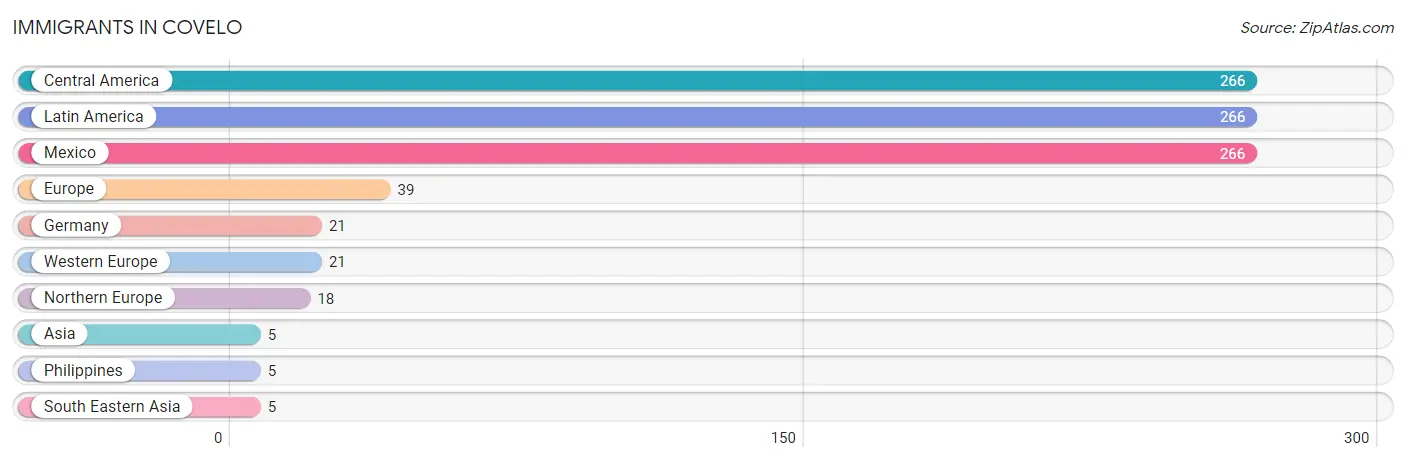
The most numerous immigrant groups reported in Covelo came from Central America (266 | 19.6%), Latin America (266 | 19.6%), Mexico (266 | 19.6%), Europe (39 | 2.9%), and Germany (21 | 1.5%), together accounting for 63.1% of all Covelo residents.
| Immigration Origin | # Population | % Population |
| Asia | 5 | 0.4% |
| Central America | 266 | 19.6% |
| Europe | 39 | 2.9% |
| Germany | 21 | 1.5% |
| Latin America | 266 | 19.6% |
| Mexico | 266 | 19.6% |
| Northern Europe | 18 | 1.3% |
| Philippines | 5 | 0.4% |
| South Eastern Asia | 5 | 0.4% |
| Western Europe | 21 | 1.5% | View All 10 Rows |
Sex and Age in Covelo
Sex and Age in Covelo
The most populous age groups in Covelo are 45 to 49 Years (86 | 12.2%) for men and Under 5 Years (106 | 16.2%) for women.
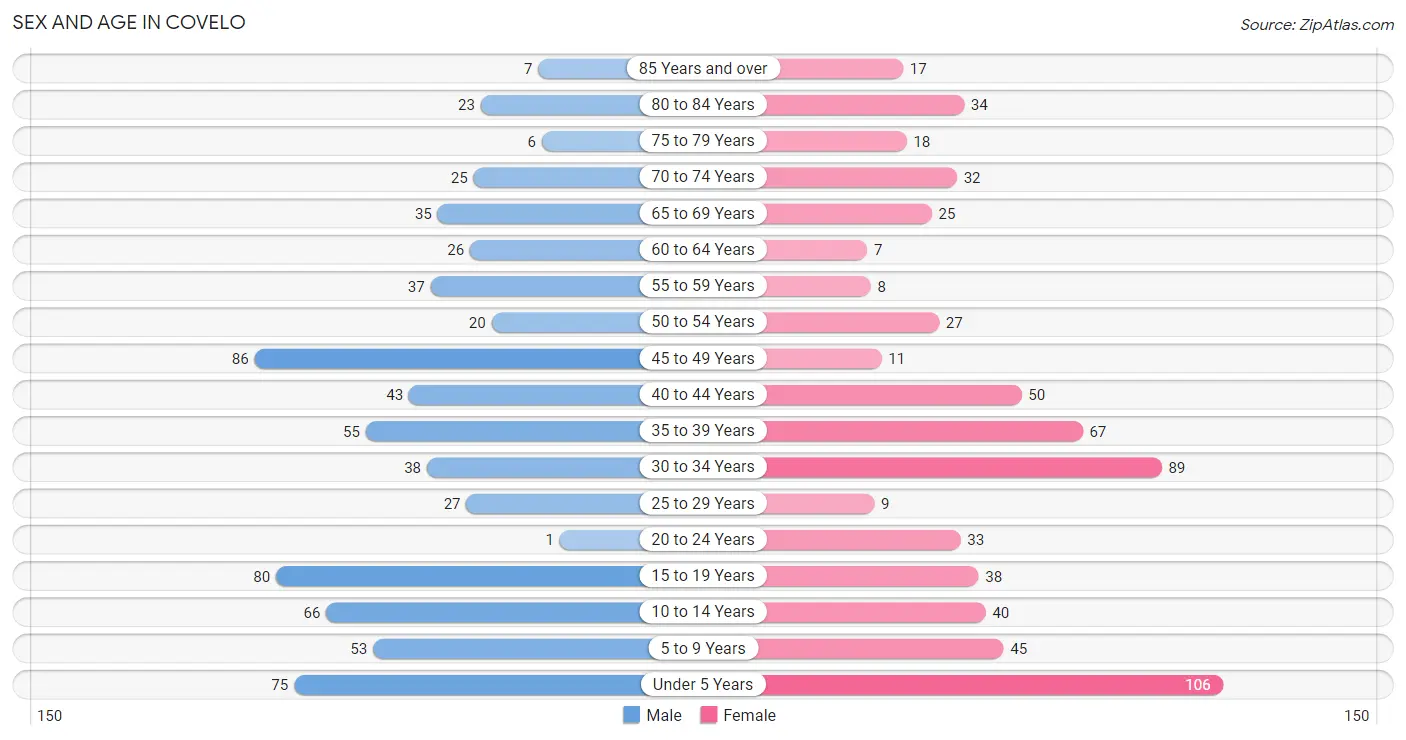
| Age Bracket | Male | Female |
| Under 5 Years | 75 (10.7%) | 106 (16.2%) |
| 5 to 9 Years | 53 (7.5%) | 45 (6.9%) |
| 10 to 14 Years | 66 (9.4%) | 40 (6.1%) |
| 15 to 19 Years | 80 (11.4%) | 38 (5.8%) |
| 20 to 24 Years | 1 (0.1%) | 33 (5.0%) |
| 25 to 29 Years | 27 (3.8%) | 9 (1.4%) |
| 30 to 34 Years | 38 (5.4%) | 89 (13.6%) |
| 35 to 39 Years | 55 (7.8%) | 67 (10.2%) |
| 40 to 44 Years | 43 (6.1%) | 50 (7.6%) |
| 45 to 49 Years | 86 (12.2%) | 11 (1.7%) |
| 50 to 54 Years | 20 (2.8%) | 27 (4.1%) |
| 55 to 59 Years | 37 (5.3%) | 8 (1.2%) |
| 60 to 64 Years | 26 (3.7%) | 7 (1.1%) |
| 65 to 69 Years | 35 (5.0%) | 25 (3.8%) |
| 70 to 74 Years | 25 (3.6%) | 32 (4.9%) |
| 75 to 79 Years | 6 (0.9%) | 18 (2.7%) |
| 80 to 84 Years | 23 (3.3%) | 34 (5.2%) |
| 85 Years and over | 7 (1.0%) | 17 (2.6%) |
| Total | 703 (100.0%) | 656 (100.0%) |
Families and Households in Covelo
Median Family Size in Covelo
The median family size in Covelo is 3.42 persons per family, with single female/mother families (133 | 42.2%) accounting for the largest median family size of 3.7 persons per family. On the other hand, single male/father families (65 | 20.6%) represent the smallest median family size with 2.65 persons per family.
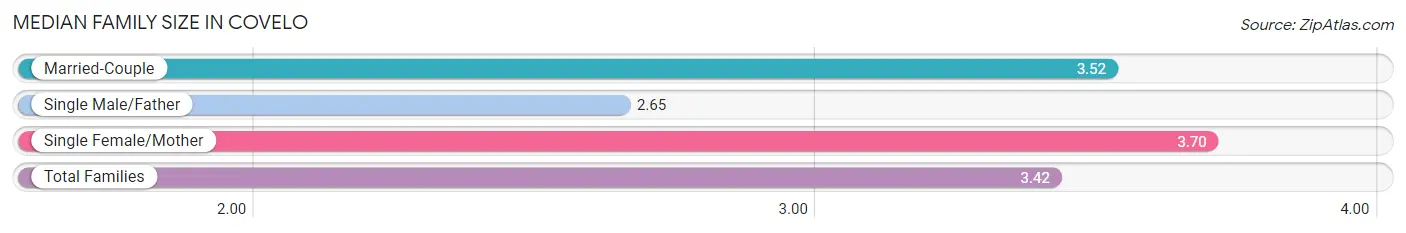
| Family Type | # Families | Family Size |
| Married-Couple | 117 (37.1%) | 3.52 |
| Single Male/Father | 65 (20.6%) | 2.65 |
| Single Female/Mother | 133 (42.2%) | 3.70 |
| Total Families | 315 (100.0%) | 3.42 |
Median Household Size in Covelo
The median household size in Covelo is 3.14 persons per household, with single female/mother households (133 | 30.9%) accounting for the largest median household size of 4.73 persons per household. non-family households (116 | 26.9%) represent the smallest median household size with 1.16 persons per household.
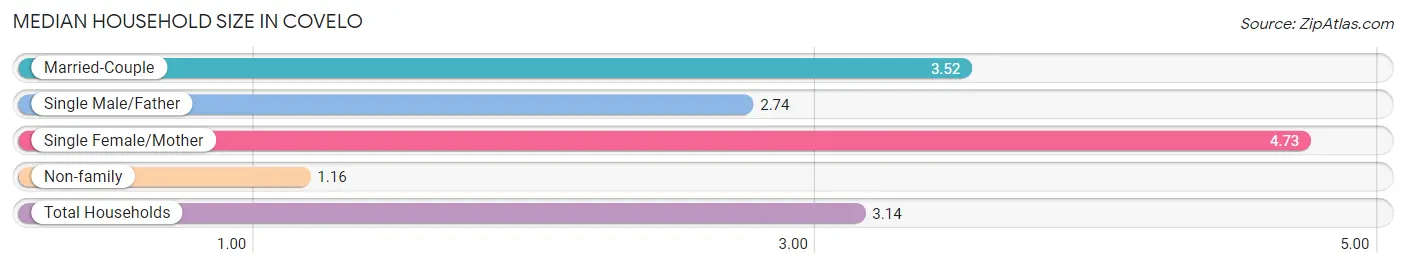
| Household Type | # Households | Household Size |
| Married-Couple | 117 (27.2%) | 3.52 |
| Single Male/Father | 65 (15.1%) | 2.74 |
| Single Female/Mother | 133 (30.9%) | 4.73 |
| Non-family | 116 (26.9%) | 1.16 |
| Total Households | 431 (100.0%) | 3.14 |
Household Size by Marriage Status in Covelo
Out of a total of 431 households in Covelo, 315 (73.1%) are family households, while 116 (26.9%) are nonfamily households. The most numerous type of family households are 2-person households, comprising 114, and the most common type of nonfamily households are 1-person households, comprising 102.
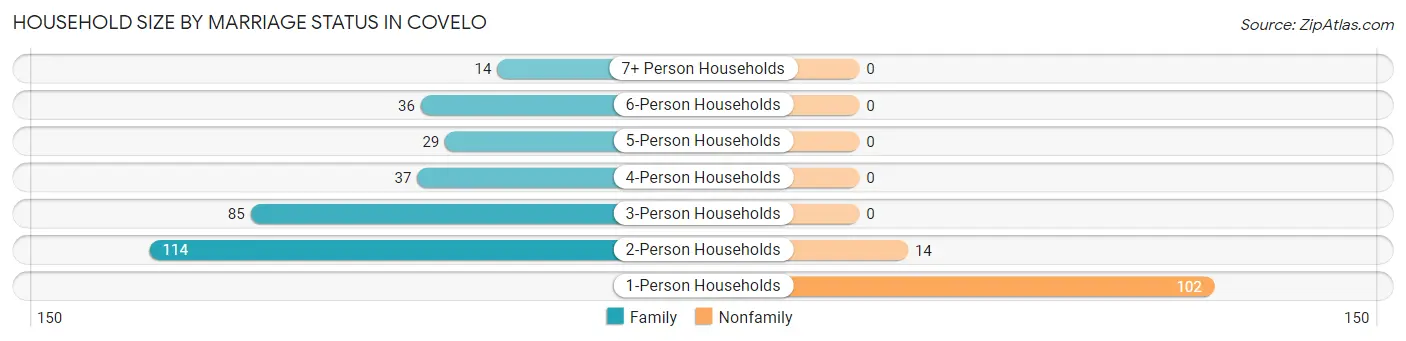
| Household Size | Family Households | Nonfamily Households |
| 1-Person Households | - | 102 (23.7%) |
| 2-Person Households | 114 (26.5%) | 14 (3.3%) |
| 3-Person Households | 85 (19.7%) | 0 (0.0%) |
| 4-Person Households | 37 (8.6%) | 0 (0.0%) |
| 5-Person Households | 29 (6.7%) | 0 (0.0%) |
| 6-Person Households | 36 (8.4%) | 0 (0.0%) |
| 7+ Person Households | 14 (3.3%) | 0 (0.0%) |
| Total | 315 (73.1%) | 116 (26.9%) |
Female Fertility in Covelo
Fertility by Age in Covelo
Average fertility rate in Covelo is 122.0 births per 1,000 women. Women in the age bracket of 35 to 50 years have the highest fertility rate with 209.0 births per 1,000 women. Women in the age bracket of 35 to 50 years acount for 75.7% of all women with births.
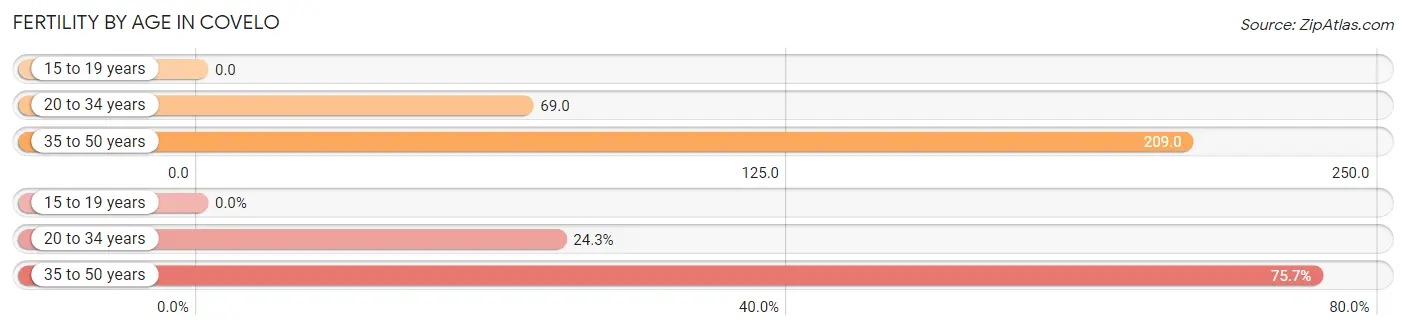
| Age Bracket | Women with Births | Births / 1,000 Women |
| 15 to 19 years | 0 (0.0%) | 0.0 |
| 20 to 34 years | 9 (24.3%) | 69.0 |
| 35 to 50 years | 28 (75.7%) | 209.0 |
| Total | 37 (100.0%) | 122.0 |
Fertility by Age by Marriage Status in Covelo
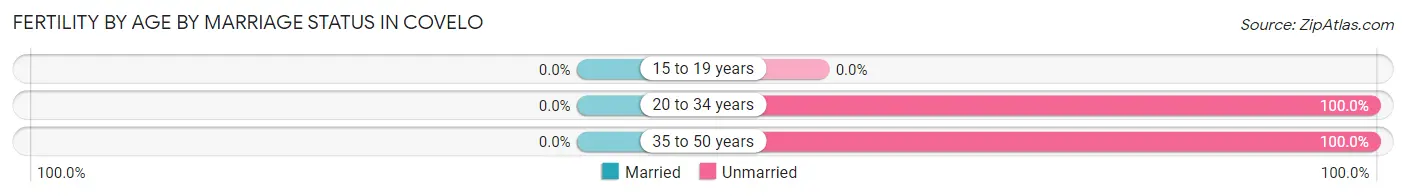
| Age Bracket | Married | Unmarried |
| 15 to 19 years | 0 (0.0%) | 0 (0.0%) |
| 20 to 34 years | 0 (0.0%) | 9 (100.0%) |
| 35 to 50 years | 0 (0.0%) | 28 (100.0%) |
| Total | 0 (0.0%) | 37 (100.0%) |
Fertility by Education in Covelo
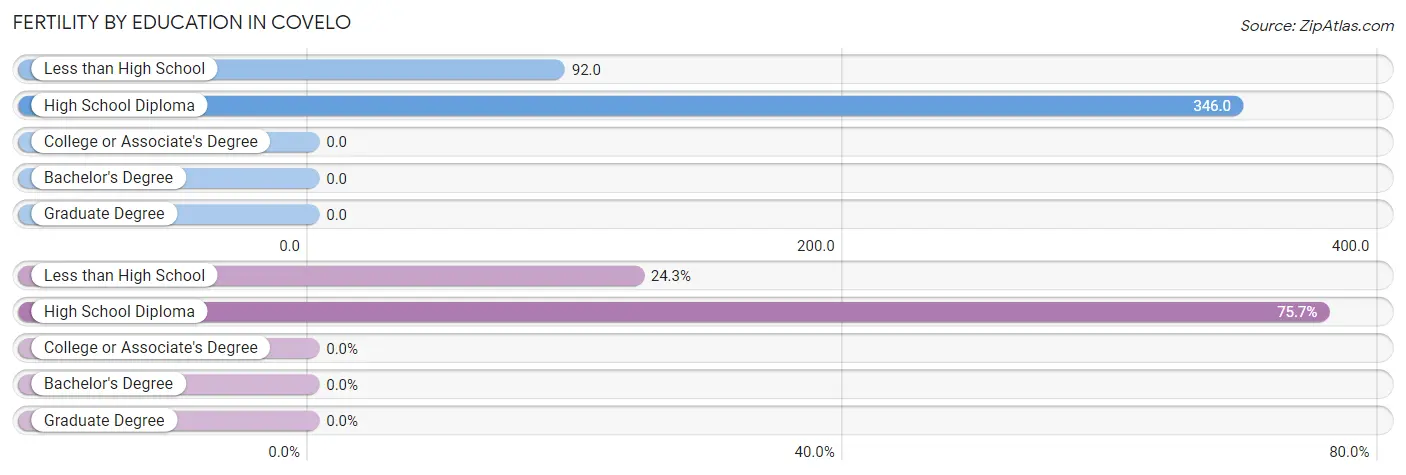
| Educational Attainment | Women with Births | Births / 1,000 Women |
| Less than High School | 9 (24.3%) | 92.0 |
| High School Diploma | 28 (75.7%) | 346.0 |
| College or Associate's Degree | 0 (0.0%) | 0.0 |
| Bachelor's Degree | 0 (0.0%) | 0.0 |
| Graduate Degree | 0 (0.0%) | 0.0 |
| Total | 37 (100.0%) | 122.0 |
Fertility by Education by Marriage Status in Covelo
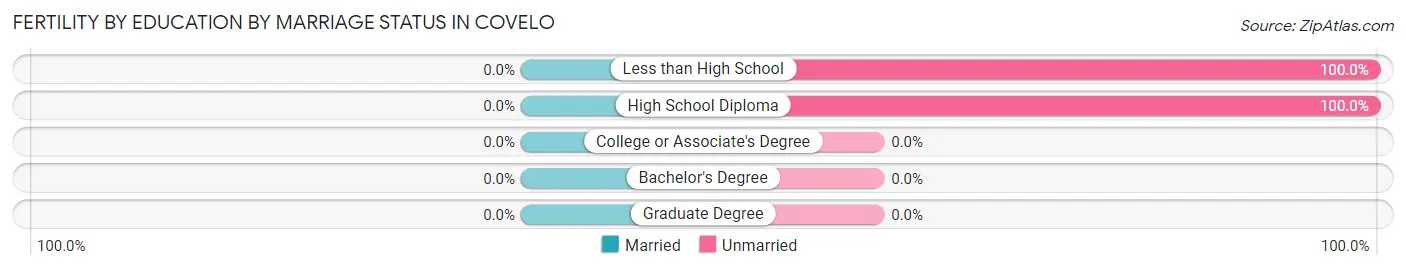
| Educational Attainment | Married | Unmarried |
| Less than High School | 0 (0.0%) | 9 (100.0%) |
| High School Diploma | 0 (0.0%) | 28 (100.0%) |
| College or Associate's Degree | 0 (0.0%) | 0 (0.0%) |
| Bachelor's Degree | 0 (0.0%) | 0 (0.0%) |
| Graduate Degree | 0 (0.0%) | 0 (0.0%) |
| Total | 0 (0.0%) | 37 (100.0%) |
Employment Characteristics in Covelo
Employment by Class of Employer in Covelo
Among the 366 employed individuals in Covelo, private company employees (138 | 37.7%), local government employees (83 | 22.7%), and self-employed (not incorporated) (74 | 20.2%) make up the most common classes of employment.
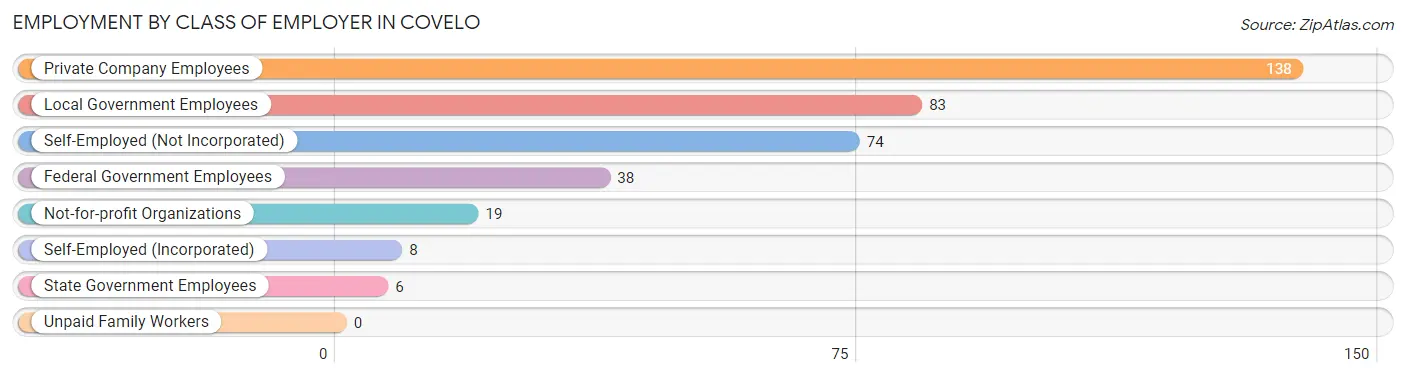
| Employer Class | # Employees | % Employees |
| Private Company Employees | 138 | 37.7% |
| Self-Employed (Incorporated) | 8 | 2.2% |
| Self-Employed (Not Incorporated) | 74 | 20.2% |
| Not-for-profit Organizations | 19 | 5.2% |
| Local Government Employees | 83 | 22.7% |
| State Government Employees | 6 | 1.6% |
| Federal Government Employees | 38 | 10.4% |
| Unpaid Family Workers | 0 | 0.0% |
| Total | 366 | 100.0% |
Employment Status by Age in Covelo
According to the labor force statistics for Covelo, out of the total population over 16 years of age (945), 52.6% or 497 individuals are in the labor force, with 26.4% or 131 of them unemployed. The age group with the highest labor force participation rate is 55 to 59 years, with 95.6% or 43 individuals in the labor force. Within the labor force, the 20 to 24 years age range has the highest percentage of unemployed individuals, with 80.8% or 21 of them being unemployed.
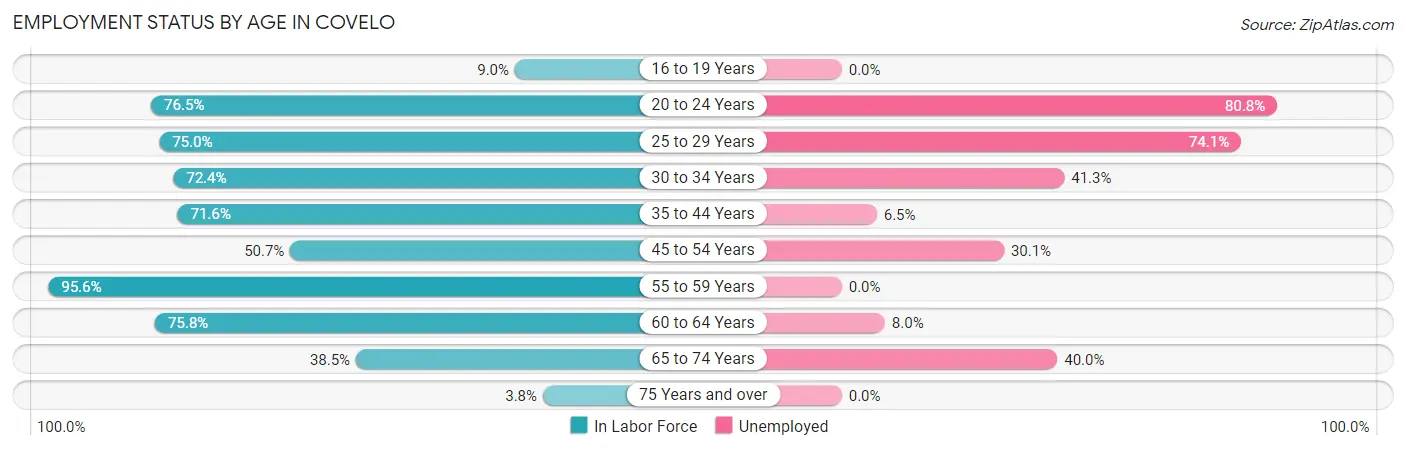
| Age Bracket | In Labor Force | Unemployed |
| 16 to 19 Years | 8 (9.0%) | 0 (0.0%) |
| 20 to 24 Years | 26 (76.5%) | 21 (80.8%) |
| 25 to 29 Years | 27 (75.0%) | 20 (74.1%) |
| 30 to 34 Years | 92 (72.4%) | 38 (41.3%) |
| 35 to 44 Years | 154 (71.6%) | 10 (6.5%) |
| 45 to 54 Years | 73 (50.7%) | 22 (30.1%) |
| 55 to 59 Years | 43 (95.6%) | 0 (0.0%) |
| 60 to 64 Years | 25 (75.8%) | 2 (8.0%) |
| 65 to 74 Years | 45 (38.5%) | 18 (40.0%) |
| 75 Years and over | 4 (3.8%) | 0 (0.0%) |
| Total | 497 (52.6%) | 131 (26.4%) |
Employment Status by Educational Attainment in Covelo
According to labor force statistics for Covelo, 69.0% of individuals (414) out of the total population between 25 and 64 years of age (600) are in the labor force, with 22.2% or 92 of them being unemployed. The group with the highest labor force participation rate are those with the educational attainment of college / associate degree, with 84.5% or 136 individuals in the labor force. Within the labor force, individuals with less than high school education have the highest percentage of unemployment, with 50.0% or 54 of them being unemployed.
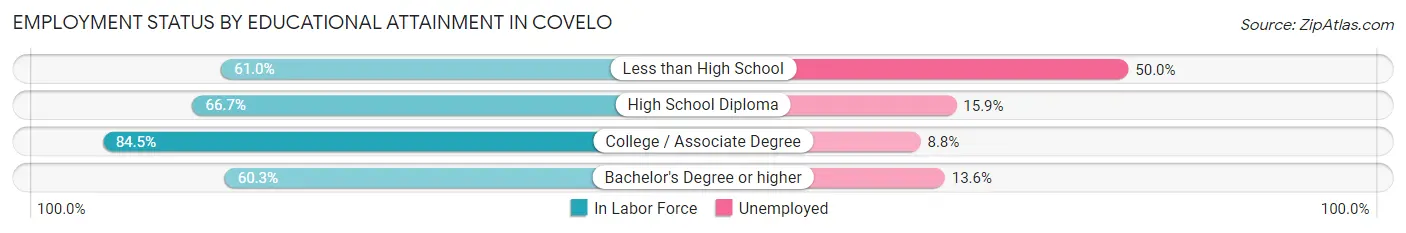
| Educational Attainment | In Labor Force | Unemployed |
| Less than High School | 108 (61.0%) | 88 (50.0%) |
| High School Diploma | 126 (66.7%) | 30 (15.9%) |
| College / Associate Degree | 136 (84.5%) | 14 (8.8%) |
| Bachelor's Degree or higher | 44 (60.3%) | 10 (13.6%) |
| Total | 414 (69.0%) | 133 (22.2%) |
Employment Occupations by Sex in Covelo
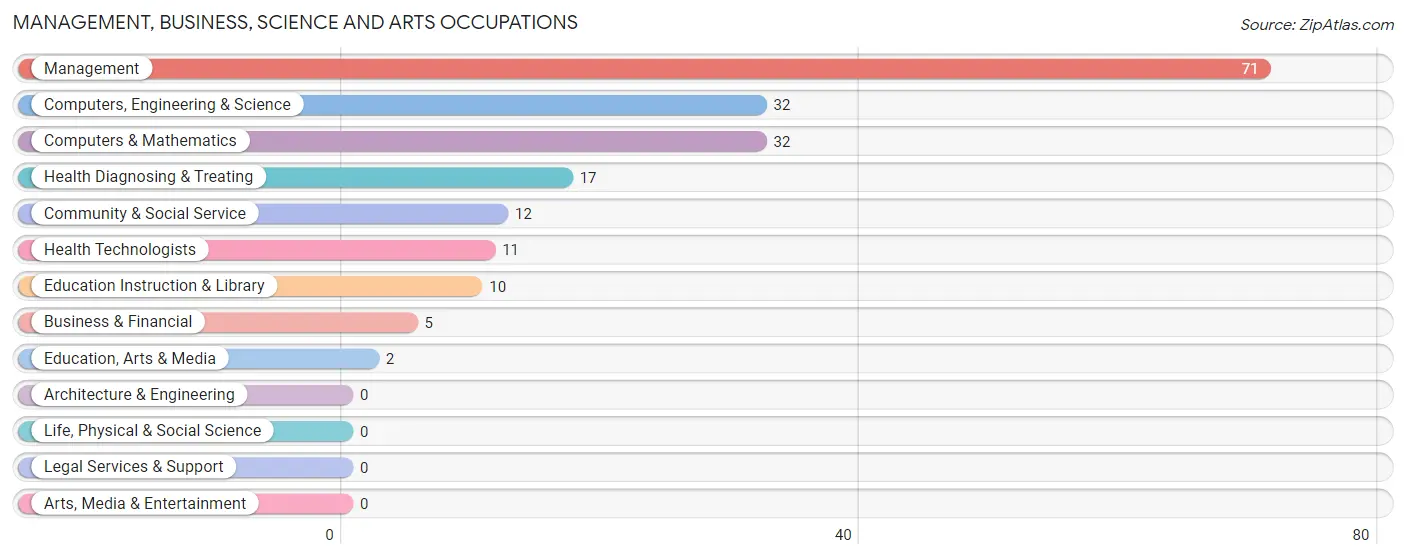
Management, Business, Science and Arts Occupations
The most common Management, Business, Science and Arts occupations in Covelo are Management (71 | 19.4%), Computers, Engineering & Science (32 | 8.7%), Computers & Mathematics (32 | 8.7%), Health Diagnosing & Treating (17 | 4.6%), and Community & Social Service (12 | 3.3%).
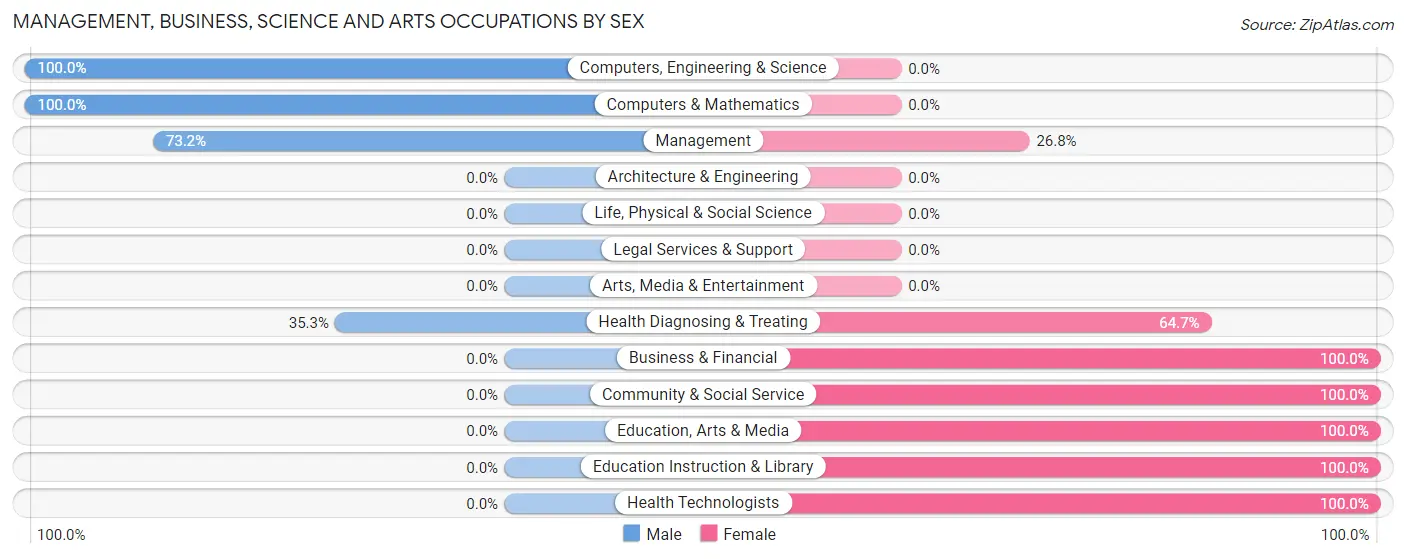
Management, Business, Science and Arts Occupations by Sex
Within the Management, Business, Science and Arts occupations in Covelo, the most male-oriented occupations are Computers, Engineering & Science (100.0%), Computers & Mathematics (100.0%), and Management (73.2%), while the most female-oriented occupations are Business & Financial (100.0%), Community & Social Service (100.0%), and Education, Arts & Media (100.0%).
| Occupation | Male | Female |
| Management | 52 (73.2%) | 19 (26.8%) |
| Business & Financial | 0 (0.0%) | 5 (100.0%) |
| Computers, Engineering & Science | 32 (100.0%) | 0 (0.0%) |
| Computers & Mathematics | 32 (100.0%) | 0 (0.0%) |
| Architecture & Engineering | 0 (0.0%) | 0 (0.0%) |
| Life, Physical & Social Science | 0 (0.0%) | 0 (0.0%) |
| Community & Social Service | 0 (0.0%) | 12 (100.0%) |
| Education, Arts & Media | 0 (0.0%) | 2 (100.0%) |
| Legal Services & Support | 0 (0.0%) | 0 (0.0%) |
| Education Instruction & Library | 0 (0.0%) | 10 (100.0%) |
| Arts, Media & Entertainment | 0 (0.0%) | 0 (0.0%) |
| Health Diagnosing & Treating | 6 (35.3%) | 11 (64.7%) |
| Health Technologists | 0 (0.0%) | 11 (100.0%) |
| Total (Category) | 90 (65.7%) | 47 (34.3%) |
| Total (Overall) | 213 (58.2%) | 153 (41.8%) |
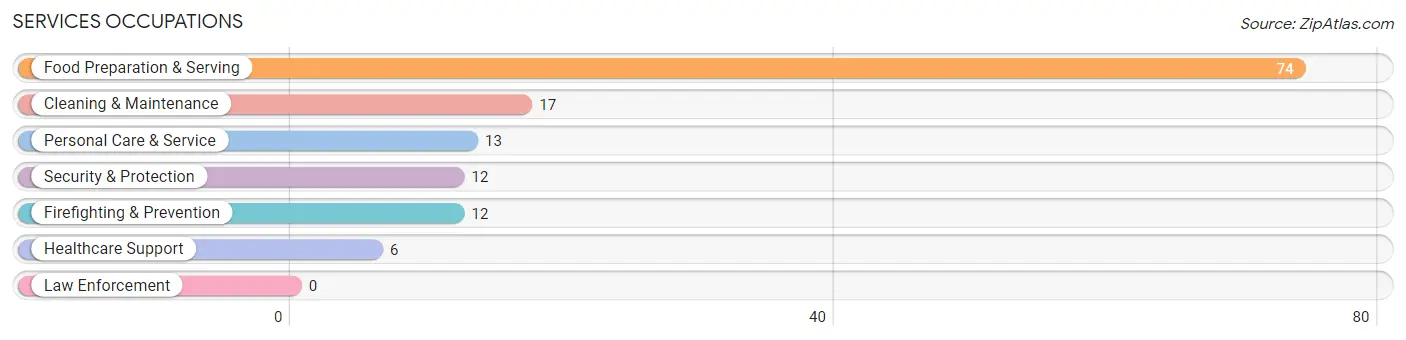
Services Occupations
The most common Services occupations in Covelo are Food Preparation & Serving (74 | 20.2%), Cleaning & Maintenance (17 | 4.6%), Personal Care & Service (13 | 3.5%), Security & Protection (12 | 3.3%), and Firefighting & Prevention (12 | 3.3%).
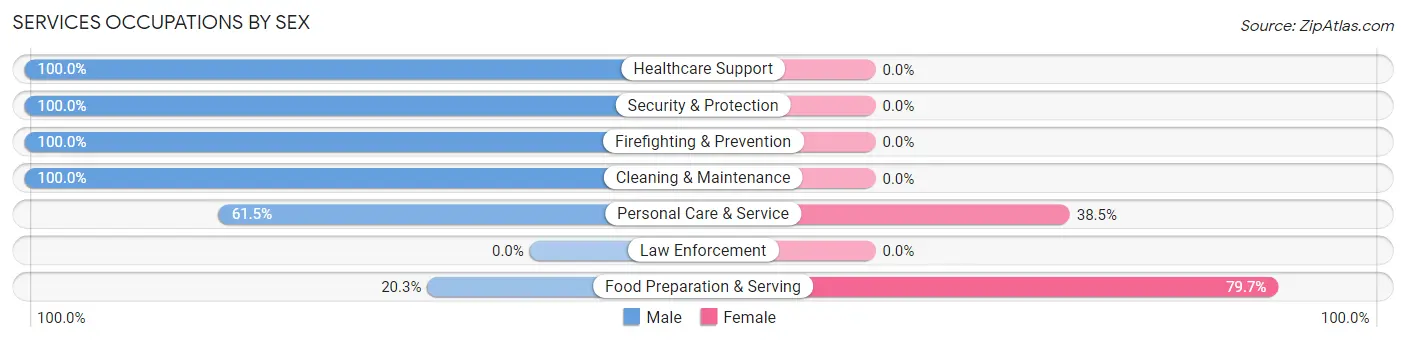
Services Occupations by Sex
Within the Services occupations in Covelo, the most male-oriented occupations are Healthcare Support (100.0%), Security & Protection (100.0%), and Firefighting & Prevention (100.0%), while the most female-oriented occupations are Food Preparation & Serving (79.7%), and Personal Care & Service (38.5%).
| Occupation | Male | Female |
| Healthcare Support | 6 (100.0%) | 0 (0.0%) |
| Security & Protection | 12 (100.0%) | 0 (0.0%) |
| Firefighting & Prevention | 12 (100.0%) | 0 (0.0%) |
| Law Enforcement | 0 (0.0%) | 0 (0.0%) |
| Food Preparation & Serving | 15 (20.3%) | 59 (79.7%) |
| Cleaning & Maintenance | 17 (100.0%) | 0 (0.0%) |
| Personal Care & Service | 8 (61.5%) | 5 (38.5%) |
| Total (Category) | 58 (47.5%) | 64 (52.5%) |
| Total (Overall) | 213 (58.2%) | 153 (41.8%) |
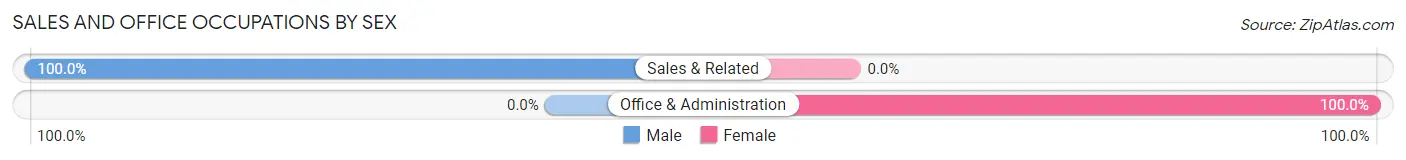
Sales and Office Occupations
The most common Sales and Office occupations in Covelo are Office & Administration (42 | 11.5%), and Sales & Related (17 | 4.6%).
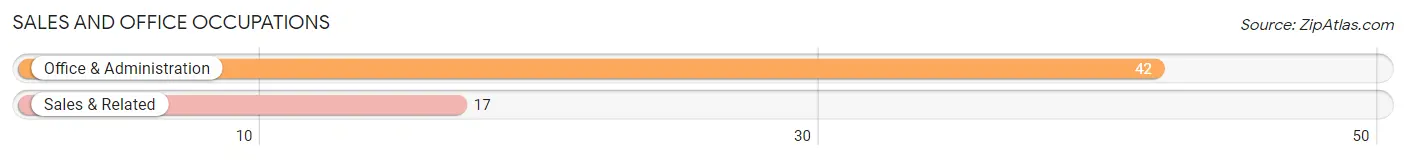
Sales and Office Occupations by Sex
| Occupation | Male | Female |
| Sales & Related | 17 (100.0%) | 0 (0.0%) |
| Office & Administration | 0 (0.0%) | 42 (100.0%) |
| Total (Category) | 17 (28.8%) | 42 (71.2%) |
| Total (Overall) | 213 (58.2%) | 153 (41.8%) |
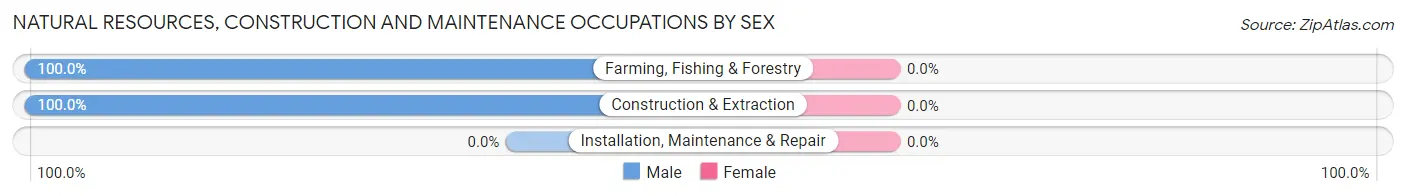
Natural Resources, Construction and Maintenance Occupations
The most common Natural Resources, Construction and Maintenance occupations in Covelo are Construction & Extraction (21 | 5.7%), and Farming, Fishing & Forestry (9 | 2.5%).
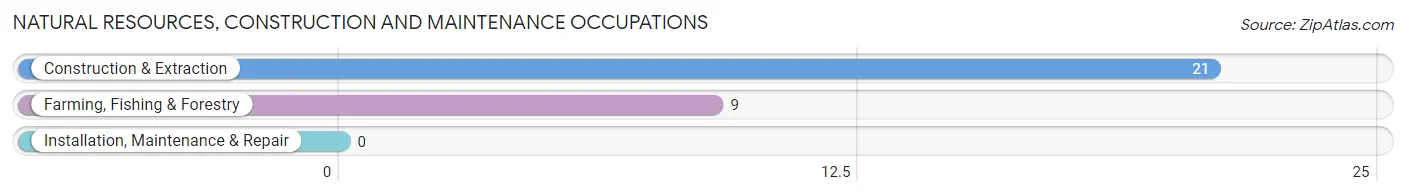
Natural Resources, Construction and Maintenance Occupations by Sex
| Occupation | Male | Female |
| Farming, Fishing & Forestry | 9 (100.0%) | 0 (0.0%) |
| Construction & Extraction | 21 (100.0%) | 0 (0.0%) |
| Installation, Maintenance & Repair | 0 (0.0%) | 0 (0.0%) |
| Total (Category) | 30 (100.0%) | 0 (0.0%) |
| Total (Overall) | 213 (58.2%) | 153 (41.8%) |
Production, Transportation and Moving Occupations
The most common Production, Transportation and Moving occupations in Covelo are , and Transportation (18 | 4.9%).
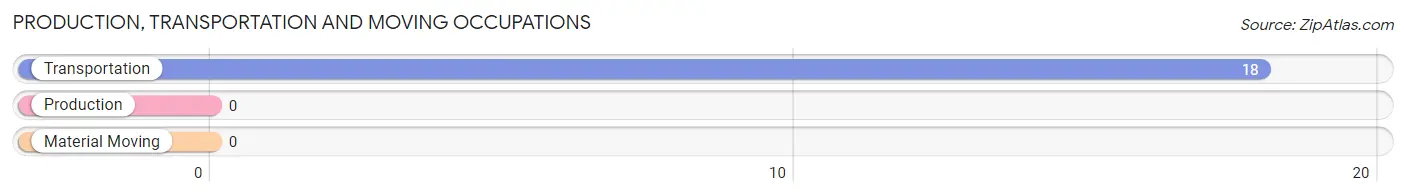
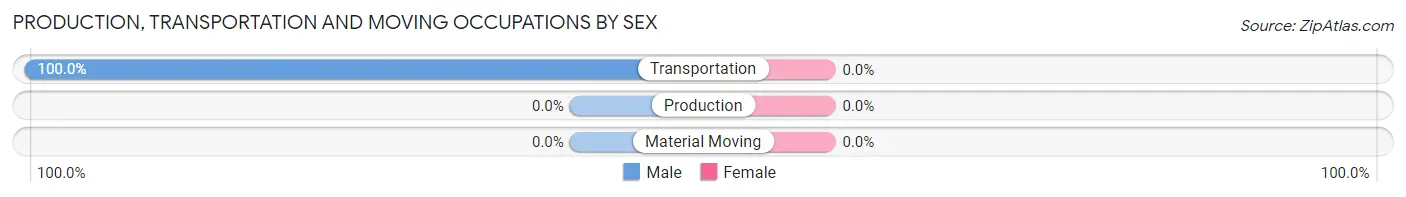
Production, Transportation and Moving Occupations by Sex
| Occupation | Male | Female |
| Production | 0 (0.0%) | 0 (0.0%) |
| Transportation | 18 (100.0%) | 0 (0.0%) |
| Material Moving | 0 (0.0%) | 0 (0.0%) |
| Total (Category) | 18 (100.0%) | 0 (0.0%) |
| Total (Overall) | 213 (58.2%) | 153 (41.8%) |
Employment Industries by Sex in Covelo
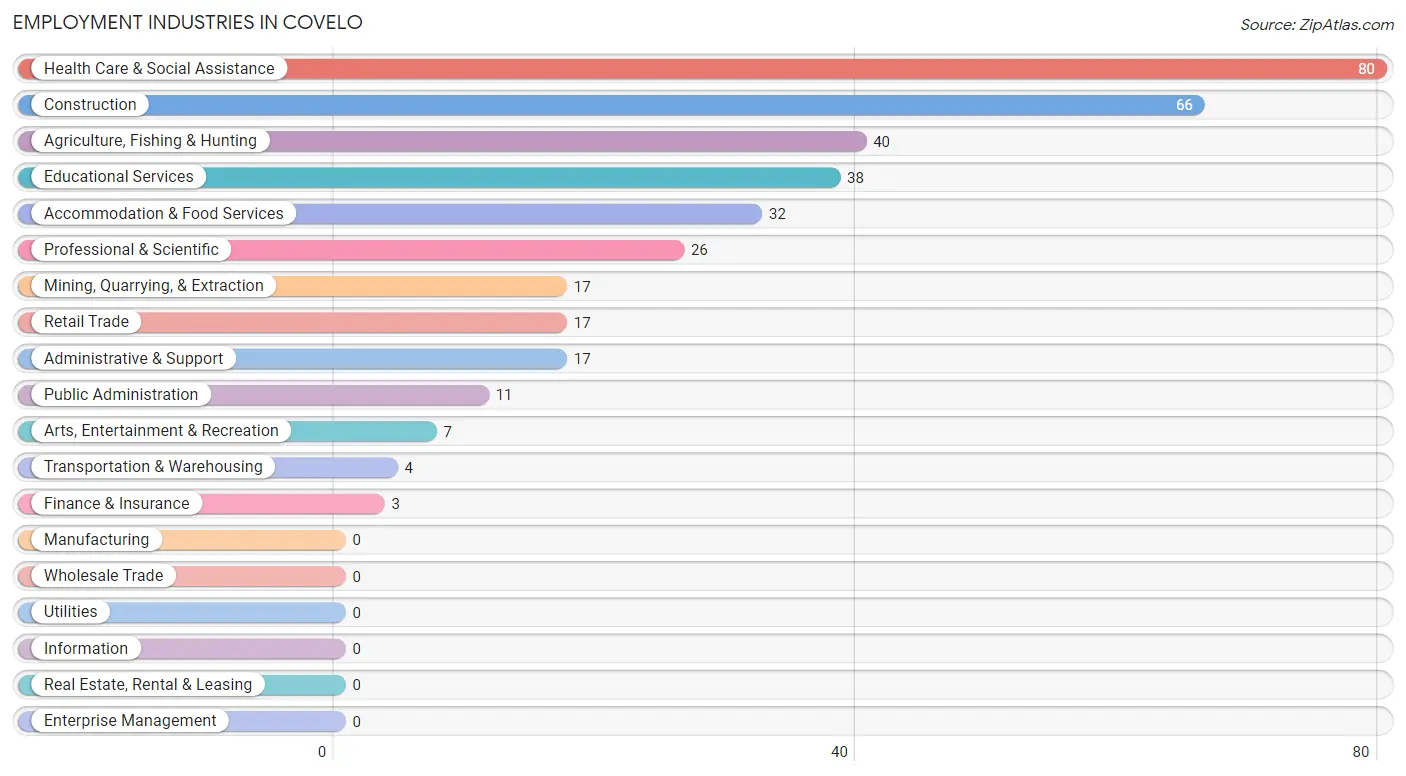
Employment Industries in Covelo
The major employment industries in Covelo include Health Care & Social Assistance (80 | 21.9%), Construction (66 | 18.0%), Agriculture, Fishing & Hunting (40 | 10.9%), Educational Services (38 | 10.4%), and Accommodation & Food Services (32 | 8.7%).
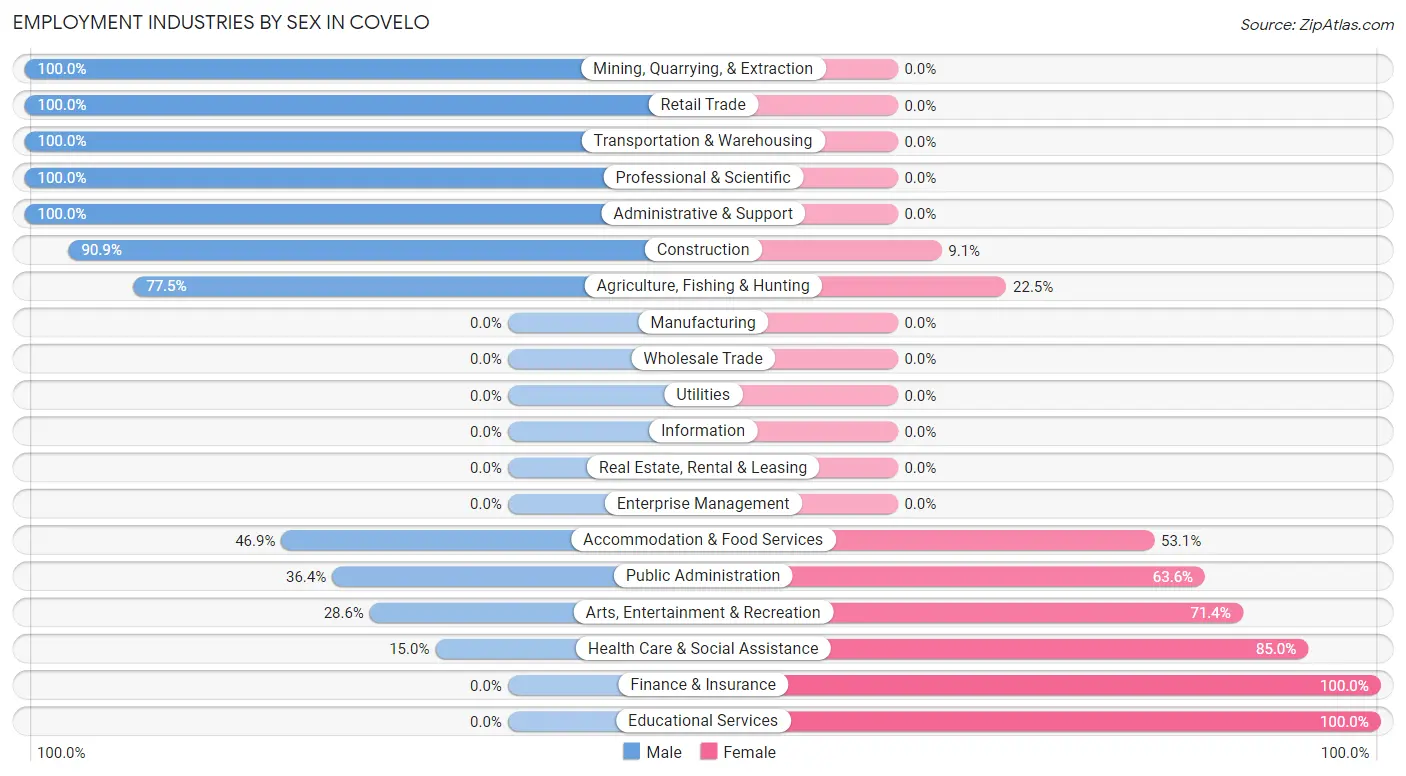
Employment Industries by Sex in Covelo
The Covelo industries that see more men than women are Mining, Quarrying, & Extraction (100.0%), Retail Trade (100.0%), and Transportation & Warehousing (100.0%), whereas the industries that tend to have a higher number of women are Finance & Insurance (100.0%), Educational Services (100.0%), and Health Care & Social Assistance (85.0%).
| Industry | Male | Female |
| Agriculture, Fishing & Hunting | 31 (77.5%) | 9 (22.5%) |
| Mining, Quarrying, & Extraction | 17 (100.0%) | 0 (0.0%) |
| Construction | 60 (90.9%) | 6 (9.1%) |
| Manufacturing | 0 (0.0%) | 0 (0.0%) |
| Wholesale Trade | 0 (0.0%) | 0 (0.0%) |
| Retail Trade | 17 (100.0%) | 0 (0.0%) |
| Transportation & Warehousing | 4 (100.0%) | 0 (0.0%) |
| Utilities | 0 (0.0%) | 0 (0.0%) |
| Information | 0 (0.0%) | 0 (0.0%) |
| Finance & Insurance | 0 (0.0%) | 3 (100.0%) |
| Real Estate, Rental & Leasing | 0 (0.0%) | 0 (0.0%) |
| Professional & Scientific | 26 (100.0%) | 0 (0.0%) |
| Enterprise Management | 0 (0.0%) | 0 (0.0%) |
| Administrative & Support | 17 (100.0%) | 0 (0.0%) |
| Educational Services | 0 (0.0%) | 38 (100.0%) |
| Health Care & Social Assistance | 12 (15.0%) | 68 (85.0%) |
| Arts, Entertainment & Recreation | 2 (28.6%) | 5 (71.4%) |
| Accommodation & Food Services | 15 (46.9%) | 17 (53.1%) |
| Public Administration | 4 (36.4%) | 7 (63.6%) |
| Total | 213 (58.2%) | 153 (41.8%) |
Education in Covelo
School Enrollment in Covelo
The most common levels of schooling among the 349 students in Covelo are middle school (103 | 29.5%), elementary school (101 | 28.9%), and high school (93 | 26.7%).
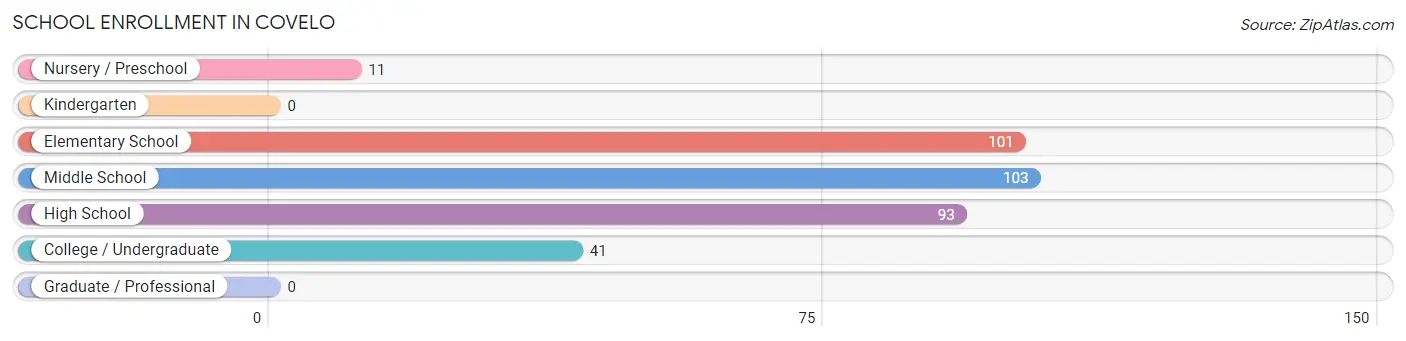
| School Level | # Students | % Students |
| Nursery / Preschool | 11 | 3.2% |
| Kindergarten | 0 | 0.0% |
| Elementary School | 101 | 28.9% |
| Middle School | 103 | 29.5% |
| High School | 93 | 26.7% |
| College / Undergraduate | 41 | 11.7% |
| Graduate / Professional | 0 | 0.0% |
| Total | 349 | 100.0% |
School Enrollment by Age by Funding Source in Covelo
Out of a total of 349 students who are enrolled in schools in Covelo, 6 (1.7%) attend a private institution, while the remaining 343 (98.3%) are enrolled in public schools. The age group of 20 to 24 year olds has the highest likelihood of being enrolled in private schools, with 5 (62.5% in the age bracket) enrolled. Conversely, the age group of 3 to 4 year olds has the lowest likelihood of being enrolled in a private school, with 11 (100.0% in the age bracket) attending a public institution.
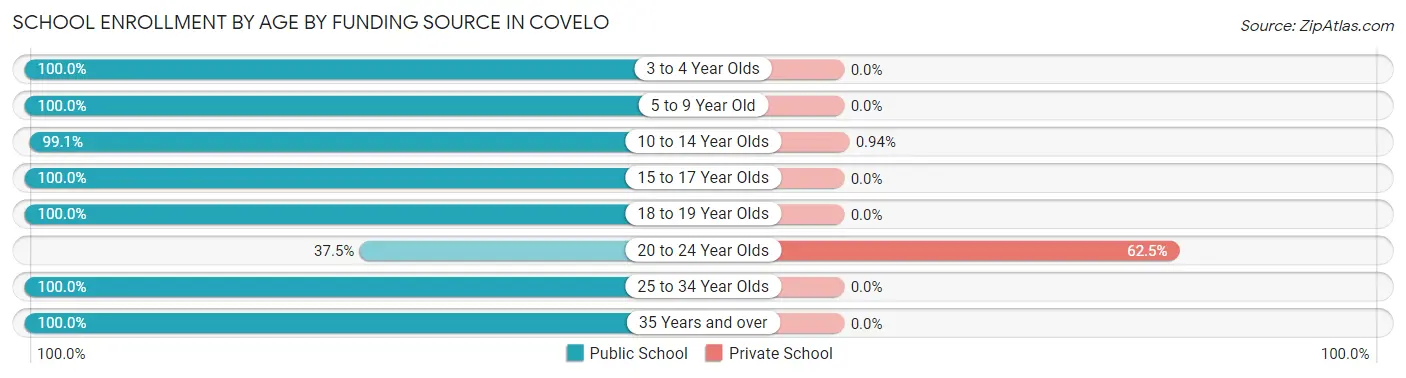
| Age Bracket | Public School | Private School |
| 3 to 4 Year Olds | 11 (100.0%) | 0 (0.0%) |
| 5 to 9 Year Old | 98 (100.0%) | 0 (0.0%) |
| 10 to 14 Year Olds | 105 (99.1%) | 1 (0.9%) |
| 15 to 17 Year Olds | 82 (100.0%) | 0 (0.0%) |
| 18 to 19 Year Olds | 11 (100.0%) | 0 (0.0%) |
| 20 to 24 Year Olds | 3 (37.5%) | 5 (62.5%) |
| 25 to 34 Year Olds | 6 (100.0%) | 0 (0.0%) |
| 35 Years and over | 27 (100.0%) | 0 (0.0%) |
| Total | 343 (98.3%) | 6 (1.7%) |
Educational Attainment by Field of Study in Covelo
Liberal arts & history (24 | 23.3%), bio, nature & agricultural (21 | 20.4%), social sciences (14 | 13.6%), physical & health sciences (12 | 11.7%), and visual & performing arts (10 | 9.7%) are the most common fields of study among 103 individuals in Covelo who have obtained a bachelor's degree or higher.
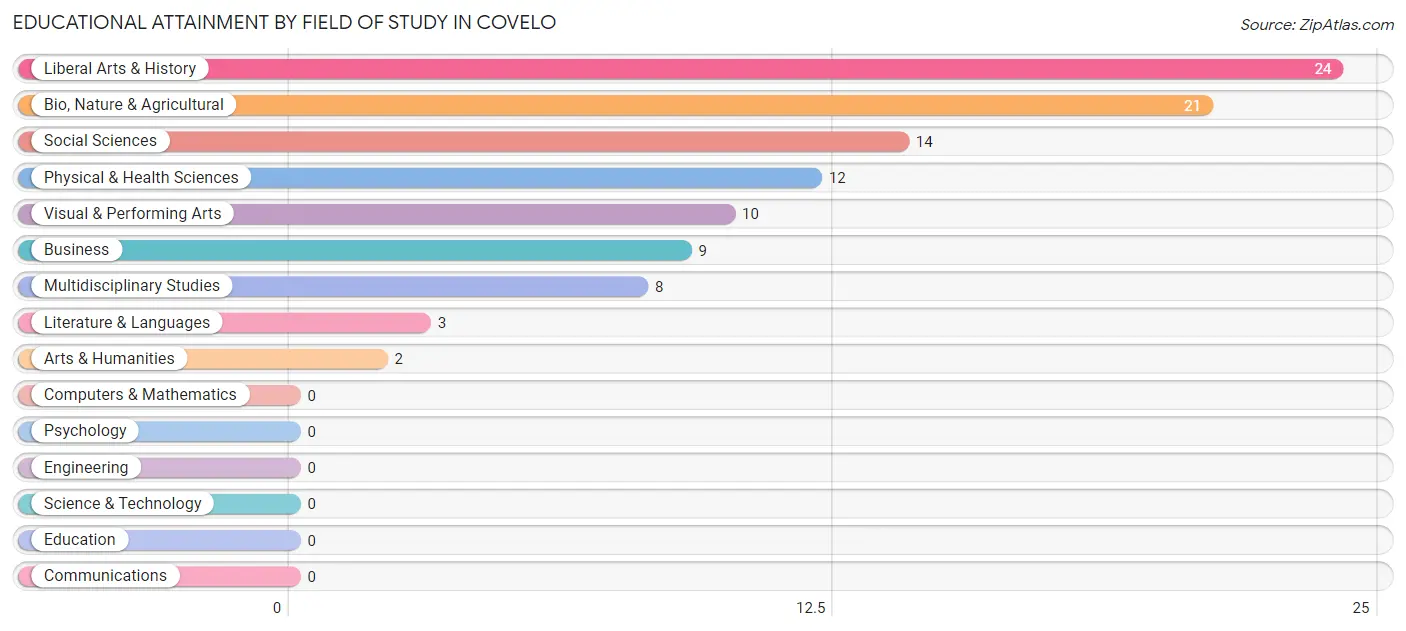
| Field of Study | # Graduates | % Graduates |
| Computers & Mathematics | 0 | 0.0% |
| Bio, Nature & Agricultural | 21 | 20.4% |
| Physical & Health Sciences | 12 | 11.7% |
| Psychology | 0 | 0.0% |
| Social Sciences | 14 | 13.6% |
| Engineering | 0 | 0.0% |
| Multidisciplinary Studies | 8 | 7.8% |
| Science & Technology | 0 | 0.0% |
| Business | 9 | 8.7% |
| Education | 0 | 0.0% |
| Literature & Languages | 3 | 2.9% |
| Liberal Arts & History | 24 | 23.3% |
| Visual & Performing Arts | 10 | 9.7% |
| Communications | 0 | 0.0% |
| Arts & Humanities | 2 | 1.9% |
| Total | 103 | 100.0% |
Transportation & Commute in Covelo
Vehicle Availability by Sex in Covelo
The most prevalent vehicle ownership categories in Covelo are males with 2 vehicles (100, accounting for 46.9%) and females with 2 vehicles (54, making up 65.4%).
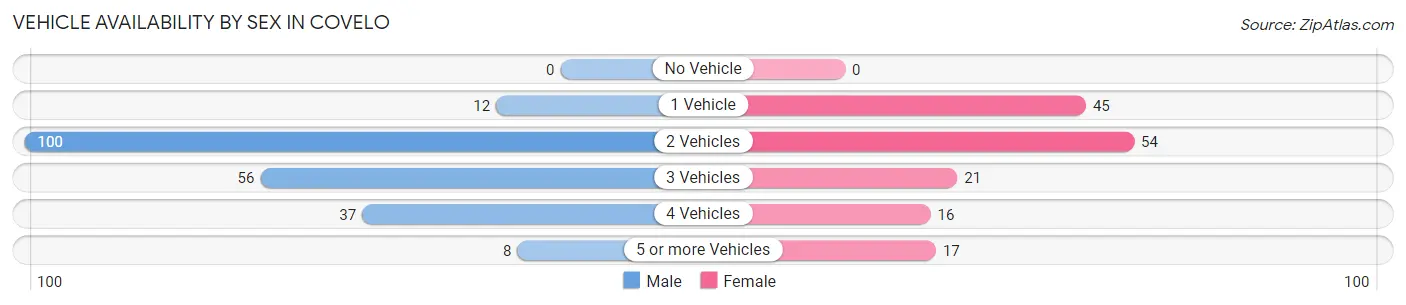
| Vehicles Available | Male | Female |
| No Vehicle | 0 (0.0%) | 0 (0.0%) |
| 1 Vehicle | 12 (5.6%) | 45 (29.4%) |
| 2 Vehicles | 100 (46.9%) | 54 (35.3%) |
| 3 Vehicles | 56 (26.3%) | 21 (13.7%) |
| 4 Vehicles | 37 (17.4%) | 16 (10.5%) |
| 5 or more Vehicles | 8 (3.8%) | 17 (11.1%) |
| Total | 213 (100.0%) | 153 (100.0%) |
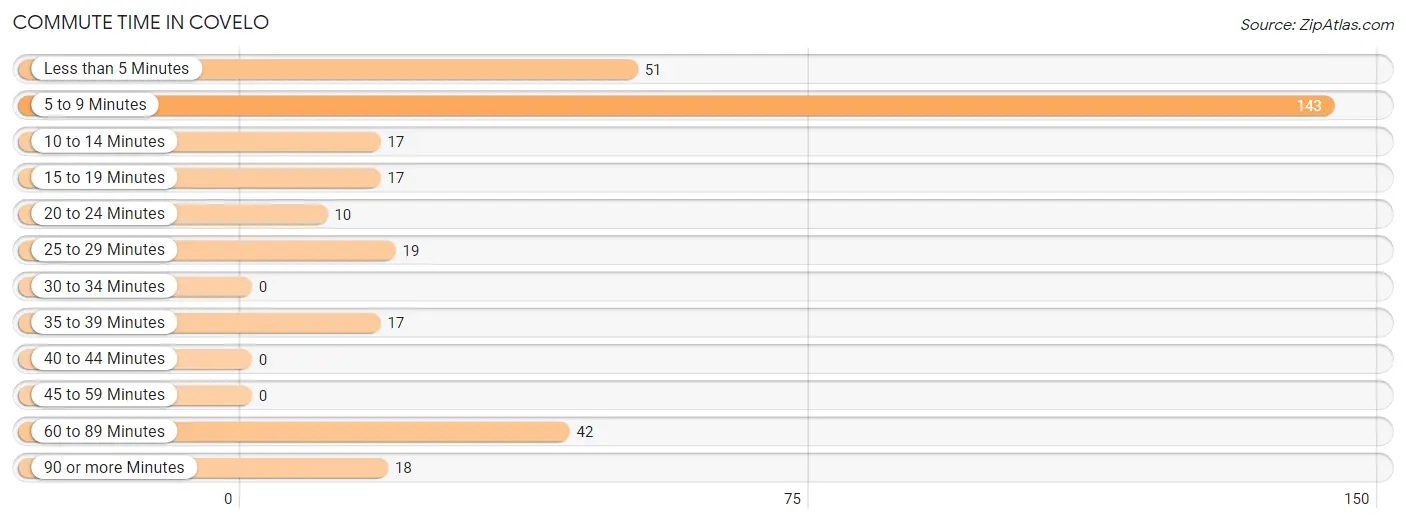
Commute Time in Covelo
The most frequently occuring commute durations in Covelo are 5 to 9 minutes (143 commuters, 42.8%), less than 5 minutes (51 commuters, 15.3%), and 60 to 89 minutes (42 commuters, 12.6%).
| Commute Time | # Commuters | % Commuters |
| Less than 5 Minutes | 51 | 15.3% |
| 5 to 9 Minutes | 143 | 42.8% |
| 10 to 14 Minutes | 17 | 5.1% |
| 15 to 19 Minutes | 17 | 5.1% |
| 20 to 24 Minutes | 10 | 3.0% |
| 25 to 29 Minutes | 19 | 5.7% |
| 30 to 34 Minutes | 0 | 0.0% |
| 35 to 39 Minutes | 17 | 5.1% |
| 40 to 44 Minutes | 0 | 0.0% |
| 45 to 59 Minutes | 0 | 0.0% |
| 60 to 89 Minutes | 42 | 12.6% |
| 90 or more Minutes | 18 | 5.4% |
Commute Time by Sex in Covelo
The most common commute times in Covelo are 5 to 9 minutes (39 commuters, 21.5%) for males and 5 to 9 minutes (104 commuters, 68.0%) for females.
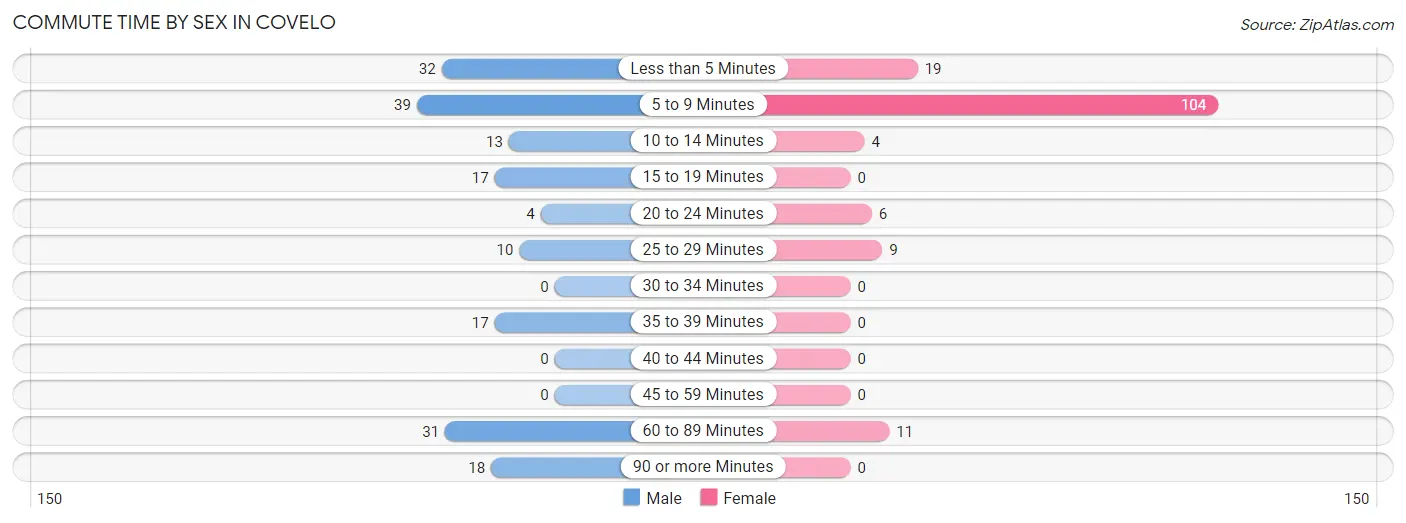
| Commute Time | Male | Female |
| Less than 5 Minutes | 32 (17.7%) | 19 (12.4%) |
| 5 to 9 Minutes | 39 (21.5%) | 104 (68.0%) |
| 10 to 14 Minutes | 13 (7.2%) | 4 (2.6%) |
| 15 to 19 Minutes | 17 (9.4%) | 0 (0.0%) |
| 20 to 24 Minutes | 4 (2.2%) | 6 (3.9%) |
| 25 to 29 Minutes | 10 (5.5%) | 9 (5.9%) |
| 30 to 34 Minutes | 0 (0.0%) | 0 (0.0%) |
| 35 to 39 Minutes | 17 (9.4%) | 0 (0.0%) |
| 40 to 44 Minutes | 0 (0.0%) | 0 (0.0%) |
| 45 to 59 Minutes | 0 (0.0%) | 0 (0.0%) |
| 60 to 89 Minutes | 31 (17.1%) | 11 (7.2%) |
| 90 or more Minutes | 18 (9.9%) | 0 (0.0%) |
Time of Departure to Work by Sex in Covelo
The most frequent times of departure to work in Covelo are 8:00 AM to 8:29 AM (27, 14.9%) for males and 7:30 AM to 7:59 AM (76, 49.7%) for females.
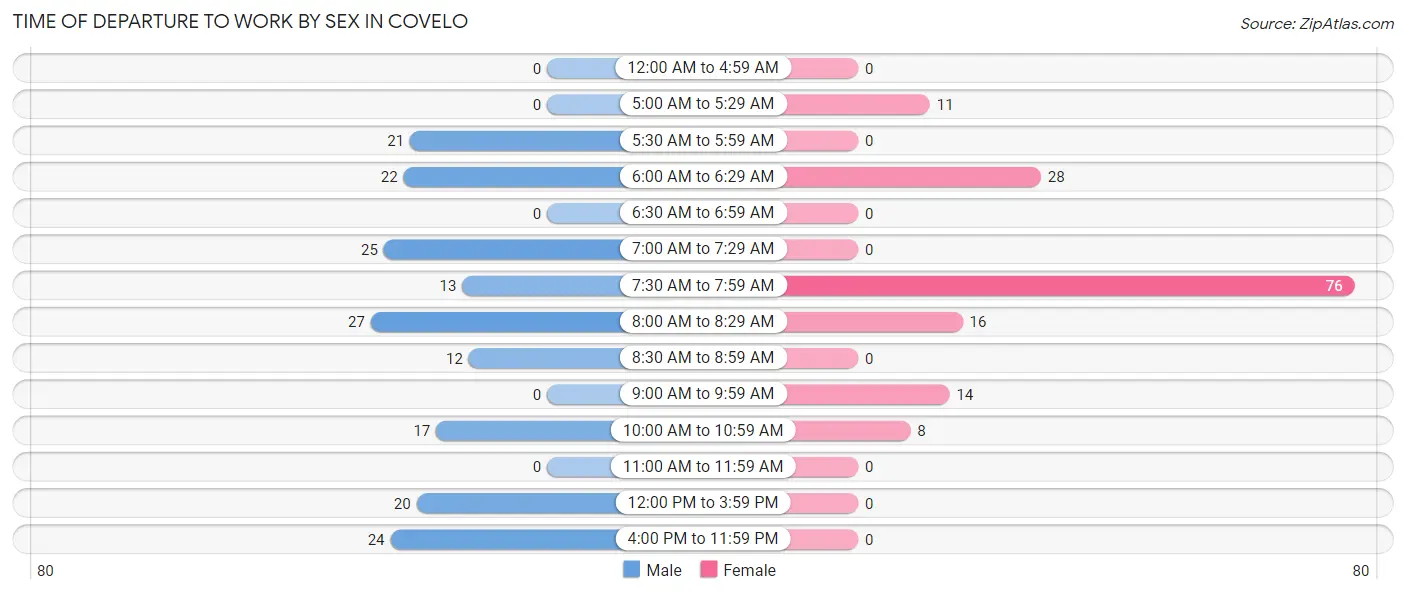
| Time of Departure | Male | Female |
| 12:00 AM to 4:59 AM | 0 (0.0%) | 0 (0.0%) |
| 5:00 AM to 5:29 AM | 0 (0.0%) | 11 (7.2%) |
| 5:30 AM to 5:59 AM | 21 (11.6%) | 0 (0.0%) |
| 6:00 AM to 6:29 AM | 22 (12.1%) | 28 (18.3%) |
| 6:30 AM to 6:59 AM | 0 (0.0%) | 0 (0.0%) |
| 7:00 AM to 7:29 AM | 25 (13.8%) | 0 (0.0%) |
| 7:30 AM to 7:59 AM | 13 (7.2%) | 76 (49.7%) |
| 8:00 AM to 8:29 AM | 27 (14.9%) | 16 (10.5%) |
| 8:30 AM to 8:59 AM | 12 (6.6%) | 0 (0.0%) |
| 9:00 AM to 9:59 AM | 0 (0.0%) | 14 (9.1%) |
| 10:00 AM to 10:59 AM | 17 (9.4%) | 8 (5.2%) |
| 11:00 AM to 11:59 AM | 0 (0.0%) | 0 (0.0%) |
| 12:00 PM to 3:59 PM | 20 (11.1%) | 0 (0.0%) |
| 4:00 PM to 11:59 PM | 24 (13.3%) | 0 (0.0%) |
| Total | 181 (100.0%) | 153 (100.0%) |
Housing Occupancy in Covelo
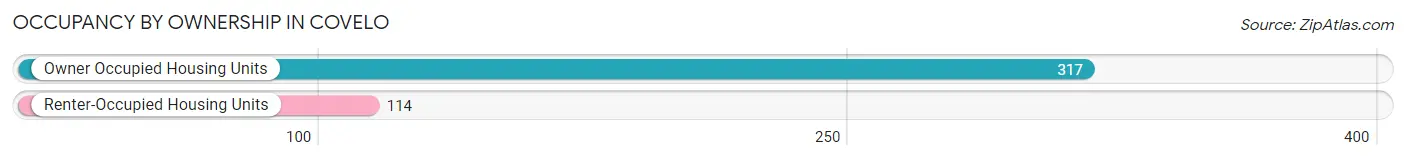
Occupancy by Ownership in Covelo
Of the total 431 dwellings in Covelo, owner-occupied units account for 317 (73.6%), while renter-occupied units make up 114 (26.5%).
| Occupancy | # Housing Units | % Housing Units |
| Owner Occupied Housing Units | 317 | 73.6% |
| Renter-Occupied Housing Units | 114 | 26.5% |
| Total Occupied Housing Units | 431 | 100.0% |
Occupancy by Household Size in Covelo
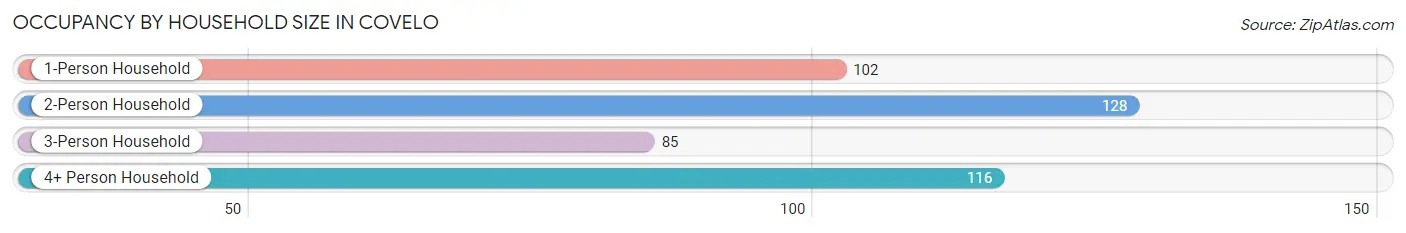
| Household Size | # Housing Units | % Housing Units |
| 1-Person Household | 102 | 23.7% |
| 2-Person Household | 128 | 29.7% |
| 3-Person Household | 85 | 19.7% |
| 4+ Person Household | 116 | 26.9% |
| Total Housing Units | 431 | 100.0% |
Occupancy by Ownership by Household Size in Covelo
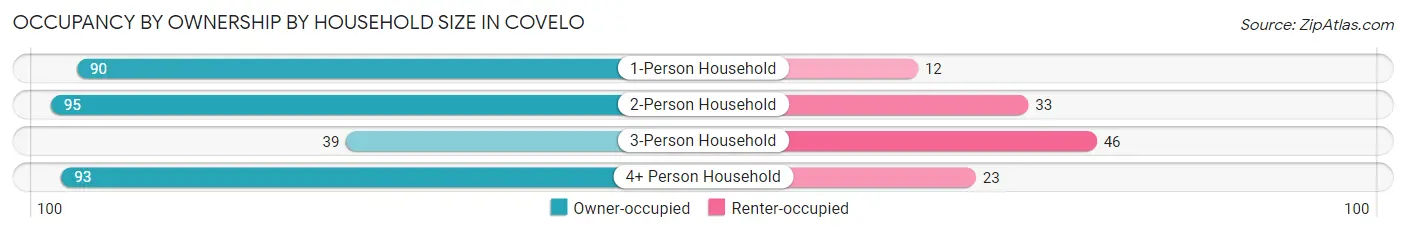
| Household Size | Owner-occupied | Renter-occupied |
| 1-Person Household | 90 (88.2%) | 12 (11.8%) |
| 2-Person Household | 95 (74.2%) | 33 (25.8%) |
| 3-Person Household | 39 (45.9%) | 46 (54.1%) |
| 4+ Person Household | 93 (80.2%) | 23 (19.8%) |
| Total Housing Units | 317 (73.6%) | 114 (26.5%) |
Occupancy by Educational Attainment in Covelo
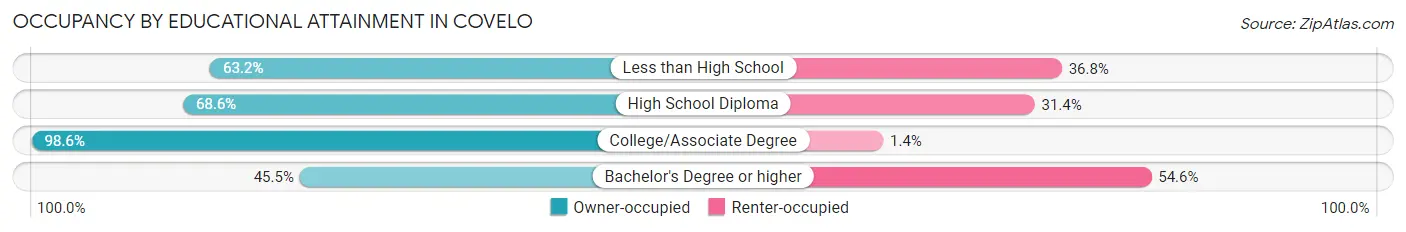
| Household Size | Owner-occupied | Renter-occupied |
| Less than High School | 55 (63.2%) | 32 (36.8%) |
| High School Diploma | 83 (68.6%) | 38 (31.4%) |
| College/Associate Degree | 144 (98.6%) | 2 (1.4%) |
| Bachelor's Degree or higher | 35 (45.5%) | 42 (54.5%) |
Occupancy by Age of Householder in Covelo
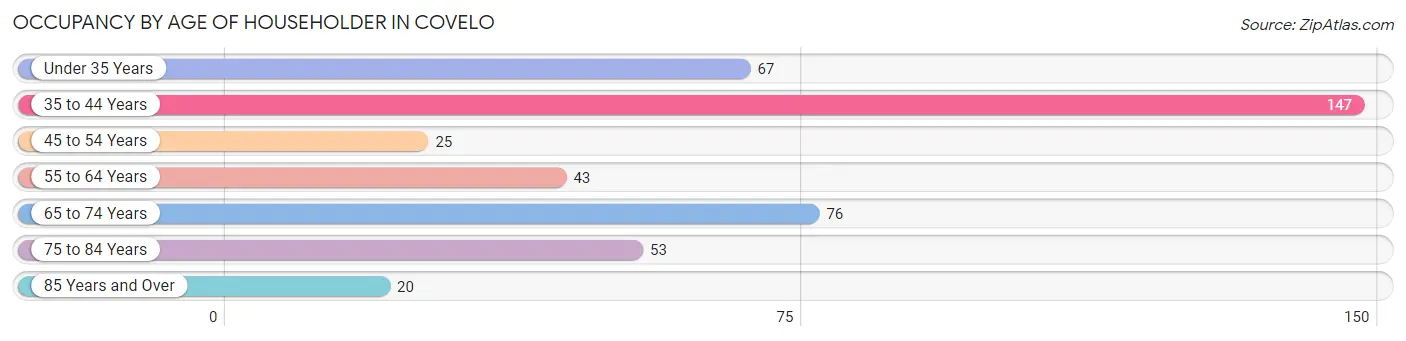
| Age Bracket | # Households | % Households |
| Under 35 Years | 67 | 15.5% |
| 35 to 44 Years | 147 | 34.1% |
| 45 to 54 Years | 25 | 5.8% |
| 55 to 64 Years | 43 | 10.0% |
| 65 to 74 Years | 76 | 17.6% |
| 75 to 84 Years | 53 | 12.3% |
| 85 Years and Over | 20 | 4.6% |
| Total | 431 | 100.0% |
Housing Finances in Covelo
Median Income by Occupancy in Covelo
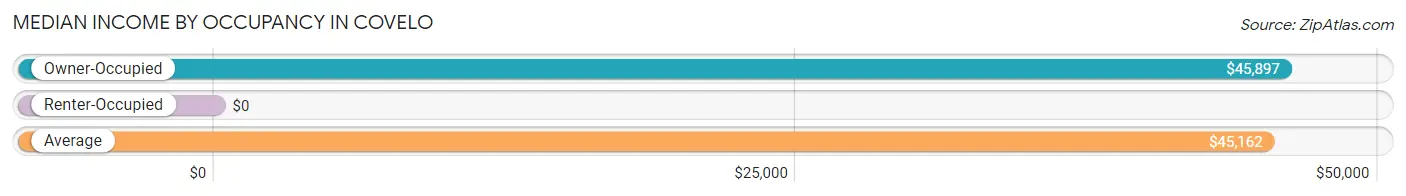
| Occupancy Type | # Households | Median Income |
| Owner-Occupied | 317 (73.6%) | $45,897 |
| Renter-Occupied | 114 (26.5%) | $0 |
| Average | 431 (100.0%) | $45,162 |
Occupancy by Householder Income Bracket in Covelo
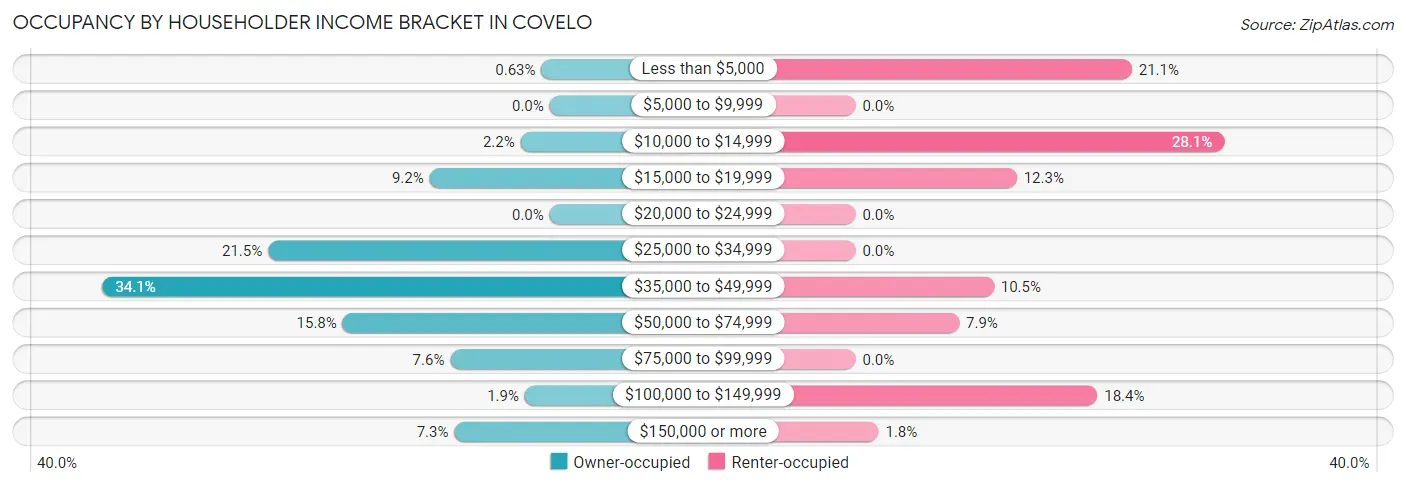
| Income Bracket | Owner-occupied | Renter-occupied |
| Less than $5,000 | 2 (0.6%) | 24 (21.0%) |
| $5,000 to $9,999 | 0 (0.0%) | 0 (0.0%) |
| $10,000 to $14,999 | 7 (2.2%) | 32 (28.1%) |
| $15,000 to $19,999 | 29 (9.1%) | 14 (12.3%) |
| $20,000 to $24,999 | 0 (0.0%) | 0 (0.0%) |
| $25,000 to $34,999 | 68 (21.4%) | 0 (0.0%) |
| $35,000 to $49,999 | 108 (34.1%) | 12 (10.5%) |
| $50,000 to $74,999 | 50 (15.8%) | 9 (7.9%) |
| $75,000 to $99,999 | 24 (7.6%) | 0 (0.0%) |
| $100,000 to $149,999 | 6 (1.9%) | 21 (18.4%) |
| $150,000 or more | 23 (7.3%) | 2 (1.8%) |
| Total | 317 (100.0%) | 114 (100.0%) |
Monthly Housing Cost Tiers in Covelo
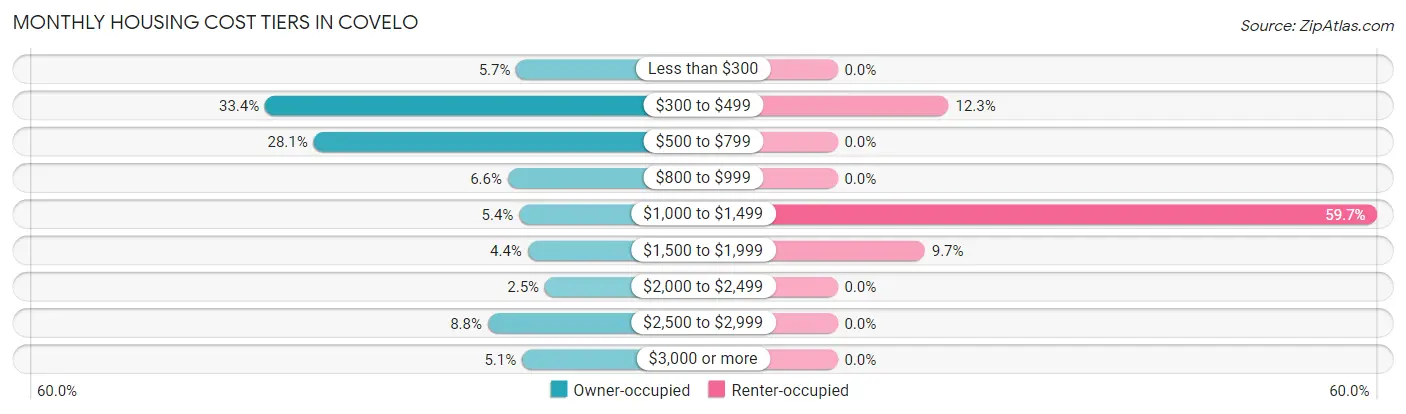
| Monthly Cost | Owner-occupied | Renter-occupied |
| Less than $300 | 18 (5.7%) | 0 (0.0%) |
| $300 to $499 | 106 (33.4%) | 14 (12.3%) |
| $500 to $799 | 89 (28.1%) | 0 (0.0%) |
| $800 to $999 | 21 (6.6%) | 0 (0.0%) |
| $1,000 to $1,499 | 17 (5.4%) | 68 (59.7%) |
| $1,500 to $1,999 | 14 (4.4%) | 11 (9.7%) |
| $2,000 to $2,499 | 8 (2.5%) | 0 (0.0%) |
| $2,500 to $2,999 | 28 (8.8%) | 0 (0.0%) |
| $3,000 or more | 16 (5.1%) | 0 (0.0%) |
| Total | 317 (100.0%) | 114 (100.0%) |
Physical Housing Characteristics in Covelo
Housing Structures in Covelo
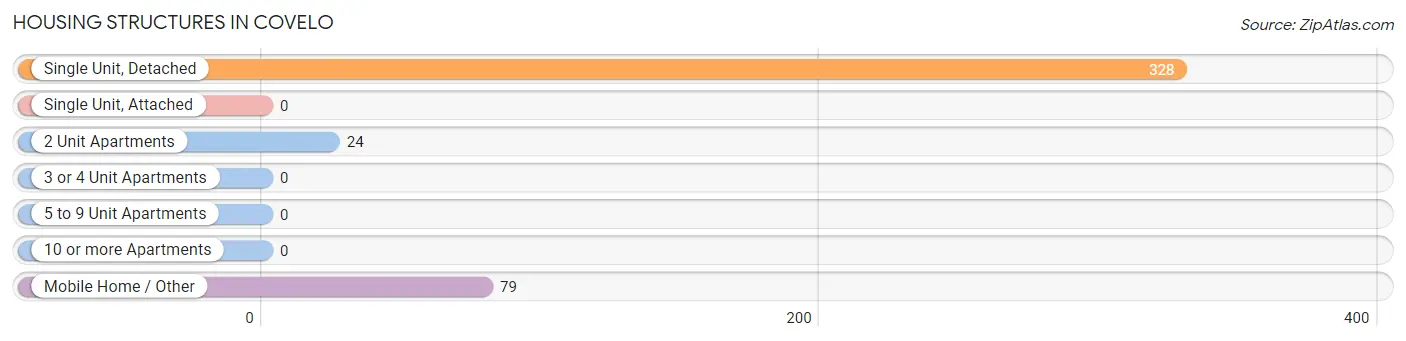
| Structure Type | # Housing Units | % Housing Units |
| Single Unit, Detached | 328 | 76.1% |
| Single Unit, Attached | 0 | 0.0% |
| 2 Unit Apartments | 24 | 5.6% |
| 3 or 4 Unit Apartments | 0 | 0.0% |
| 5 to 9 Unit Apartments | 0 | 0.0% |
| 10 or more Apartments | 0 | 0.0% |
| Mobile Home / Other | 79 | 18.3% |
| Total | 431 | 100.0% |
Housing Structures by Occupancy in Covelo
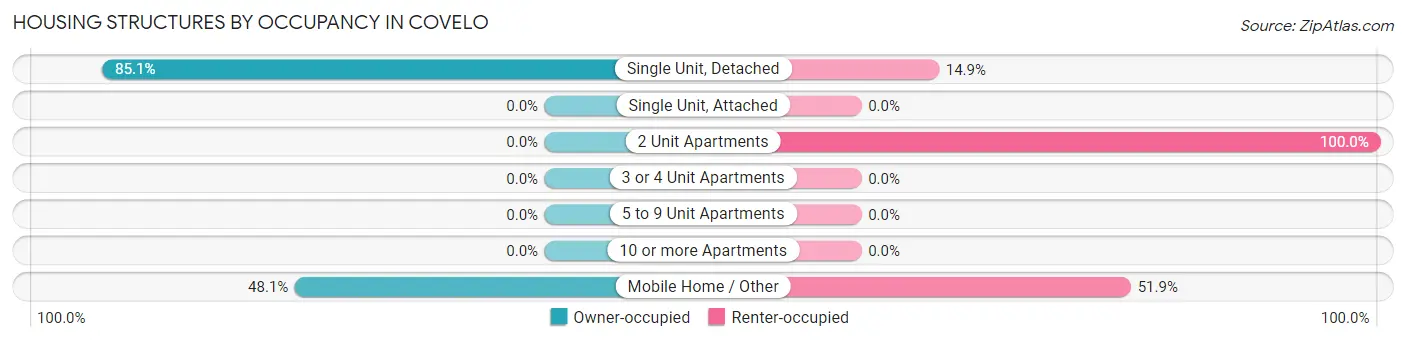
| Structure Type | Owner-occupied | Renter-occupied |
| Single Unit, Detached | 279 (85.1%) | 49 (14.9%) |
| Single Unit, Attached | 0 (0.0%) | 0 (0.0%) |
| 2 Unit Apartments | 0 (0.0%) | 24 (100.0%) |
| 3 or 4 Unit Apartments | 0 (0.0%) | 0 (0.0%) |
| 5 to 9 Unit Apartments | 0 (0.0%) | 0 (0.0%) |
| 10 or more Apartments | 0 (0.0%) | 0 (0.0%) |
| Mobile Home / Other | 38 (48.1%) | 41 (51.9%) |
| Total | 317 (73.6%) | 114 (26.5%) |
Housing Structures by Number of Rooms in Covelo
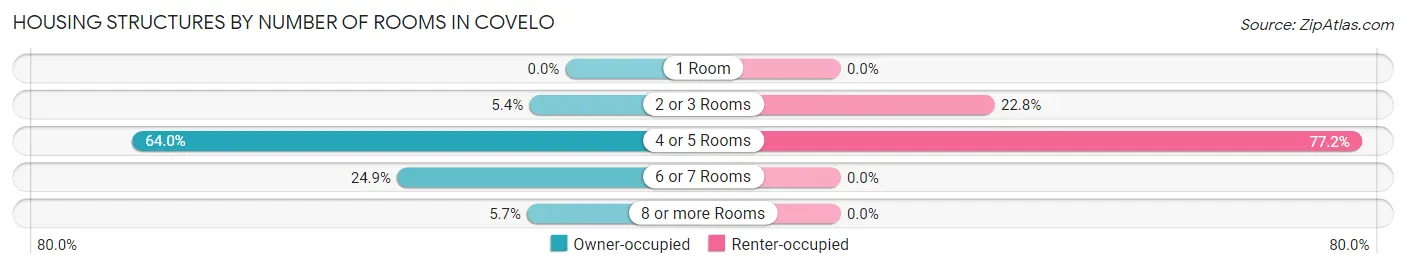
| Number of Rooms | Owner-occupied | Renter-occupied |
| 1 Room | 0 (0.0%) | 0 (0.0%) |
| 2 or 3 Rooms | 17 (5.4%) | 26 (22.8%) |
| 4 or 5 Rooms | 203 (64.0%) | 88 (77.2%) |
| 6 or 7 Rooms | 79 (24.9%) | 0 (0.0%) |
| 8 or more Rooms | 18 (5.7%) | 0 (0.0%) |
| Total | 317 (100.0%) | 114 (100.0%) |
Housing Structure by Heating Type in Covelo
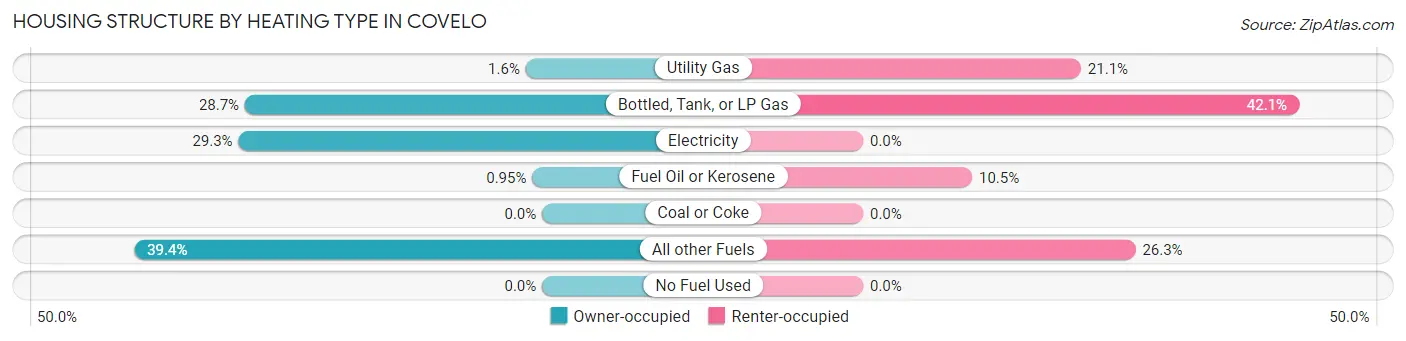
| Heating Type | Owner-occupied | Renter-occupied |
| Utility Gas | 5 (1.6%) | 24 (21.0%) |
| Bottled, Tank, or LP Gas | 91 (28.7%) | 48 (42.1%) |
| Electricity | 93 (29.3%) | 0 (0.0%) |
| Fuel Oil or Kerosene | 3 (0.9%) | 12 (10.5%) |
| Coal or Coke | 0 (0.0%) | 0 (0.0%) |
| All other Fuels | 125 (39.4%) | 30 (26.3%) |
| No Fuel Used | 0 (0.0%) | 0 (0.0%) |
| Total | 317 (100.0%) | 114 (100.0%) |
Household Vehicle Usage in Covelo
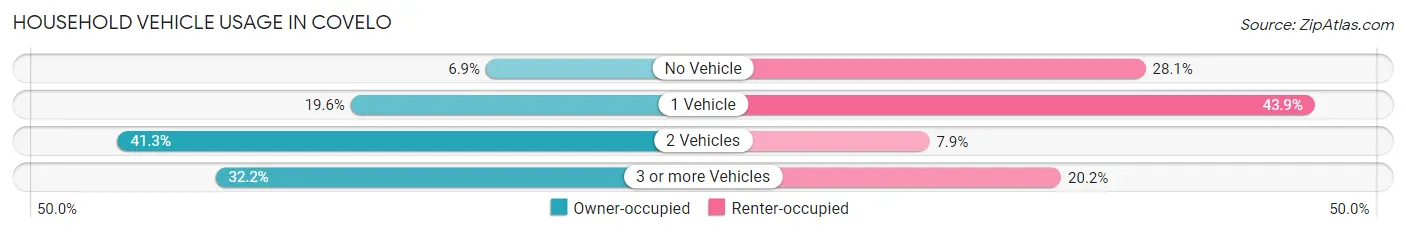
| Vehicles per Household | Owner-occupied | Renter-occupied |
| No Vehicle | 22 (6.9%) | 32 (28.1%) |
| 1 Vehicle | 62 (19.6%) | 50 (43.9%) |
| 2 Vehicles | 131 (41.3%) | 9 (7.9%) |
| 3 or more Vehicles | 102 (32.2%) | 23 (20.2%) |
| Total | 317 (100.0%) | 114 (100.0%) |
Real Estate & Mortgages in Covelo
Real Estate and Mortgage Overview in Covelo
| Characteristic | Without Mortgage | With Mortgage |
| Housing Units | 189 | 128 |
| Median Property Value | $381,600 | $322,200 |
| Median Household Income | $46,054 | $16 |
| Monthly Housing Costs | $465 | $16 |
| Real Estate Taxes | $2,109 | $36 |
Property Value by Mortgage Status in Covelo
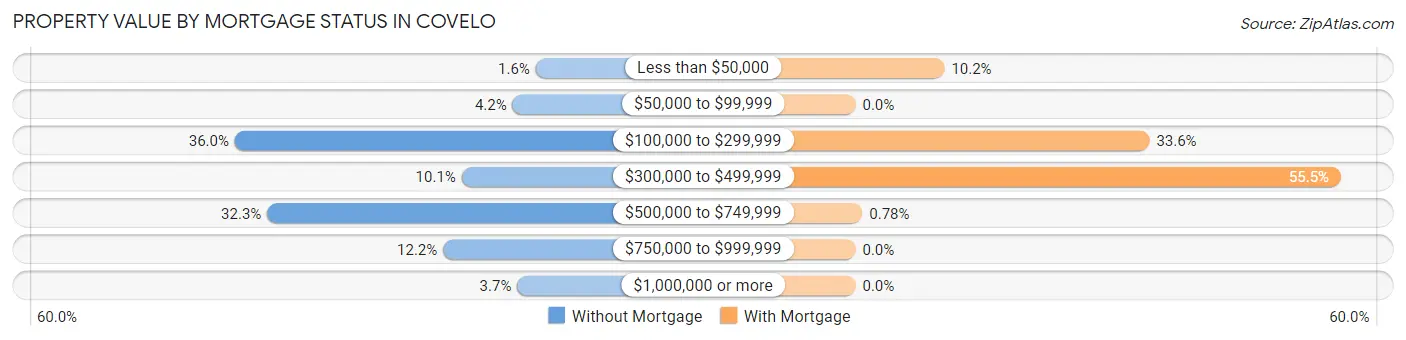
| Property Value | Without Mortgage | With Mortgage |
| Less than $50,000 | 3 (1.6%) | 13 (10.2%) |
| $50,000 to $99,999 | 8 (4.2%) | 0 (0.0%) |
| $100,000 to $299,999 | 68 (36.0%) | 43 (33.6%) |
| $300,000 to $499,999 | 19 (10.1%) | 71 (55.5%) |
| $500,000 to $749,999 | 61 (32.3%) | 1 (0.8%) |
| $750,000 to $999,999 | 23 (12.2%) | 0 (0.0%) |
| $1,000,000 or more | 7 (3.7%) | 0 (0.0%) |
| Total | 189 (100.0%) | 128 (100.0%) |
Household Income by Mortgage Status in Covelo
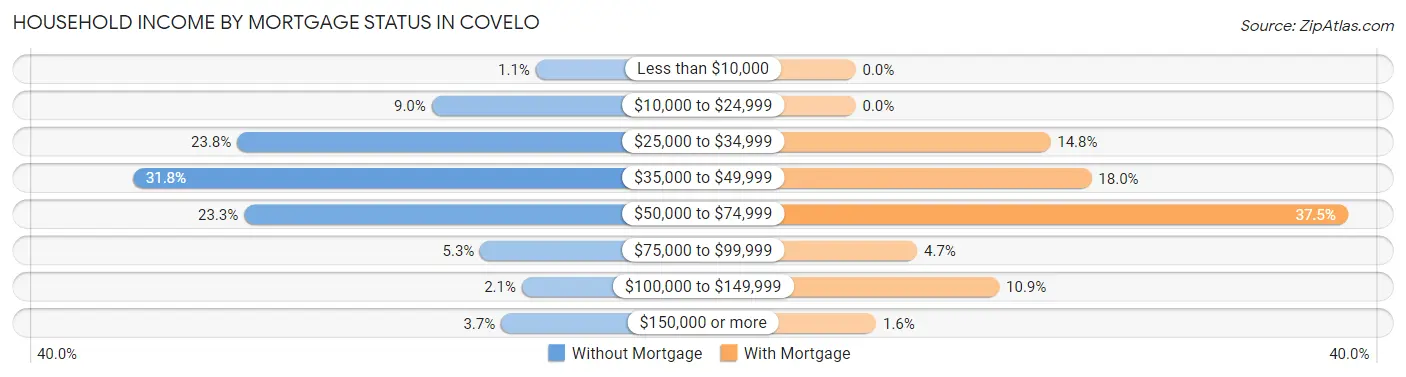
| Household Income | Without Mortgage | With Mortgage |
| Less than $10,000 | 2 (1.1%) | 0 (0.0%) |
| $10,000 to $24,999 | 17 (9.0%) | 0 (0.0%) |
| $25,000 to $34,999 | 45 (23.8%) | 19 (14.8%) |
| $35,000 to $49,999 | 60 (31.8%) | 23 (18.0%) |
| $50,000 to $74,999 | 44 (23.3%) | 48 (37.5%) |
| $75,000 to $99,999 | 10 (5.3%) | 6 (4.7%) |
| $100,000 to $149,999 | 4 (2.1%) | 14 (10.9%) |
| $150,000 or more | 7 (3.7%) | 2 (1.6%) |
| Total | 189 (100.0%) | 128 (100.0%) |
Property Value to Household Income Ratio in Covelo
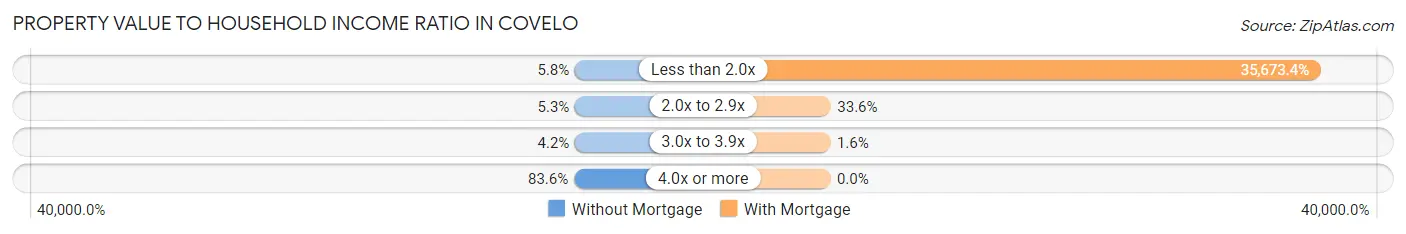
| Value-to-Income Ratio | Without Mortgage | With Mortgage |
| Less than 2.0x | 11 (5.8%) | 45,662 (35,673.4%) |
| 2.0x to 2.9x | 10 (5.3%) | 43 (33.6%) |
| 3.0x to 3.9x | 8 (4.2%) | 2 (1.6%) |
| 4.0x or more | 158 (83.6%) | 0 (0.0%) |
| Total | 189 (100.0%) | 128 (100.0%) |
Real Estate Taxes by Mortgage Status in Covelo
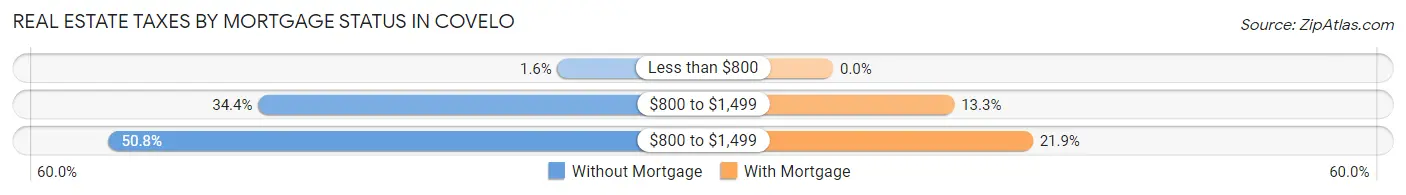
| Property Taxes | Without Mortgage | With Mortgage |
| Less than $800 | 3 (1.6%) | 0 (0.0%) |
| $800 to $1,499 | 65 (34.4%) | 17 (13.3%) |
| $800 to $1,499 | 96 (50.8%) | 28 (21.9%) |
| Total | 189 (100.0%) | 128 (100.0%) |
Health & Disability in Covelo
Health Insurance Coverage by Age in Covelo
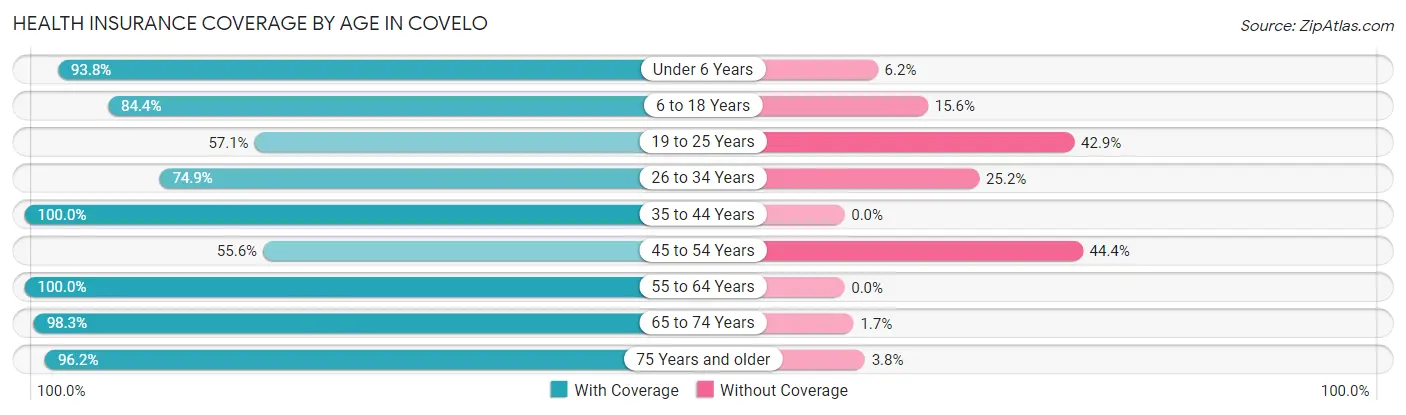
| Age Bracket | With Coverage | Without Coverage |
| Under 6 Years | 181 (93.8%) | 12 (6.2%) |
| 6 to 18 Years | 244 (84.4%) | 45 (15.6%) |
| 19 to 25 Years | 28 (57.1%) | 21 (42.9%) |
| 26 to 34 Years | 122 (74.9%) | 41 (25.2%) |
| 35 to 44 Years | 215 (100.0%) | 0 (0.0%) |
| 45 to 54 Years | 80 (55.6%) | 64 (44.4%) |
| 55 to 64 Years | 78 (100.0%) | 0 (0.0%) |
| 65 to 74 Years | 115 (98.3%) | 2 (1.7%) |
| 75 Years and older | 101 (96.2%) | 4 (3.8%) |
| Total | 1,164 (86.0%) | 189 (14.0%) |
Health Insurance Coverage by Citizenship Status in Covelo
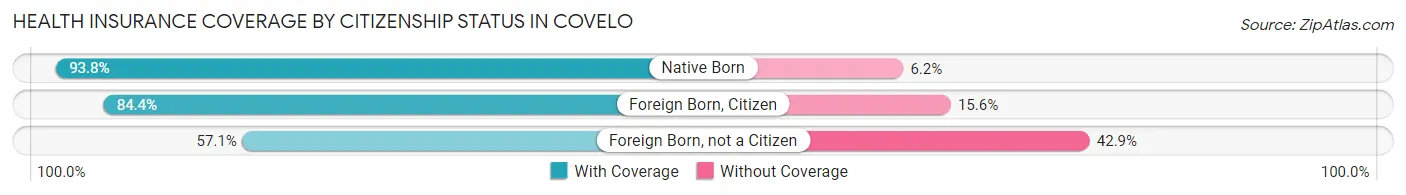
| Citizenship Status | With Coverage | Without Coverage |
| Native Born | 181 (93.8%) | 12 (6.2%) |
| Foreign Born, Citizen | 244 (84.4%) | 45 (15.6%) |
| Foreign Born, not a Citizen | 28 (57.1%) | 21 (42.9%) |
Health Insurance Coverage by Household Income in Covelo
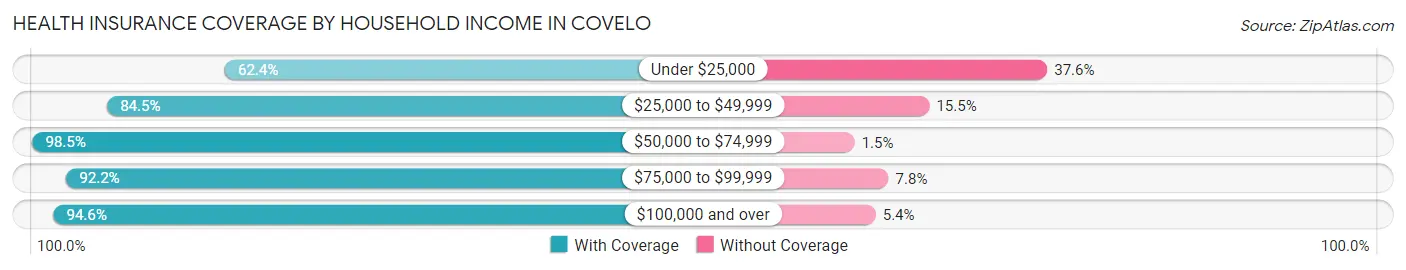
| Household Income | With Coverage | Without Coverage |
| Under $25,000 | 133 (62.4%) | 80 (37.6%) |
| $25,000 to $49,999 | 453 (84.5%) | 83 (15.5%) |
| $50,000 to $74,999 | 200 (98.5%) | 3 (1.5%) |
| $75,000 to $99,999 | 47 (92.2%) | 4 (7.8%) |
| $100,000 and over | 331 (94.6%) | 19 (5.4%) |
Public vs Private Health Insurance Coverage by Age in Covelo
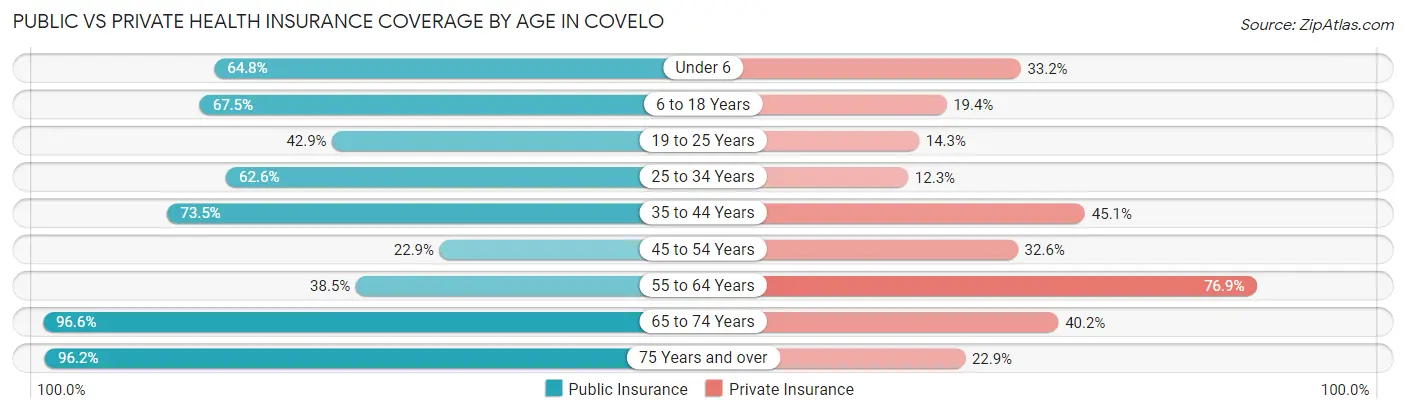
| Age Bracket | Public Insurance | Private Insurance |
| Under 6 | 125 (64.8%) | 64 (33.2%) |
| 6 to 18 Years | 195 (67.5%) | 56 (19.4%) |
| 19 to 25 Years | 21 (42.9%) | 7 (14.3%) |
| 25 to 34 Years | 102 (62.6%) | 20 (12.3%) |
| 35 to 44 Years | 158 (73.5%) | 97 (45.1%) |
| 45 to 54 Years | 33 (22.9%) | 47 (32.6%) |
| 55 to 64 Years | 30 (38.5%) | 60 (76.9%) |
| 65 to 74 Years | 113 (96.6%) | 47 (40.2%) |
| 75 Years and over | 101 (96.2%) | 24 (22.9%) |
| Total | 878 (64.9%) | 422 (31.2%) |
Disability Status by Sex by Age in Covelo
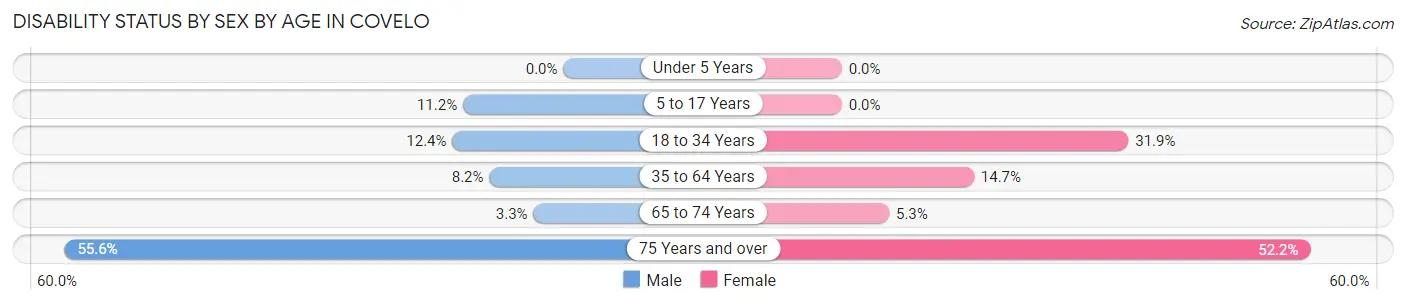
| Age Bracket | Male | Female |
| Under 5 Years | 0 (0.0%) | 0 (0.0%) |
| 5 to 17 Years | 19 (11.2%) | 0 (0.0%) |
| 18 to 34 Years | 11 (12.4%) | 45 (31.9%) |
| 35 to 64 Years | 22 (8.2%) | 25 (14.7%) |
| 65 to 74 Years | 2 (3.3%) | 3 (5.3%) |
| 75 Years and over | 20 (55.6%) | 36 (52.2%) |
Disability Class by Sex by Age in Covelo
Disability Class: Hearing Difficulty
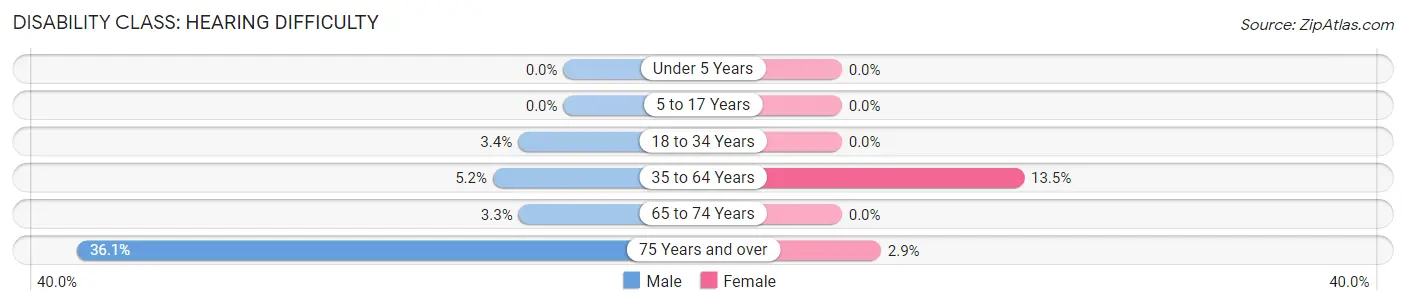
| Age Bracket | Male | Female |
| Under 5 Years | 0 (0.0%) | 0 (0.0%) |
| 5 to 17 Years | 0 (0.0%) | 0 (0.0%) |
| 18 to 34 Years | 3 (3.4%) | 0 (0.0%) |
| 35 to 64 Years | 14 (5.2%) | 23 (13.5%) |
| 65 to 74 Years | 2 (3.3%) | 0 (0.0%) |
| 75 Years and over | 13 (36.1%) | 2 (2.9%) |
Disability Class: Vision Difficulty
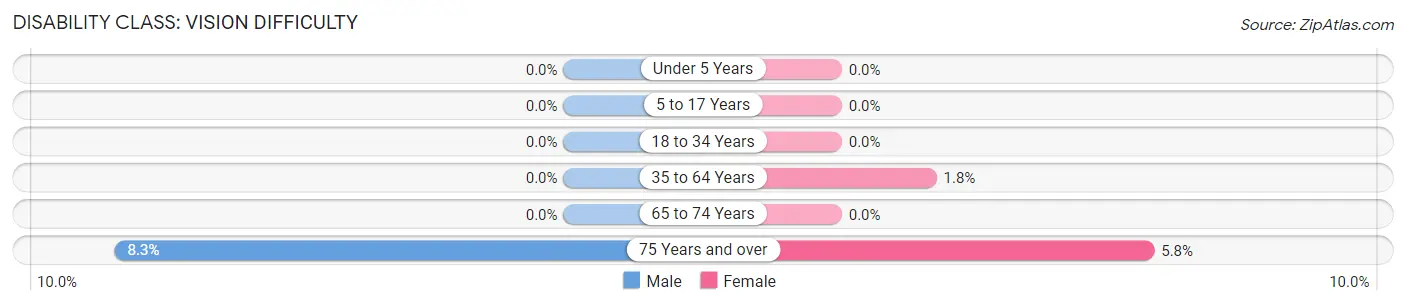
| Age Bracket | Male | Female |
| Under 5 Years | 0 (0.0%) | 0 (0.0%) |
| 5 to 17 Years | 0 (0.0%) | 0 (0.0%) |
| 18 to 34 Years | 0 (0.0%) | 0 (0.0%) |
| 35 to 64 Years | 0 (0.0%) | 3 (1.8%) |
| 65 to 74 Years | 0 (0.0%) | 0 (0.0%) |
| 75 Years and over | 3 (8.3%) | 4 (5.8%) |
Disability Class: Cognitive Difficulty
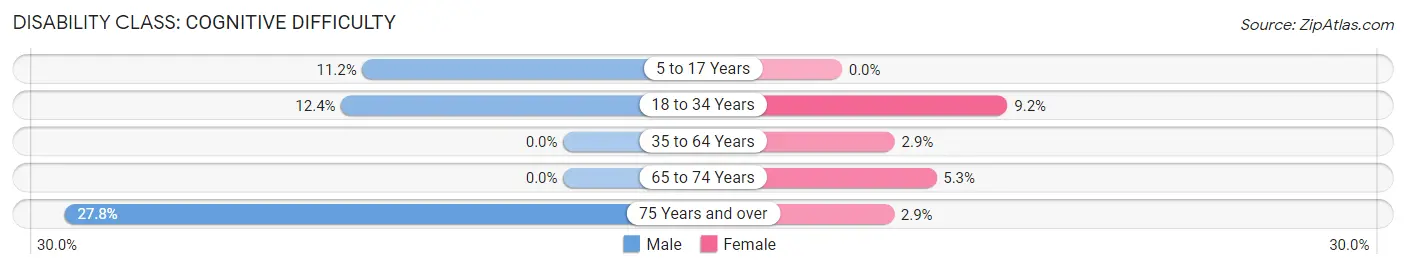
| Age Bracket | Male | Female |
| 5 to 17 Years | 19 (11.2%) | 0 (0.0%) |
| 18 to 34 Years | 11 (12.4%) | 13 (9.2%) |
| 35 to 64 Years | 0 (0.0%) | 5 (2.9%) |
| 65 to 74 Years | 0 (0.0%) | 3 (5.3%) |
| 75 Years and over | 10 (27.8%) | 2 (2.9%) |
Disability Class: Ambulatory Difficulty
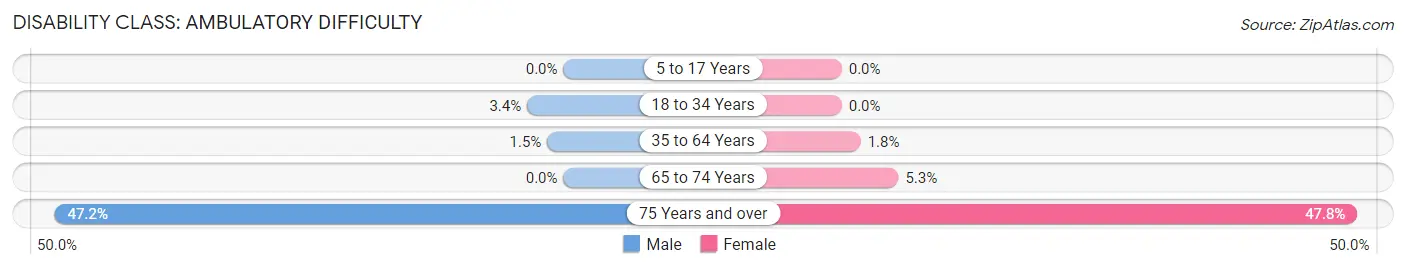
| Age Bracket | Male | Female |
| 5 to 17 Years | 0 (0.0%) | 0 (0.0%) |
| 18 to 34 Years | 3 (3.4%) | 0 (0.0%) |
| 35 to 64 Years | 4 (1.5%) | 3 (1.8%) |
| 65 to 74 Years | 0 (0.0%) | 3 (5.3%) |
| 75 Years and over | 17 (47.2%) | 33 (47.8%) |
Disability Class: Self-Care Difficulty
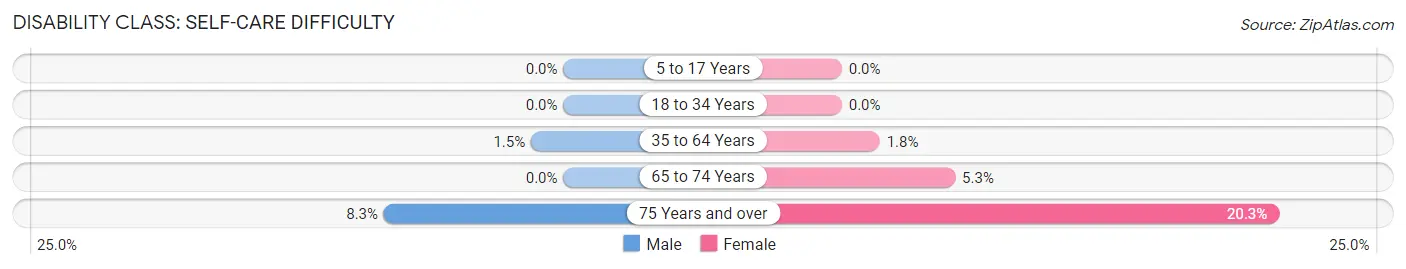
| Age Bracket | Male | Female |
| 5 to 17 Years | 0 (0.0%) | 0 (0.0%) |
| 18 to 34 Years | 0 (0.0%) | 0 (0.0%) |
| 35 to 64 Years | 4 (1.5%) | 3 (1.8%) |
| 65 to 74 Years | 0 (0.0%) | 3 (5.3%) |
| 75 Years and over | 3 (8.3%) | 14 (20.3%) |
Technology Access in Covelo
Computing Device Access in Covelo
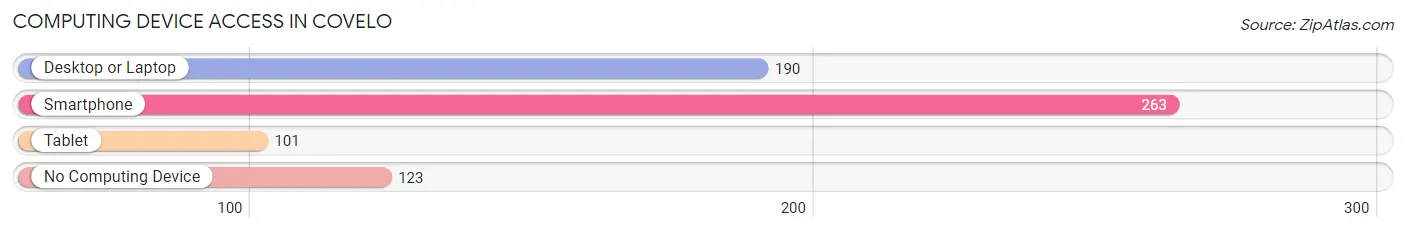
| Device Type | # Households | % Households |
| Desktop or Laptop | 190 | 44.1% |
| Smartphone | 263 | 61.0% |
| Tablet | 101 | 23.4% |
| No Computing Device | 123 | 28.5% |
| Total | 431 | 100.0% |
Internet Access in Covelo
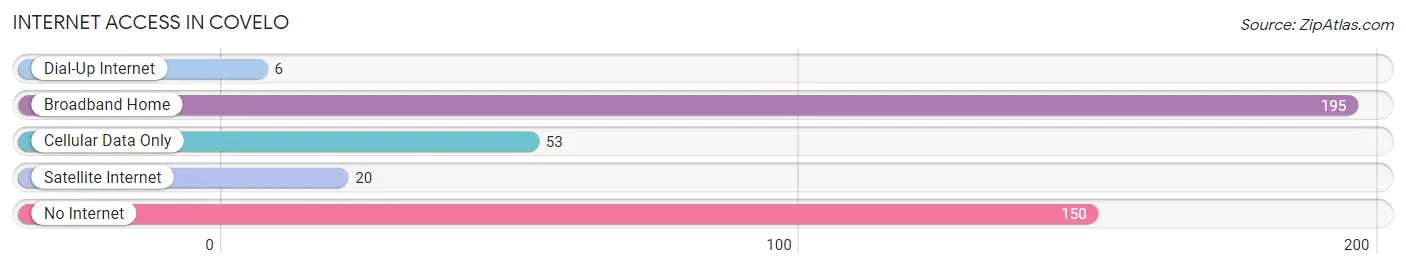
| Internet Type | # Households | % Households |
| Dial-Up Internet | 6 | 1.4% |
| Broadband Home | 195 | 45.2% |
| Cellular Data Only | 53 | 12.3% |
| Satellite Internet | 20 | 4.6% |
| No Internet | 150 | 34.8% |
| Total | 431 | 100.0% |
Covelo Summary
Covelo is a small unincorporated community located in Mendocino County, California. It is situated in the Round Valley Indian Reservation, which is home to the Round Valley Indian Tribes. The population of Covelo was 1,255 as of the 2010 census.
History
Covelo was originally inhabited by the Pomo Indians, who were the original inhabitants of the area. The Pomo Indians were hunter-gatherers who lived in the area for thousands of years before the arrival of Europeans. The first Europeans to settle in the area were Spanish missionaries, who established a mission in the area in 1821. The mission was abandoned in 1834, and the area was then settled by ranchers and farmers.
The town of Covelo was founded in 1856 by William Covelo, who was a rancher and farmer from the East Coast. He purchased land in the area and established a ranch, which he named Covelo Ranch. The town of Covelo was established in 1876, and the post office was established in 1877.
Geography
Covelo is located in the Round Valley Indian Reservation, which is located in the northern part of Mendocino County. The town is situated in a valley surrounded by mountains, and is located at an elevation of 1,845 feet. The climate in Covelo is mild, with temperatures ranging from the mid-50s to the mid-80s in the summer months.
Economy
The economy of Covelo is largely based on agriculture and ranching. The town is home to several farms and ranches, which produce a variety of crops and livestock. The town is also home to several small businesses, including restaurants, stores, and other services.
Demographics
As of the 2010 census, the population of Covelo was 1,255. The racial makeup of the town was 73.3% White, 0.7% African American, 0.7% Native American, 0.3% Asian, 0.1% Pacific Islander, 22.2% from other races, and 2.9% from two or more races. The median household income in Covelo was $30,938, and the median family income was $35,625. The per capita income in Covelo was $14,845.
Conclusion
Covelo is a small unincorporated community located in Mendocino County, California. It is situated in the Round Valley Indian Reservation, which is home to the Round Valley Indian Tribes. The population of Covelo was 1,255 as of the 2010 census. The town was founded in 1856 by William Covelo, and the economy is largely based on agriculture and ranching. The racial makeup of the town was 73.3% White, 0.7% African American, 0.7% Native American, 0.3% Asian, 0.1% Pacific Islander, 22.2% from other races, and 2.9% from two or more races. The median household income in Covelo was $30,938, and the median family income was $35,625. The per capita income in Covelo was $14,845.
Common Questions
What is Per Capita Income in Covelo?
Per Capita income in Covelo is $18,649.
What is the Median Family Income in Covelo?
Median Family Income in Covelo is $36,921.
What is the Median Household income in Covelo?
Median Household Income in Covelo is $45,162.
What is Income or Wage Gap in Covelo?
Income or Wage Gap in Covelo is 39.3%.
Women in Covelo earn 60.7 cents for every dollar earned by a man.
What is Inequality or Gini Index in Covelo?
Inequality or Gini Index in Covelo is 0.45.
What is the Total Population of Covelo?
Total Population of Covelo is 1,359.
What is the Total Male Population of Covelo?
Total Male Population of Covelo is 703.
What is the Total Female Population of Covelo?
Total Female Population of Covelo is 656.
What is the Ratio of Males per 100 Females in Covelo?
There are 107.16 Males per 100 Females in Covelo.
What is the Ratio of Females per 100 Males in Covelo?
There are 93.31 Females per 100 Males in Covelo.
What is the Median Population Age in Covelo?
Median Population Age in Covelo is 34.5 Years.
What is the Average Family Size in Covelo
Average Family Size in Covelo is 3.4 People.
What is the Average Household Size in Covelo
Average Household Size in Covelo is 3.1 People.
How Large is the Labor Force in Covelo?
There are 497 People in the Labor Forcein in Covelo.
What is the Percentage of People in the Labor Force in Covelo?
52.6% of People are in the Labor Force in Covelo.
What is the Unemployment Rate in Covelo?
Unemployment Rate in Covelo is 26.4%.