Cities with the Highest Percentage of Population Employed in Food Preparation & Serving in Oregon
RELATED REPORTS & OPTIONS
Food Preparation & Serving
Oregon
Compare Cities
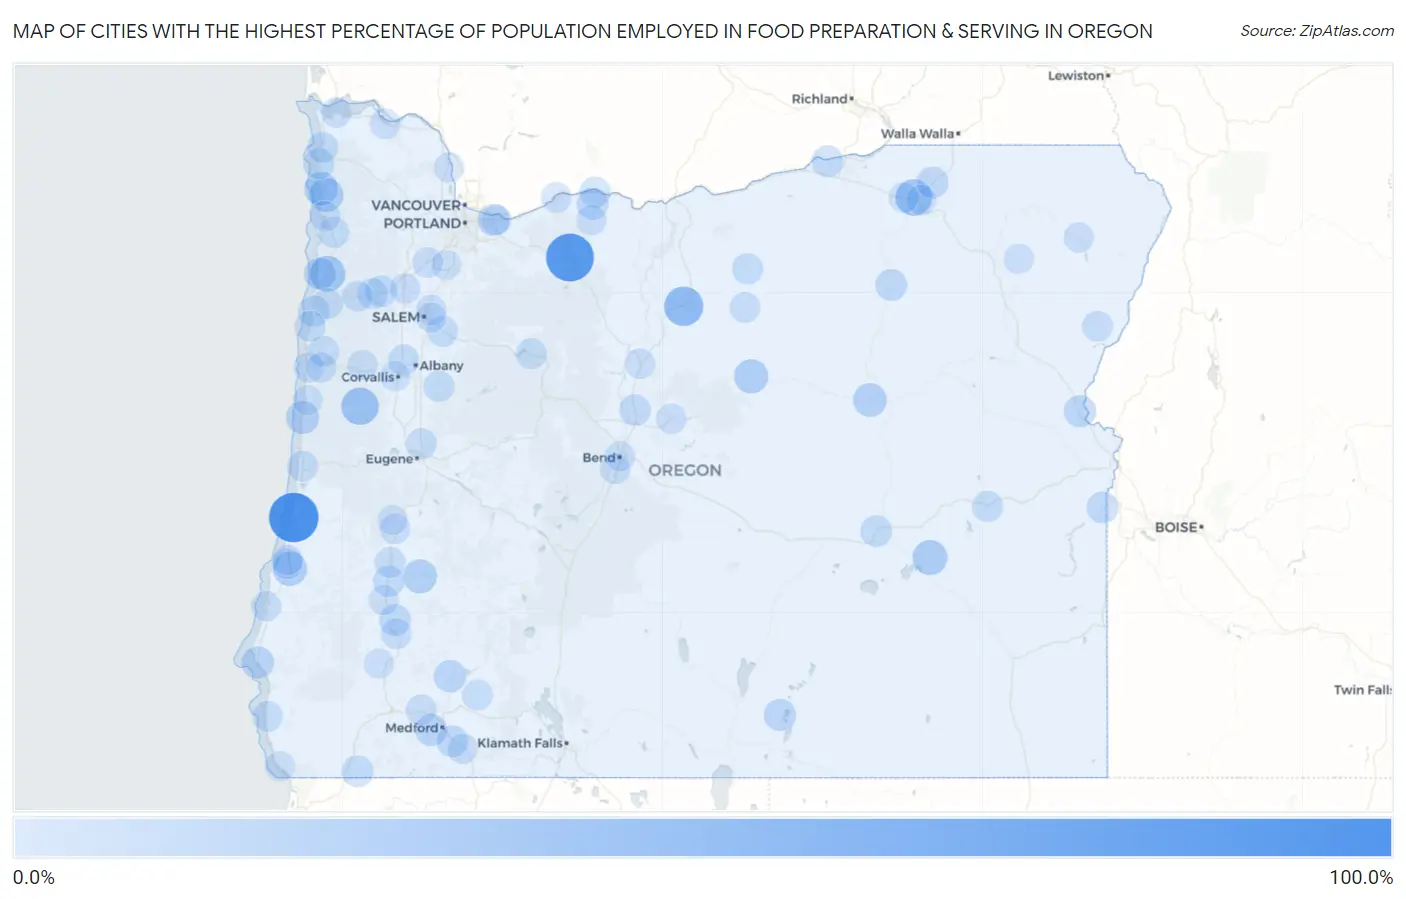
Map of Cities with the Highest Percentage of Population Employed in Food Preparation & Serving in Oregon
0.0%
100.0%
Cities with the Highest Percentage of Population Employed in Food Preparation & Serving in Oregon
| City | % Employed | vs State | vs National | |
| 1. | Winchester Bay | 100.0% | 5.9%(+94.1)#1 | 5.3%(+94.7)#2 |
| 2. | Government Camp | 91.5% | 5.9%(+85.6)#2 | 5.3%(+86.2)#34 |
| 3. | Shaniko | 50.0% | 5.9%(+44.1)#3 | 5.3%(+44.7)#116 |
| 4. | Alsea | 40.9% | 5.9%(+35.0)#4 | 5.3%(+35.6)#180 |
| 5. | Riverside | 37.3% | 5.9%(+31.4)#5 | 5.3%(+32.0)#214 |
| 6. | Barnesdale | 33.9% | 5.9%(+27.9)#6 | 5.3%(+28.6)#269 |
| 7. | Cloverdale | 33.3% | 5.9%(+27.4)#7 | 5.3%(+28.0)#273 |
| 8. | Crane | 30.0% | 5.9%(+24.1)#8 | 5.3%(+24.7)#345 |
| 9. | Bunker Hill | 26.7% | 5.9%(+20.8)#9 | 5.3%(+21.4)#444 |
| 10. | Mitchell | 26.4% | 5.9%(+20.5)#10 | 5.3%(+21.1)#454 |
| 11. | Wheeler | 26.1% | 5.9%(+20.2)#11 | 5.3%(+20.8)#465 |
| 12. | Neahkahnie | 25.2% | 5.9%(+19.3)#12 | 5.3%(+19.9)#493 |
| 13. | Glide | 25.2% | 5.9%(+19.2)#13 | 5.3%(+19.9)#496 |
| 14. | Mount Vernon | 24.0% | 5.9%(+18.1)#14 | 5.3%(+18.7)#548 |
| 15. | Neotsu | 22.0% | 5.9%(+16.0)#15 | 5.3%(+16.7)#680 |
| 16. | Yachats | 21.2% | 5.9%(+15.3)#16 | 5.3%(+15.9)#722 |
| 17. | Port Orford | 18.9% | 5.9%(+13.0)#17 | 5.3%(+13.6)#958 |
| 18. | Pacific City | 18.3% | 5.9%(+12.4)#18 | 5.3%(+13.0)#1,026 |
| 19. | Trail | 18.3% | 5.9%(+12.4)#19 | 5.3%(+13.0)#1,031 |
| 20. | Huntington | 17.3% | 5.9%(+11.4)#20 | 5.3%(+12.0)#1,167 |
| 21. | Jacksonville | 17.1% | 5.9%(+11.2)#21 | 5.3%(+11.8)#1,189 |
| 22. | Plush | 17.1% | 5.9%(+11.1)#22 | 5.3%(+11.8)#1,194 |
| 23. | Wood Village | 17.0% | 5.9%(+11.1)#23 | 5.3%(+11.7)#1,209 |
| 24. | Adams | 16.0% | 5.9%(+10.0)#24 | 5.3%(+10.7)#1,411 |
| 25. | Myrtle Creek | 15.9% | 5.9%(+9.95)#25 | 5.3%(+10.6)#1,432 |
| 26. | Ukiah | 15.2% | 5.9%(+9.29)#26 | 5.3%(+9.93)#1,574 |
| 27. | Pleasant Valley | 15.2% | 5.9%(+9.22)#27 | 5.3%(+9.87)#1,586 |
| 28. | Adrian | 15.1% | 5.9%(+9.13)#28 | 5.3%(+9.77)#1,616 |
| 29. | Talent | 15.0% | 5.9%(+9.07)#29 | 5.3%(+9.71)#1,625 |
| 30. | Elmira | 15.0% | 5.9%(+9.07)#30 | 5.3%(+9.71)#1,629 |
| 31. | Odell | 14.9% | 5.9%(+8.99)#31 | 5.3%(+9.63)#1,661 |
| 32. | Terrebonne | 14.8% | 5.9%(+8.90)#32 | 5.3%(+9.54)#1,680 |
| 33. | Takilma | 14.8% | 5.9%(+8.83)#33 | 5.3%(+9.47)#1,698 |
| 34. | Irrigon | 14.6% | 5.9%(+8.72)#34 | 5.3%(+9.36)#1,721 |
| 35. | Sheridan | 14.6% | 5.9%(+8.67)#35 | 5.3%(+9.32)#1,734 |
| 36. | Burns | 14.5% | 5.9%(+8.59)#36 | 5.3%(+9.23)#1,768 |
| 37. | Lincoln City | 14.5% | 5.9%(+8.55)#37 | 5.3%(+9.19)#1,773 |
| 38. | Green Meadows | 14.2% | 5.9%(+8.31)#38 | 5.3%(+8.95)#1,845 |
| 39. | Roseburg North | 13.5% | 5.9%(+7.53)#39 | 5.3%(+8.17)#2,079 |
| 40. | Condon | 12.8% | 5.9%(+6.89)#40 | 5.3%(+7.53)#2,338 |
| 41. | Juntura | 12.5% | 5.9%(+6.57)#41 | 5.3%(+7.21)#2,524 |
| 42. | Aumsville | 12.3% | 5.9%(+6.42)#42 | 5.3%(+7.06)#2,586 |
| 43. | Cannon Beach | 12.3% | 5.9%(+6.41)#43 | 5.3%(+7.05)#2,588 |
| 44. | San Marine | 12.1% | 5.9%(+6.21)#44 | 5.3%(+6.85)#2,682 |
| 45. | Seaside | 12.1% | 5.9%(+6.20)#45 | 5.3%(+6.84)#2,688 |
| 46. | Adair Village | 12.1% | 5.9%(+6.13)#46 | 5.3%(+6.77)#2,726 |
| 47. | Tillamook | 12.0% | 5.9%(+6.06)#47 | 5.3%(+6.70)#2,770 |
| 48. | South Lebanon | 11.9% | 5.9%(+5.97)#48 | 5.3%(+6.61)#2,828 |
| 49. | Hood River | 11.8% | 5.9%(+5.88)#49 | 5.3%(+6.52)#2,874 |
| 50. | Sutherlin | 11.6% | 5.9%(+5.70)#50 | 5.3%(+6.34)#2,986 |
| 51. | Siletz | 11.5% | 5.9%(+5.58)#51 | 5.3%(+6.22)#3,066 |
| 52. | Willamina | 11.5% | 5.9%(+5.54)#52 | 5.3%(+6.18)#3,088 |
| 53. | Rose Lodge | 11.4% | 5.9%(+5.45)#53 | 5.3%(+6.09)#3,144 |
| 54. | Florence | 11.3% | 5.9%(+5.33)#54 | 5.3%(+5.97)#3,223 |
| 55. | Coburg | 11.1% | 5.9%(+5.18)#55 | 5.3%(+5.83)#3,303 |
| 56. | Gold Hill | 11.1% | 5.9%(+5.16)#56 | 5.3%(+5.80)#3,340 |
| 57. | Idanha | 10.9% | 5.9%(+4.98)#57 | 5.3%(+5.62)#3,439 |
| 58. | Coos Bay | 10.8% | 5.9%(+4.92)#58 | 5.3%(+5.56)#3,483 |
| 59. | Lincoln Beach | 10.7% | 5.9%(+4.74)#59 | 5.3%(+5.38)#3,606 |
| 60. | Fossil | 10.5% | 5.9%(+4.54)#60 | 5.3%(+5.18)#3,750 |
| 61. | Butte Falls | 10.4% | 5.9%(+4.44)#61 | 5.3%(+5.08)#3,821 |
| 62. | Canyonville | 10.3% | 5.9%(+4.41)#62 | 5.3%(+5.05)#3,846 |
| 63. | Halfway | 10.3% | 5.9%(+4.39)#63 | 5.3%(+5.03)#3,854 |
| 64. | Gold Beach | 10.3% | 5.9%(+4.36)#64 | 5.3%(+5.00)#3,874 |
| 65. | Prineville | 10.2% | 5.9%(+4.26)#65 | 5.3%(+4.90)#3,951 |
| 66. | Dexter | 10.2% | 5.9%(+4.25)#66 | 5.3%(+4.89)#3,957 |
| 67. | Cascade Locks | 10.2% | 5.9%(+4.24)#67 | 5.3%(+4.89)#3,965 |
| 68. | Deschutes River Woods | 10.2% | 5.9%(+4.24)#68 | 5.3%(+4.88)#3,971 |
| 69. | Westport | 10.2% | 5.9%(+4.23)#69 | 5.3%(+4.87)#3,974 |
| 70. | Yoncalla | 10.1% | 5.9%(+4.18)#70 | 5.3%(+4.82)#4,011 |
| 71. | Garibaldi | 10.1% | 5.9%(+4.17)#71 | 5.3%(+4.81)#4,016 |
| 72. | Grand Ronde | 10.1% | 5.9%(+4.14)#72 | 5.3%(+4.78)#4,045 |
| 73. | Madras | 10.0% | 5.9%(+4.09)#73 | 5.3%(+4.73)#4,091 |
| 74. | Dundee | 9.8% | 5.9%(+3.90)#74 | 5.3%(+4.54)#4,245 |
| 75. | North Bend | 9.8% | 5.9%(+3.88)#75 | 5.3%(+4.52)#4,254 |
| 76. | Ashland | 9.4% | 5.9%(+3.46)#76 | 5.3%(+4.10)#4,648 |
| 77. | Mount Hood | 9.2% | 5.9%(+3.31)#77 | 5.3%(+3.95)#4,810 |
| 78. | Amity | 9.2% | 5.9%(+3.29)#78 | 5.3%(+3.93)#4,827 |
| 79. | Newport | 9.2% | 5.9%(+3.24)#79 | 5.3%(+3.88)#4,872 |
| 80. | Mission | 9.1% | 5.9%(+3.19)#80 | 5.3%(+3.84)#4,912 |
| 81. | Summit | 9.1% | 5.9%(+3.16)#81 | 5.3%(+3.80)#4,960 |
| 82. | Hayesville | 9.0% | 5.9%(+3.05)#82 | 5.3%(+3.69)#5,088 |
| 83. | Toledo | 9.0% | 5.9%(+3.03)#83 | 5.3%(+3.67)#5,122 |
| 84. | Bandon | 8.9% | 5.9%(+3.02)#84 | 5.3%(+3.66)#5,149 |
| 85. | St Helens | 8.9% | 5.9%(+2.99)#85 | 5.3%(+3.63)#5,177 |
| 86. | Astoria | 8.9% | 5.9%(+2.93)#86 | 5.3%(+3.57)#5,252 |
| 87. | Enterprise | 8.8% | 5.9%(+2.88)#87 | 5.3%(+3.52)#5,302 |
| 88. | Running Y Ranch | 8.7% | 5.9%(+2.77)#88 | 5.3%(+3.41)#5,428 |
| 89. | Bend | 8.5% | 5.9%(+2.55)#89 | 5.3%(+3.19)#5,684 |
| 90. | Butteville | 8.4% | 5.9%(+2.48)#90 | 5.3%(+3.13)#5,771 |
| 91. | Brookings | 8.3% | 5.9%(+2.37)#91 | 5.3%(+3.01)#5,938 |
| 92. | Waldport | 8.3% | 5.9%(+2.37)#92 | 5.3%(+3.01)#5,942 |
| 93. | Green | 8.3% | 5.9%(+2.33)#93 | 5.3%(+2.97)#5,994 |
| 94. | Glendale | 8.2% | 5.9%(+2.24)#94 | 5.3%(+2.88)#6,116 |
| 95. | Pendleton | 8.1% | 5.9%(+2.16)#95 | 5.3%(+2.81)#6,214 |
| 96. | Four Corners | 8.0% | 5.9%(+2.12)#96 | 5.3%(+2.76)#6,273 |
| 97. | Corvallis | 8.0% | 5.9%(+2.05)#97 | 5.3%(+2.69)#6,375 |
| 98. | Cove | 8.0% | 5.9%(+2.04)#98 | 5.3%(+2.68)#6,389 |
| 99. | Drain | 8.0% | 5.9%(+2.04)#99 | 5.3%(+2.68)#6,391 |
| 100. | Troutdale | 7.9% | 5.9%(+1.99)#100 | 5.3%(+2.64)#6,455 |
Common Questions
What are the Top 10 Cities with the Highest Percentage of Population Employed in Food Preparation & Serving in Oregon?
Top 10 Cities with the Highest Percentage of Population Employed in Food Preparation & Serving in Oregon are:
#1
100.0%
#2
91.5%
#3
50.0%
#4
40.9%
#5
37.3%
#6
33.3%
#7
30.0%
#8
26.7%
#9
26.4%
#10
26.1%
What city has the Highest Percentage of Population Employed in Food Preparation & Serving in Oregon?
Winchester Bay has the Highest Percentage of Population Employed in Food Preparation & Serving in Oregon with 100.0%.
What is the Percentage of Population Employed in Food Preparation & Serving in the State of Oregon?
Percentage of Population Employed in Food Preparation & Serving in Oregon is 5.9%.
What is the Percentage of Population Employed in Food Preparation & Serving in the United States?
Percentage of Population Employed in Food Preparation & Serving in the United States is 5.3%.