Cities with the Highest Percentage of Population Employed in Food Preparation & Serving in New Hampshire
RELATED REPORTS & OPTIONS
Food Preparation & Serving
New Hampshire
Compare Cities
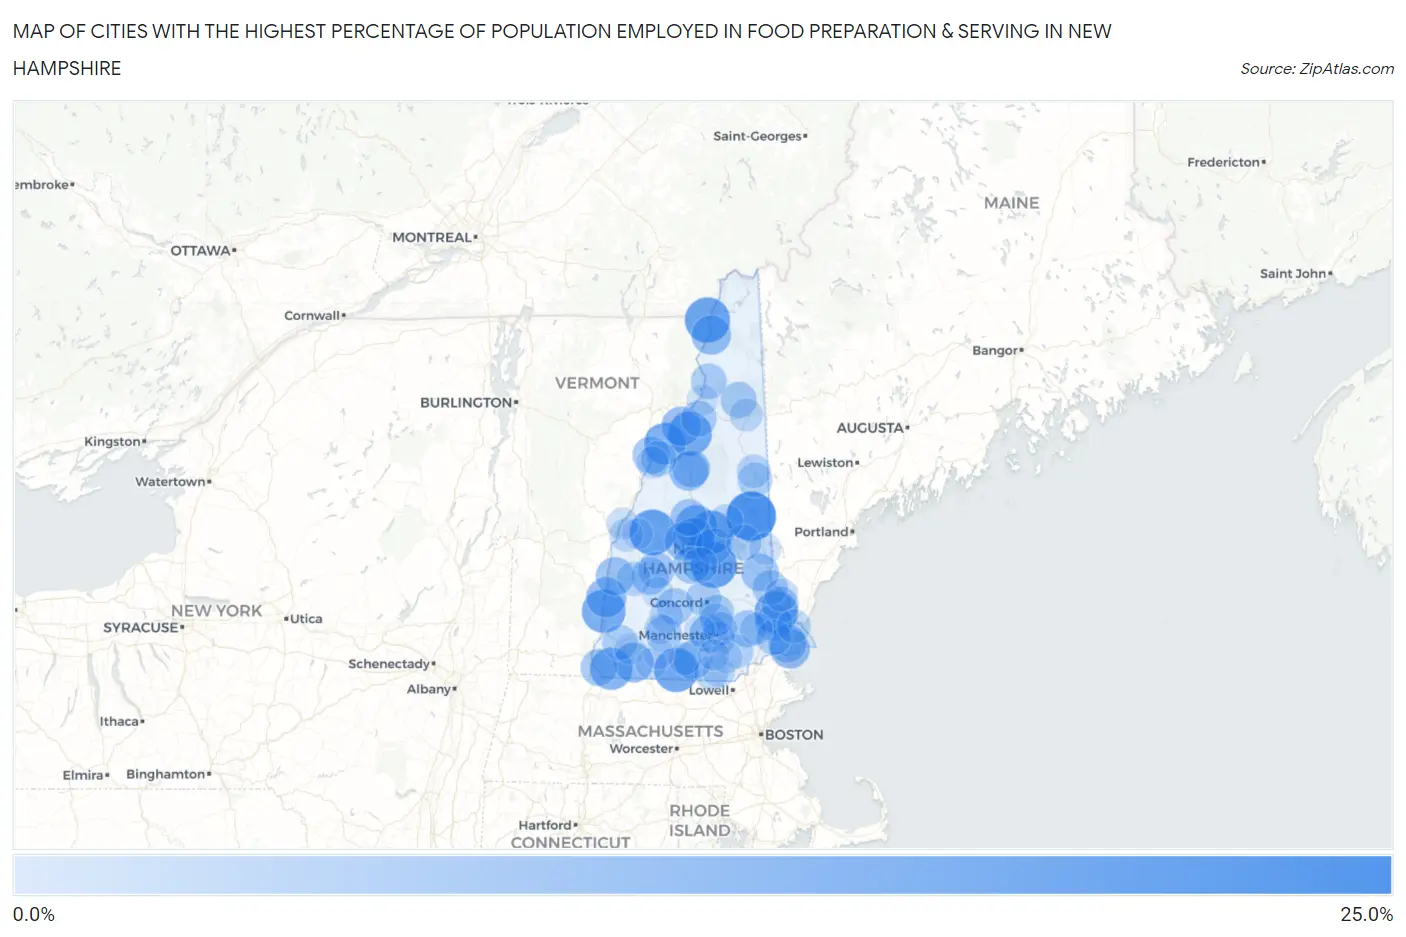
Map of Cities with the Highest Percentage of Population Employed in Food Preparation & Serving in New Hampshire
0.0%
25.0%
Cities with the Highest Percentage of Population Employed in Food Preparation & Serving in New Hampshire
| City | % Employed | vs State | vs National | |
| 1. | Center Ossipee | 23.3% | 5.2%(+18.1)#1 | 5.3%(+18.0)#598 |
| 2. | Belmont | 19.1% | 5.2%(+13.9)#2 | 5.3%(+13.8)#937 |
| 3. | Canaan | 18.6% | 5.2%(+13.5)#3 | 5.3%(+13.4)#990 |
| 4. | West Stewartstown | 18.1% | 5.2%(+12.9)#4 | 5.3%(+12.8)#1,057 |
| 5. | Greenville | 17.0% | 5.2%(+11.8)#5 | 5.3%(+11.7)#1,213 |
| 6. | Meredith | 16.4% | 5.2%(+11.2)#6 | 5.3%(+11.1)#1,310 |
| 7. | Bethlehem | 16.3% | 5.2%(+11.1)#7 | 5.3%(+11.0)#1,332 |
| 8. | North Walpole | 16.1% | 5.2%(+10.9)#8 | 5.3%(+10.8)#1,381 |
| 9. | Durham | 15.9% | 5.2%(+10.7)#9 | 5.3%(+10.6)#1,431 |
| 10. | Ashland | 14.4% | 5.2%(+9.22)#10 | 5.3%(+9.12)#1,790 |
| 11. | Winchester | 14.3% | 5.2%(+9.14)#11 | 5.3%(+9.05)#1,806 |
| 12. | New Hampton | 13.9% | 5.2%(+8.71)#12 | 5.3%(+8.62)#1,937 |
| 13. | Lisbon | 13.7% | 5.2%(+8.47)#13 | 5.3%(+8.37)#2,018 |
| 14. | Charlestown | 11.9% | 5.2%(+6.68)#14 | 5.3%(+6.58)#2,839 |
| 15. | Troy | 11.7% | 5.2%(+6.47)#15 | 5.3%(+6.38)#2,966 |
| 16. | Littleton | 11.2% | 5.2%(+6.04)#16 | 5.3%(+5.95)#3,244 |
| 17. | Hampton Beach | 11.2% | 5.2%(+5.99)#17 | 5.3%(+5.89)#3,277 |
| 18. | Colebrook | 11.0% | 5.2%(+5.83)#18 | 5.3%(+5.73)#3,382 |
| 19. | North Woodstock | 10.3% | 5.2%(+5.09)#19 | 5.3%(+5.00)#3,875 |
| 20. | Milford | 10.0% | 5.2%(+4.77)#20 | 5.3%(+4.68)#4,143 |
| 21. | Bristol | 9.8% | 5.2%(+4.65)#21 | 5.3%(+4.56)#4,227 |
| 22. | Claremont | 9.8% | 5.2%(+4.64)#22 | 5.3%(+4.54)#4,243 |
| 23. | Pinardville | 9.6% | 5.2%(+4.41)#23 | 5.3%(+4.31)#4,447 |
| 24. | Hampton | 9.2% | 5.2%(+4.03)#24 | 5.3%(+3.93)#4,823 |
| 25. | Farmington | 8.8% | 5.2%(+3.64)#25 | 5.3%(+3.54)#5,276 |
| 26. | Lincoln | 8.8% | 5.2%(+3.62)#26 | 5.3%(+3.53)#5,300 |
| 27. | Woodsville | 8.7% | 5.2%(+3.52)#27 | 5.3%(+3.42)#5,414 |
| 28. | Blodgett Landing | 8.3% | 5.2%(+3.14)#28 | 5.3%(+3.05)#5,893 |
| 29. | Newmarket | 8.3% | 5.2%(+3.07)#29 | 5.3%(+2.97)#5,987 |
| 30. | Franklin | 8.2% | 5.2%(+3.05)#30 | 5.3%(+2.95)#6,010 |
| 31. | Raymond | 8.1% | 5.2%(+2.90)#31 | 5.3%(+2.81)#6,208 |
| 32. | Plymouth | 8.0% | 5.2%(+2.78)#32 | 5.3%(+2.69)#6,370 |
| 33. | Dover | 7.9% | 5.2%(+2.70)#33 | 5.3%(+2.60)#6,506 |
| 34. | Hinsdale | 7.8% | 5.2%(+2.63)#34 | 5.3%(+2.53)#6,629 |
| 35. | New London | 7.6% | 5.2%(+2.42)#35 | 5.3%(+2.33)#6,973 |
| 36. | Henniker | 7.4% | 5.2%(+2.25)#36 | 5.3%(+2.16)#7,221 |
| 37. | Bennington | 7.4% | 5.2%(+2.18)#37 | 5.3%(+2.09)#7,321 |
| 38. | Berlin | 7.2% | 5.2%(+2.03)#38 | 5.3%(+1.94)#7,578 |
| 39. | Laconia | 7.0% | 5.2%(+1.85)#39 | 5.3%(+1.76)#7,922 |
| 40. | Whitefield | 6.6% | 5.2%(+1.42)#40 | 5.3%(+1.33)#8,813 |
| 41. | Groveton | 6.6% | 5.2%(+1.39)#41 | 5.3%(+1.30)#8,903 |
| 42. | Concord | 6.4% | 5.2%(+1.23)#42 | 5.3%(+1.14)#9,278 |
| 43. | Mountain Lakes | 6.4% | 5.2%(+1.23)#43 | 5.3%(+1.13)#9,300 |
| 44. | Wolfeboro | 6.4% | 5.2%(+1.19)#44 | 5.3%(+1.10)#9,358 |
| 45. | Tilton Northfield | 6.3% | 5.2%(+1.16)#45 | 5.3%(+1.06)#9,446 |
| 46. | Suncook | 6.3% | 5.2%(+1.12)#46 | 5.3%(+1.03)#9,521 |
| 47. | Rochester | 6.3% | 5.2%(+1.07)#47 | 5.3%(+0.979)#9,626 |
| 48. | Keene | 6.1% | 5.2%(+0.913)#48 | 5.3%(+0.820)#10,067 |
| 49. | Exeter | 6.0% | 5.2%(+0.834)#49 | 5.3%(+0.740)#10,272 |
| 50. | Manchester | 5.9% | 5.2%(+0.679)#50 | 5.3%(+0.586)#10,632 |
| 51. | Conway | 5.6% | 5.2%(+0.401)#51 | 5.3%(+0.307)#11,390 |
| 52. | Francestown | 5.5% | 5.2%(+0.262)#52 | 5.3%(+0.168)#11,744 |
| 53. | Nashua | 5.1% | 5.2%(-0.092)#53 | 5.3%(-0.185)#12,736 |
| 54. | Derry | 5.0% | 5.2%(-0.172)#54 | 5.3%(-0.266)#12,958 |
| 55. | South Hooksett | 4.9% | 5.2%(-0.337)#55 | 5.3%(-0.431)#13,460 |
| 56. | Newport | 4.8% | 5.2%(-0.431)#56 | 5.3%(-0.524)#13,711 |
| 57. | Portsmouth | 4.7% | 5.2%(-0.515)#57 | 5.3%(-0.609)#13,970 |
| 58. | Suissevale | 4.5% | 5.2%(-0.693)#58 | 5.3%(-0.786)#14,460 |
| 59. | North Conway | 4.4% | 5.2%(-0.798)#59 | 5.3%(-0.891)#14,765 |
| 60. | Hillsborough | 4.0% | 5.2%(-1.21)#60 | 5.3%(-1.30)#16,029 |
| 61. | Lebanon | 4.0% | 5.2%(-1.24)#61 | 5.3%(-1.33)#16,124 |
| 62. | Hooksett | 3.9% | 5.2%(-1.28)#62 | 5.3%(-1.37)#16,250 |
| 63. | Somersworth | 3.8% | 5.2%(-1.37)#63 | 5.3%(-1.46)#16,550 |
| 64. | Gorham | 3.6% | 5.2%(-1.61)#64 | 5.3%(-1.70)#17,276 |
| 65. | Wilton | 3.3% | 5.2%(-1.94)#65 | 5.3%(-2.04)#18,273 |
| 66. | Epping | 3.1% | 5.2%(-2.07)#66 | 5.3%(-2.17)#18,652 |
| 67. | Hudson | 2.8% | 5.2%(-2.35)#67 | 5.3%(-2.44)#19,409 |
| 68. | Hanover | 2.8% | 5.2%(-2.42)#68 | 5.3%(-2.51)#19,597 |
| 69. | Sanbornville | 2.7% | 5.2%(-2.53)#69 | 5.3%(-2.62)#19,878 |
| 70. | North Haverhill | 2.6% | 5.2%(-2.55)#70 | 5.3%(-2.65)#19,956 |
| 71. | Londonderry | 2.6% | 5.2%(-2.63)#71 | 5.3%(-2.72)#20,176 |
| 72. | Marlborough | 1.9% | 5.2%(-3.32)#72 | 5.3%(-3.41)#21,990 |
| 73. | Goffstown | 1.8% | 5.2%(-3.35)#73 | 5.3%(-3.44)#22,072 |
| 74. | Lancaster | 1.8% | 5.2%(-3.38)#74 | 5.3%(-3.48)#22,153 |
| 75. | Bradford | 1.7% | 5.2%(-3.49)#75 | 5.3%(-3.58)#22,410 |
| 76. | Jaffrey | 1.6% | 5.2%(-3.64)#76 | 5.3%(-3.73)#22,715 |
| 77. | East Merrimack | 1.5% | 5.2%(-3.67)#77 | 5.3%(-3.76)#22,779 |
| 78. | Antrim | 1.5% | 5.2%(-3.69)#78 | 5.3%(-3.78)#22,826 |
| 79. | Peterborough | 1.2% | 5.2%(-3.98)#79 | 5.3%(-4.07)#23,377 |
| 80. | Enfield | 1.0% | 5.2%(-4.17)#80 | 5.3%(-4.26)#23,703 |
| 81. | Klondike Corner | 0.66% | 5.2%(-4.53)#81 | 5.3%(-4.63)#24,194 |
1
Common Questions
What are the Top 10 Cities with the Highest Percentage of Population Employed in Food Preparation & Serving in New Hampshire?
Top 10 Cities with the Highest Percentage of Population Employed in Food Preparation & Serving in New Hampshire are:
#1
23.3%
#2
19.1%
#3
18.6%
#4
18.1%
#5
17.0%
#6
16.4%
#7
16.3%
#8
16.1%
#9
15.9%
#10
14.4%
What city has the Highest Percentage of Population Employed in Food Preparation & Serving in New Hampshire?
Center Ossipee has the Highest Percentage of Population Employed in Food Preparation & Serving in New Hampshire with 23.3%.
What is the Percentage of Population Employed in Food Preparation & Serving in the State of New Hampshire?
Percentage of Population Employed in Food Preparation & Serving in New Hampshire is 5.2%.
What is the Percentage of Population Employed in Food Preparation & Serving in the United States?
Percentage of Population Employed in Food Preparation & Serving in the United States is 5.3%.