Ripley, CA Map & Demographics
Ripley Map
Ripley Overview
$10,545
PER CAPITA INCOME
$28,705
AVG FAMILY INCOME
$27,932
AVG HOUSEHOLD INCOME
0.28
INEQUALITY / GINI INDEX
614
TOTAL POPULATION
279
MALE POPULATION
335
FEMALE POPULATION
83.28
MALES / 100 FEMALES
120.07
FEMALES / 100 MALES
27.7
MEDIAN AGE
3.3
AVG FAMILY SIZE
3.0
AVG HOUSEHOLD SIZE
135
LABOR FORCE [ PEOPLE ]
33.2%
PERCENT IN LABOR FORCE
12.6%
UNEMPLOYMENT RATE
Ripley Area Codes
Income in Ripley
Income Overview in Ripley
Per Capita Income in Ripley is $10,545, while median incomes of families and households are $28,705 and $27,932 respectively.
| Characteristic | Number | Measure |
| Per Capita Income | 614 | $10,545 |
| Median Family Income | 167 | $28,705 |
| Mean Family Income | 167 | $33,771 |
| Median Household Income | 201 | $27,932 |
| Mean Household Income | 201 | $32,428 |
| Income Deficit | 167 | $0 |
| Wage / Income Gap (%) | 614 | 0.00% |
| Wage / Income Gap ($) | 614 | 100.00¢ per $1 |
| Gini / Inequality Index | 614 | 0.28 |
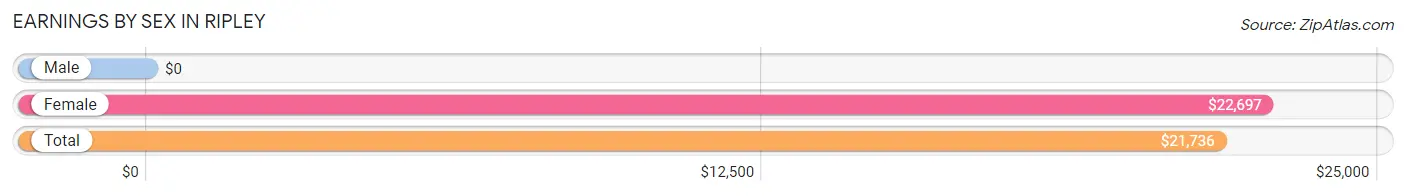
Earnings by Sex in Ripley
| Sex | Number | Average Earnings |
| Male | 56 (41.5%) | $0 |
| Female | 79 (58.5%) | $22,697 |
| Total | 135 (100.0%) | $21,736 |
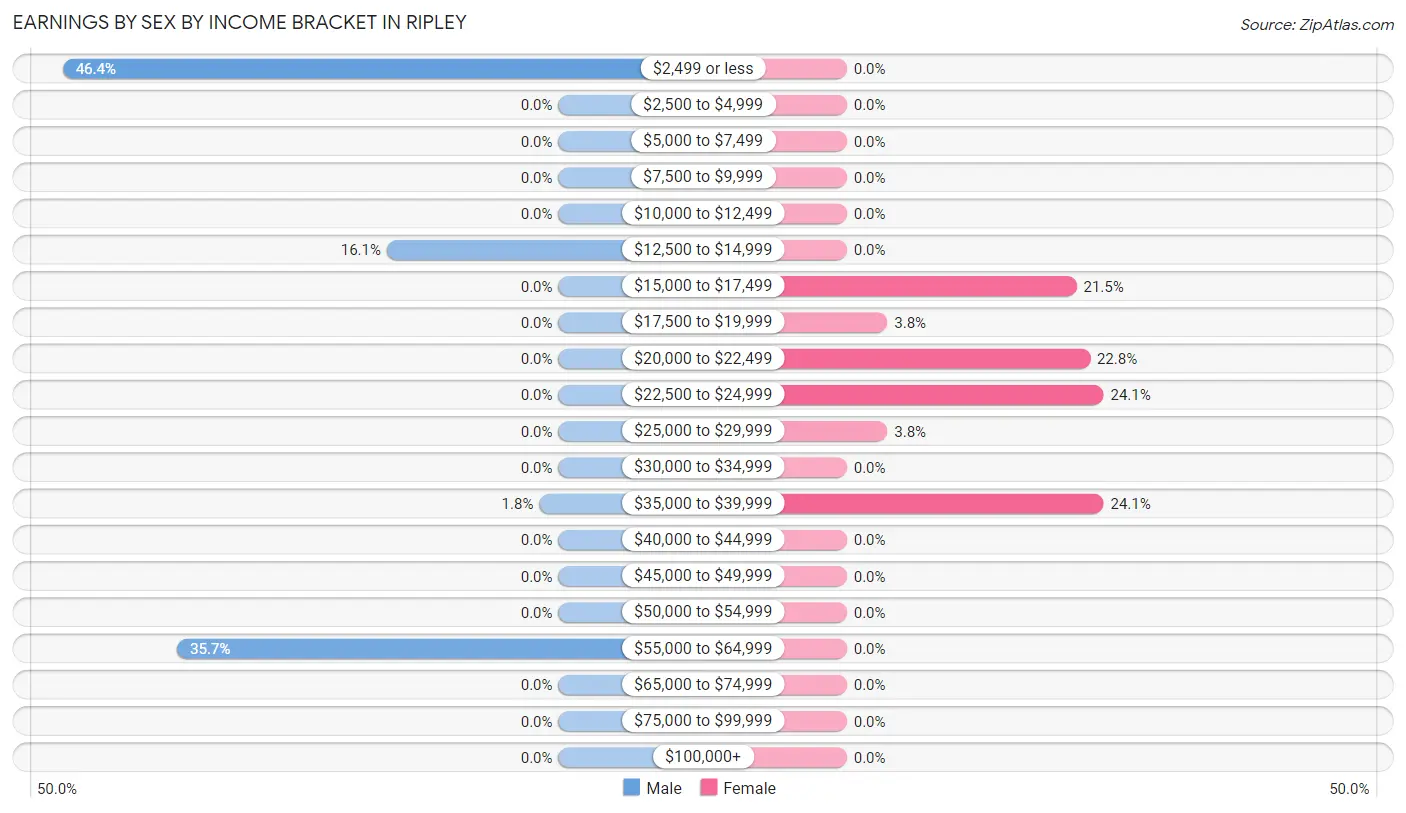
Earnings by Sex by Income Bracket in Ripley
The most common earnings brackets in Ripley are $2,499 or less for men (26 | 46.4%) and $22,500 to $24,999 for women (19 | 24.0%).
| Income | Male | Female |
| $2,499 or less | 26 (46.4%) | 0 (0.0%) |
| $2,500 to $4,999 | 0 (0.0%) | 0 (0.0%) |
| $5,000 to $7,499 | 0 (0.0%) | 0 (0.0%) |
| $7,500 to $9,999 | 0 (0.0%) | 0 (0.0%) |
| $10,000 to $12,499 | 0 (0.0%) | 0 (0.0%) |
| $12,500 to $14,999 | 9 (16.1%) | 0 (0.0%) |
| $15,000 to $17,499 | 0 (0.0%) | 17 (21.5%) |
| $17,500 to $19,999 | 0 (0.0%) | 3 (3.8%) |
| $20,000 to $22,499 | 0 (0.0%) | 18 (22.8%) |
| $22,500 to $24,999 | 0 (0.0%) | 19 (24.0%) |
| $25,000 to $29,999 | 0 (0.0%) | 3 (3.8%) |
| $30,000 to $34,999 | 0 (0.0%) | 0 (0.0%) |
| $35,000 to $39,999 | 1 (1.8%) | 19 (24.0%) |
| $40,000 to $44,999 | 0 (0.0%) | 0 (0.0%) |
| $45,000 to $49,999 | 0 (0.0%) | 0 (0.0%) |
| $50,000 to $54,999 | 0 (0.0%) | 0 (0.0%) |
| $55,000 to $64,999 | 20 (35.7%) | 0 (0.0%) |
| $65,000 to $74,999 | 0 (0.0%) | 0 (0.0%) |
| $75,000 to $99,999 | 0 (0.0%) | 0 (0.0%) |
| $100,000+ | 0 (0.0%) | 0 (0.0%) |
| Total | 56 (100.0%) | 79 (100.0%) |
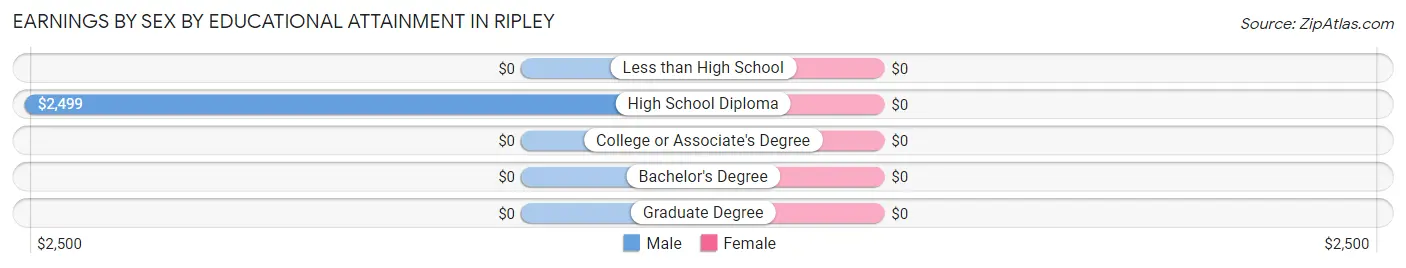
Earnings by Sex by Educational Attainment in Ripley
| Educational Attainment | Male Income | Female Income |
| Less than High School | - | - |
| High School Diploma | $2,499 | $0 |
| College or Associate's Degree | - | - |
| Bachelor's Degree | - | - |
| Graduate Degree | - | - |
| Total | - | - |
Family Income in Ripley
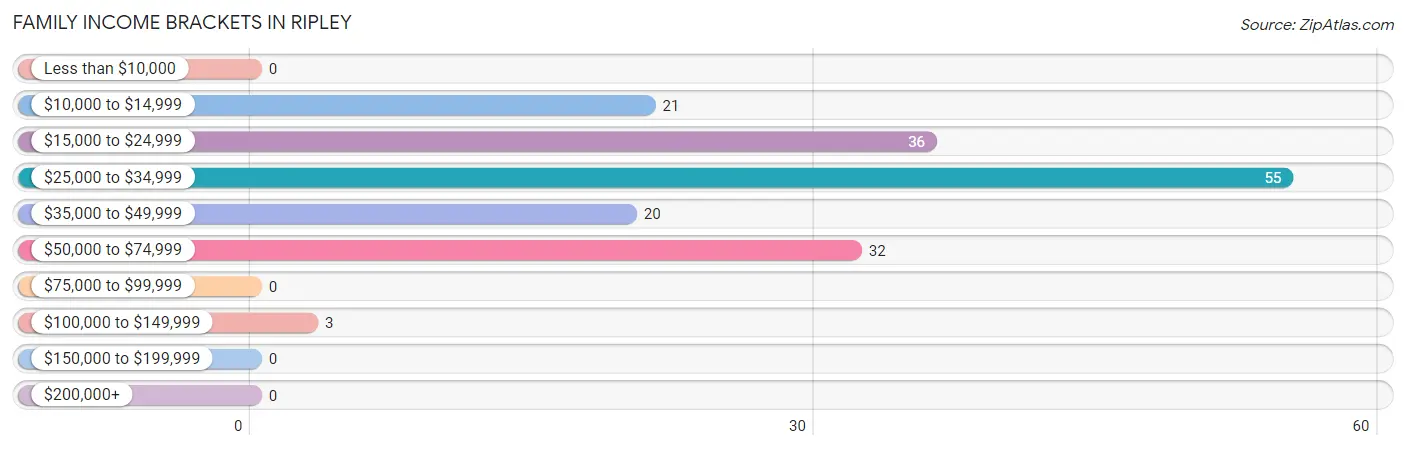
Family Income Brackets in Ripley
According to the Ripley family income data, there are 55 families falling into the $25,000 to $34,999 income range, which is the most common income bracket and makes up 32.9% of all families.
| Income Bracket | # Families | % Families |
| Less than $10,000 | 0 | 0.0% |
| $10,000 to $14,999 | 21 | 12.6% |
| $15,000 to $24,999 | 36 | 21.6% |
| $25,000 to $34,999 | 55 | 32.9% |
| $35,000 to $49,999 | 20 | 12.0% |
| $50,000 to $74,999 | 32 | 19.2% |
| $75,000 to $99,999 | 0 | 0.0% |
| $100,000 to $149,999 | 3 | 1.8% |
| $150,000 to $199,999 | 0 | 0.0% |
| $200,000+ | 0 | 0.0% |
Family Income by Famaliy Size in Ripley
| Income Bracket | # Families | Median Income |
| 2-Person Families | 73 (43.7%) | $0 |
| 3-Person Families | 39 (23.4%) | $0 |
| 4-Person Families | 0 (0.0%) | $0 |
| 5-Person Families | 47 (28.1%) | $0 |
| 6-Person Families | 0 (0.0%) | $0 |
| 7+ Person Families | 8 (4.8%) | $0 |
| Total | 167 (100.0%) | $28,705 |
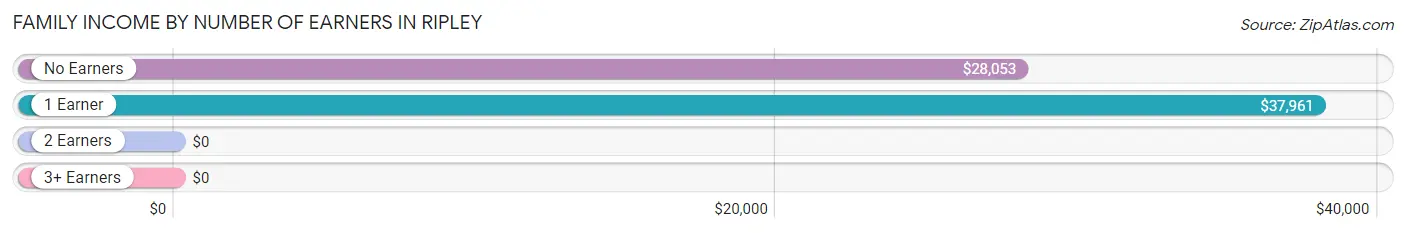
Family Income by Number of Earners in Ripley
| Number of Earners | # Families | Median Income |
| No Earners | 81 (48.5%) | $28,053 |
| 1 Earner | 71 (42.5%) | $37,961 |
| 2 Earners | 15 (9.0%) | $0 |
| 3+ Earners | 0 (0.0%) | $0 |
| Total | 167 (100.0%) | $28,705 |
Household Income in Ripley
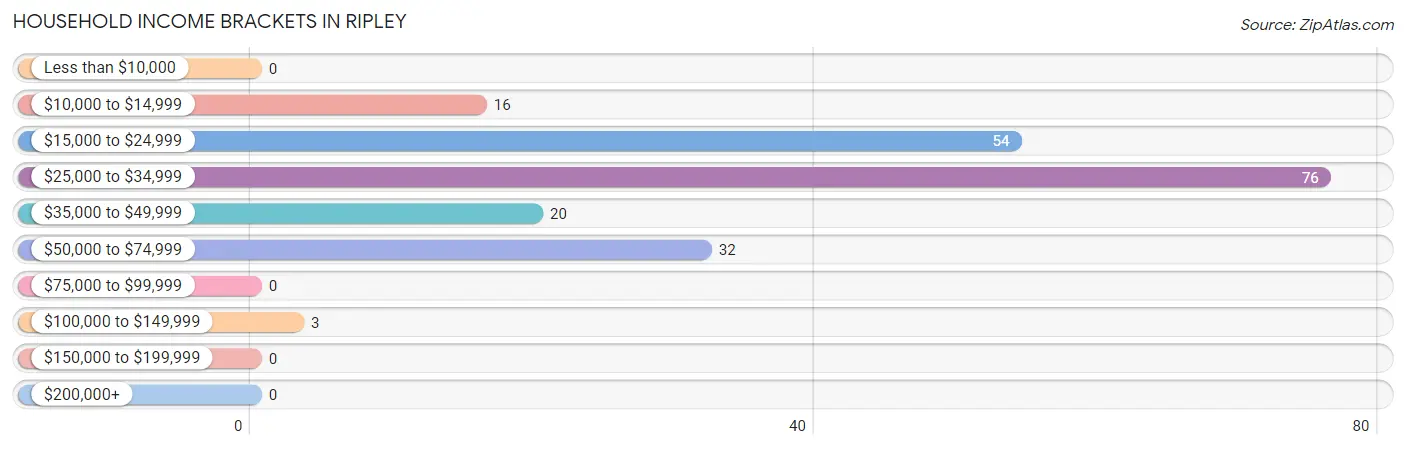
Household Income Brackets in Ripley
With 76 households falling in the category, the $25,000 to $34,999 income range is the most frequent in Ripley, accounting for 37.8% of all households.
| Income Bracket | # Households | % Households |
| Less than $10,000 | 0 | 0.0% |
| $10,000 to $14,999 | 16 | 8.0% |
| $15,000 to $24,999 | 54 | 26.9% |
| $25,000 to $34,999 | 76 | 37.8% |
| $35,000 to $49,999 | 20 | 10.0% |
| $50,000 to $74,999 | 32 | 15.9% |
| $75,000 to $99,999 | 0 | 0.0% |
| $100,000 to $149,999 | 3 | 1.5% |
| $150,000 to $199,999 | 0 | 0.0% |
| $200,000+ | 0 | 0.0% |
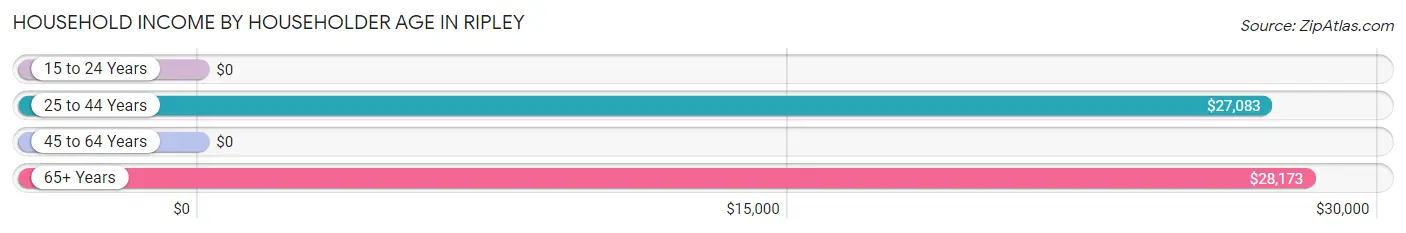
Household Income by Householder Age in Ripley
The median household income in Ripley is $27,932, with the highest median household income of $28,173 found in the 65+ years age bracket for the primary householder. A total of 106 households (52.7%) fall into this category. Meanwhile, the 15 to 24 years age bracket for the primary householder has the lowest median household income of $0, with 6 households (3.0%) in this group.
| Income Bracket | # Households | Median Income |
| 15 to 24 Years | 6 (3.0%) | $0 |
| 25 to 44 Years | 51 (25.4%) | $27,083 |
| 45 to 64 Years | 38 (18.9%) | $0 |
| 65+ Years | 106 (52.7%) | $28,173 |
| Total | 201 (100.0%) | $27,932 |
Poverty in Ripley
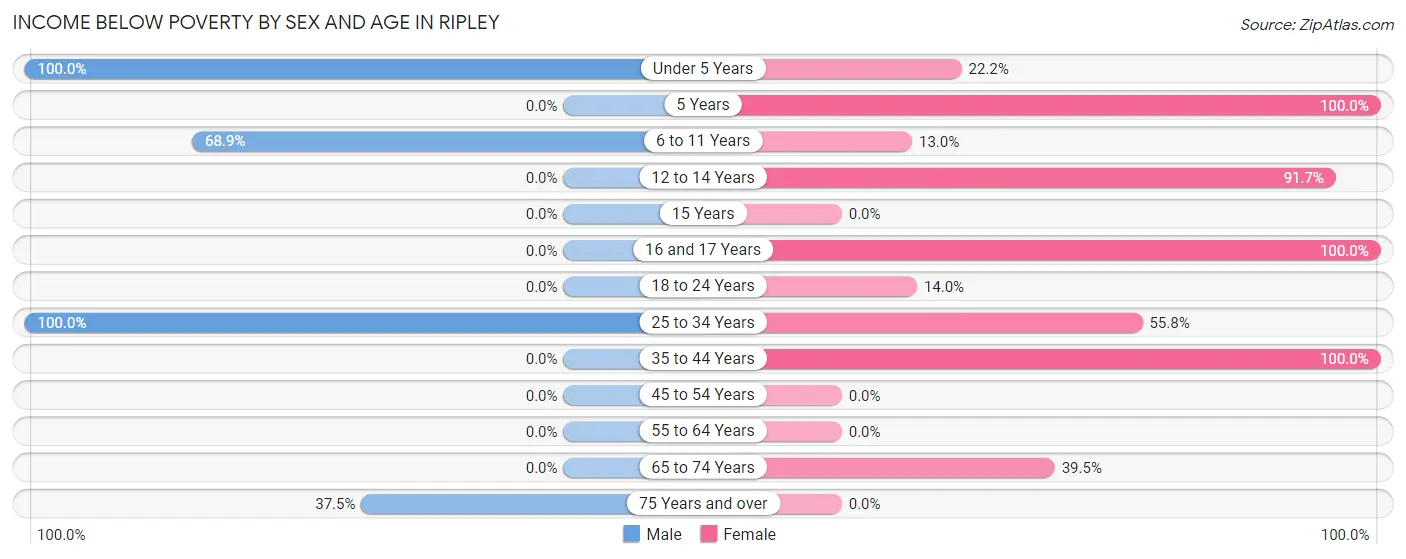
Income Below Poverty by Sex and Age in Ripley
With 60.6% poverty level for males and 38.6% for females among the residents of Ripley, under 5 year old males and 5 year old females are the most vulnerable to poverty, with 38 males (100.0%) and 29 females (100.0%) in their respective age groups living below the poverty level.
| Age Bracket | Male | Female |
| Under 5 Years | 38 (100.0%) | 6 (22.2%) |
| 5 Years | 0 (0.0%) | 29 (100.0%) |
| 6 to 11 Years | 51 (68.9%) | 3 (13.0%) |
| 12 to 14 Years | 0 (0.0%) | 11 (91.7%) |
| 15 Years | 0 (0.0%) | 0 (0.0%) |
| 16 and 17 Years | 0 (0.0%) | 8 (100.0%) |
| 18 to 24 Years | 0 (0.0%) | 6 (14.0%) |
| 25 to 34 Years | 59 (100.0%) | 24 (55.8%) |
| 35 to 44 Years | 0 (0.0%) | 8 (100.0%) |
| 45 to 54 Years | 0 (0.0%) | 0 (0.0%) |
| 55 to 64 Years | 0 (0.0%) | 0 (0.0%) |
| 65 to 74 Years | 0 (0.0%) | 34 (39.5%) |
| 75 Years and over | 21 (37.5%) | 0 (0.0%) |
| Total | 169 (60.6%) | 129 (38.6%) |
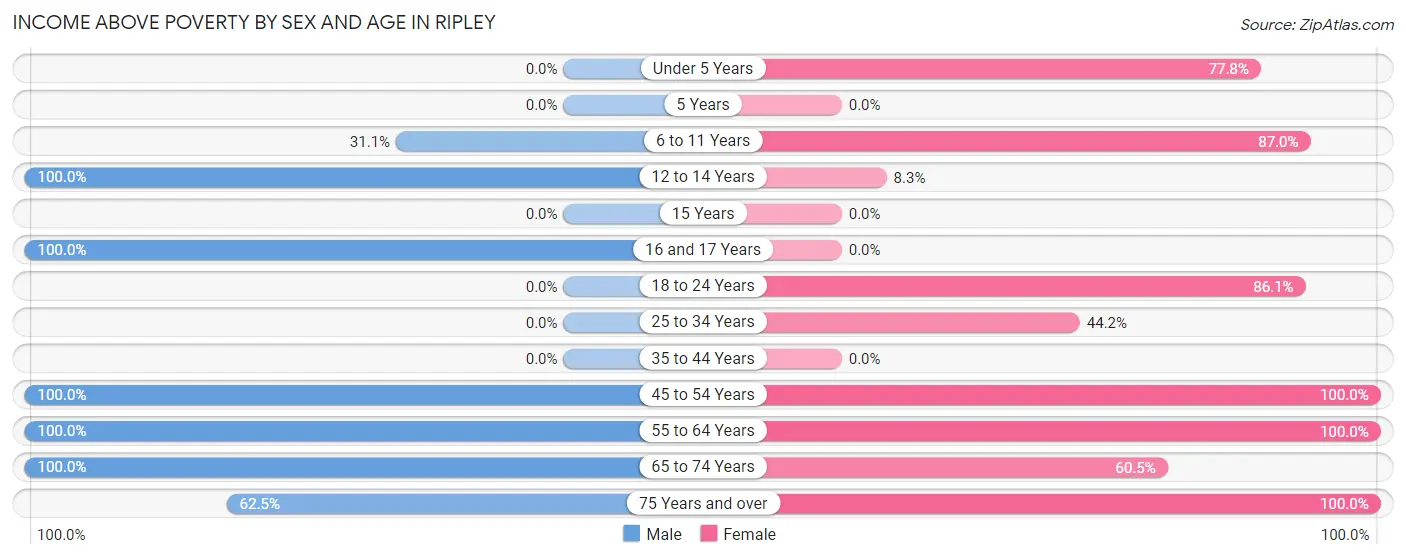
Income Above Poverty by Sex and Age in Ripley
According to the poverty statistics in Ripley, males aged 12 to 14 years and females aged 45 to 54 years are the age groups that are most secure financially, with 100.0% of males and 100.0% of females in these age groups living above the poverty line.
| Age Bracket | Male | Female |
| Under 5 Years | 0 (0.0%) | 21 (77.8%) |
| 5 Years | 0 (0.0%) | 0 (0.0%) |
| 6 to 11 Years | 23 (31.1%) | 20 (87.0%) |
| 12 to 14 Years | 4 (100.0%) | 1 (8.3%) |
| 15 Years | 0 (0.0%) | 0 (0.0%) |
| 16 and 17 Years | 23 (100.0%) | 0 (0.0%) |
| 18 to 24 Years | 0 (0.0%) | 37 (86.1%) |
| 25 to 34 Years | 0 (0.0%) | 19 (44.2%) |
| 35 to 44 Years | 0 (0.0%) | 0 (0.0%) |
| 45 to 54 Years | 1 (100.0%) | 17 (100.0%) |
| 55 to 64 Years | 20 (100.0%) | 23 (100.0%) |
| 65 to 74 Years | 4 (100.0%) | 52 (60.5%) |
| 75 Years and over | 35 (62.5%) | 15 (100.0%) |
| Total | 110 (39.4%) | 205 (61.4%) |
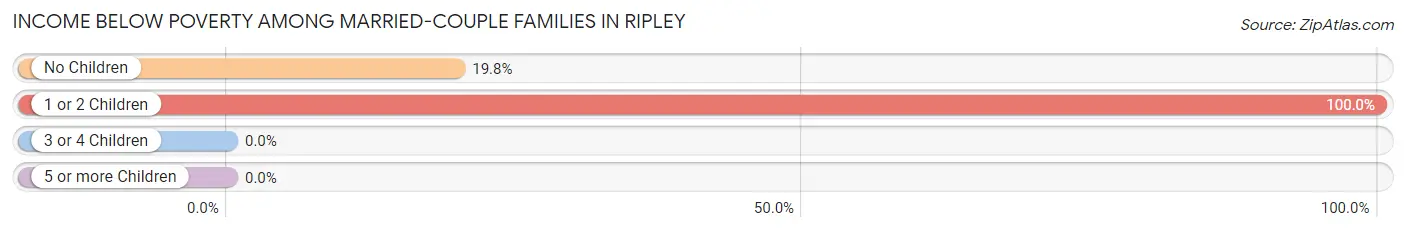
Income Below Poverty Among Married-Couple Families in Ripley
The poverty statistics for married-couple families in Ripley show that 23.8% or 24 of the total 101 families live below the poverty line. Families with 1 or 2 children have the highest poverty rate of 100.0%, comprising of 6 families. On the other hand, families with 3 or 4 children have the lowest poverty rate of 0.0%, which includes 0 families.
| Children | Above Poverty | Below Poverty |
| No Children | 73 (80.2%) | 18 (19.8%) |
| 1 or 2 Children | 0 (0.0%) | 6 (100.0%) |
| 3 or 4 Children | 4 (100.0%) | 0 (0.0%) |
| 5 or more Children | 0 (0.0%) | 0 (0.0%) |
| Total | 77 (76.2%) | 24 (23.8%) |
Income Below Poverty Among Single-Parent Households in Ripley
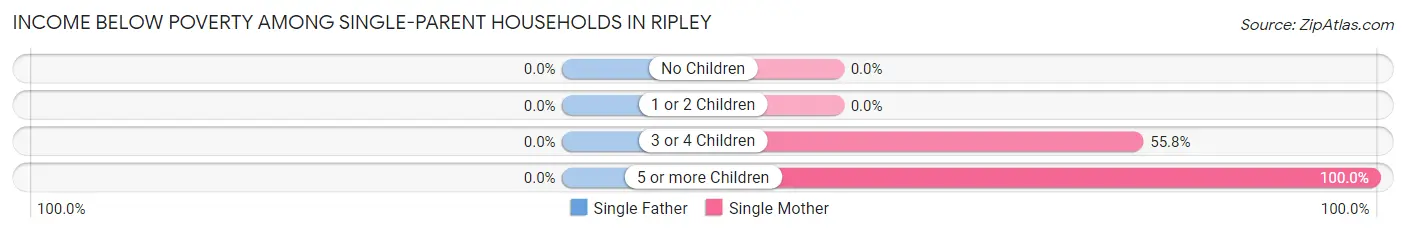
| Children | Single Father | Single Mother |
| No Children | 0 (0.0%) | 0 (0.0%) |
| 1 or 2 Children | 0 (0.0%) | 0 (0.0%) |
| 3 or 4 Children | 0 (0.0%) | 24 (55.8%) |
| 5 or more Children | 0 (0.0%) | 8 (100.0%) |
| Total | 0 (0.0%) | 32 (48.5%) |
Income Below Poverty Among Married-Couple vs Single-Parent Households in Ripley
The poverty data for Ripley shows that 24 of the married-couple family households (23.8%) and 32 of the single-parent households (48.5%) are living below the poverty level. Within the married-couple family households, those with 1 or 2 children have the highest poverty rate, with 6 households (100.0%) falling below the poverty line. Among the single-parent households, those with 5 or more children have the highest poverty rate, with 8 household (100.0%) living below poverty.
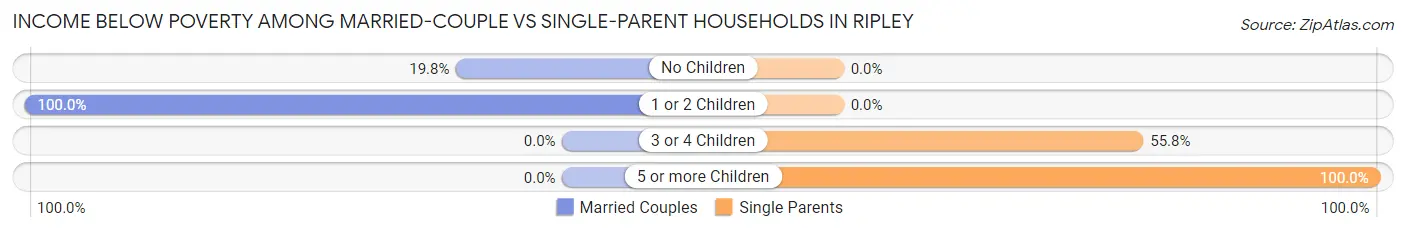
| Children | Married-Couple Families | Single-Parent Households |
| No Children | 18 (19.8%) | 0 (0.0%) |
| 1 or 2 Children | 6 (100.0%) | 0 (0.0%) |
| 3 or 4 Children | 0 (0.0%) | 24 (55.8%) |
| 5 or more Children | 0 (0.0%) | 8 (100.0%) |
| Total | 24 (23.8%) | 32 (48.5%) |
Race in Ripley
The most populous races in Ripley are Hispanic or Latino (481 | 78.3%), Some other Race (390 | 63.5%), and Black / African American (140 | 22.8%).
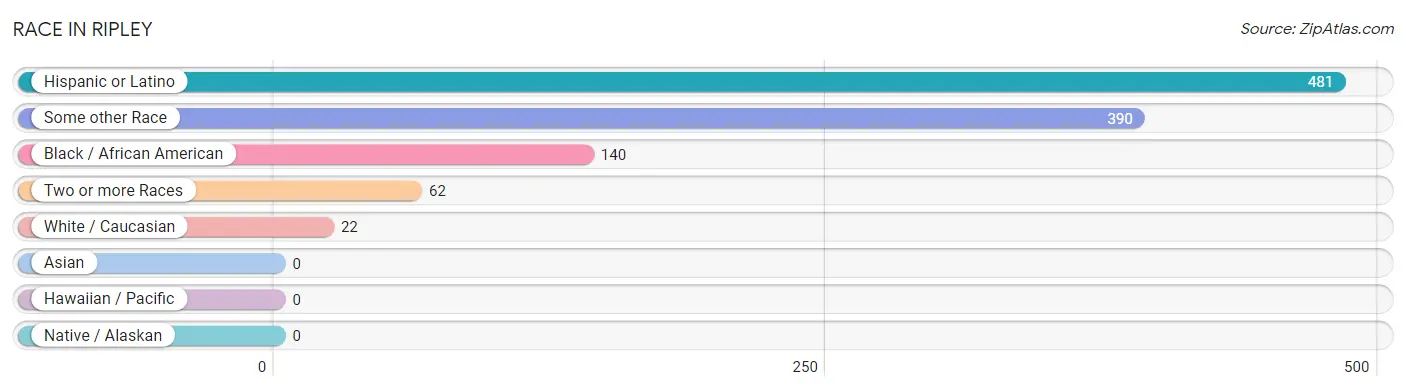
| Race | # Population | % Population |
| Asian | 0 | 0.0% |
| Black / African American | 140 | 22.8% |
| Hawaiian / Pacific | 0 | 0.0% |
| Hispanic or Latino | 481 | 78.3% |
| Native / Alaskan | 0 | 0.0% |
| White / Caucasian | 22 | 3.6% |
| Two or more Races | 62 | 10.1% |
| Some other Race | 390 | 63.5% |
| Total | 614 | 100.0% |
Ancestry in Ripley
The most populous ancestries reported in Ripley are Mexican (481 | 78.3%), African (123 | 20.0%), and Subsaharan African (123 | 20.0%), together accounting for 118.4% of all Ripley residents.
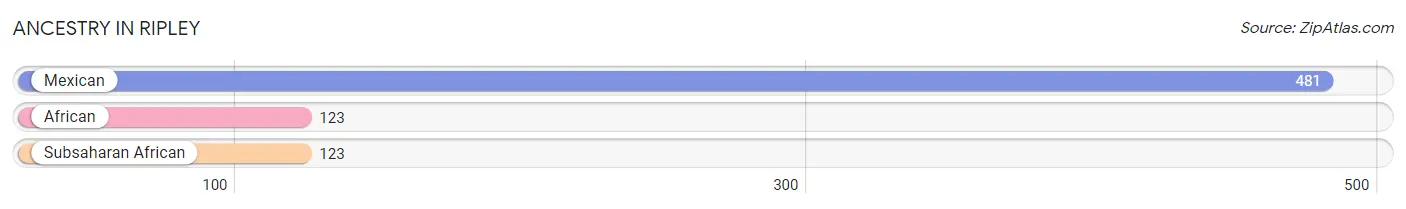
| Ancestry | # Population | % Population |
| African | 123 | 20.0% |
| Mexican | 481 | 78.3% |
| Subsaharan African | 123 | 20.0% | View All 3 Rows |
Immigrants in Ripley
The most numerous immigrant groups reported in Ripley came from Central America (239 | 38.9%), Latin America (239 | 38.9%), and Mexico (239 | 38.9%), together accounting for 116.8% of all Ripley residents.
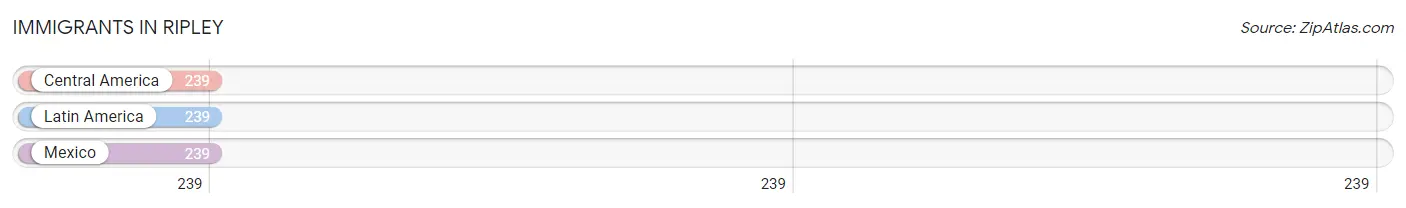
| Immigration Origin | # Population | % Population |
| Central America | 239 | 38.9% |
| Latin America | 239 | 38.9% |
| Mexico | 239 | 38.9% | View All 3 Rows |
Sex and Age in Ripley
Sex and Age in Ripley
The most populous age groups in Ripley are 5 to 9 Years (63 | 22.6%) for men and 70 to 74 Years (68 | 20.3%) for women.
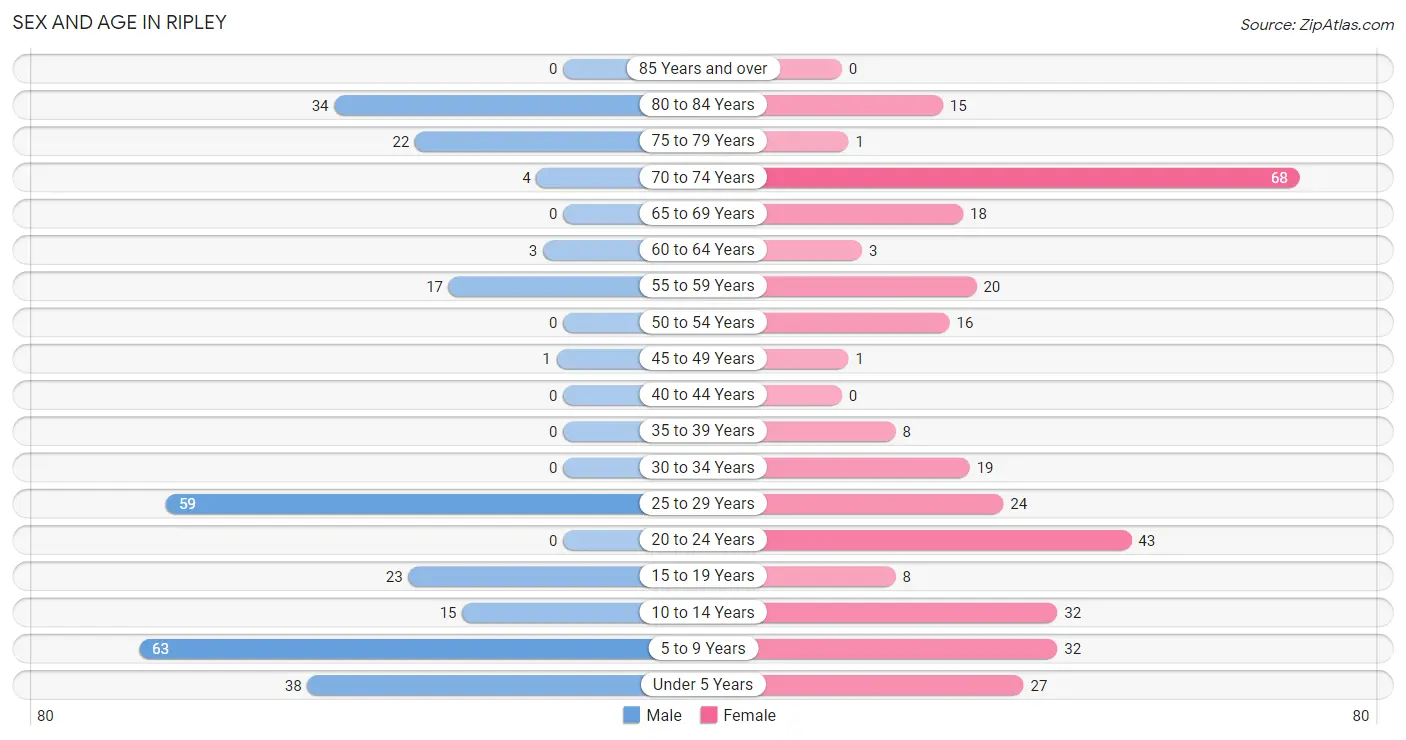
| Age Bracket | Male | Female |
| Under 5 Years | 38 (13.6%) | 27 (8.1%) |
| 5 to 9 Years | 63 (22.6%) | 32 (9.6%) |
| 10 to 14 Years | 15 (5.4%) | 32 (9.6%) |
| 15 to 19 Years | 23 (8.2%) | 8 (2.4%) |
| 20 to 24 Years | 0 (0.0%) | 43 (12.8%) |
| 25 to 29 Years | 59 (21.1%) | 24 (7.2%) |
| 30 to 34 Years | 0 (0.0%) | 19 (5.7%) |
| 35 to 39 Years | 0 (0.0%) | 8 (2.4%) |
| 40 to 44 Years | 0 (0.0%) | 0 (0.0%) |
| 45 to 49 Years | 1 (0.4%) | 1 (0.3%) |
| 50 to 54 Years | 0 (0.0%) | 16 (4.8%) |
| 55 to 59 Years | 17 (6.1%) | 20 (6.0%) |
| 60 to 64 Years | 3 (1.1%) | 3 (0.9%) |
| 65 to 69 Years | 0 (0.0%) | 18 (5.4%) |
| 70 to 74 Years | 4 (1.4%) | 68 (20.3%) |
| 75 to 79 Years | 22 (7.9%) | 1 (0.3%) |
| 80 to 84 Years | 34 (12.2%) | 15 (4.5%) |
| 85 Years and over | 0 (0.0%) | 0 (0.0%) |
| Total | 279 (100.0%) | 335 (100.0%) |
Families and Households in Ripley
Median Family Size in Ripley
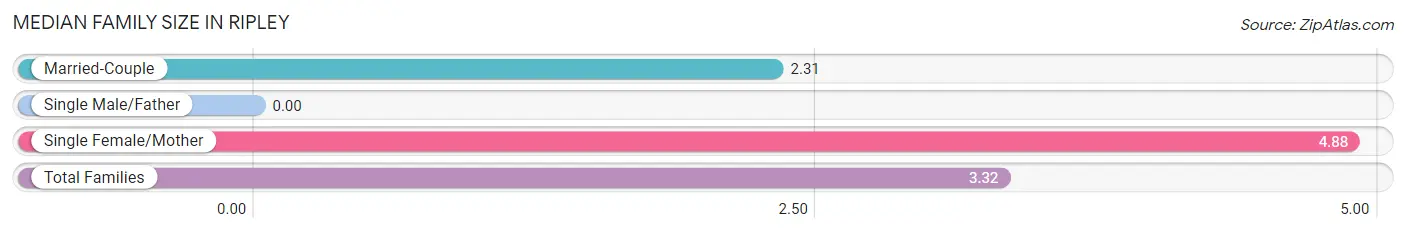
| Family Type | # Families | Family Size |
| Married-Couple | 101 (60.5%) | 2.31 |
| Single Male/Father | 0 (0.0%) | - |
| Single Female/Mother | 66 (39.5%) | 4.88 |
| Total Families | 167 (100.0%) | 3.32 |
Median Household Size in Ripley
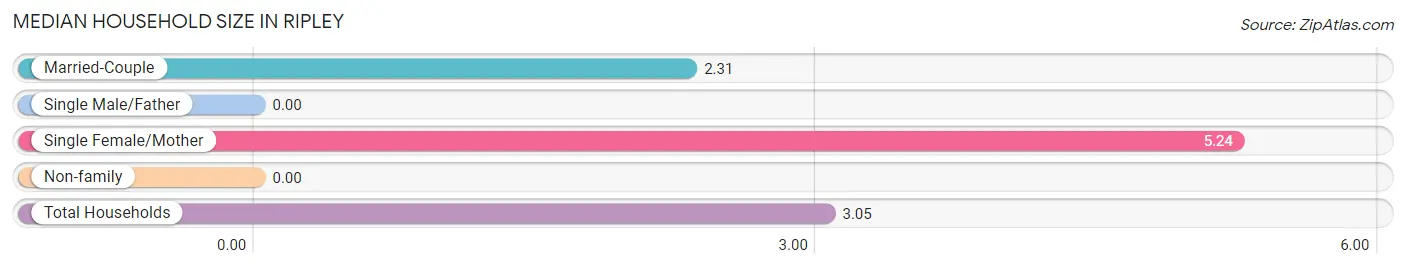
| Household Type | # Households | Household Size |
| Married-Couple | 101 (50.2%) | 2.31 |
| Single Male/Father | 0 (0.0%) | - |
| Single Female/Mother | 66 (32.8%) | 5.24 |
| Non-family | 34 (16.9%) | - |
| Total Households | 201 (100.0%) | 3.05 |
Household Size by Marriage Status in Ripley
Out of a total of 201 households in Ripley, 167 (83.1%) are family households, while 34 (16.9%) are nonfamily households. The most numerous type of family households are 2-person households, comprising 73, and the most common type of nonfamily households are 1-person households, comprising 34.
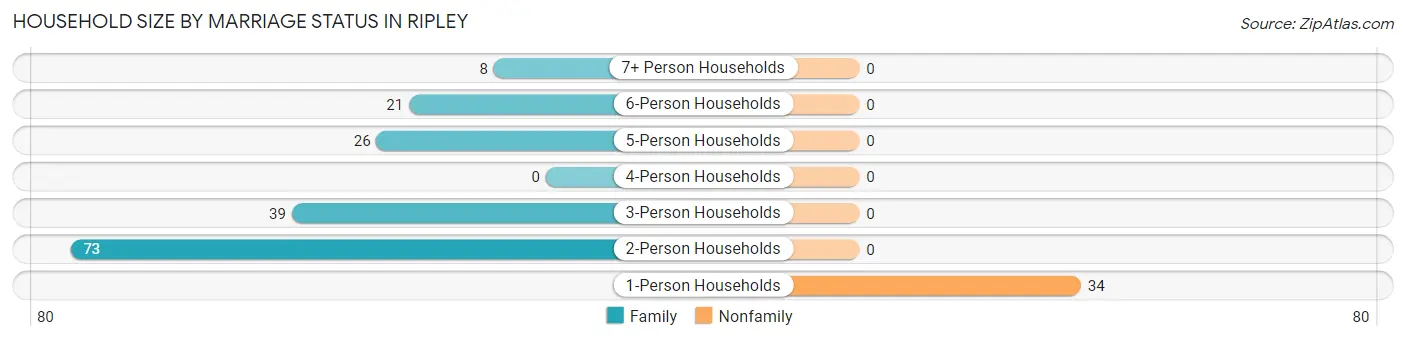
| Household Size | Family Households | Nonfamily Households |
| 1-Person Households | - | 34 (16.9%) |
| 2-Person Households | 73 (36.3%) | 0 (0.0%) |
| 3-Person Households | 39 (19.4%) | 0 (0.0%) |
| 4-Person Households | 0 (0.0%) | 0 (0.0%) |
| 5-Person Households | 26 (12.9%) | 0 (0.0%) |
| 6-Person Households | 21 (10.4%) | 0 (0.0%) |
| 7+ Person Households | 8 (4.0%) | 0 (0.0%) |
| Total | 167 (83.1%) | 34 (16.9%) |
Female Fertility in Ripley
Fertility by Age in Ripley
Average fertility rate in Ripley is 291.0 births per 1,000 women. Women in the age bracket of 20 to 34 years have the highest fertility rate with 349.0 births per 1,000 women. Women in the age bracket of 20 to 34 years acount for 100.0% of all women with births.
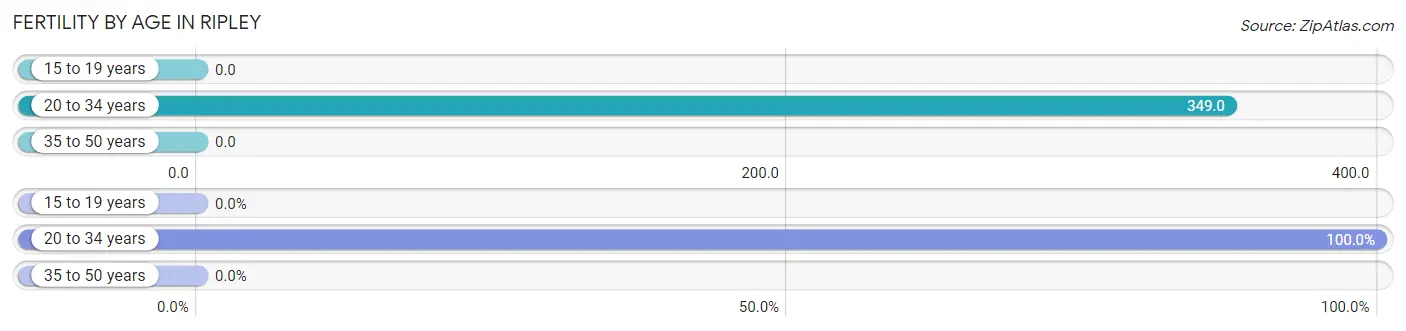
| Age Bracket | Women with Births | Births / 1,000 Women |
| 15 to 19 years | 0 (0.0%) | 0.0 |
| 20 to 34 years | 30 (100.0%) | 349.0 |
| 35 to 50 years | 0 (0.0%) | 0.0 |
| Total | 30 (100.0%) | 291.0 |
Fertility by Age by Marriage Status in Ripley
30.0% of women with births (30) in Ripley are married. The highest percentage of unmarried women with births falls into 20 to 34 years age bracket with 70.0% of them unmarried at the time of birth, while the lowest percentage of unmarried women with births belong to 20 to 34 years age bracket with 70.0% of them unmarried.
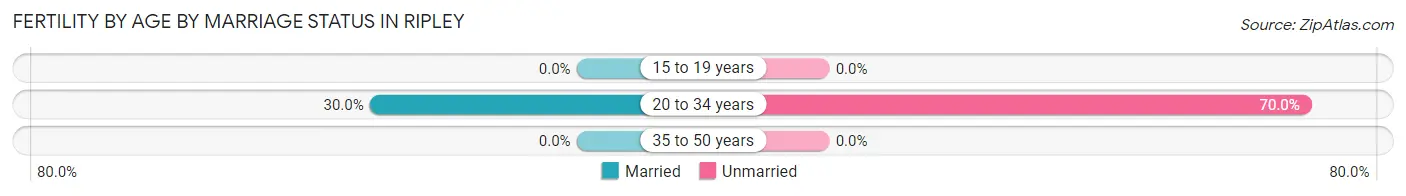
| Age Bracket | Married | Unmarried |
| 15 to 19 years | 0 (0.0%) | 0 (0.0%) |
| 20 to 34 years | 9 (30.0%) | 21 (70.0%) |
| 35 to 50 years | 0 (0.0%) | 0 (0.0%) |
| Total | 9 (30.0%) | 21 (70.0%) |
Fertility by Education in Ripley
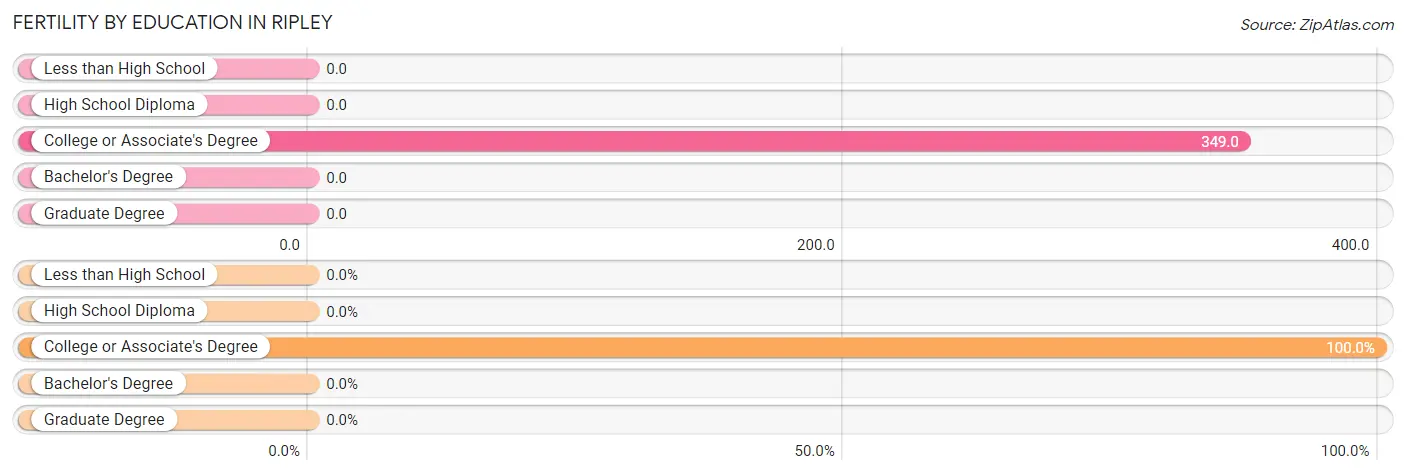
| Educational Attainment | Women with Births | Births / 1,000 Women |
| Less than High School | 0 (0.0%) | 0.0 |
| High School Diploma | 0 (0.0%) | 0.0 |
| College or Associate's Degree | 30 (100.0%) | 349.0 |
| Bachelor's Degree | 0 (0.0%) | 0.0 |
| Graduate Degree | 0 (0.0%) | 0.0 |
| Total | 30 (100.0%) | 291.0 |
Fertility by Education by Marriage Status in Ripley
70.0% of women with births in Ripley are unmarried. Women with the educational attainment of college or associate's degree are most likely to be married with 30.0% of them married at childbirth, while women with the educational attainment of college or associate's degree are least likely to be married with 70.0% of them unmarried at childbirth.
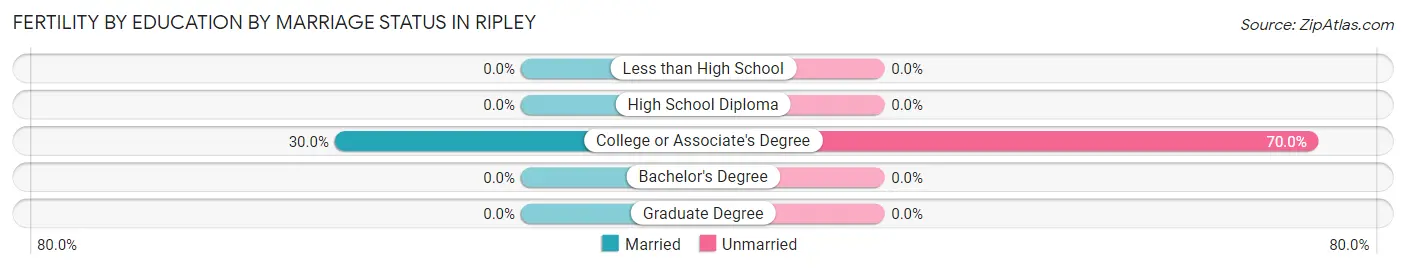
| Educational Attainment | Married | Unmarried |
| Less than High School | 0 (0.0%) | 0 (0.0%) |
| High School Diploma | 0 (0.0%) | 0 (0.0%) |
| College or Associate's Degree | 9 (30.0%) | 21 (70.0%) |
| Bachelor's Degree | 0 (0.0%) | 0 (0.0%) |
| Graduate Degree | 0 (0.0%) | 0 (0.0%) |
| Total | 9 (30.0%) | 21 (70.0%) |
Employment Characteristics in Ripley
Employment by Class of Employer in Ripley
Among the 118 employed individuals in Ripley, private company employees (93 | 78.8%), state government employees (19 | 16.1%), and self-employed (not incorporated) (3 | 2.5%) make up the most common classes of employment.
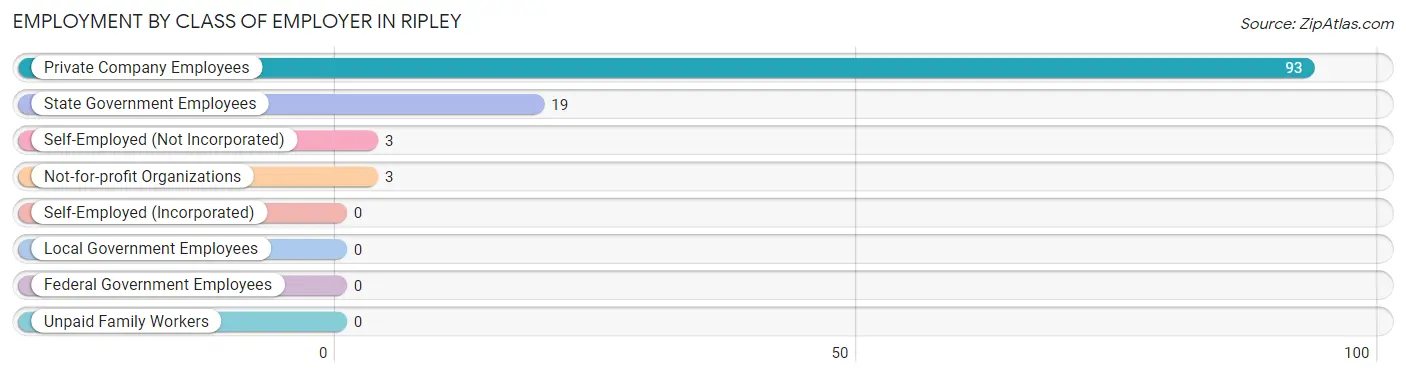
| Employer Class | # Employees | % Employees |
| Private Company Employees | 93 | 78.8% |
| Self-Employed (Incorporated) | 0 | 0.0% |
| Self-Employed (Not Incorporated) | 3 | 2.5% |
| Not-for-profit Organizations | 3 | 2.5% |
| Local Government Employees | 0 | 0.0% |
| State Government Employees | 19 | 16.1% |
| Federal Government Employees | 0 | 0.0% |
| Unpaid Family Workers | 0 | 0.0% |
| Total | 118 | 100.0% |
Employment Status by Age in Ripley
According to the labor force statistics for Ripley, out of the total population over 16 years of age (407), 33.2% or 135 individuals are in the labor force, with 12.6% or 17 of them unemployed. The age group with the highest labor force participation rate is 30 to 34 years, with 100.0% or 19 individuals in the labor force. Within the labor force, the 55 to 59 years age range has the highest percentage of unemployed individuals, with 45.9% or 17 of them being unemployed.
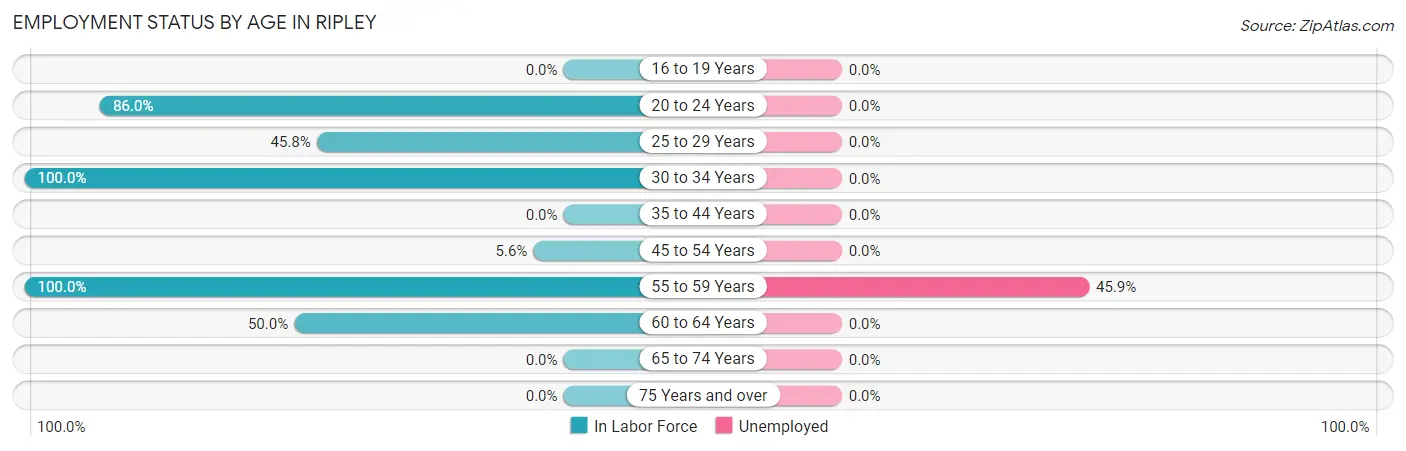
| Age Bracket | In Labor Force | Unemployed |
| 16 to 19 Years | 0 (0.0%) | 0 (0.0%) |
| 20 to 24 Years | 37 (86.0%) | 0 (0.0%) |
| 25 to 29 Years | 38 (45.8%) | 0 (0.0%) |
| 30 to 34 Years | 19 (100.0%) | 0 (0.0%) |
| 35 to 44 Years | 0 (0.0%) | 0 (0.0%) |
| 45 to 54 Years | 1 (5.6%) | 0 (0.0%) |
| 55 to 59 Years | 37 (100.0%) | 17 (45.9%) |
| 60 to 64 Years | 3 (50.0%) | 0 (0.0%) |
| 65 to 74 Years | 0 (0.0%) | 0 (0.0%) |
| 75 Years and over | 0 (0.0%) | 0 (0.0%) |
| Total | 135 (33.2%) | 17 (12.6%) |
Employment Status by Educational Attainment in Ripley
According to labor force statistics for Ripley, 57.3% of individuals (98) out of the total population between 25 and 64 years of age (171) are in the labor force, with 17.3% or 17 of them being unemployed. The group with the highest labor force participation rate are those with the educational attainment of high school diploma, with 97.6% or 41 individuals in the labor force. Within the labor force, individuals with less than high school education have the highest percentage of unemployment, with 48.6% or 17 of them being unemployed.
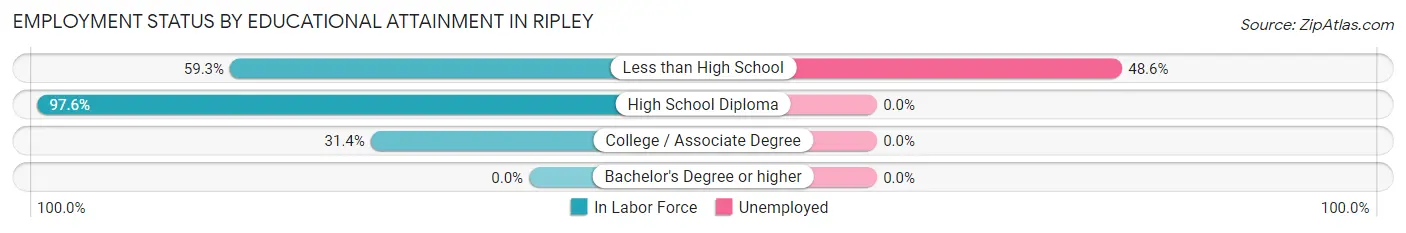
| Educational Attainment | In Labor Force | Unemployed |
| Less than High School | 35 (59.3%) | 29 (48.6%) |
| High School Diploma | 41 (97.6%) | 0 (0.0%) |
| College / Associate Degree | 22 (31.4%) | 0 (0.0%) |
| Bachelor's Degree or higher | 0 (0.0%) | 0 (0.0%) |
| Total | 98 (57.3%) | 30 (17.3%) |
Employment Occupations by Sex in Ripley
Management, Business, Science and Arts Occupations
Management, Business, Science and Arts Occupations by Sex
| Occupation | Male | Female |
| Management | 0 (0.0%) | 0 (0.0%) |
| Business & Financial | 0 (0.0%) | 0 (0.0%) |
| Computers, Engineering & Science | 0 (0.0%) | 0 (0.0%) |
| Computers & Mathematics | 0 (0.0%) | 0 (0.0%) |
| Architecture & Engineering | 0 (0.0%) | 0 (0.0%) |
| Life, Physical & Social Science | 0 (0.0%) | 0 (0.0%) |
| Community & Social Service | 0 (0.0%) | 0 (0.0%) |
| Education, Arts & Media | 0 (0.0%) | 0 (0.0%) |
| Legal Services & Support | 0 (0.0%) | 0 (0.0%) |
| Education Instruction & Library | 0 (0.0%) | 0 (0.0%) |
| Arts, Media & Entertainment | 0 (0.0%) | 0 (0.0%) |
| Health Diagnosing & Treating | 0 (0.0%) | 0 (0.0%) |
| Health Technologists | 0 (0.0%) | 0 (0.0%) |
| Total (Category) | 0 (0.0%) | 0 (0.0%) |
| Total (Overall) | 56 (47.5%) | 62 (52.5%) |
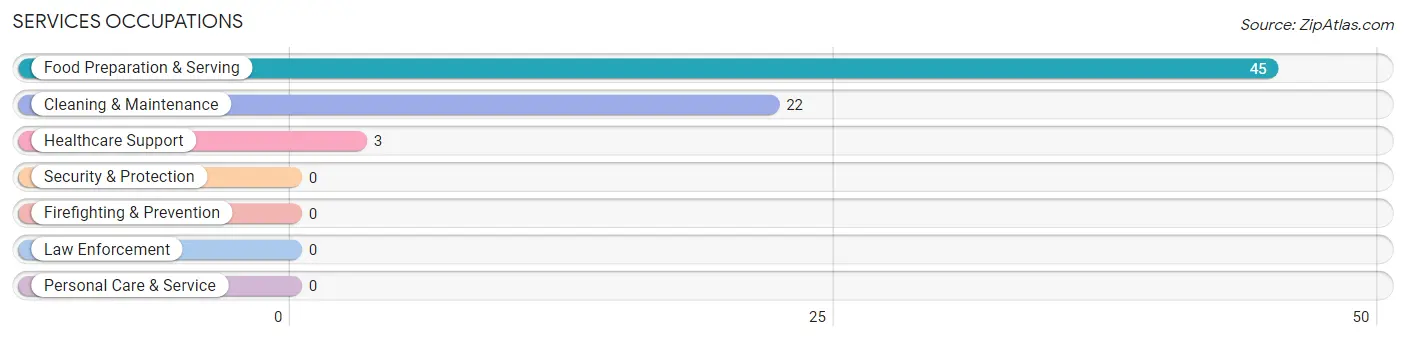
Services Occupations
The most common Services occupations in Ripley are Food Preparation & Serving (45 | 38.1%), Cleaning & Maintenance (22 | 18.6%), and Healthcare Support (3 | 2.5%).
Services Occupations by Sex
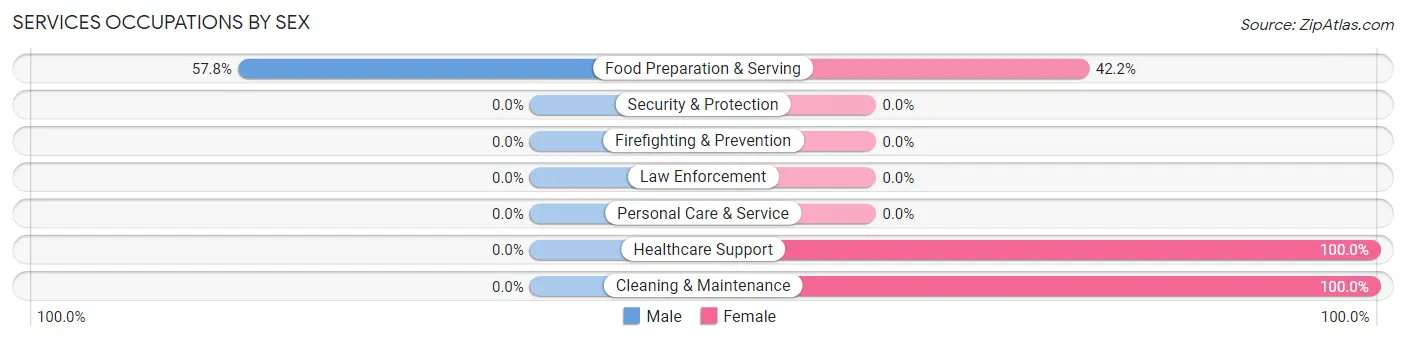
| Occupation | Male | Female |
| Healthcare Support | 0 (0.0%) | 3 (100.0%) |
| Security & Protection | 0 (0.0%) | 0 (0.0%) |
| Firefighting & Prevention | 0 (0.0%) | 0 (0.0%) |
| Law Enforcement | 0 (0.0%) | 0 (0.0%) |
| Food Preparation & Serving | 26 (57.8%) | 19 (42.2%) |
| Cleaning & Maintenance | 0 (0.0%) | 22 (100.0%) |
| Personal Care & Service | 0 (0.0%) | 0 (0.0%) |
| Total (Category) | 26 (37.1%) | 44 (62.9%) |
| Total (Overall) | 56 (47.5%) | 62 (52.5%) |
Sales and Office Occupations
The most common Sales and Office occupations in Ripley are , and Sales & Related (21 | 17.8%).
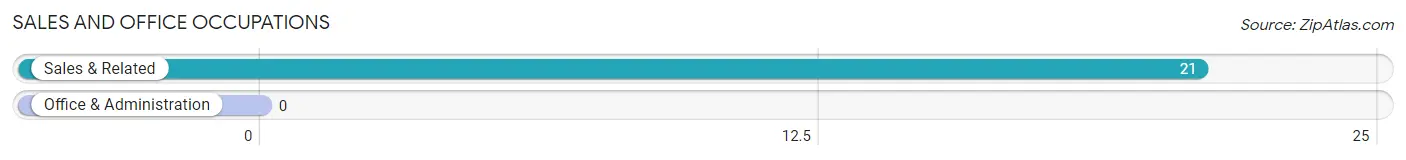
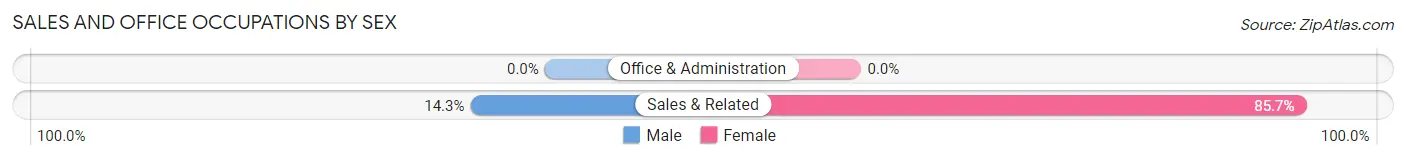
Sales and Office Occupations by Sex
| Occupation | Male | Female |
| Sales & Related | 3 (14.3%) | 18 (85.7%) |
| Office & Administration | 0 (0.0%) | 0 (0.0%) |
| Total (Category) | 3 (14.3%) | 18 (85.7%) |
| Total (Overall) | 56 (47.5%) | 62 (52.5%) |
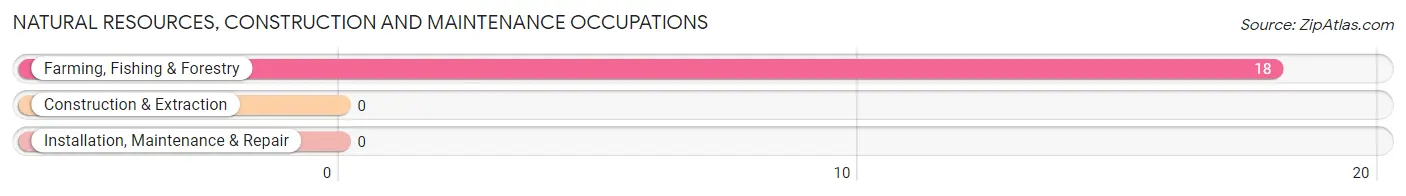
Natural Resources, Construction and Maintenance Occupations
The most common Natural Resources, Construction and Maintenance occupations in Ripley are , and Farming, Fishing & Forestry (18 | 15.2%).
Natural Resources, Construction and Maintenance Occupations by Sex
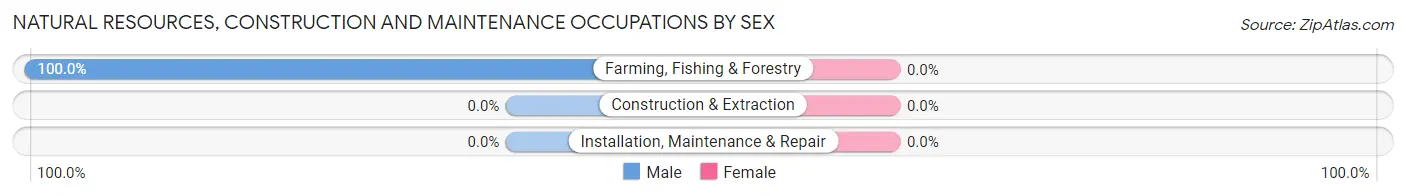
| Occupation | Male | Female |
| Farming, Fishing & Forestry | 18 (100.0%) | 0 (0.0%) |
| Construction & Extraction | 0 (0.0%) | 0 (0.0%) |
| Installation, Maintenance & Repair | 0 (0.0%) | 0 (0.0%) |
| Total (Category) | 18 (100.0%) | 0 (0.0%) |
| Total (Overall) | 56 (47.5%) | 62 (52.5%) |
Production, Transportation and Moving Occupations
The most common Production, Transportation and Moving occupations in Ripley are , and Material Moving (9 | 7.6%).
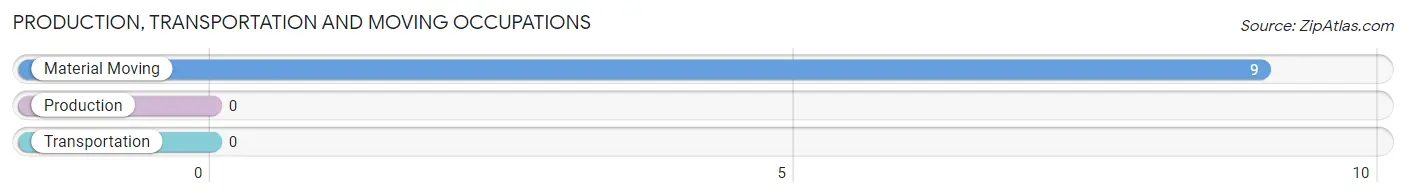
Production, Transportation and Moving Occupations by Sex
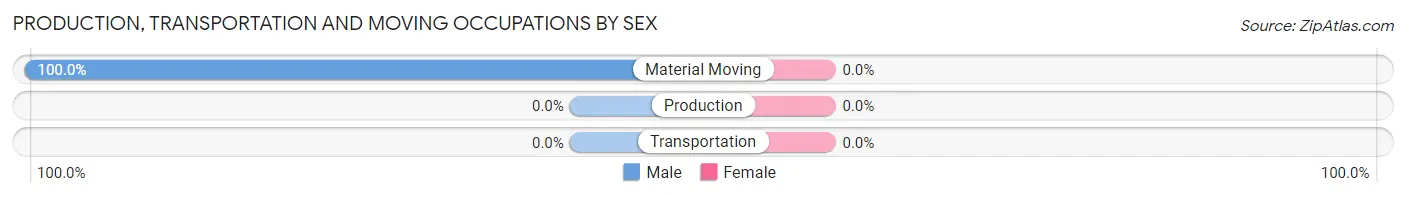
| Occupation | Male | Female |
| Production | 0 (0.0%) | 0 (0.0%) |
| Transportation | 0 (0.0%) | 0 (0.0%) |
| Material Moving | 9 (100.0%) | 0 (0.0%) |
| Total (Category) | 9 (100.0%) | 0 (0.0%) |
| Total (Overall) | 56 (47.5%) | 62 (52.5%) |
Employment Industries by Sex in Ripley
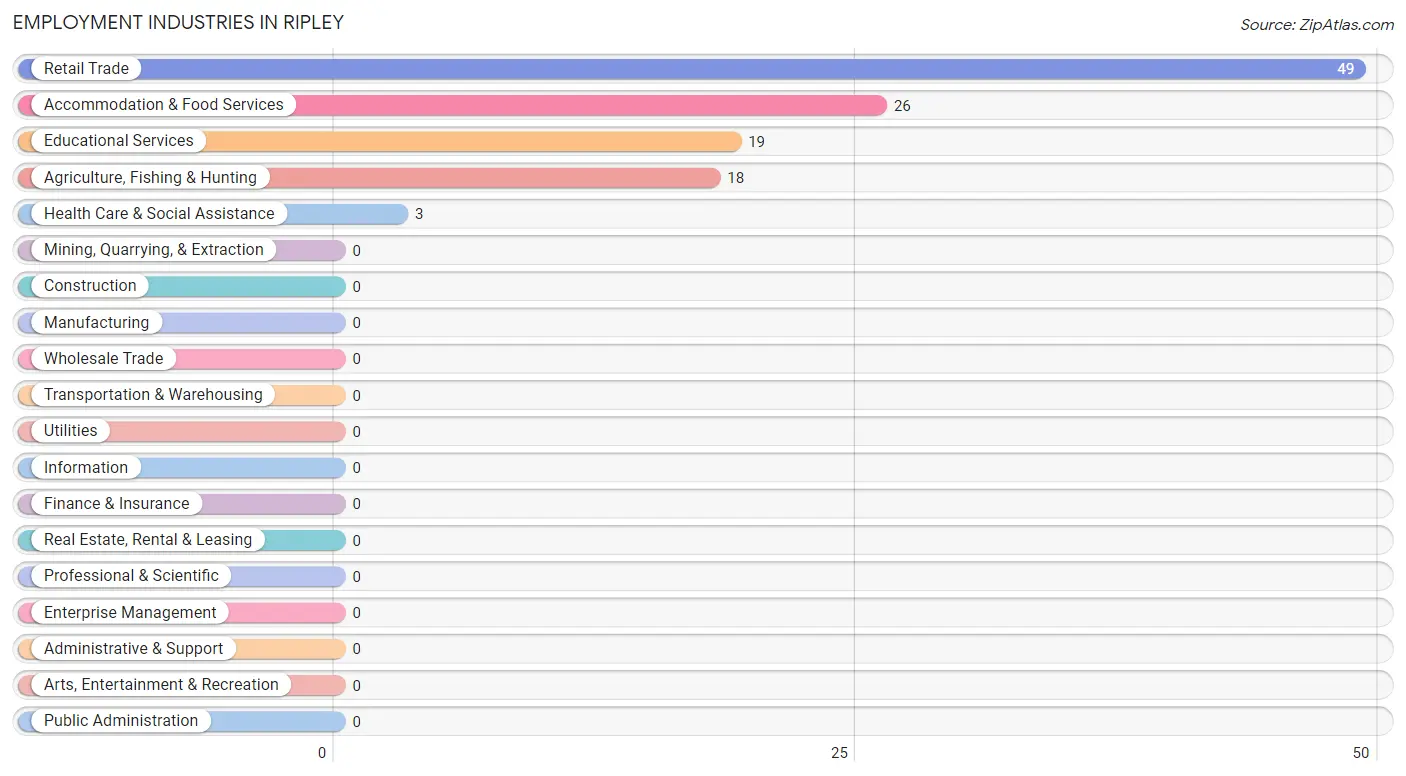
Employment Industries in Ripley
The major employment industries in Ripley include Retail Trade (49 | 41.5%), Accommodation & Food Services (26 | 22.0%), Educational Services (19 | 16.1%), Agriculture, Fishing & Hunting (18 | 15.2%), and Health Care & Social Assistance (3 | 2.5%).
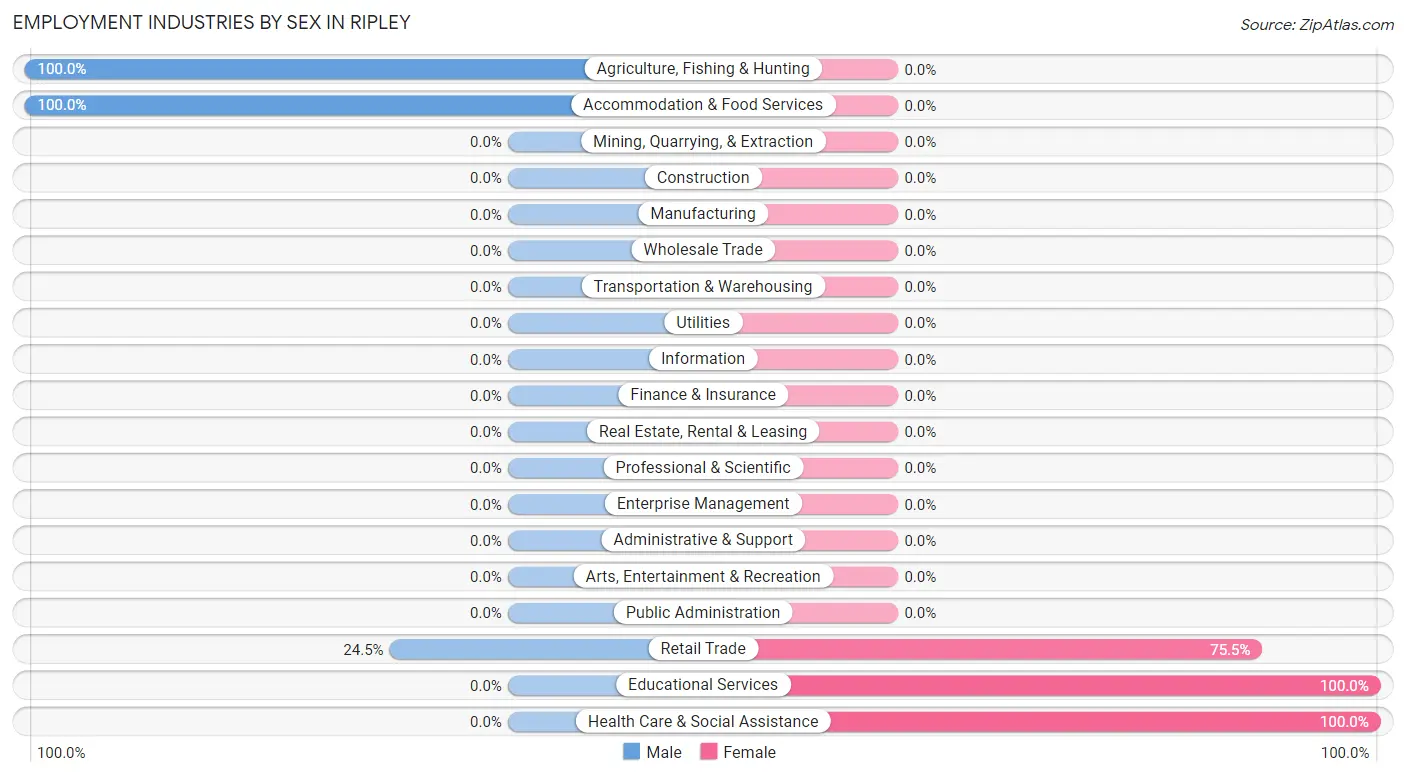
Employment Industries by Sex in Ripley
The Ripley industries that see more men than women are Agriculture, Fishing & Hunting (100.0%), Accommodation & Food Services (100.0%), and Retail Trade (24.5%), whereas the industries that tend to have a higher number of women are Educational Services (100.0%), Health Care & Social Assistance (100.0%), and Retail Trade (75.5%).
| Industry | Male | Female |
| Agriculture, Fishing & Hunting | 18 (100.0%) | 0 (0.0%) |
| Mining, Quarrying, & Extraction | 0 (0.0%) | 0 (0.0%) |
| Construction | 0 (0.0%) | 0 (0.0%) |
| Manufacturing | 0 (0.0%) | 0 (0.0%) |
| Wholesale Trade | 0 (0.0%) | 0 (0.0%) |
| Retail Trade | 12 (24.5%) | 37 (75.5%) |
| Transportation & Warehousing | 0 (0.0%) | 0 (0.0%) |
| Utilities | 0 (0.0%) | 0 (0.0%) |
| Information | 0 (0.0%) | 0 (0.0%) |
| Finance & Insurance | 0 (0.0%) | 0 (0.0%) |
| Real Estate, Rental & Leasing | 0 (0.0%) | 0 (0.0%) |
| Professional & Scientific | 0 (0.0%) | 0 (0.0%) |
| Enterprise Management | 0 (0.0%) | 0 (0.0%) |
| Administrative & Support | 0 (0.0%) | 0 (0.0%) |
| Educational Services | 0 (0.0%) | 19 (100.0%) |
| Health Care & Social Assistance | 0 (0.0%) | 3 (100.0%) |
| Arts, Entertainment & Recreation | 0 (0.0%) | 0 (0.0%) |
| Accommodation & Food Services | 26 (100.0%) | 0 (0.0%) |
| Public Administration | 0 (0.0%) | 0 (0.0%) |
| Total | 56 (47.5%) | 62 (52.5%) |
Education in Ripley
School Enrollment in Ripley
The most common levels of schooling among the 229 students in Ripley are elementary school (48 | 21.0%), college / undergraduate (43 | 18.8%), and nursery / preschool (42 | 18.3%).
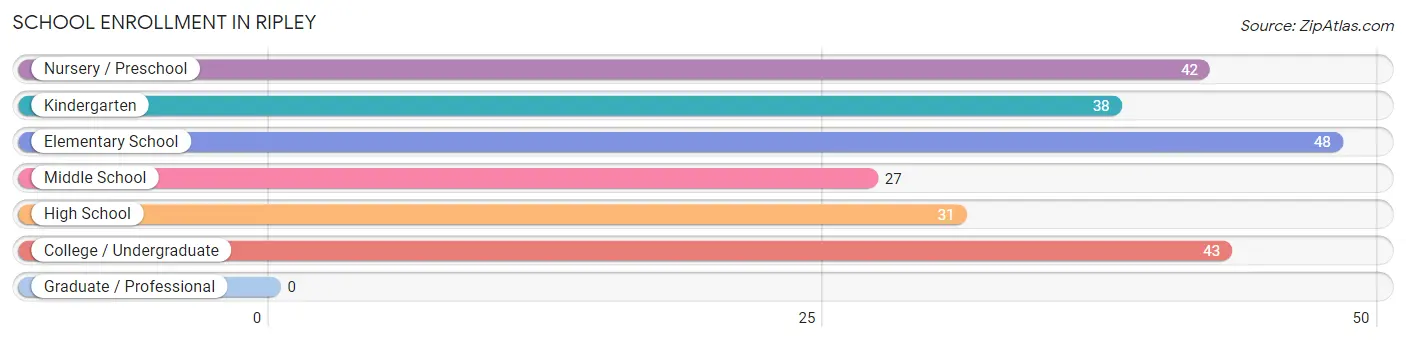
| School Level | # Students | % Students |
| Nursery / Preschool | 42 | 18.3% |
| Kindergarten | 38 | 16.6% |
| Elementary School | 48 | 21.0% |
| Middle School | 27 | 11.8% |
| High School | 31 | 13.5% |
| College / Undergraduate | 43 | 18.8% |
| Graduate / Professional | 0 | 0.0% |
| Total | 229 | 100.0% |
School Enrollment by Age by Funding Source in Ripley
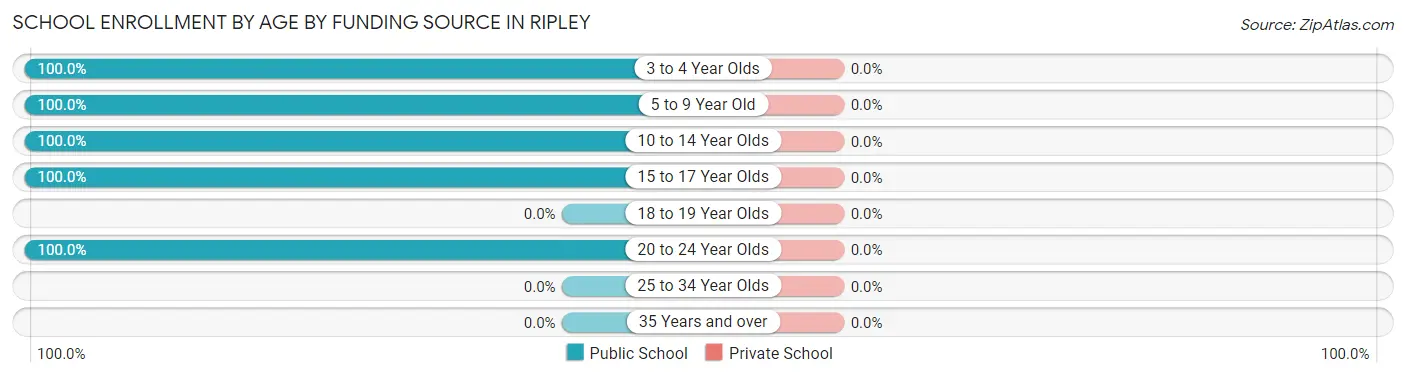
| Age Bracket | Public School | Private School |
| 3 to 4 Year Olds | 21 (100.0%) | 0 (0.0%) |
| 5 to 9 Year Old | 87 (100.0%) | 0 (0.0%) |
| 10 to 14 Year Olds | 47 (100.0%) | 0 (0.0%) |
| 15 to 17 Year Olds | 31 (100.0%) | 0 (0.0%) |
| 18 to 19 Year Olds | 0 (0.0%) | 0 (0.0%) |
| 20 to 24 Year Olds | 43 (100.0%) | 0 (0.0%) |
| 25 to 34 Year Olds | 0 (0.0%) | 0 (0.0%) |
| 35 Years and over | 0 (0.0%) | 0 (0.0%) |
| Total | 229 (100.0%) | 0 (0.0%) |
Educational Attainment by Field of Study in Ripley
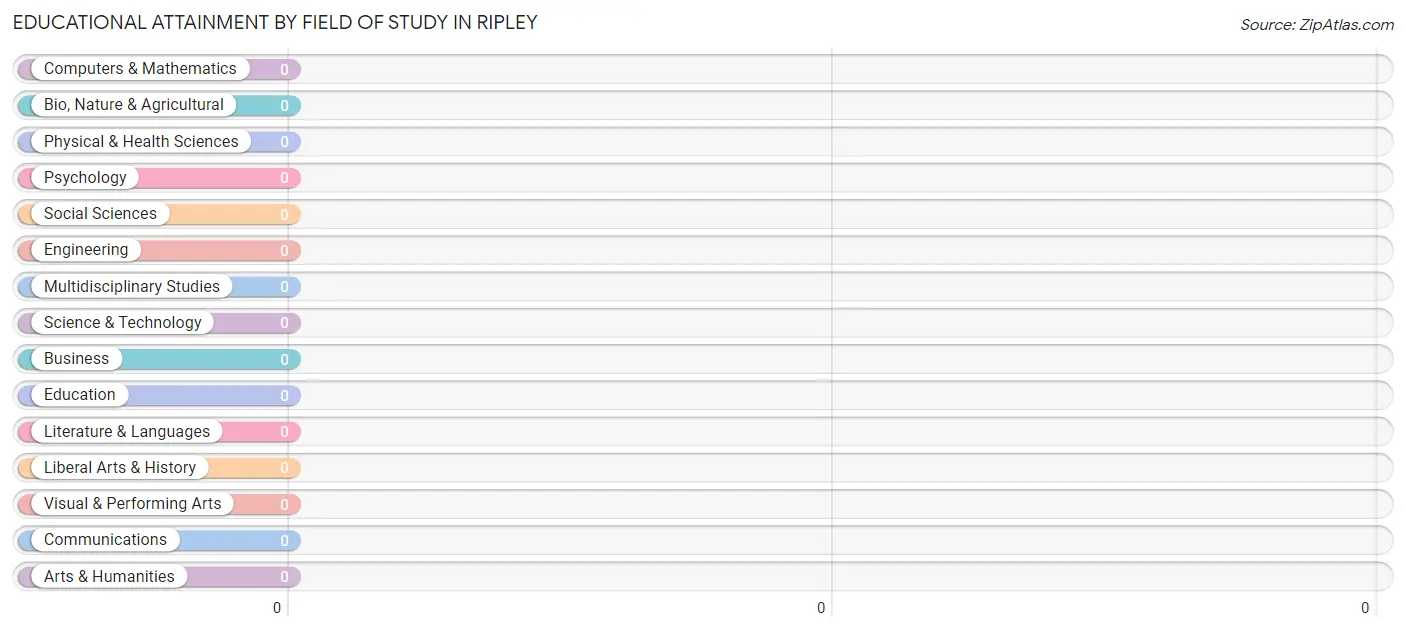
| Field of Study | # Graduates | % Graduates |
| Computers & Mathematics | 0 | 0.0% |
| Bio, Nature & Agricultural | 0 | 0.0% |
| Physical & Health Sciences | 0 | 0.0% |
| Psychology | 0 | 0.0% |
| Social Sciences | 0 | 0.0% |
| Engineering | 0 | 0.0% |
| Multidisciplinary Studies | 0 | 0.0% |
| Science & Technology | 0 | 0.0% |
| Business | 0 | 0.0% |
| Education | 0 | 0.0% |
| Literature & Languages | 0 | 0.0% |
| Liberal Arts & History | 0 | 0.0% |
| Visual & Performing Arts | 0 | 0.0% |
| Communications | 0 | 0.0% |
| Arts & Humanities | 0 | 0.0% |
| Total | 0 | 0.0% |
Transportation & Commute in Ripley
Vehicle Availability by Sex in Ripley
The most prevalent vehicle ownership categories in Ripley are males with 2 vehicles (27, accounting for 48.2%) and females with 2 vehicles (59, making up 43.5%).
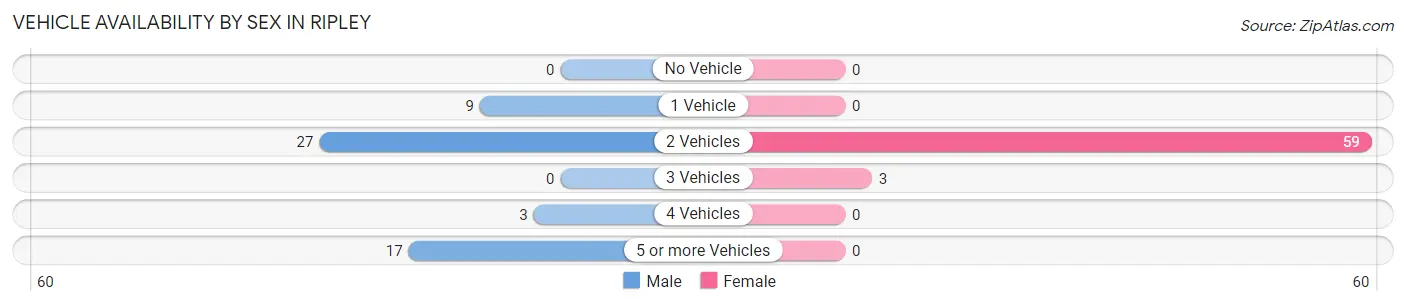
| Vehicles Available | Male | Female |
| No Vehicle | 0 (0.0%) | 0 (0.0%) |
| 1 Vehicle | 9 (16.1%) | 0 (0.0%) |
| 2 Vehicles | 27 (48.2%) | 59 (95.2%) |
| 3 Vehicles | 0 (0.0%) | 3 (4.8%) |
| 4 Vehicles | 3 (5.4%) | 0 (0.0%) |
| 5 or more Vehicles | 17 (30.4%) | 0 (0.0%) |
| Total | 56 (100.0%) | 62 (100.0%) |
Commute Time in Ripley
The most frequently occuring commute durations in Ripley are 15 to 19 minutes (91 commuters, 77.1%), 10 to 14 minutes (18 commuters, 15.2%), and 5 to 9 minutes (6 commuters, 5.1%).
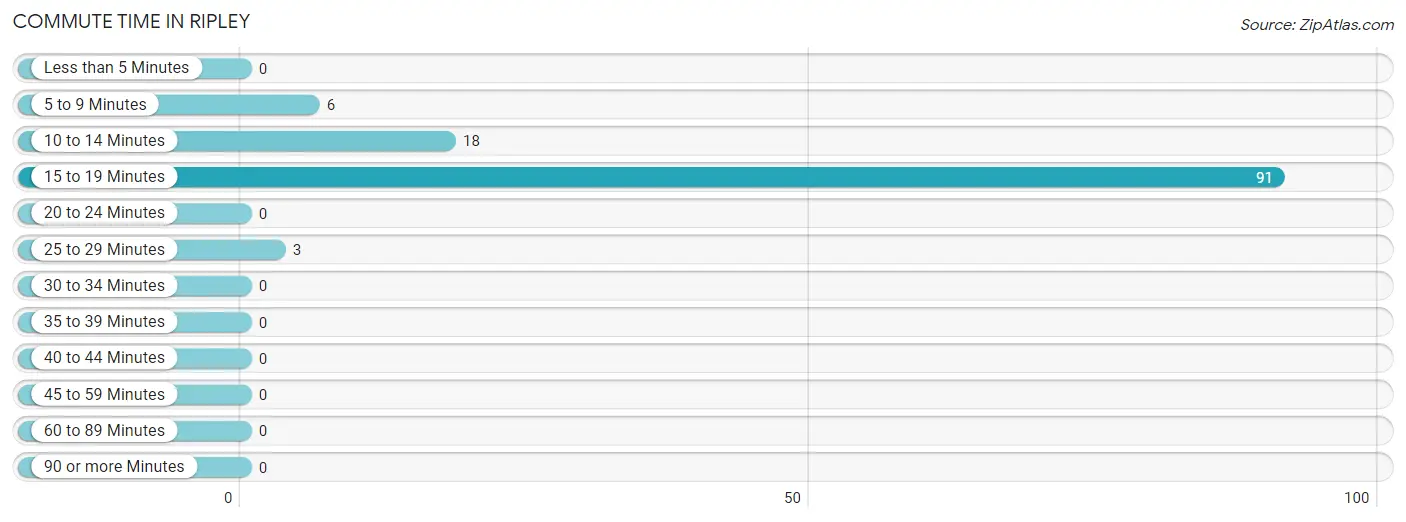
| Commute Time | # Commuters | % Commuters |
| Less than 5 Minutes | 0 | 0.0% |
| 5 to 9 Minutes | 6 | 5.1% |
| 10 to 14 Minutes | 18 | 15.2% |
| 15 to 19 Minutes | 91 | 77.1% |
| 20 to 24 Minutes | 0 | 0.0% |
| 25 to 29 Minutes | 3 | 2.5% |
| 30 to 34 Minutes | 0 | 0.0% |
| 35 to 39 Minutes | 0 | 0.0% |
| 40 to 44 Minutes | 0 | 0.0% |
| 45 to 59 Minutes | 0 | 0.0% |
| 60 to 89 Minutes | 0 | 0.0% |
| 90 or more Minutes | 0 | 0.0% |
Commute Time by Sex in Ripley
The most common commute times in Ripley are 15 to 19 minutes (35 commuters, 62.5%) for males and 15 to 19 minutes (56 commuters, 90.3%) for females.
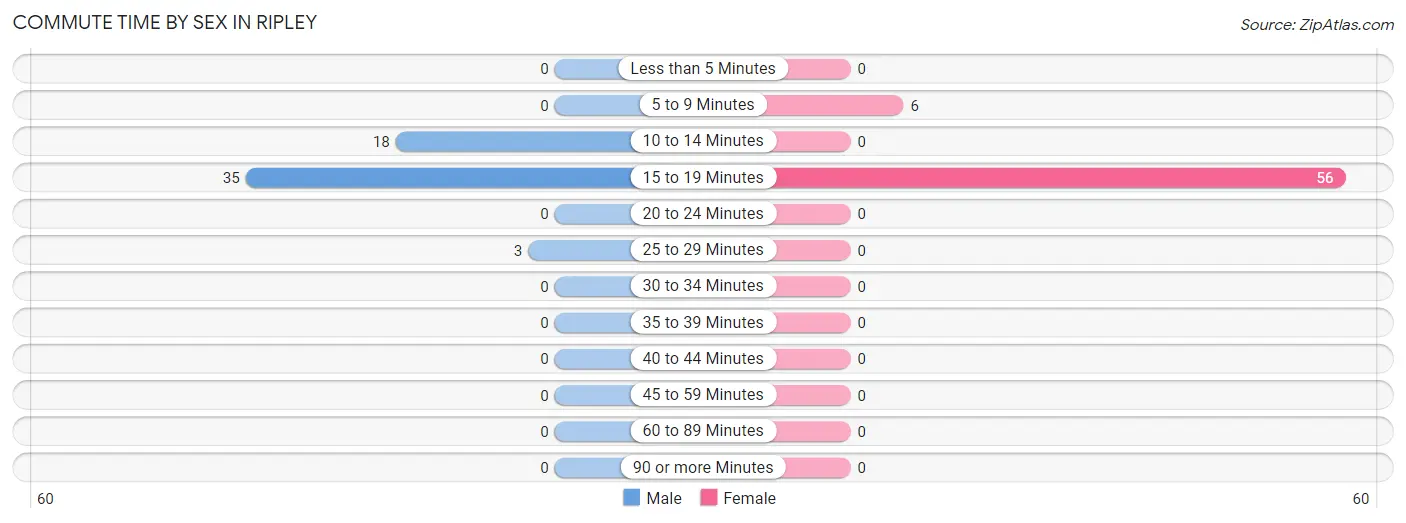
| Commute Time | Male | Female |
| Less than 5 Minutes | 0 (0.0%) | 0 (0.0%) |
| 5 to 9 Minutes | 0 (0.0%) | 6 (9.7%) |
| 10 to 14 Minutes | 18 (32.1%) | 0 (0.0%) |
| 15 to 19 Minutes | 35 (62.5%) | 56 (90.3%) |
| 20 to 24 Minutes | 0 (0.0%) | 0 (0.0%) |
| 25 to 29 Minutes | 3 (5.4%) | 0 (0.0%) |
| 30 to 34 Minutes | 0 (0.0%) | 0 (0.0%) |
| 35 to 39 Minutes | 0 (0.0%) | 0 (0.0%) |
| 40 to 44 Minutes | 0 (0.0%) | 0 (0.0%) |
| 45 to 59 Minutes | 0 (0.0%) | 0 (0.0%) |
| 60 to 89 Minutes | 0 (0.0%) | 0 (0.0%) |
| 90 or more Minutes | 0 (0.0%) | 0 (0.0%) |
Time of Departure to Work by Sex in Ripley
The most frequent times of departure to work in Ripley are 8:00 AM to 8:29 AM (26, 46.4%) for males and 12:00 AM to 4:59 AM (40, 64.5%) for females.
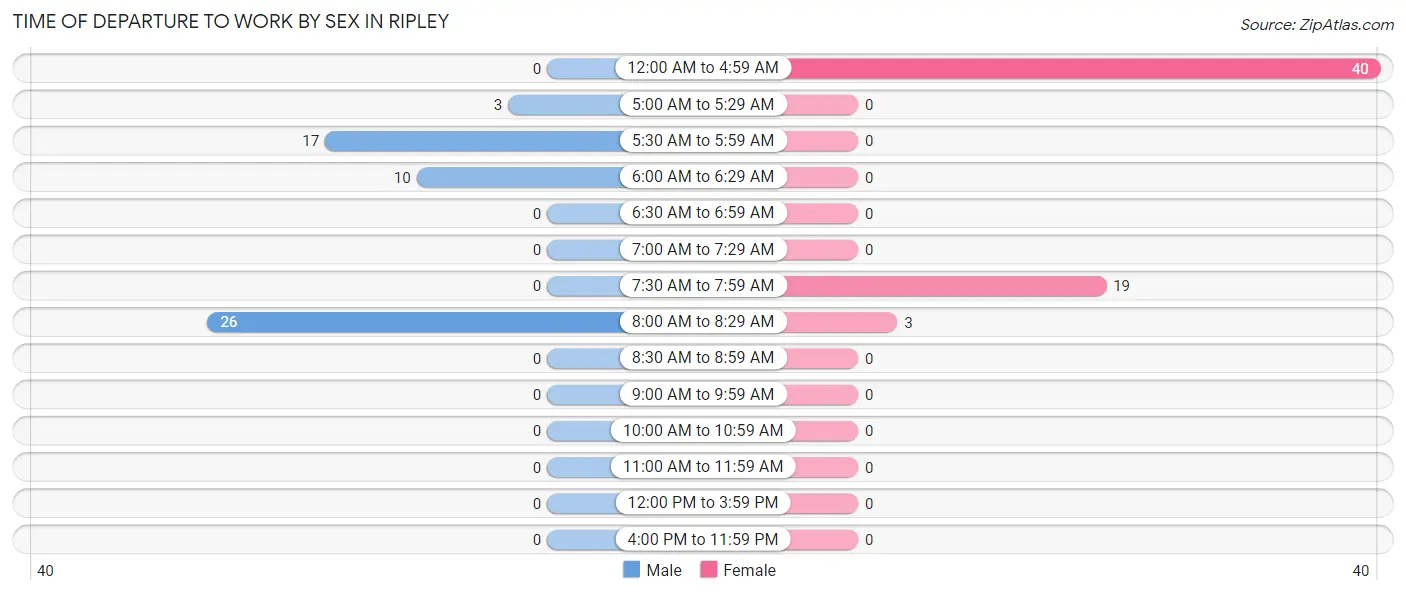
| Time of Departure | Male | Female |
| 12:00 AM to 4:59 AM | 0 (0.0%) | 40 (64.5%) |
| 5:00 AM to 5:29 AM | 3 (5.4%) | 0 (0.0%) |
| 5:30 AM to 5:59 AM | 17 (30.4%) | 0 (0.0%) |
| 6:00 AM to 6:29 AM | 10 (17.9%) | 0 (0.0%) |
| 6:30 AM to 6:59 AM | 0 (0.0%) | 0 (0.0%) |
| 7:00 AM to 7:29 AM | 0 (0.0%) | 0 (0.0%) |
| 7:30 AM to 7:59 AM | 0 (0.0%) | 19 (30.6%) |
| 8:00 AM to 8:29 AM | 26 (46.4%) | 3 (4.8%) |
| 8:30 AM to 8:59 AM | 0 (0.0%) | 0 (0.0%) |
| 9:00 AM to 9:59 AM | 0 (0.0%) | 0 (0.0%) |
| 10:00 AM to 10:59 AM | 0 (0.0%) | 0 (0.0%) |
| 11:00 AM to 11:59 AM | 0 (0.0%) | 0 (0.0%) |
| 12:00 PM to 3:59 PM | 0 (0.0%) | 0 (0.0%) |
| 4:00 PM to 11:59 PM | 0 (0.0%) | 0 (0.0%) |
| Total | 56 (100.0%) | 62 (100.0%) |
Housing Occupancy in Ripley
Occupancy by Ownership in Ripley
Of the total 201 dwellings in Ripley, owner-occupied units account for 111 (55.2%), while renter-occupied units make up 90 (44.8%).
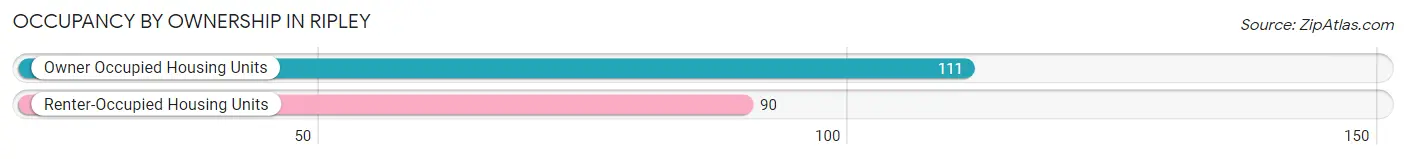
| Occupancy | # Housing Units | % Housing Units |
| Owner Occupied Housing Units | 111 | 55.2% |
| Renter-Occupied Housing Units | 90 | 44.8% |
| Total Occupied Housing Units | 201 | 100.0% |
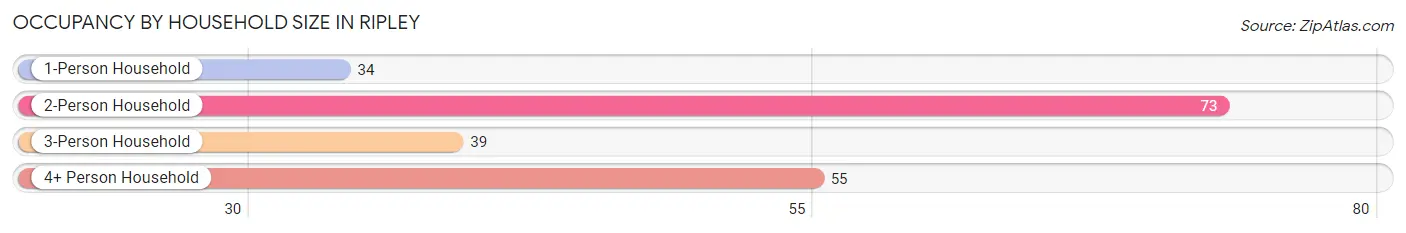
Occupancy by Household Size in Ripley
| Household Size | # Housing Units | % Housing Units |
| 1-Person Household | 34 | 16.9% |
| 2-Person Household | 73 | 36.3% |
| 3-Person Household | 39 | 19.4% |
| 4+ Person Household | 55 | 27.4% |
| Total Housing Units | 201 | 100.0% |
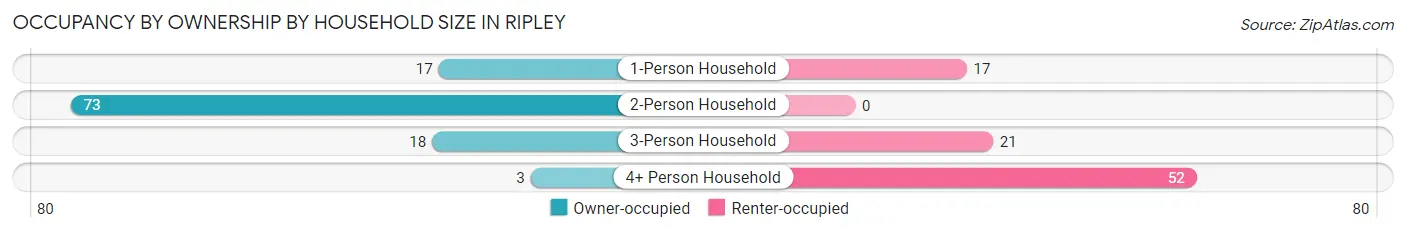
Occupancy by Ownership by Household Size in Ripley
| Household Size | Owner-occupied | Renter-occupied |
| 1-Person Household | 17 (50.0%) | 17 (50.0%) |
| 2-Person Household | 73 (100.0%) | 0 (0.0%) |
| 3-Person Household | 18 (46.2%) | 21 (53.8%) |
| 4+ Person Household | 3 (5.4%) | 52 (94.6%) |
| Total Housing Units | 111 (55.2%) | 90 (44.8%) |
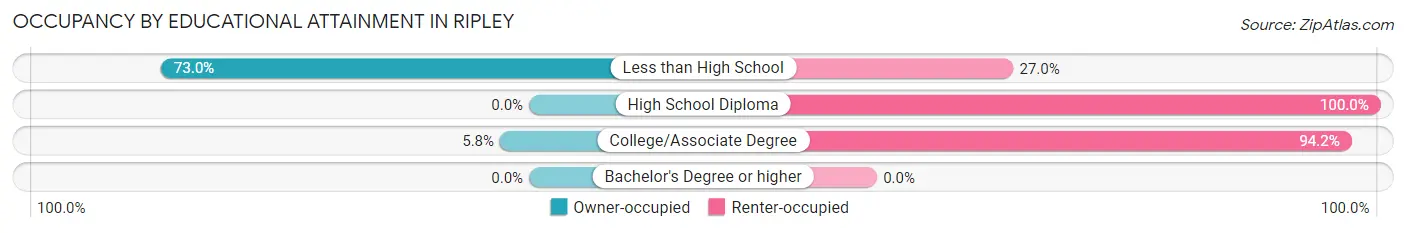
Occupancy by Educational Attainment in Ripley
| Household Size | Owner-occupied | Renter-occupied |
| Less than High School | 108 (73.0%) | 40 (27.0%) |
| High School Diploma | 0 (0.0%) | 1 (100.0%) |
| College/Associate Degree | 3 (5.8%) | 49 (94.2%) |
| Bachelor's Degree or higher | 0 (0.0%) | 0 (0.0%) |
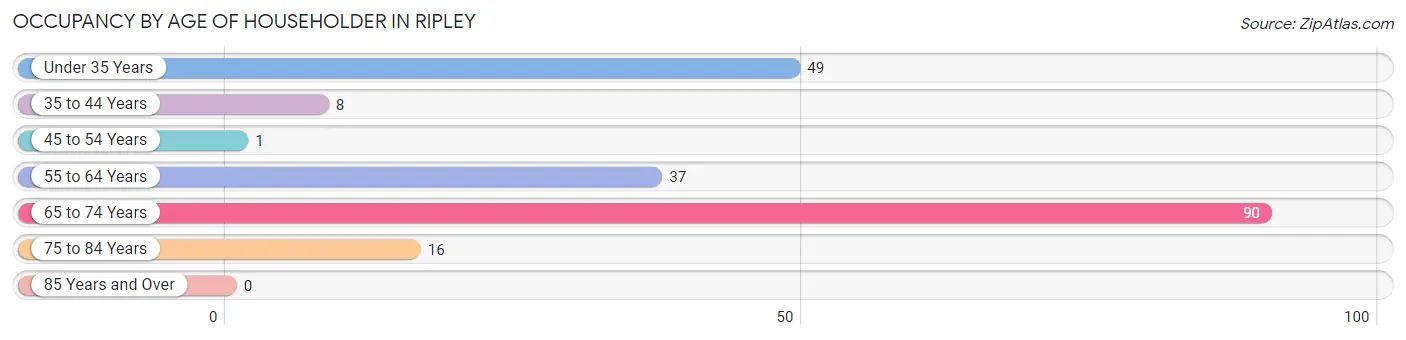
Occupancy by Age of Householder in Ripley
| Age Bracket | # Households | % Households |
| Under 35 Years | 49 | 24.4% |
| 35 to 44 Years | 8 | 4.0% |
| 45 to 54 Years | 1 | 0.5% |
| 55 to 64 Years | 37 | 18.4% |
| 65 to 74 Years | 90 | 44.8% |
| 75 to 84 Years | 16 | 8.0% |
| 85 Years and Over | 0 | 0.0% |
| Total | 201 | 100.0% |
Housing Finances in Ripley
Median Income by Occupancy in Ripley
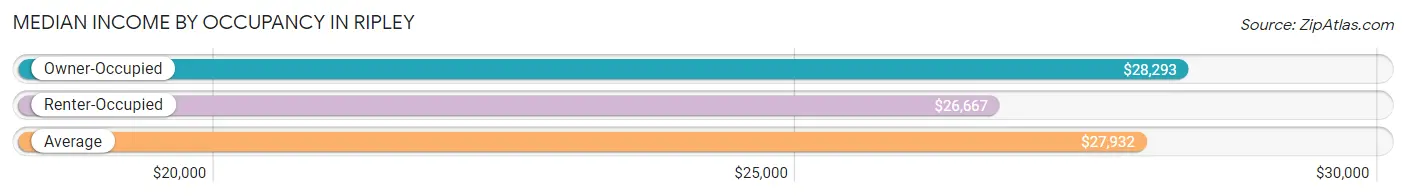
| Occupancy Type | # Households | Median Income |
| Owner-Occupied | 111 (55.2%) | $28,293 |
| Renter-Occupied | 90 (44.8%) | $26,667 |
| Average | 201 (100.0%) | $27,932 |
Occupancy by Householder Income Bracket in Ripley
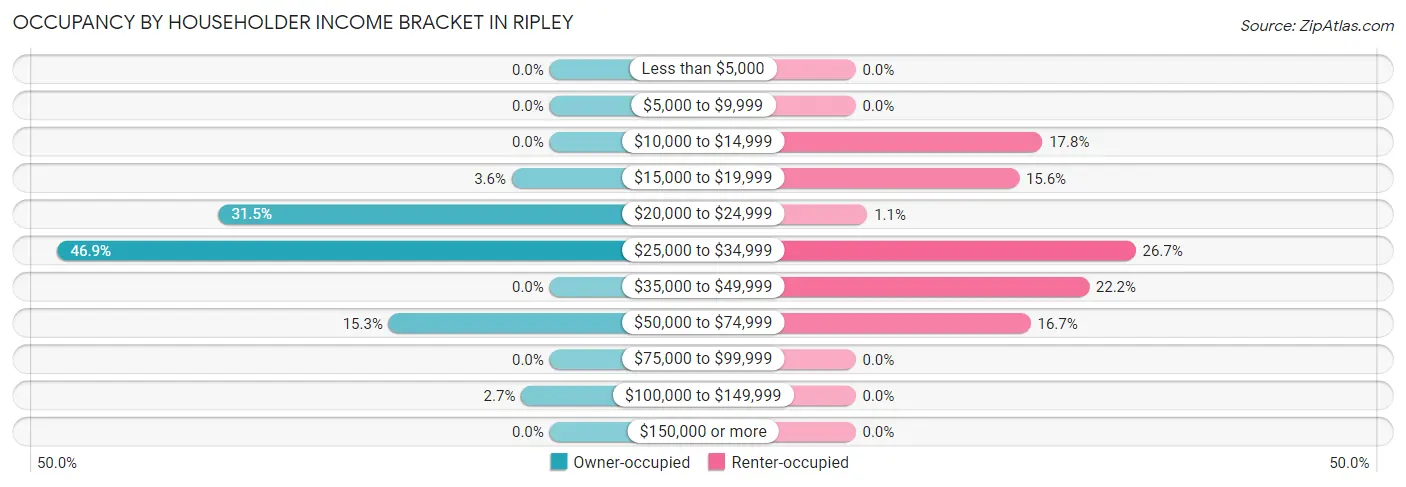
| Income Bracket | Owner-occupied | Renter-occupied |
| Less than $5,000 | 0 (0.0%) | 0 (0.0%) |
| $5,000 to $9,999 | 0 (0.0%) | 0 (0.0%) |
| $10,000 to $14,999 | 0 (0.0%) | 16 (17.8%) |
| $15,000 to $19,999 | 4 (3.6%) | 14 (15.6%) |
| $20,000 to $24,999 | 35 (31.5%) | 1 (1.1%) |
| $25,000 to $34,999 | 52 (46.9%) | 24 (26.7%) |
| $35,000 to $49,999 | 0 (0.0%) | 20 (22.2%) |
| $50,000 to $74,999 | 17 (15.3%) | 15 (16.7%) |
| $75,000 to $99,999 | 0 (0.0%) | 0 (0.0%) |
| $100,000 to $149,999 | 3 (2.7%) | 0 (0.0%) |
| $150,000 or more | 0 (0.0%) | 0 (0.0%) |
| Total | 111 (100.0%) | 90 (100.0%) |
Monthly Housing Cost Tiers in Ripley
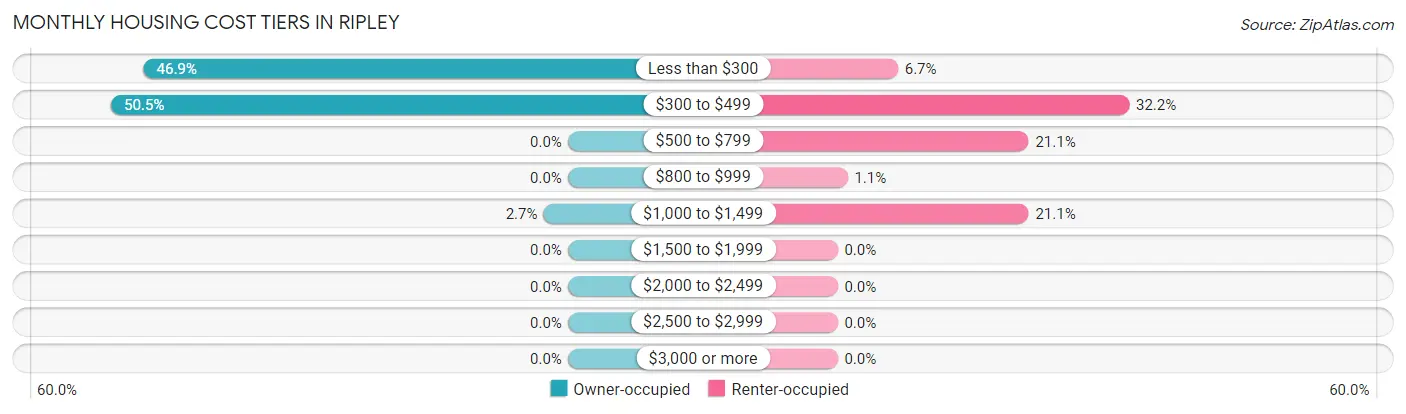
| Monthly Cost | Owner-occupied | Renter-occupied |
| Less than $300 | 52 (46.9%) | 6 (6.7%) |
| $300 to $499 | 56 (50.4%) | 29 (32.2%) |
| $500 to $799 | 0 (0.0%) | 19 (21.1%) |
| $800 to $999 | 0 (0.0%) | 1 (1.1%) |
| $1,000 to $1,499 | 3 (2.7%) | 19 (21.1%) |
| $1,500 to $1,999 | 0 (0.0%) | 0 (0.0%) |
| $2,000 to $2,499 | 0 (0.0%) | 0 (0.0%) |
| $2,500 to $2,999 | 0 (0.0%) | 0 (0.0%) |
| $3,000 or more | 0 (0.0%) | 0 (0.0%) |
| Total | 111 (100.0%) | 90 (100.0%) |
Physical Housing Characteristics in Ripley
Housing Structures in Ripley
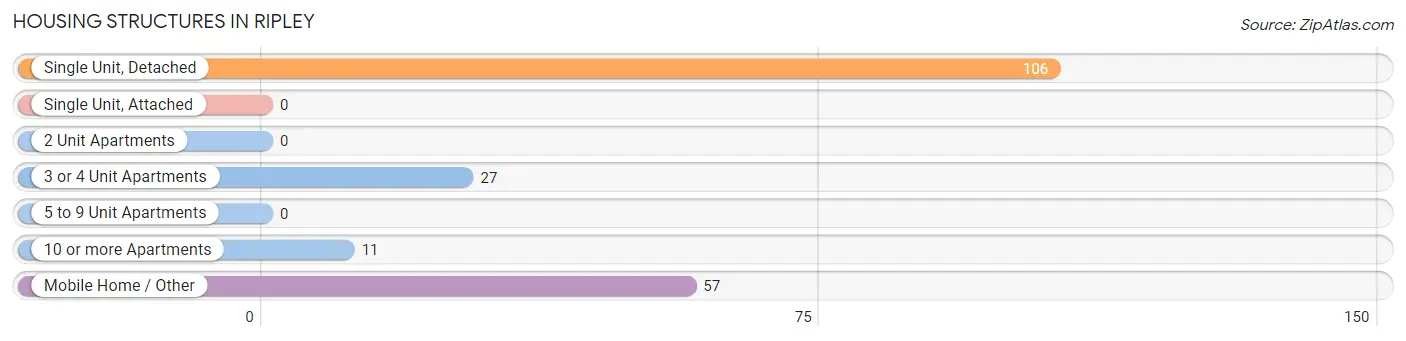
| Structure Type | # Housing Units | % Housing Units |
| Single Unit, Detached | 106 | 52.7% |
| Single Unit, Attached | 0 | 0.0% |
| 2 Unit Apartments | 0 | 0.0% |
| 3 or 4 Unit Apartments | 27 | 13.4% |
| 5 to 9 Unit Apartments | 0 | 0.0% |
| 10 or more Apartments | 11 | 5.5% |
| Mobile Home / Other | 57 | 28.4% |
| Total | 201 | 100.0% |
Housing Structures by Occupancy in Ripley
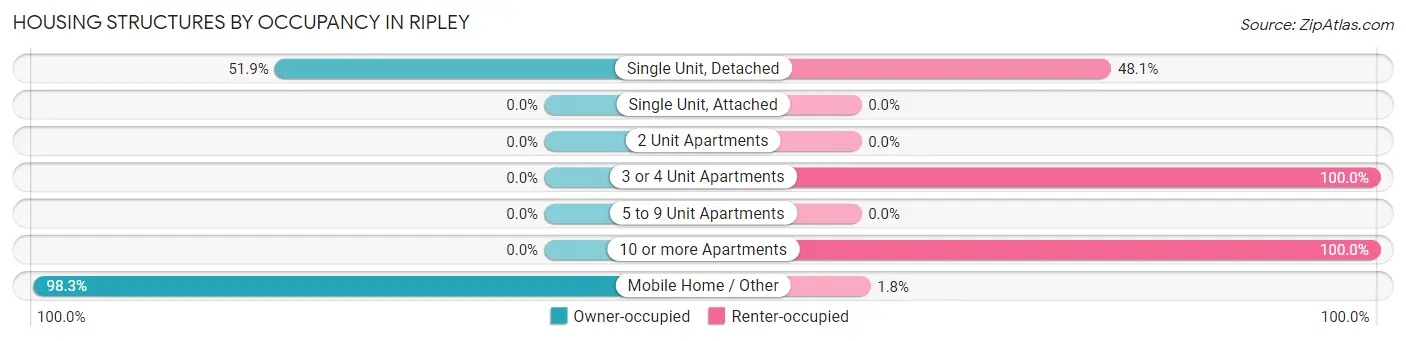
| Structure Type | Owner-occupied | Renter-occupied |
| Single Unit, Detached | 55 (51.9%) | 51 (48.1%) |
| Single Unit, Attached | 0 (0.0%) | 0 (0.0%) |
| 2 Unit Apartments | 0 (0.0%) | 0 (0.0%) |
| 3 or 4 Unit Apartments | 0 (0.0%) | 27 (100.0%) |
| 5 to 9 Unit Apartments | 0 (0.0%) | 0 (0.0%) |
| 10 or more Apartments | 0 (0.0%) | 11 (100.0%) |
| Mobile Home / Other | 56 (98.3%) | 1 (1.8%) |
| Total | 111 (55.2%) | 90 (44.8%) |
Housing Structures by Number of Rooms in Ripley
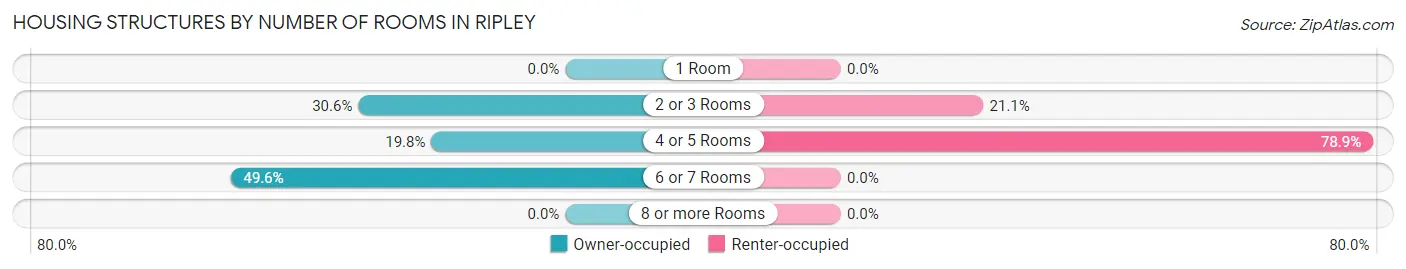
| Number of Rooms | Owner-occupied | Renter-occupied |
| 1 Room | 0 (0.0%) | 0 (0.0%) |
| 2 or 3 Rooms | 34 (30.6%) | 19 (21.1%) |
| 4 or 5 Rooms | 22 (19.8%) | 71 (78.9%) |
| 6 or 7 Rooms | 55 (49.5%) | 0 (0.0%) |
| 8 or more Rooms | 0 (0.0%) | 0 (0.0%) |
| Total | 111 (100.0%) | 90 (100.0%) |
Housing Structure by Heating Type in Ripley
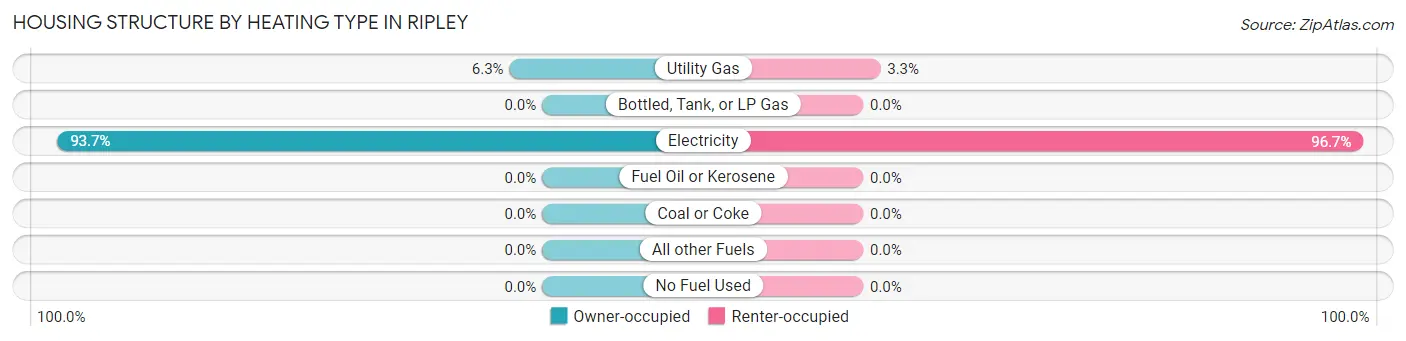
| Heating Type | Owner-occupied | Renter-occupied |
| Utility Gas | 7 (6.3%) | 3 (3.3%) |
| Bottled, Tank, or LP Gas | 0 (0.0%) | 0 (0.0%) |
| Electricity | 104 (93.7%) | 87 (96.7%) |
| Fuel Oil or Kerosene | 0 (0.0%) | 0 (0.0%) |
| Coal or Coke | 0 (0.0%) | 0 (0.0%) |
| All other Fuels | 0 (0.0%) | 0 (0.0%) |
| No Fuel Used | 0 (0.0%) | 0 (0.0%) |
| Total | 111 (100.0%) | 90 (100.0%) |
Household Vehicle Usage in Ripley
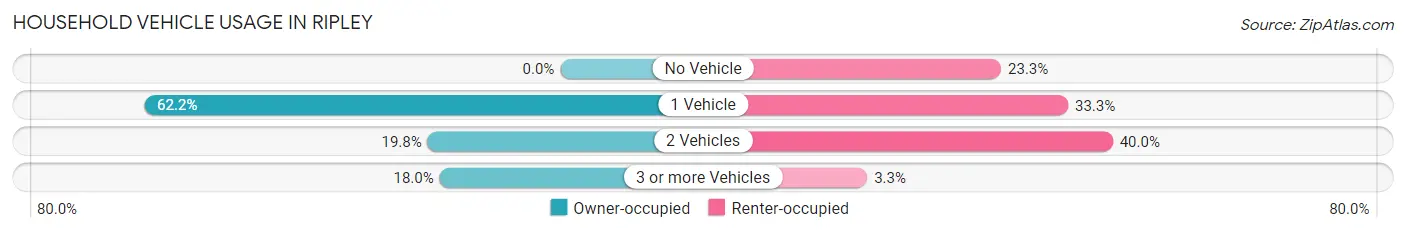
| Vehicles per Household | Owner-occupied | Renter-occupied |
| No Vehicle | 0 (0.0%) | 21 (23.3%) |
| 1 Vehicle | 69 (62.2%) | 30 (33.3%) |
| 2 Vehicles | 22 (19.8%) | 36 (40.0%) |
| 3 or more Vehicles | 20 (18.0%) | 3 (3.3%) |
| Total | 111 (100.0%) | 90 (100.0%) |
Real Estate & Mortgages in Ripley
Real Estate and Mortgage Overview in Ripley
| Characteristic | Without Mortgage | With Mortgage |
| Housing Units | 108 | 3 |
| Median Property Value | - | - |
| Median Household Income | $28,221 | $0 |
| Monthly Housing Costs | $404 | $0 |
| Real Estate Taxes | $455 | $0 |
Property Value by Mortgage Status in Ripley
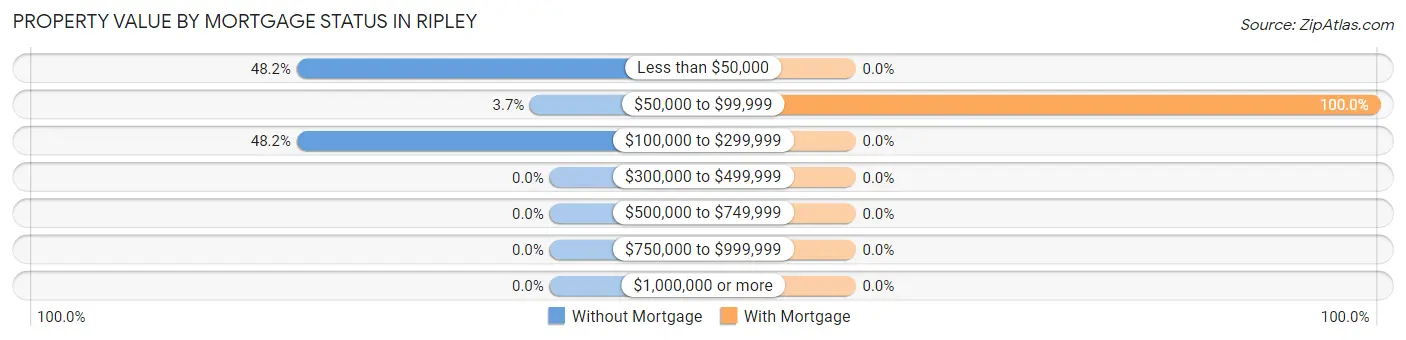
| Property Value | Without Mortgage | With Mortgage |
| Less than $50,000 | 52 (48.1%) | 0 (0.0%) |
| $50,000 to $99,999 | 4 (3.7%) | 3 (100.0%) |
| $100,000 to $299,999 | 52 (48.1%) | 0 (0.0%) |
| $300,000 to $499,999 | 0 (0.0%) | 0 (0.0%) |
| $500,000 to $749,999 | 0 (0.0%) | 0 (0.0%) |
| $750,000 to $999,999 | 0 (0.0%) | 0 (0.0%) |
| $1,000,000 or more | 0 (0.0%) | 0 (0.0%) |
| Total | 108 (100.0%) | 3 (100.0%) |
Household Income by Mortgage Status in Ripley
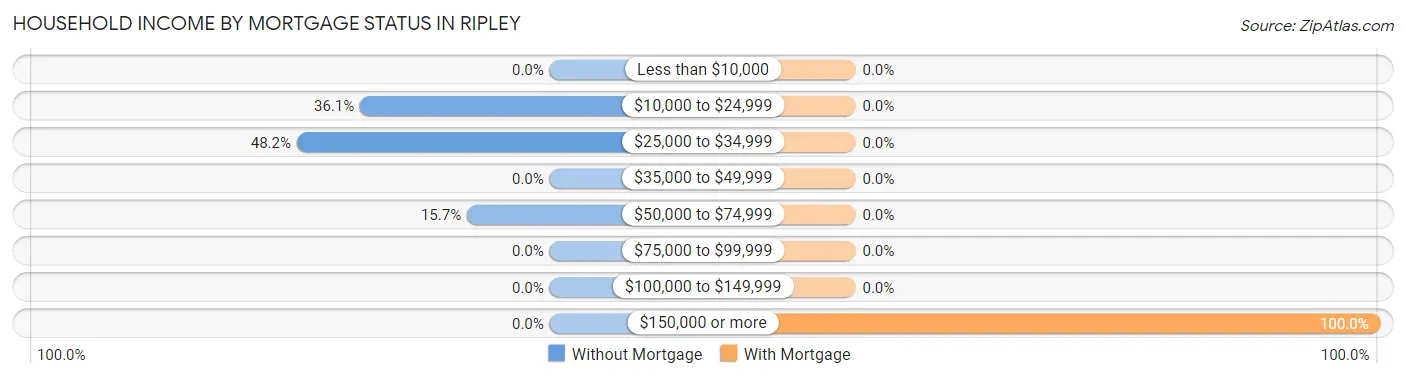
| Household Income | Without Mortgage | With Mortgage |
| Less than $10,000 | 0 (0.0%) | 0 (0.0%) |
| $10,000 to $24,999 | 39 (36.1%) | 0 (0.0%) |
| $25,000 to $34,999 | 52 (48.1%) | 0 (0.0%) |
| $35,000 to $49,999 | 0 (0.0%) | 0 (0.0%) |
| $50,000 to $74,999 | 17 (15.7%) | 0 (0.0%) |
| $75,000 to $99,999 | 0 (0.0%) | 0 (0.0%) |
| $100,000 to $149,999 | 0 (0.0%) | 0 (0.0%) |
| $150,000 or more | 0 (0.0%) | 3 (100.0%) |
| Total | 108 (100.0%) | 3 (100.0%) |
Property Value to Household Income Ratio in Ripley
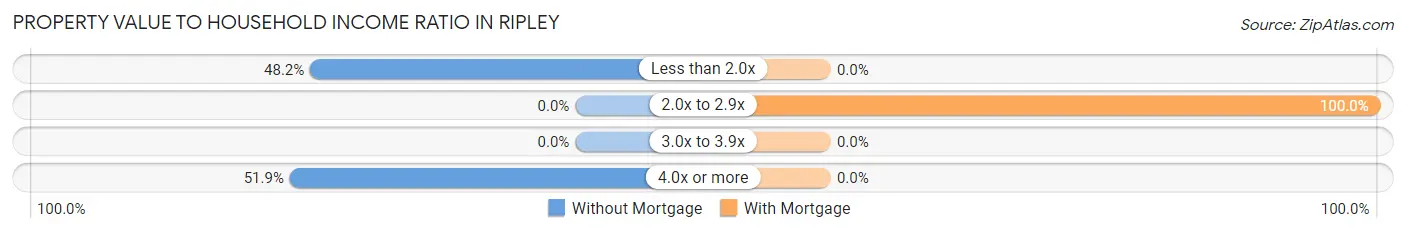
| Value-to-Income Ratio | Without Mortgage | With Mortgage |
| Less than 2.0x | 52 (48.1%) | 0 (0.0%) |
| 2.0x to 2.9x | 0 (0.0%) | 3 (100.0%) |
| 3.0x to 3.9x | 0 (0.0%) | 0 (0.0%) |
| 4.0x or more | 56 (51.8%) | 0 (0.0%) |
| Total | 108 (100.0%) | 3 (100.0%) |
Real Estate Taxes by Mortgage Status in Ripley
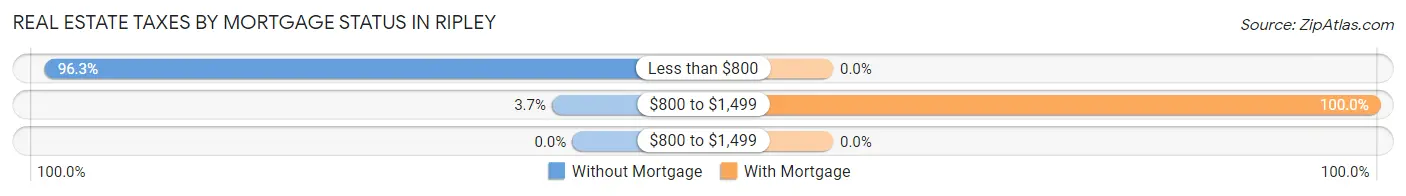
| Property Taxes | Without Mortgage | With Mortgage |
| Less than $800 | 104 (96.3%) | 0 (0.0%) |
| $800 to $1,499 | 4 (3.7%) | 3 (100.0%) |
| $800 to $1,499 | 0 (0.0%) | 0 (0.0%) |
| Total | 108 (100.0%) | 3 (100.0%) |
Health & Disability in Ripley
Health Insurance Coverage by Age in Ripley
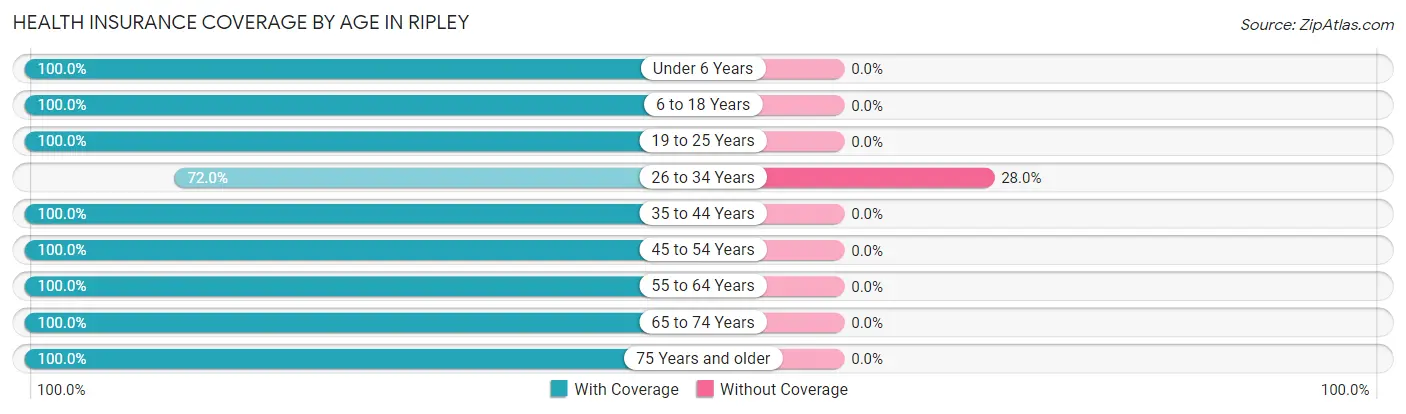
| Age Bracket | With Coverage | Without Coverage |
| Under 6 Years | 94 (100.0%) | 0 (0.0%) |
| 6 to 18 Years | 144 (100.0%) | 0 (0.0%) |
| 19 to 25 Years | 52 (100.0%) | 0 (0.0%) |
| 26 to 34 Years | 67 (72.0%) | 26 (28.0%) |
| 35 to 44 Years | 8 (100.0%) | 0 (0.0%) |
| 45 to 54 Years | 18 (100.0%) | 0 (0.0%) |
| 55 to 64 Years | 43 (100.0%) | 0 (0.0%) |
| 65 to 74 Years | 90 (100.0%) | 0 (0.0%) |
| 75 Years and older | 71 (100.0%) | 0 (0.0%) |
| Total | 587 (95.8%) | 26 (4.2%) |
Health Insurance Coverage by Citizenship Status in Ripley
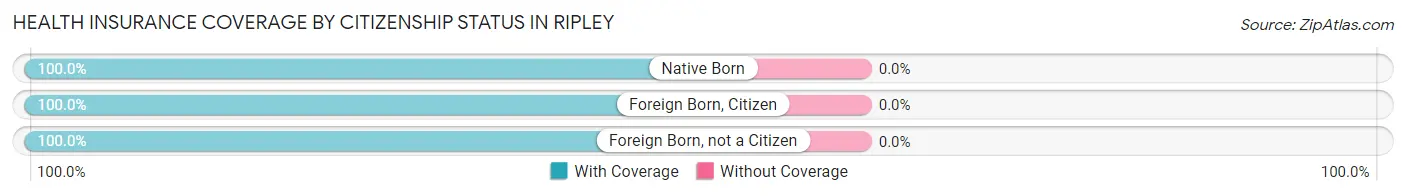
| Citizenship Status | With Coverage | Without Coverage |
| Native Born | 94 (100.0%) | 0 (0.0%) |
| Foreign Born, Citizen | 144 (100.0%) | 0 (0.0%) |
| Foreign Born, not a Citizen | 52 (100.0%) | 0 (0.0%) |
Health Insurance Coverage by Household Income in Ripley
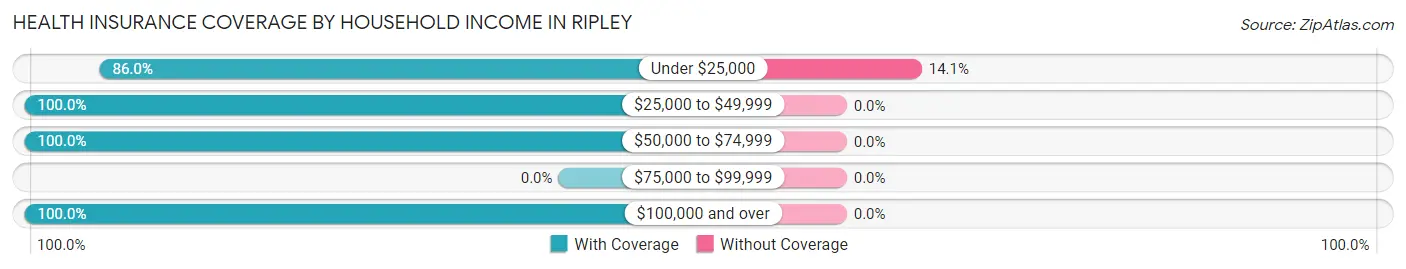
| Household Income | With Coverage | Without Coverage |
| Under $25,000 | 159 (86.0%) | 26 (14.1%) |
| $25,000 to $49,999 | 328 (100.0%) | 0 (0.0%) |
| $50,000 to $74,999 | 85 (100.0%) | 0 (0.0%) |
| $75,000 to $99,999 | 0 (0.0%) | 0 (0.0%) |
| $100,000 and over | 15 (100.0%) | 0 (0.0%) |
Public vs Private Health Insurance Coverage by Age in Ripley
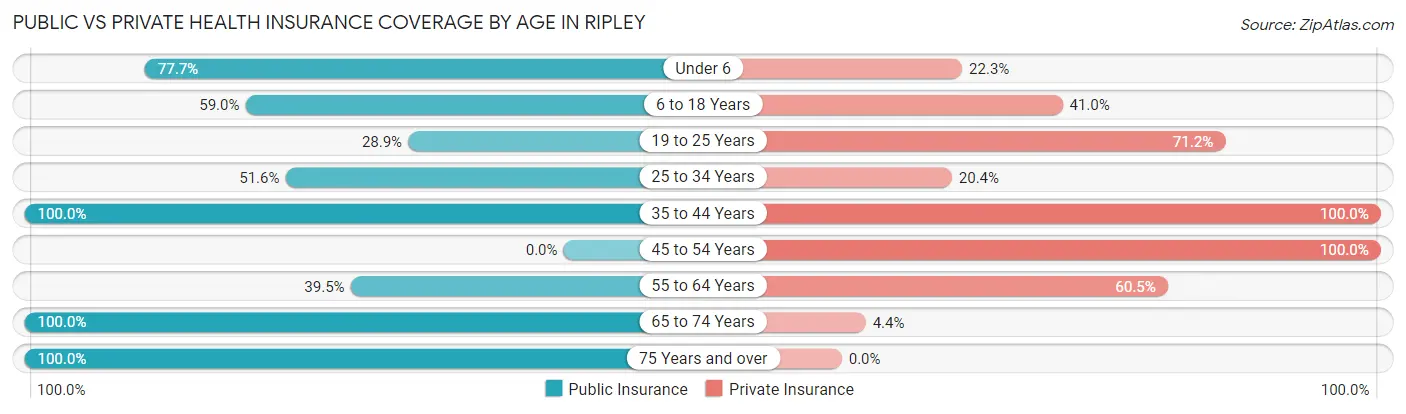
| Age Bracket | Public Insurance | Private Insurance |
| Under 6 | 73 (77.7%) | 21 (22.3%) |
| 6 to 18 Years | 85 (59.0%) | 59 (41.0%) |
| 19 to 25 Years | 15 (28.8%) | 37 (71.2%) |
| 25 to 34 Years | 48 (51.6%) | 19 (20.4%) |
| 35 to 44 Years | 8 (100.0%) | 8 (100.0%) |
| 45 to 54 Years | 0 (0.0%) | 18 (100.0%) |
| 55 to 64 Years | 17 (39.5%) | 26 (60.5%) |
| 65 to 74 Years | 90 (100.0%) | 4 (4.4%) |
| 75 Years and over | 71 (100.0%) | 0 (0.0%) |
| Total | 407 (66.4%) | 192 (31.3%) |
Disability Status by Sex by Age in Ripley
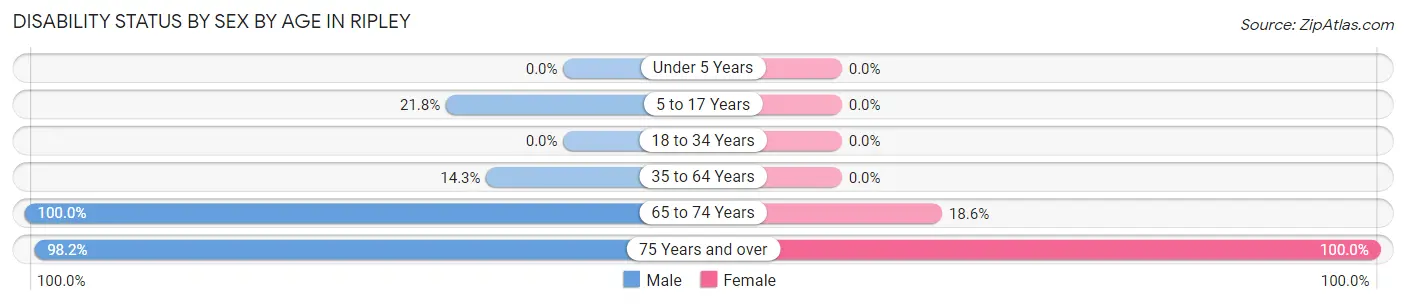
| Age Bracket | Male | Female |
| Under 5 Years | 0 (0.0%) | 0 (0.0%) |
| 5 to 17 Years | 22 (21.8%) | 0 (0.0%) |
| 18 to 34 Years | 0 (0.0%) | 0 (0.0%) |
| 35 to 64 Years | 3 (14.3%) | 0 (0.0%) |
| 65 to 74 Years | 4 (100.0%) | 16 (18.6%) |
| 75 Years and over | 55 (98.2%) | 15 (100.0%) |
Disability Class by Sex by Age in Ripley
Disability Class: Hearing Difficulty
| Age Bracket | Male | Female |
| Under 5 Years | 0 (0.0%) | 0 (0.0%) |
| 5 to 17 Years | 0 (0.0%) | 0 (0.0%) |
| 18 to 34 Years | 0 (0.0%) | 0 (0.0%) |
| 35 to 64 Years | 0 (0.0%) | 0 (0.0%) |
| 65 to 74 Years | 0 (0.0%) | 0 (0.0%) |
| 75 Years and over | 0 (0.0%) | 0 (0.0%) |
Disability Class: Vision Difficulty
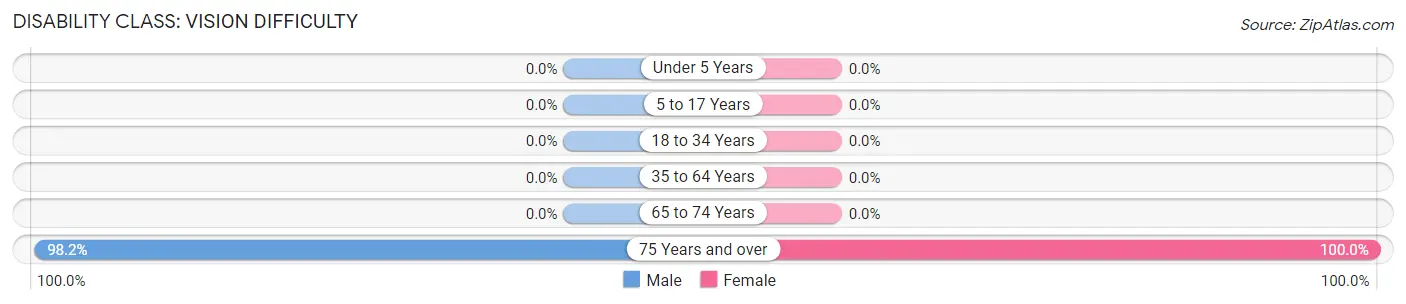
| Age Bracket | Male | Female |
| Under 5 Years | 0 (0.0%) | 0 (0.0%) |
| 5 to 17 Years | 0 (0.0%) | 0 (0.0%) |
| 18 to 34 Years | 0 (0.0%) | 0 (0.0%) |
| 35 to 64 Years | 0 (0.0%) | 0 (0.0%) |
| 65 to 74 Years | 0 (0.0%) | 0 (0.0%) |
| 75 Years and over | 55 (98.2%) | 15 (100.0%) |
Disability Class: Cognitive Difficulty
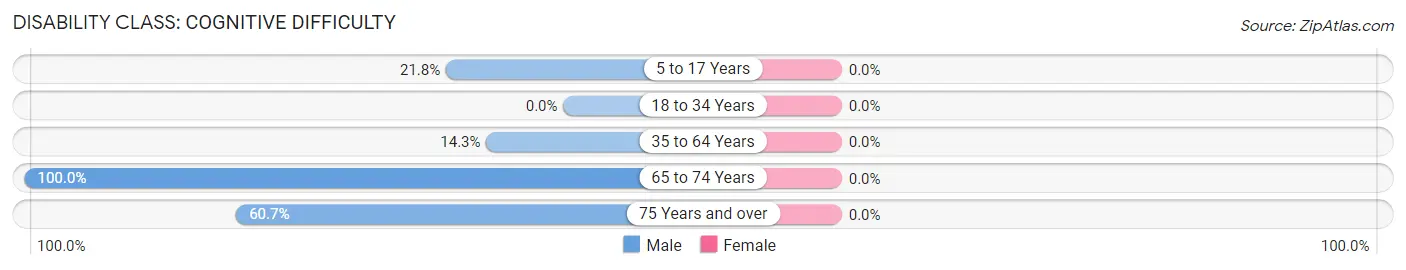
| Age Bracket | Male | Female |
| 5 to 17 Years | 22 (21.8%) | 0 (0.0%) |
| 18 to 34 Years | 0 (0.0%) | 0 (0.0%) |
| 35 to 64 Years | 3 (14.3%) | 0 (0.0%) |
| 65 to 74 Years | 4 (100.0%) | 0 (0.0%) |
| 75 Years and over | 34 (60.7%) | 0 (0.0%) |
Disability Class: Ambulatory Difficulty
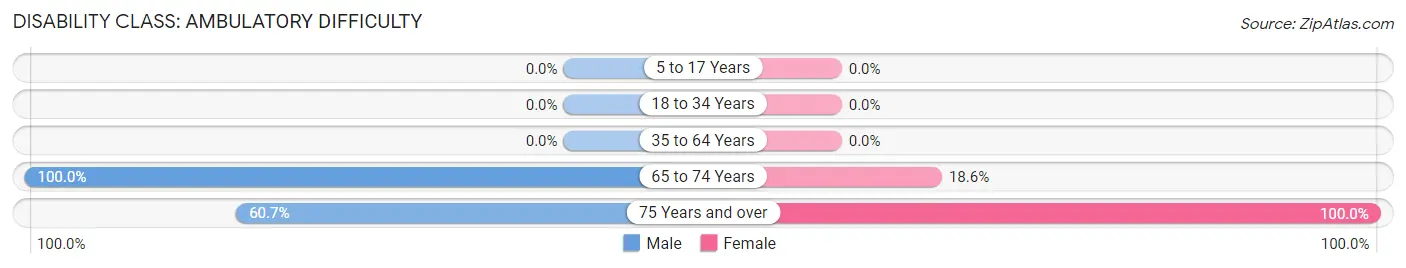
| Age Bracket | Male | Female |
| 5 to 17 Years | 0 (0.0%) | 0 (0.0%) |
| 18 to 34 Years | 0 (0.0%) | 0 (0.0%) |
| 35 to 64 Years | 0 (0.0%) | 0 (0.0%) |
| 65 to 74 Years | 4 (100.0%) | 16 (18.6%) |
| 75 Years and over | 34 (60.7%) | 15 (100.0%) |
Disability Class: Self-Care Difficulty
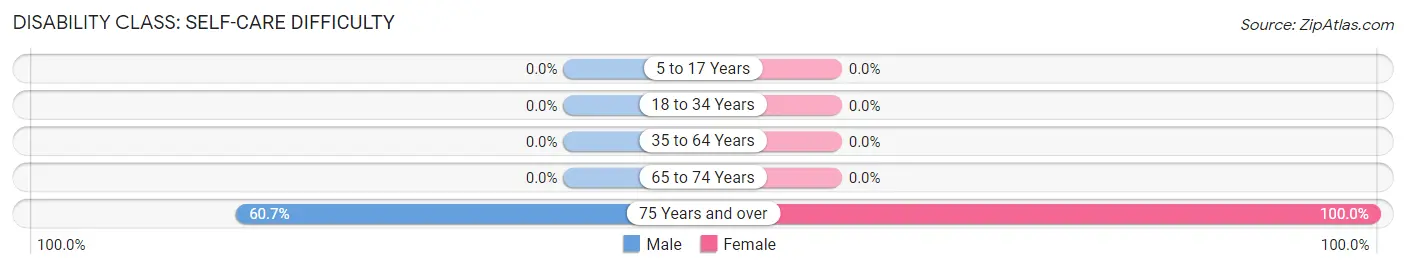
| Age Bracket | Male | Female |
| 5 to 17 Years | 0 (0.0%) | 0 (0.0%) |
| 18 to 34 Years | 0 (0.0%) | 0 (0.0%) |
| 35 to 64 Years | 0 (0.0%) | 0 (0.0%) |
| 65 to 74 Years | 0 (0.0%) | 0 (0.0%) |
| 75 Years and over | 34 (60.7%) | 15 (100.0%) |
Technology Access in Ripley
Computing Device Access in Ripley
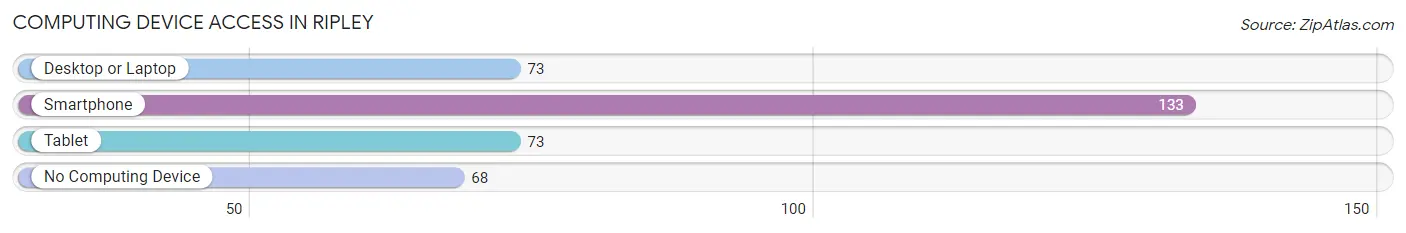
| Device Type | # Households | % Households |
| Desktop or Laptop | 73 | 36.3% |
| Smartphone | 133 | 66.2% |
| Tablet | 73 | 36.3% |
| No Computing Device | 68 | 33.8% |
| Total | 201 | 100.0% |
Internet Access in Ripley
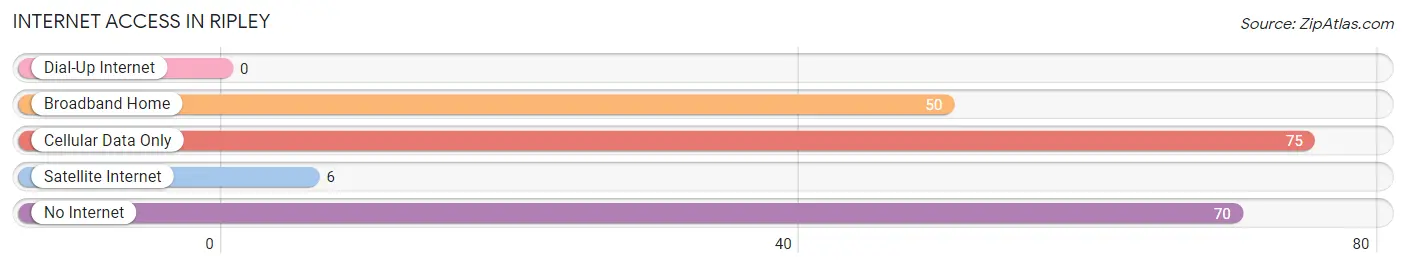
| Internet Type | # Households | % Households |
| Dial-Up Internet | 0 | 0.0% |
| Broadband Home | 50 | 24.9% |
| Cellular Data Only | 75 | 37.3% |
| Satellite Internet | 6 | 3.0% |
| No Internet | 70 | 34.8% |
| Total | 201 | 100.0% |
Ripley Summary
Ripley is a small unincorporated community located in the foothills of the Sierra Nevada Mountains in California. It is situated in the Sierra Valley, which is a large agricultural valley located in the northeastern part of the state. The community is located in Sierra County, which is one of the least populated counties in California. The population of Ripley was estimated to be around 200 people in 2020.
History
Ripley was founded in 1852 by a group of miners who were searching for gold in the Sierra Nevada Mountains. The miners named the town after a local prospector, William Ripley. The town quickly grew and by the late 1800s, it had become a bustling mining town with a population of over 1,000 people. The town was home to several saloons, stores, and a post office.
In the early 1900s, the mining industry began to decline and the population of Ripley began to dwindle. By the 1950s, the population had dropped to just over 200 people. Despite the decline in population, the town still maintained its small-town charm and was home to several businesses, including a general store, a gas station, and a post office.
Geography
Ripley is located in the Sierra Valley, which is a large agricultural valley located in the northeastern part of California. The valley is surrounded by the Sierra Nevada Mountains to the east and the Cascade Range to the west. The valley is home to several small towns, including Loyalton, Sierraville, and Calpine. The town of Ripley is situated at an elevation of 4,000 feet and is located approximately 40 miles northeast of the city of Reno, Nevada.
Economy
Ripley’s economy is largely based on agriculture and tourism. The town is home to several farms and ranches that produce a variety of crops, including hay, alfalfa, and wheat. The town is also home to several tourist attractions, including the Sierra Valley National Wildlife Refuge, which is a popular destination for bird watching and hiking.
Demographics
Ripley is a small, rural community with a population of approximately 200 people. The town is predominantly white, with a small Hispanic population. The median household income in Ripley is $45,000, which is slightly lower than the median household income in California. The town has a high rate of poverty, with nearly 25% of the population living below the poverty line.
Conclusion
Ripley is a small, rural community located in the Sierra Valley of California. The town has a long history of mining and agriculture, and today it is largely supported by agriculture and tourism. The population of Ripley is predominantly white, with a small Hispanic population. The town has a high rate of poverty, with nearly 25% of the population living below the poverty line. Despite its small size, Ripley is a vibrant community with a rich history and culture.
Common Questions
What is Per Capita Income in Ripley?
Per Capita income in Ripley is $10,545.
What is the Median Family Income in Ripley?
Median Family Income in Ripley is $28,705.
What is the Median Household income in Ripley?
Median Household Income in Ripley is $27,932.
What is Inequality or Gini Index in Ripley?
Inequality or Gini Index in Ripley is 0.28.
What is the Total Population of Ripley?
Total Population of Ripley is 614.
What is the Total Male Population of Ripley?
Total Male Population of Ripley is 279.
What is the Total Female Population of Ripley?
Total Female Population of Ripley is 335.
What is the Ratio of Males per 100 Females in Ripley?
There are 83.28 Males per 100 Females in Ripley.
What is the Ratio of Females per 100 Males in Ripley?
There are 120.07 Females per 100 Males in Ripley.
What is the Median Population Age in Ripley?
Median Population Age in Ripley is 27.7 Years.
What is the Average Family Size in Ripley
Average Family Size in Ripley is 3.3 People.
What is the Average Household Size in Ripley
Average Household Size in Ripley is 3.0 People.
How Large is the Labor Force in Ripley?
There are 135 People in the Labor Forcein in Ripley.
What is the Percentage of People in the Labor Force in Ripley?
33.2% of People are in the Labor Force in Ripley.
What is the Unemployment Rate in Ripley?
Unemployment Rate in Ripley is 12.6%.