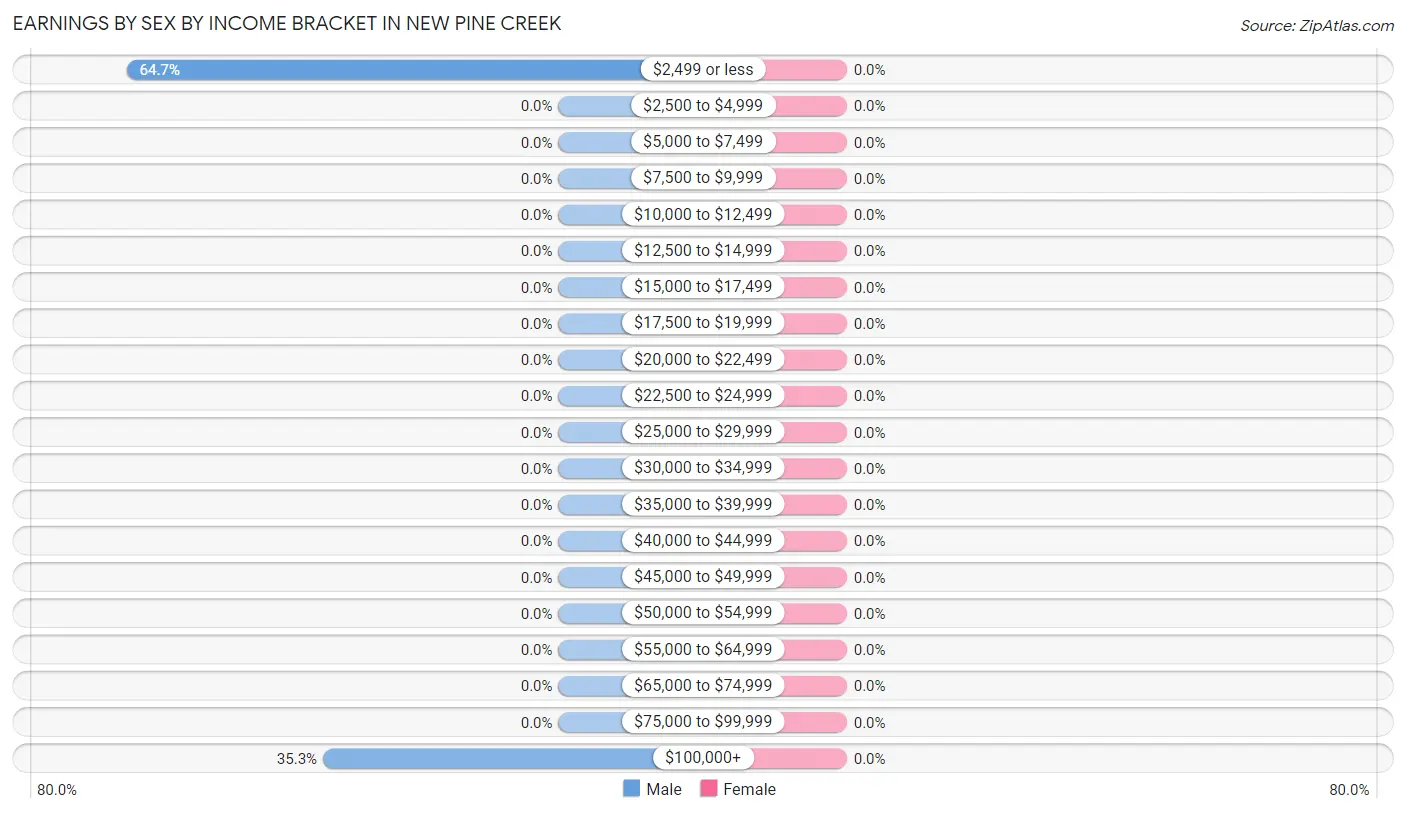
Earnings by Sex by Income Bracket in New Pine Creek
Income
Male
Female
$2,499 or less
11 (64.7%)
0 (0.0%)
$2,500 to $4,999
0 (0.0%)
0 (0.0%)
$5,000 to $7,499
0 (0.0%)
0 (0.0%)
$7,500 to $9,999
0 (0.0%)
0 (0.0%)
$10,000 to $12,499
0 (0.0%)
0 (0.0%)
$12,500 to $14,999
0 (0.0%)
0 (0.0%)
$15,000 to $17,499
0 (0.0%)
0 (0.0%)
$17,500 to $19,999
0 (0.0%)
0 (0.0%)
$20,000 to $22,499
0 (0.0%)
0 (0.0%)
$22,500 to $24,999
0 (0.0%)
0 (0.0%)
$25,000 to $29,999
0 (0.0%)
0 (0.0%)
$30,000 to $34,999
0 (0.0%)
0 (0.0%)
$35,000 to $39,999
0 (0.0%)
0 (0.0%)
$40,000 to $44,999
0 (0.0%)
0 (0.0%)
$45,000 to $49,999
0 (0.0%)
0 (0.0%)
$50,000 to $54,999
0 (0.0%)
0 (0.0%)
$55,000 to $64,999
0 (0.0%)
0 (0.0%)
$65,000 to $74,999
0 (0.0%)
0 (0.0%)
$75,000 to $99,999
0 (0.0%)
0 (0.0%)
$100,000+
6 (35.3%)
0 (0.0%)
Total
17 (100.0%)
0 (0.0%)
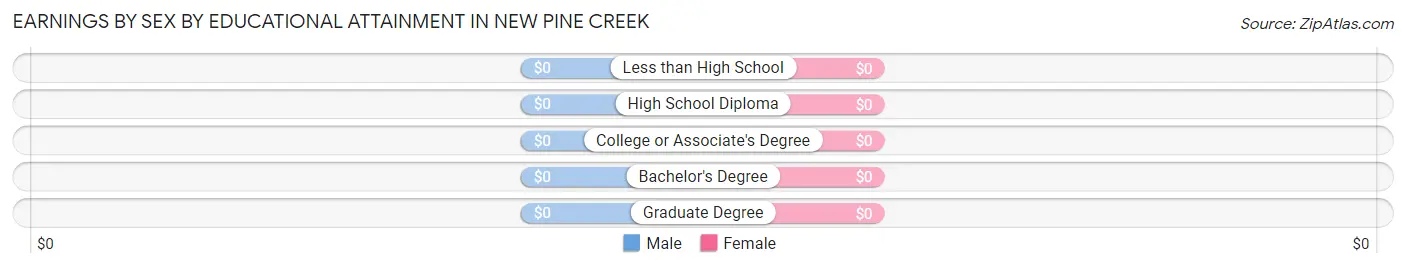
Earnings by Sex by Educational Attainment in New Pine Creek
Educational Attainment
Male Income
Female Income
Less than High School
-
-
High School Diploma
-
-
College or Associate's Degree
-
-
Bachelor's Degree
-
-
Graduate Degree
-
-
Total
-
-
Family Income in New Pine Creek
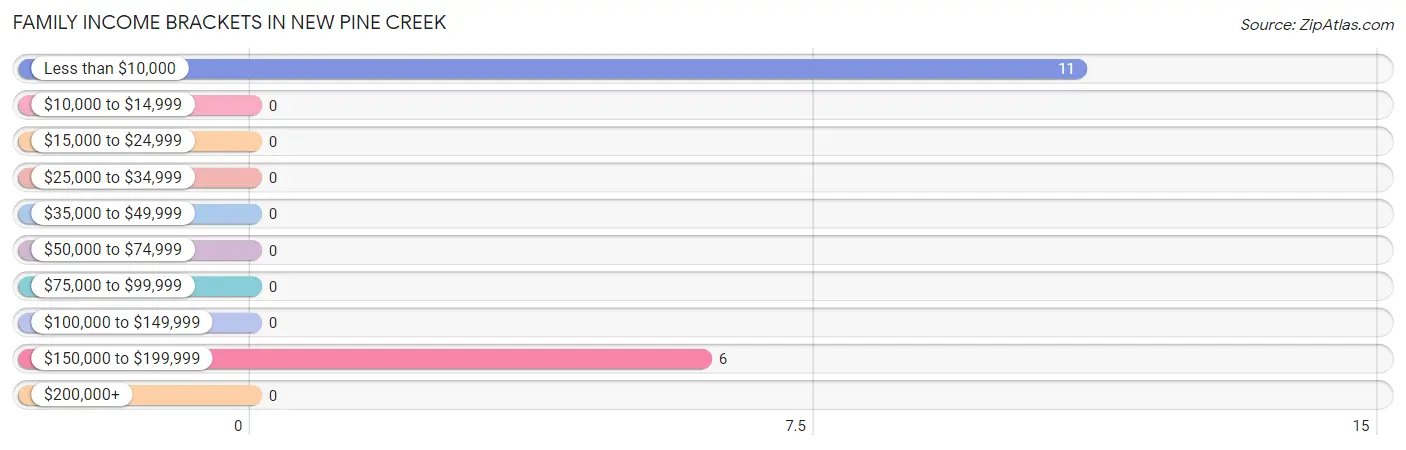
Family Income Brackets in New Pine Creek
According to the New Pine Creek family income data, there are 11 families falling into the less than $10,000 income range, which is the most common income bracket and makes up 64.7% of all families.
Income Bracket
# Families
% Families
Less than $10,000
11
64.7%
$10,000 to $14,999
0
0.0%
$15,000 to $24,999
0
0.0%
$25,000 to $34,999
0
0.0%
$35,000 to $49,999
0
0.0%
$50,000 to $74,999
0
0.0%
$75,000 to $99,999
0
0.0%
$100,000 to $149,999
0
0.0%
$150,000 to $199,999
6
35.3%
$200,000+
0
0.0%
Family Income by Famaliy Size in New Pine Creek
Income Bracket
# Families
Median Income
2-Person Families
11 (64.7%)
$0
3-Person Families
0 (0.0%)
$0
4-Person Families
0 (0.0%)
$0
5-Person Families
6 (35.3%)
$0
6-Person Families
0 (0.0%)
$0
7+ Person Families
0 (0.0%)
$0
Total
17 (100.0%)
$0
Family Income by Number of Earners in New Pine Creek
Number of Earners
# Families
Median Income
No Earners
0 (0.0%)
$0
1 Earner
17 (100.0%)
$0
2 Earners
0 (0.0%)
$0
3+ Earners
0 (0.0%)
$0
Total
17 (100.0%)
$0
Household Income in New Pine Creek
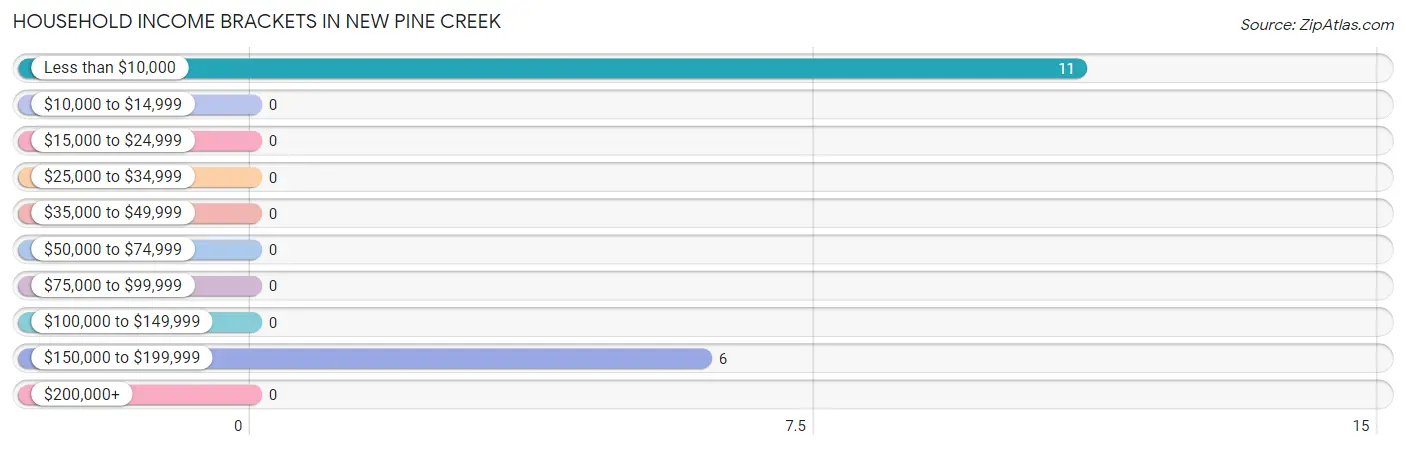
Household Income Brackets in New Pine Creek
With 11 households falling in the category, the less than $10,000 income range is the most frequent in New Pine Creek, accounting for 64.7% of all households.
Income Bracket
# Households
% Households
Less than $10,000
11
64.7%
$10,000 to $14,999
0
0.0%
$15,000 to $24,999
0
0.0%
$25,000 to $34,999
0
0.0%
$35,000 to $49,999
0
0.0%
$50,000 to $74,999
0
0.0%
$75,000 to $99,999
0
0.0%
$100,000 to $149,999
0
0.0%
$150,000 to $199,999
6
35.3%
$200,000+
0
0.0%
Household Income by Householder Age in New Pine Creek
Income Bracket
# Households
Median Income
15 to 24 Years
0 (0.0%)
$0
25 to 44 Years
17 (100.0%)
$0
45 to 64 Years
0 (0.0%)
$0
65+ Years
0 (0.0%)
$0
Total
17 (100.0%)
$0
Poverty in New Pine Creek
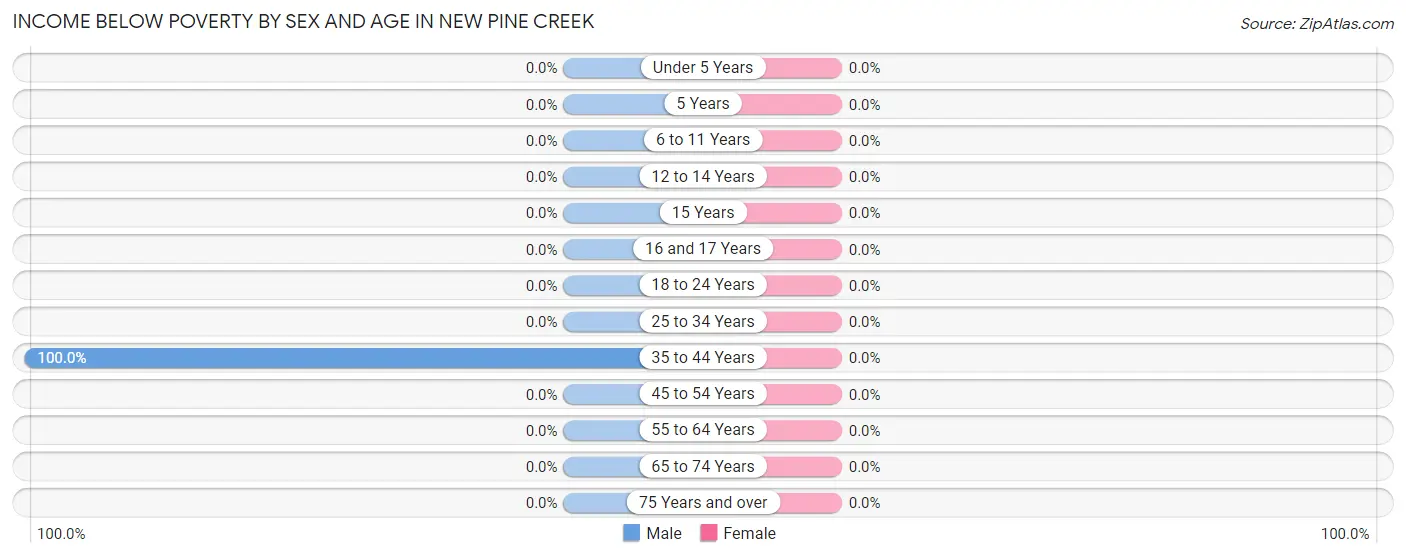
Income Below Poverty by Sex and Age in New Pine Creek
Age Bracket
Male
Female
Under 5 Years
0 (0.0%)
0 (0.0%)
5 Years
0 (0.0%)
0 (0.0%)
6 to 11 Years
0 (0.0%)
0 (0.0%)
12 to 14 Years
0 (0.0%)
0 (0.0%)
15 Years
0 (0.0%)
0 (0.0%)
16 and 17 Years
0 (0.0%)
0 (0.0%)
18 to 24 Years
0 (0.0%)
0 (0.0%)
25 to 34 Years
0 (0.0%)
0 (0.0%)
35 to 44 Years
27 (100.0%)
0 (0.0%)
45 to 54 Years
0 (0.0%)
0 (0.0%)
55 to 64 Years
0 (0.0%)
0 (0.0%)
65 to 74 Years
0 (0.0%)
0 (0.0%)
75 Years and over
0 (0.0%)
0 (0.0%)
Total
27 (55.1%)
0 (0.0%)
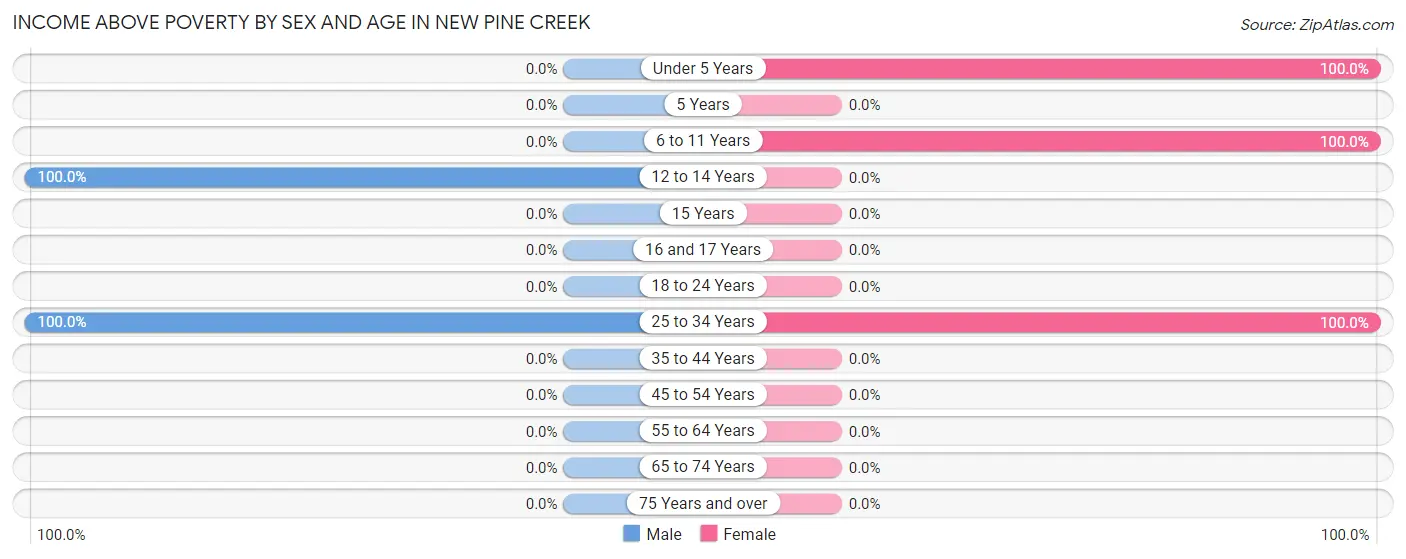
Income Above Poverty by Sex and Age in New Pine Creek
According to the poverty statistics in New Pine Creek, males aged 12 to 14 years and females aged under 5 years are the age groups that are most secure financially, with 100.0% of males and 100.0% of females in these age groups living above the poverty line.
Age Bracket
Male
Female
Under 5 Years
0 (0.0%)
8 (100.0%)
5 Years
0 (0.0%)
0 (0.0%)
6 to 11 Years
0 (0.0%)
13 (100.0%)
12 to 14 Years
16 (100.0%)
0 (0.0%)
15 Years
0 (0.0%)
0 (0.0%)
16 and 17 Years
0 (0.0%)
0 (0.0%)
18 to 24 Years
0 (0.0%)
0 (0.0%)
25 to 34 Years
6 (100.0%)
9 (100.0%)
35 to 44 Years
0 (0.0%)
0 (0.0%)
45 to 54 Years
0 (0.0%)
0 (0.0%)
55 to 64 Years
0 (0.0%)
0 (0.0%)
65 to 74 Years
0 (0.0%)
0 (0.0%)
75 Years and over
0 (0.0%)
0 (0.0%)
Total
22 (44.9%)
30 (100.0%)
Income Below Poverty Among Married-Couple Families in New Pine Creek
Children
Above Poverty
Below Poverty
No Children
0 (0.0%)
0 (0.0%)
1 or 2 Children
0 (0.0%)
0 (0.0%)
3 or 4 Children
6 (100.0%)
0 (0.0%)
5 or more Children
0 (0.0%)
0 (0.0%)
Total
6 (100.0%)
0 (0.0%)
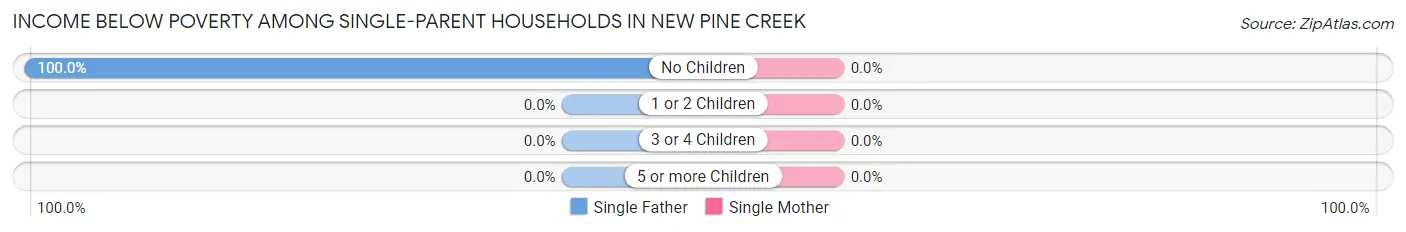
Income Below Poverty Among Single-Parent Households in New Pine Creek
Children
Single Father
Single Mother
No Children
11 (100.0%)
0 (0.0%)
1 or 2 Children
0 (0.0%)
0 (0.0%)
3 or 4 Children
0 (0.0%)
0 (0.0%)
5 or more Children
0 (0.0%)
0 (0.0%)
Total
11 (100.0%)
0 (0.0%)
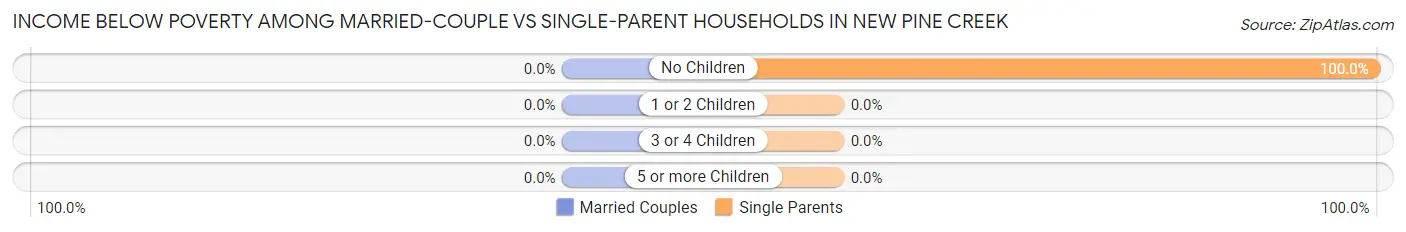
Income Below Poverty Among Married-Couple vs Single-Parent Households in New Pine Creek
Children
Married-Couple Families
Single-Parent Households
No Children
0 (0.0%)
11 (100.0%)
1 or 2 Children
0 (0.0%)
0 (0.0%)
3 or 4 Children
0 (0.0%)
0 (0.0%)
5 or more Children
0 (0.0%)
0 (0.0%)
Total
0 (0.0%)
11 (100.0%)
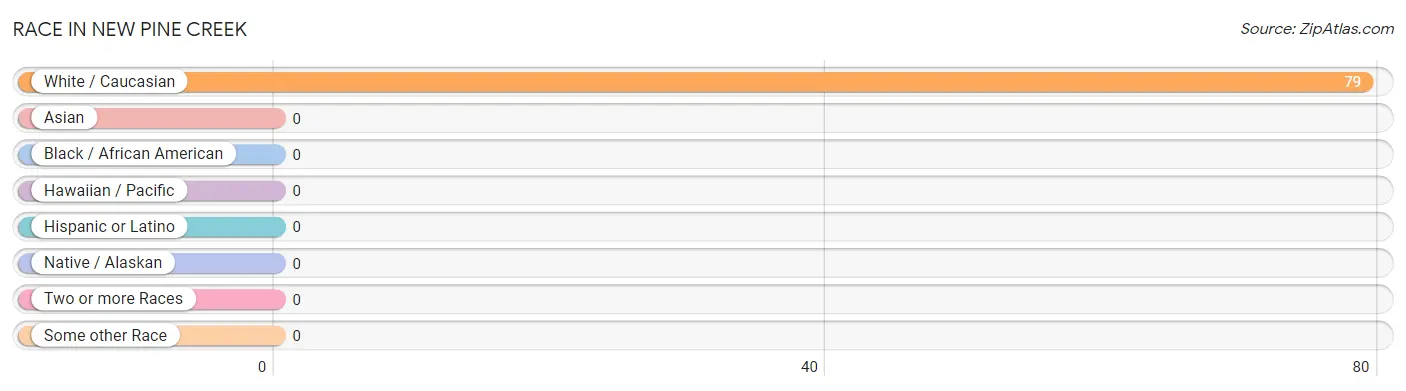
Race in New Pine Creek
The most populous races in New Pine Creek are , and White / Caucasian (79 | 100.0%).
Race
# Population
% Population
Asian
0
0.0%
Black / African American
0
0.0%
Hawaiian / Pacific
0
0.0%
Hispanic or Latino
0
0.0%
Native / Alaskan
0
0.0%
White / Caucasian
79
100.0%
Two or more Races
0
0.0%
Some other Race
0
0.0%
Total
79
100.0%
Ancestry in New Pine Creek
Ancestry
# Population
% Population
View All 0 Rows
Immigrants in New Pine Creek
Immigration Origin
# Population
% Population
View All 0 Rows
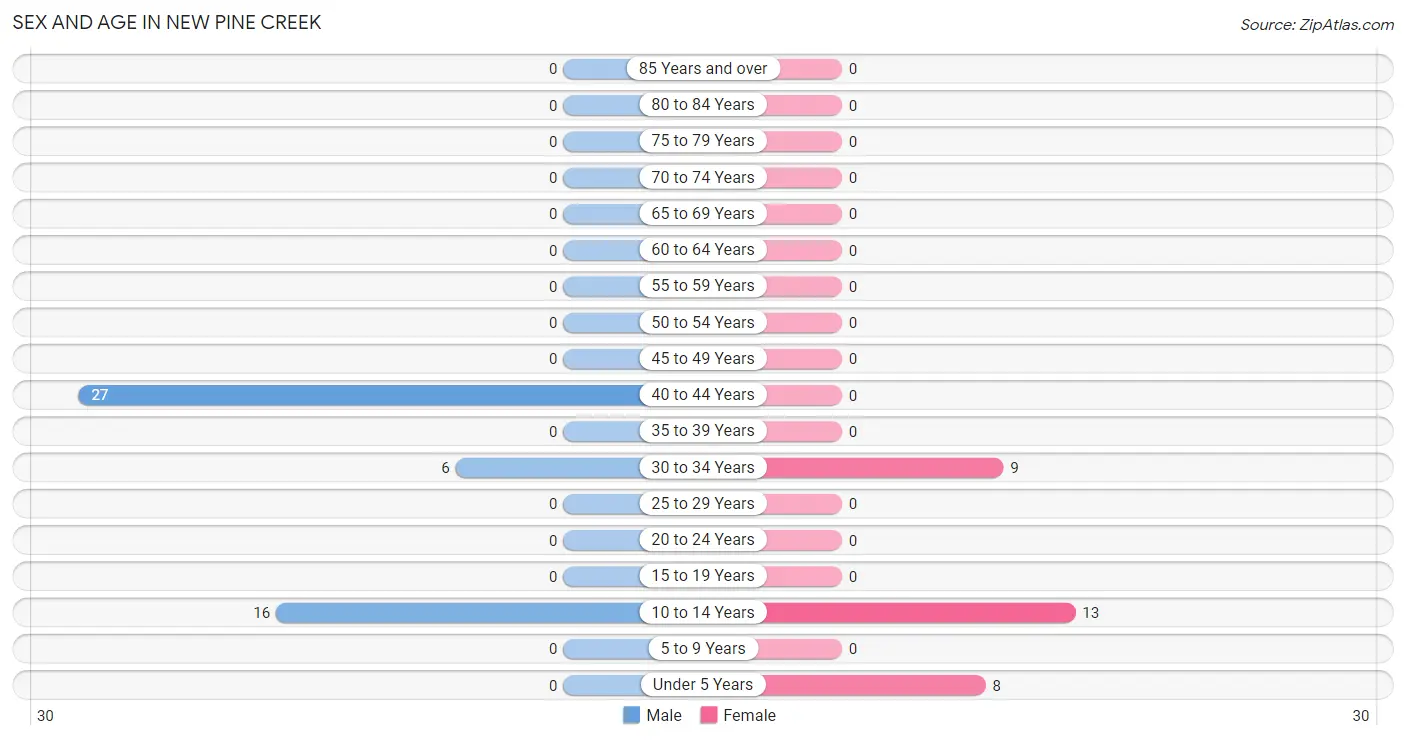
Sex and Age in New Pine Creek
Sex and Age in New Pine Creek
The most populous age groups in New Pine Creek are 40 to 44 Years (27 | 55.1%) for men and 10 to 14 Years (13 | 43.3%) for women.
Age Bracket
Male
Female
Under 5 Years
0 (0.0%)
8 (26.7%)
5 to 9 Years
0 (0.0%)
0 (0.0%)
10 to 14 Years
16 (32.7%)
13 (43.3%)
15 to 19 Years
0 (0.0%)
0 (0.0%)
20 to 24 Years
0 (0.0%)
0 (0.0%)
25 to 29 Years
0 (0.0%)
0 (0.0%)
30 to 34 Years
6 (12.2%)
9 (30.0%)
35 to 39 Years
0 (0.0%)
0 (0.0%)
40 to 44 Years
27 (55.1%)
0 (0.0%)
45 to 49 Years
0 (0.0%)
0 (0.0%)
50 to 54 Years
0 (0.0%)
0 (0.0%)
55 to 59 Years
0 (0.0%)
0 (0.0%)
60 to 64 Years
0 (0.0%)
0 (0.0%)
65 to 69 Years
0 (0.0%)
0 (0.0%)
70 to 74 Years
0 (0.0%)
0 (0.0%)
75 to 79 Years
0 (0.0%)
0 (0.0%)
80 to 84 Years
0 (0.0%)
0 (0.0%)
85 Years and over
0 (0.0%)
0 (0.0%)
Total
49 (100.0%)
30 (100.0%)
Families and Households in New Pine Creek
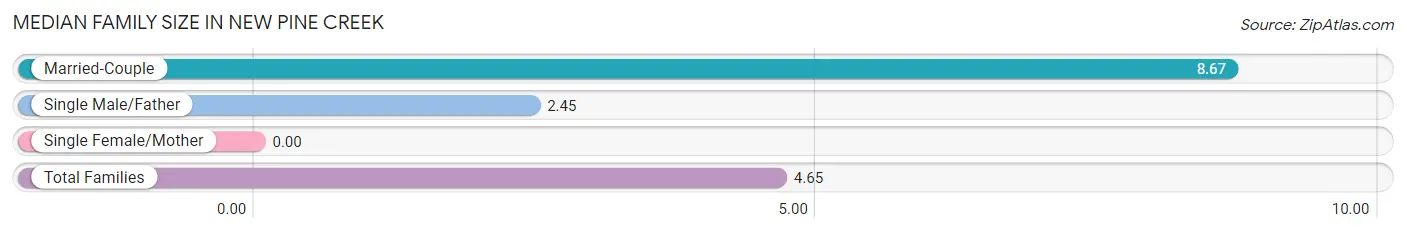
Median Family Size in New Pine Creek
Family Type
# Families
Family Size
Married-Couple
6 (35.3%)
8.67
Single Male/Father
11 (64.7%)
2.45
Single Female/Mother
0 (0.0%)
-
Total Families
17 (100.0%)
4.65
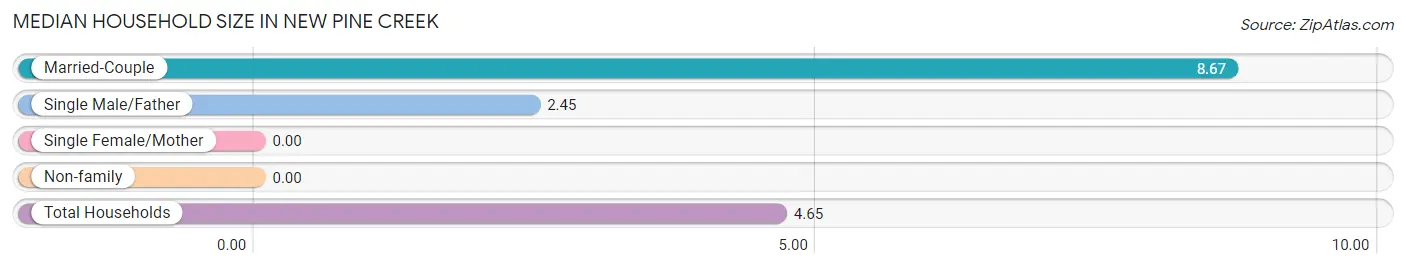
Median Household Size in New Pine Creek
Household Type
# Households
Household Size
Married-Couple
6 (35.3%)
8.67
Single Male/Father
11 (64.7%)
2.45
Single Female/Mother
0 (0.0%)
-
Non-family
0 (0.0%)
-
Total Households
17 (100.0%)
4.65
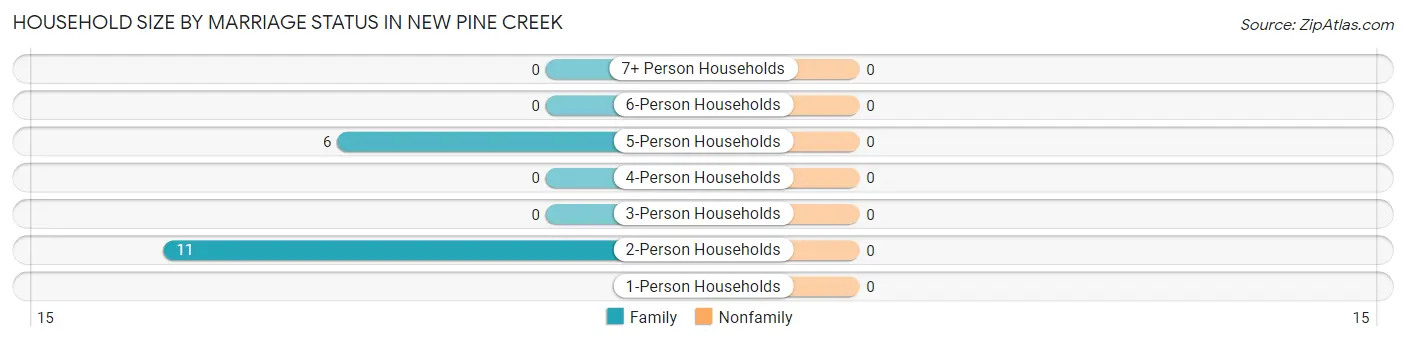
Household Size by Marriage Status in New Pine Creek
Household Size
Family Households
Nonfamily Households
1-Person Households
-
0 (0.0%)
2-Person Households
11 (64.7%)
0 (0.0%)
3-Person Households
0 (0.0%)
0 (0.0%)
4-Person Households
0 (0.0%)
0 (0.0%)
5-Person Households
6 (35.3%)
0 (0.0%)
6-Person Households
0 (0.0%)
0 (0.0%)
7+ Person Households
0 (0.0%)
0 (0.0%)
Total
17 (100.0%)
0 (0.0%)
Female Fertility in New Pine Creek
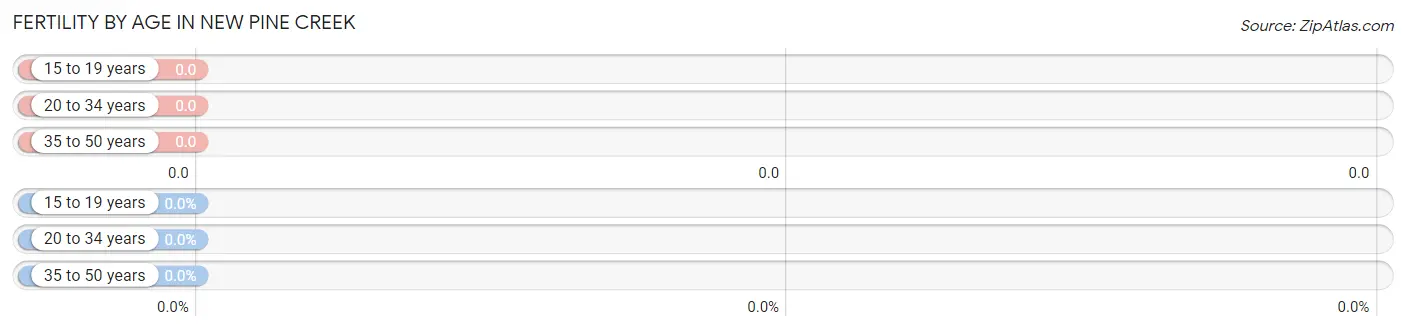
Fertility by Age in New Pine Creek
Age Bracket
Women with Births
Births / 1,000 Women
15 to 19 years
0 (0.0%)
0.0
20 to 34 years
0 (0.0%)
0.0
35 to 50 years
0 (0.0%)
0.0
Total
0 (0.0%)
0.0
Fertility by Age by Marriage Status in New Pine Creek
Age Bracket
Married
Unmarried
15 to 19 years
0 (0.0%)
0 (0.0%)
20 to 34 years
0 (0.0%)
0 (0.0%)
35 to 50 years
0 (0.0%)
0 (0.0%)
Total
0 (0.0%)
0 (0.0%)
Fertility by Education in New Pine Creek
Educational Attainment
Women with Births
Births / 1,000 Women
Less than High School
0 (0.0%)
0.0
High School Diploma
0 (0.0%)
0.0
College or Associate's Degree
0 (0.0%)
0.0
Bachelor's Degree
0 (0.0%)
0.0
Graduate Degree
0 (0.0%)
0.0
Total
0 (0.0%)
0.0
Fertility by Education by Marriage Status in New Pine Creek
Educational Attainment
Married
Unmarried
Less than High School
0 (0.0%)
0 (0.0%)
High School Diploma
0 (0.0%)
0 (0.0%)
College or Associate's Degree
0 (0.0%)
0 (0.0%)
Bachelor's Degree
0 (0.0%)
0 (0.0%)
Graduate Degree
0 (0.0%)
0 (0.0%)
Total
0 (0.0%)
0 (0.0%)
Employment Characteristics in New Pine Creek
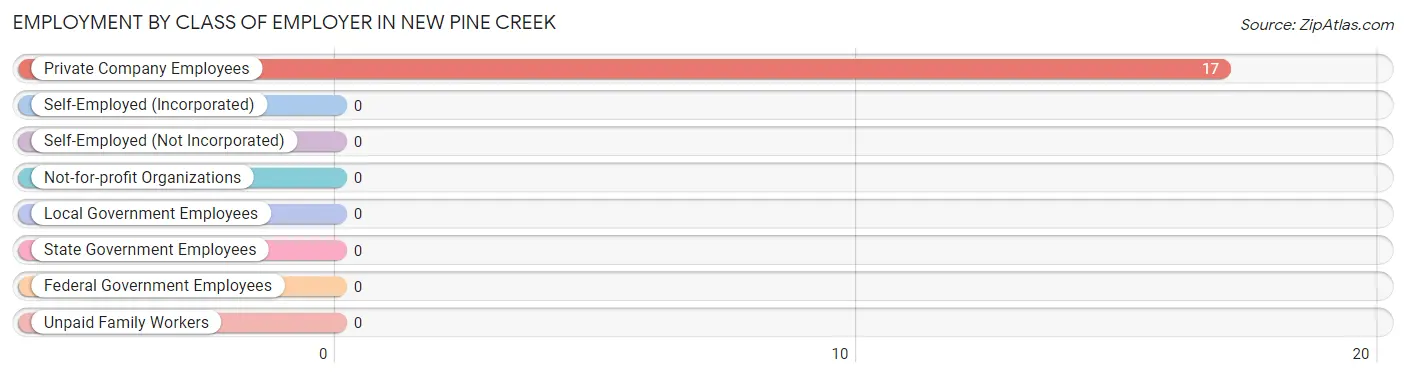
Employment by Class of Employer in New Pine Creek
Among the 17 employed individuals in New Pine Creek, , and private company employees (17 | 100.0%) make up the most common classes of employment.
Employer Class
# Employees
% Employees
Private Company Employees
17
100.0%
Self-Employed (Incorporated)
0
0.0%
Self-Employed (Not Incorporated)
0
0.0%
Not-for-profit Organizations
0
0.0%
Local Government Employees
0
0.0%
State Government Employees
0
0.0%
Federal Government Employees
0
0.0%
Unpaid Family Workers
0
0.0%
Total
17
100.0%
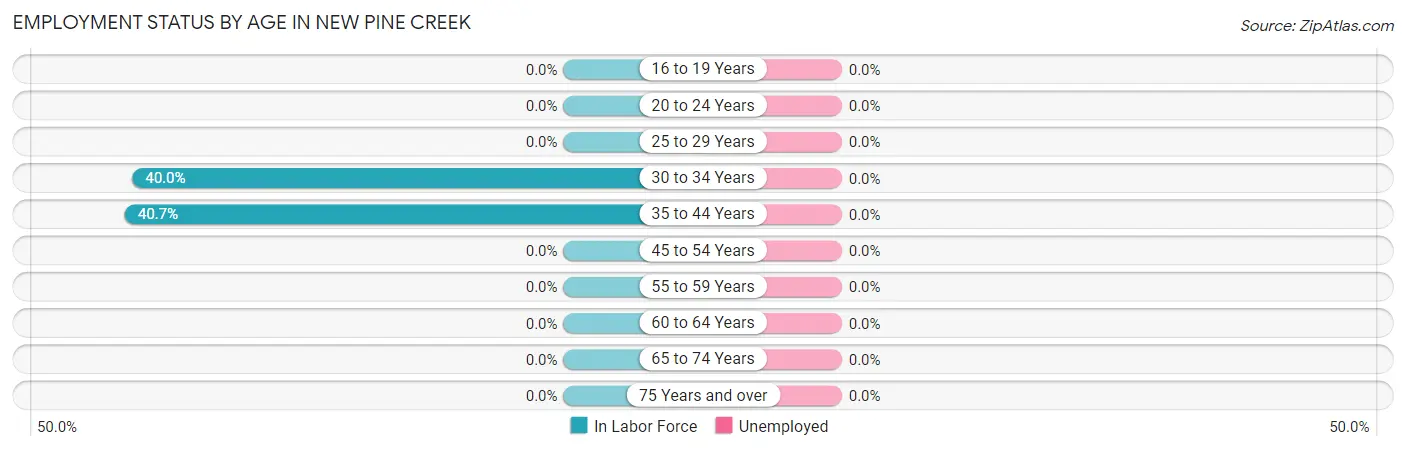
Employment Status by Age in New Pine Creek
Age Bracket
In Labor Force
Unemployed
16 to 19 Years
0 (0.0%)
0 (0.0%)
20 to 24 Years
0 (0.0%)
0 (0.0%)
25 to 29 Years
0 (0.0%)
0 (0.0%)
30 to 34 Years
6 (40.0%)
0 (0.0%)
35 to 44 Years
11 (40.7%)
0 (0.0%)
45 to 54 Years
0 (0.0%)
0 (0.0%)
55 to 59 Years
0 (0.0%)
0 (0.0%)
60 to 64 Years
0 (0.0%)
0 (0.0%)
65 to 74 Years
0 (0.0%)
0 (0.0%)
75 Years and over
0 (0.0%)
0 (0.0%)
Total
17 (40.5%)
0 (0.0%)
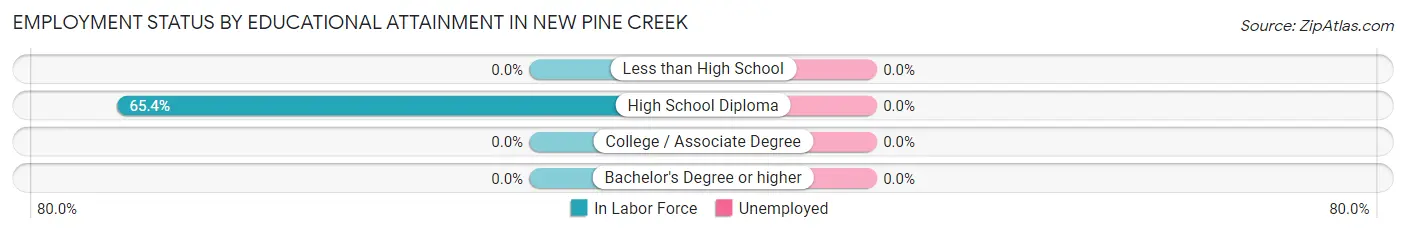
Employment Status by Educational Attainment in New Pine Creek
Educational Attainment
In Labor Force
Unemployed
Less than High School
0 (0.0%)
0 (0.0%)
High School Diploma
17 (65.4%)
0 (0.0%)
College / Associate Degree
0 (0.0%)
0 (0.0%)
Bachelor's Degree or higher
0 (0.0%)
0 (0.0%)
Total
17 (40.5%)
0 (0.0%)
Employment Occupations by Sex in New Pine Creek
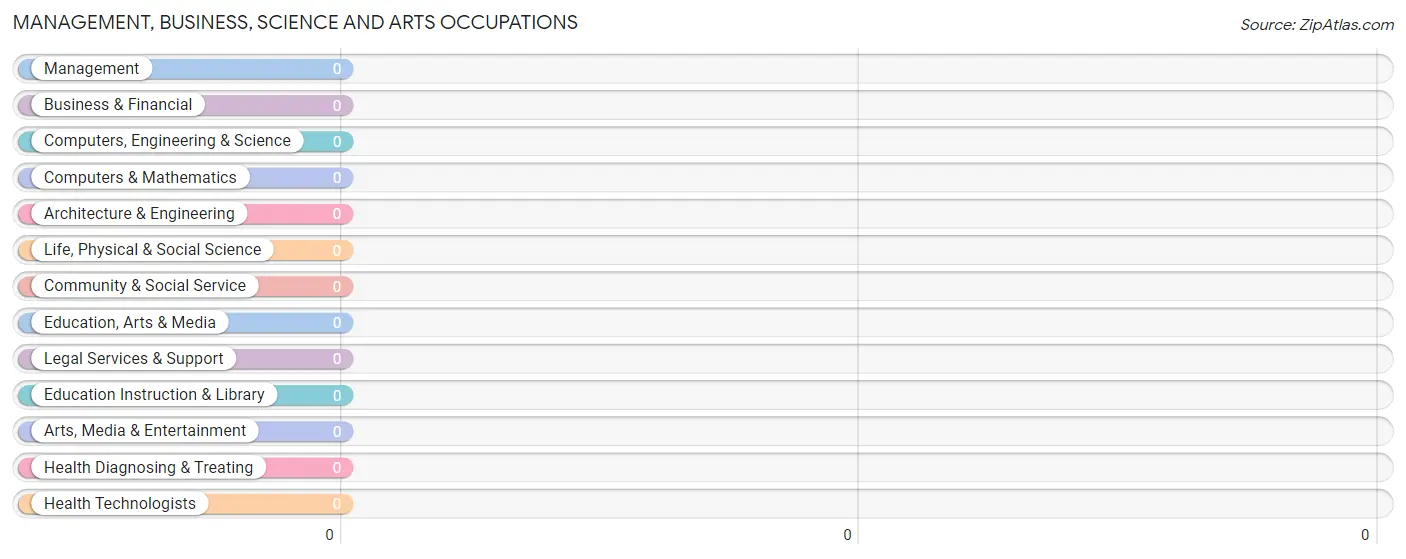
Management, Business, Science and Arts Occupations
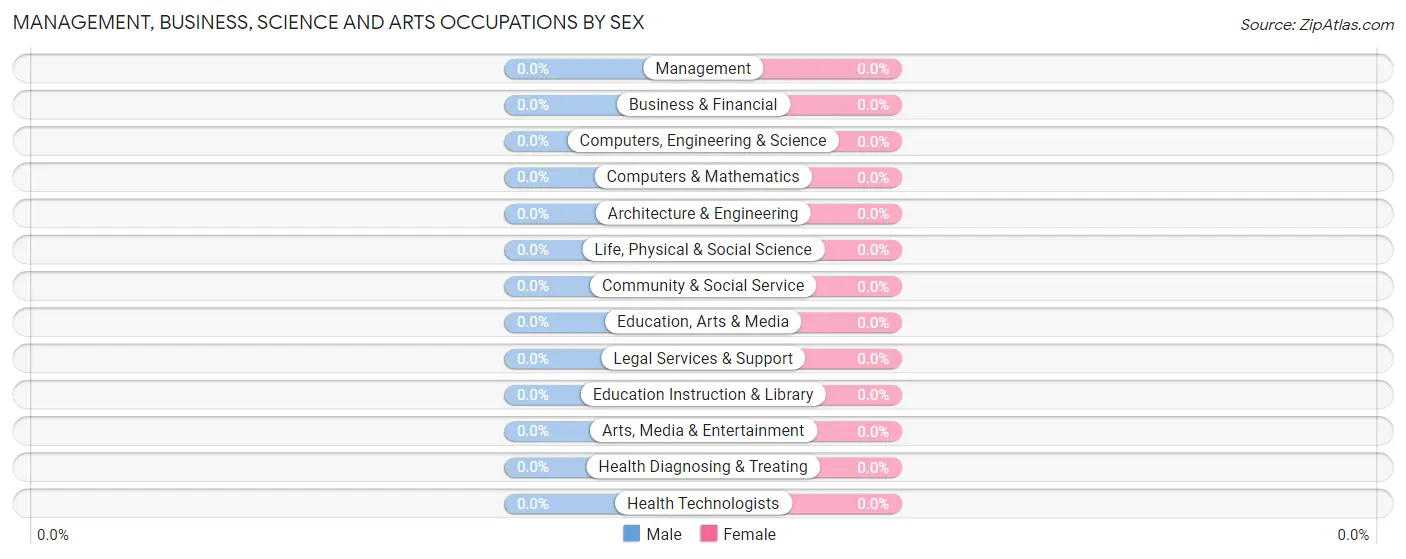
Management, Business, Science and Arts Occupations by Sex
Occupation
Male
Female
Management
0 (0.0%)
0 (0.0%)
Business & Financial
0 (0.0%)
0 (0.0%)
Computers, Engineering & Science
0 (0.0%)
0 (0.0%)
Computers & Mathematics
0 (0.0%)
0 (0.0%)
Architecture & Engineering
0 (0.0%)
0 (0.0%)
Life, Physical & Social Science
0 (0.0%)
0 (0.0%)
Community & Social Service
0 (0.0%)
0 (0.0%)
Education, Arts & Media
0 (0.0%)
0 (0.0%)
Legal Services & Support
0 (0.0%)
0 (0.0%)
Education Instruction & Library
0 (0.0%)
0 (0.0%)
Arts, Media & Entertainment
0 (0.0%)
0 (0.0%)
Health Diagnosing & Treating
0 (0.0%)
0 (0.0%)
Health Technologists
0 (0.0%)
0 (0.0%)
Total (Category)
0 (0.0%)
0 (0.0%)
Total (Overall)
17 (100.0%)
0 (0.0%)
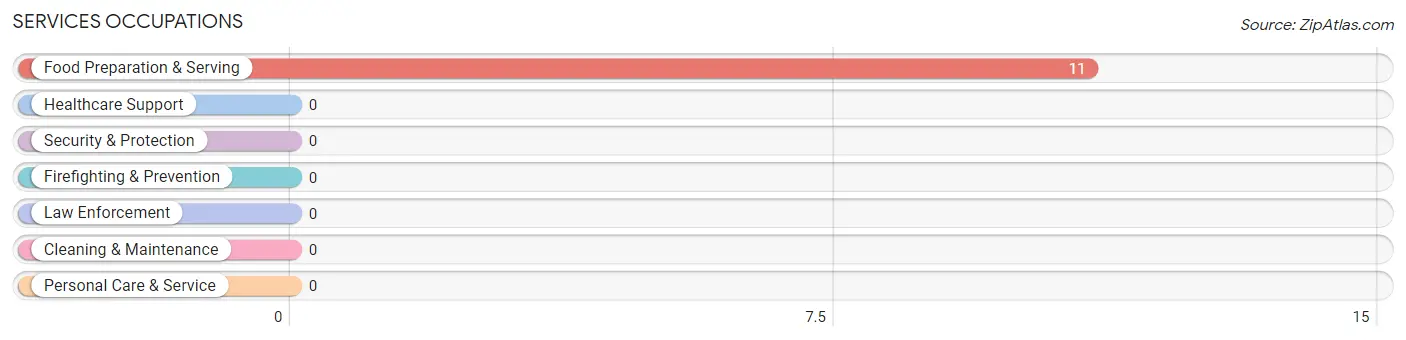
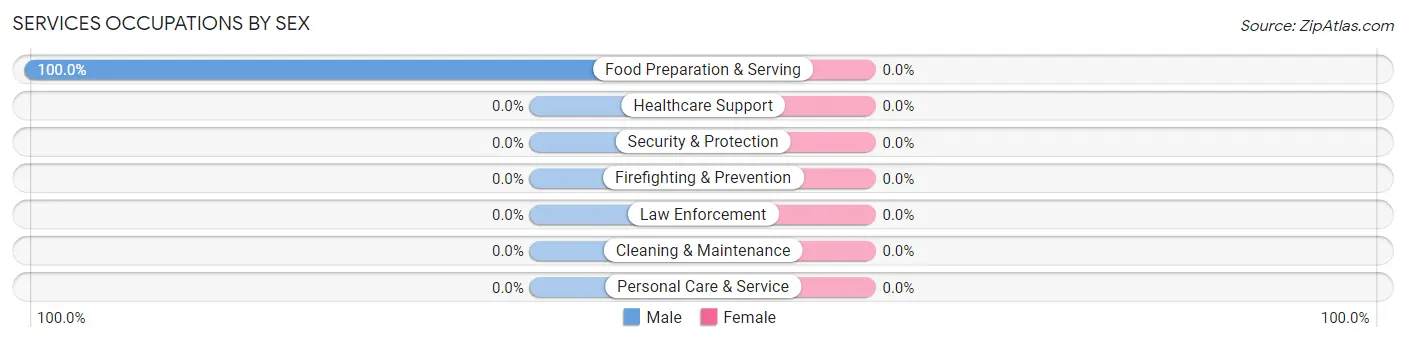
Services Occupations
The most common Services occupations in New Pine Creek are , and Food Preparation & Serving (11 | 64.7%).
Services Occupations by Sex
Occupation
Male
Female
Healthcare Support
0 (0.0%)
0 (0.0%)
Security & Protection
0 (0.0%)
0 (0.0%)
Firefighting & Prevention
0 (0.0%)
0 (0.0%)
Law Enforcement
0 (0.0%)
0 (0.0%)
Food Preparation & Serving
11 (100.0%)
0 (0.0%)
Cleaning & Maintenance
0 (0.0%)
0 (0.0%)
Personal Care & Service
0 (0.0%)
0 (0.0%)
Total (Category)
11 (100.0%)
0 (0.0%)
Total (Overall)
17 (100.0%)
0 (0.0%)
Sales and Office Occupations
Sales and Office Occupations by Sex
Occupation
Male
Female
Sales & Related
0 (0.0%)
0 (0.0%)
Office & Administration
0 (0.0%)
0 (0.0%)
Total (Category)
0 (0.0%)
0 (0.0%)
Total (Overall)
17 (100.0%)
0 (0.0%)
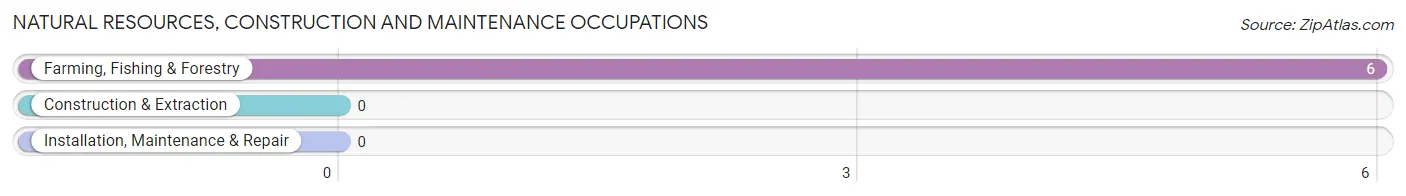
Natural Resources, Construction and Maintenance Occupations
The most common Natural Resources, Construction and Maintenance occupations in New Pine Creek are , and Farming, Fishing & Forestry (6 | 35.3%).
Natural Resources, Construction and Maintenance Occupations by Sex
Occupation
Male
Female
Farming, Fishing & Forestry
6 (100.0%)
0 (0.0%)
Construction & Extraction
0 (0.0%)
0 (0.0%)
Installation, Maintenance & Repair
0 (0.0%)
0 (0.0%)
Total (Category)
6 (100.0%)
0 (0.0%)
Total (Overall)
17 (100.0%)
0 (0.0%)
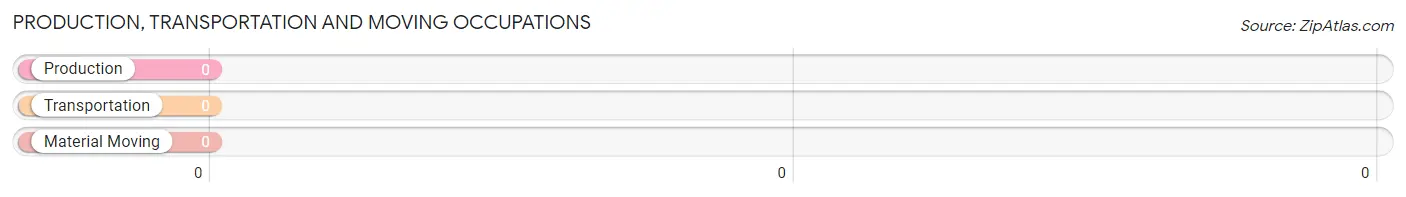
Production, Transportation and Moving Occupations
Production, Transportation and Moving Occupations by Sex
Occupation
Male
Female
Production
0 (0.0%)
0 (0.0%)
Transportation
0 (0.0%)
0 (0.0%)
Material Moving
0 (0.0%)
0 (0.0%)
Total (Category)
0 (0.0%)
0 (0.0%)
Total (Overall)
17 (100.0%)
0 (0.0%)
Employment Industries by Sex in New Pine Creek
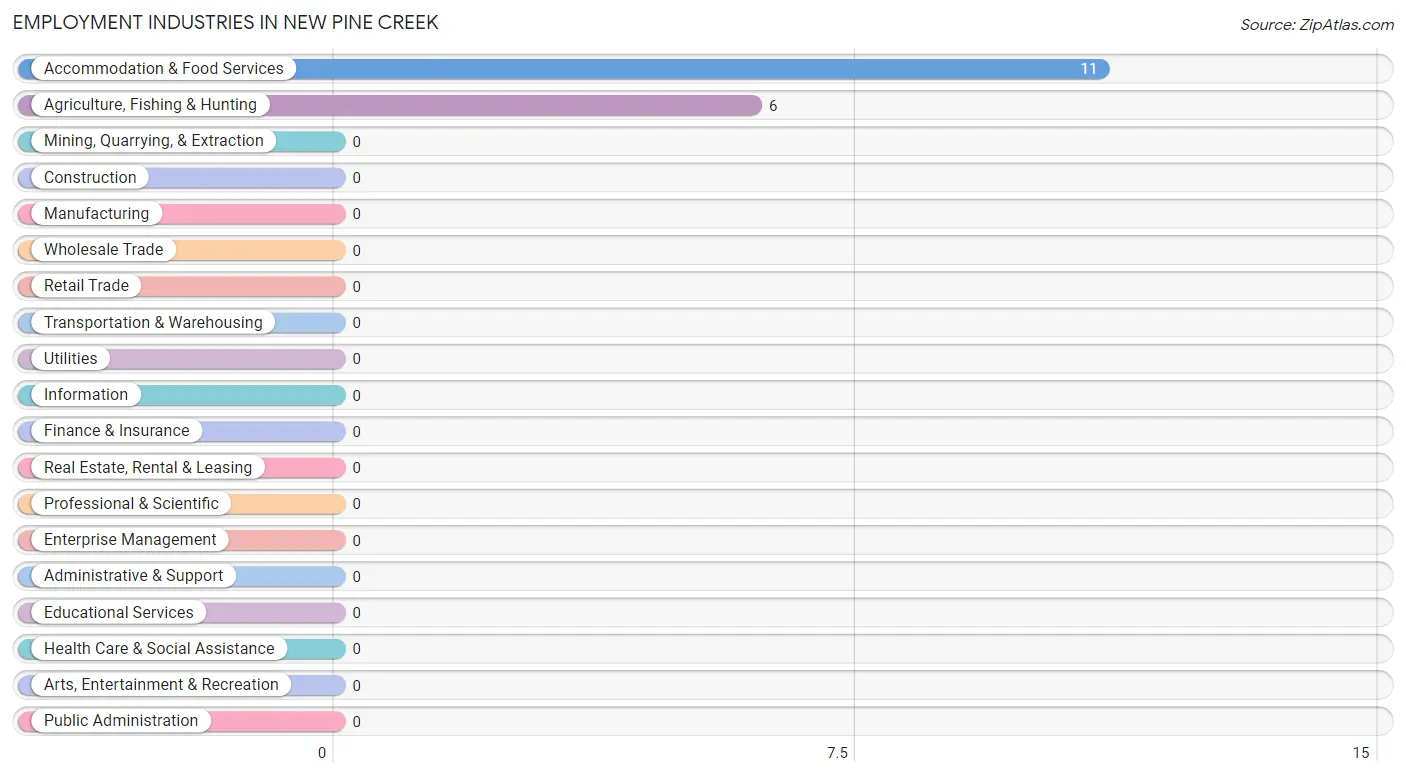
Employment Industries in New Pine Creek
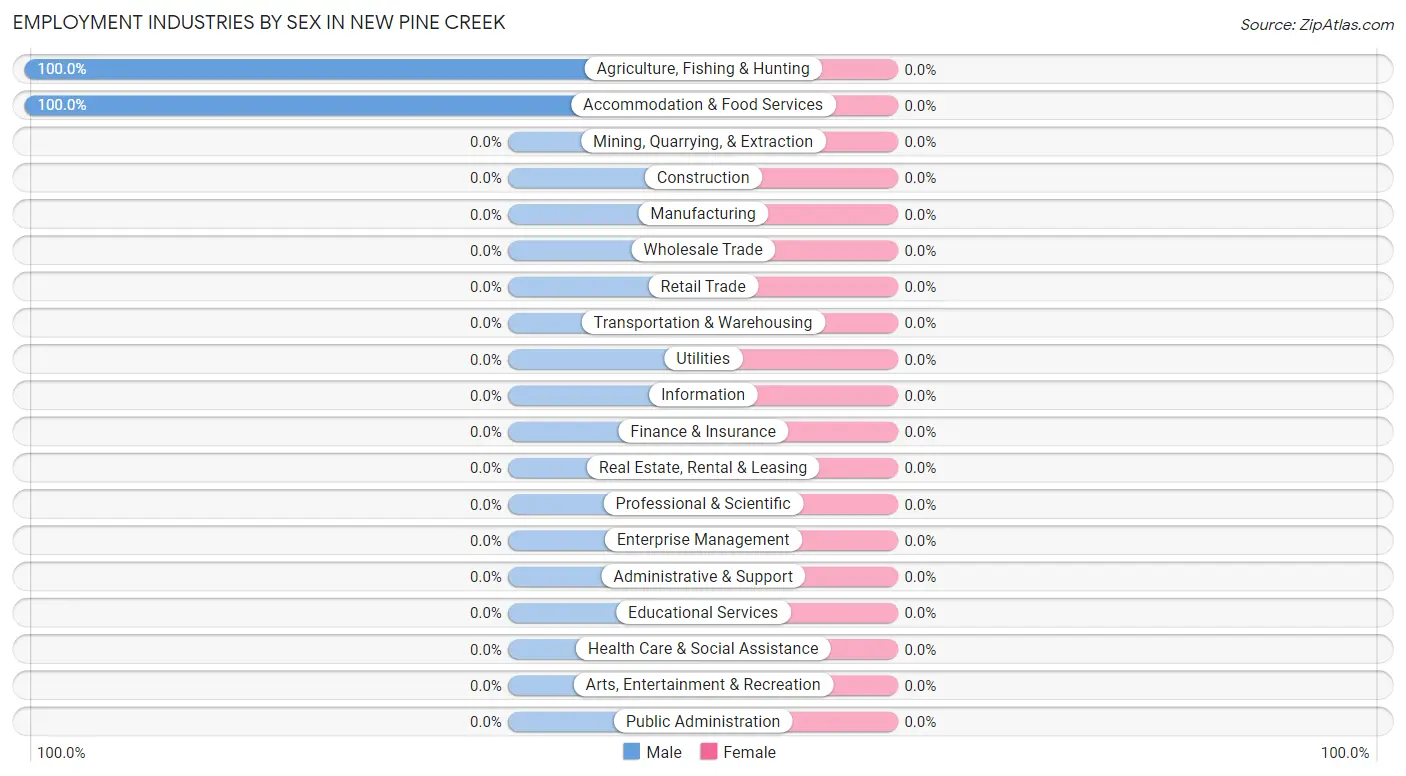
The major employment industries in New Pine Creek include Accommodation & Food Services (11 | 64.7%), and Agriculture, Fishing & Hunting (6 | 35.3%).
Employment Industries by Sex in New Pine Creek
Industry
Male
Female
Agriculture, Fishing & Hunting
6 (100.0%)
0 (0.0%)
Mining, Quarrying, & Extraction
0 (0.0%)
0 (0.0%)
Construction
0 (0.0%)
0 (0.0%)
Manufacturing
0 (0.0%)
0 (0.0%)
Wholesale Trade
0 (0.0%)
0 (0.0%)
Retail Trade
0 (0.0%)
0 (0.0%)
Transportation & Warehousing
0 (0.0%)
0 (0.0%)
Utilities
0 (0.0%)
0 (0.0%)
Information
0 (0.0%)
0 (0.0%)
Finance & Insurance
0 (0.0%)
0 (0.0%)
Real Estate, Rental & Leasing
0 (0.0%)
0 (0.0%)
Professional & Scientific
0 (0.0%)
0 (0.0%)
Enterprise Management
0 (0.0%)
0 (0.0%)
Administrative & Support
0 (0.0%)
0 (0.0%)
Educational Services
0 (0.0%)
0 (0.0%)
Health Care & Social Assistance
0 (0.0%)
0 (0.0%)
Arts, Entertainment & Recreation
0 (0.0%)
0 (0.0%)
Accommodation & Food Services
11 (100.0%)
0 (0.0%)
Public Administration
0 (0.0%)
0 (0.0%)
Total
17 (100.0%)
0 (0.0%)
Education in New Pine Creek
School Enrollment in New Pine Creek
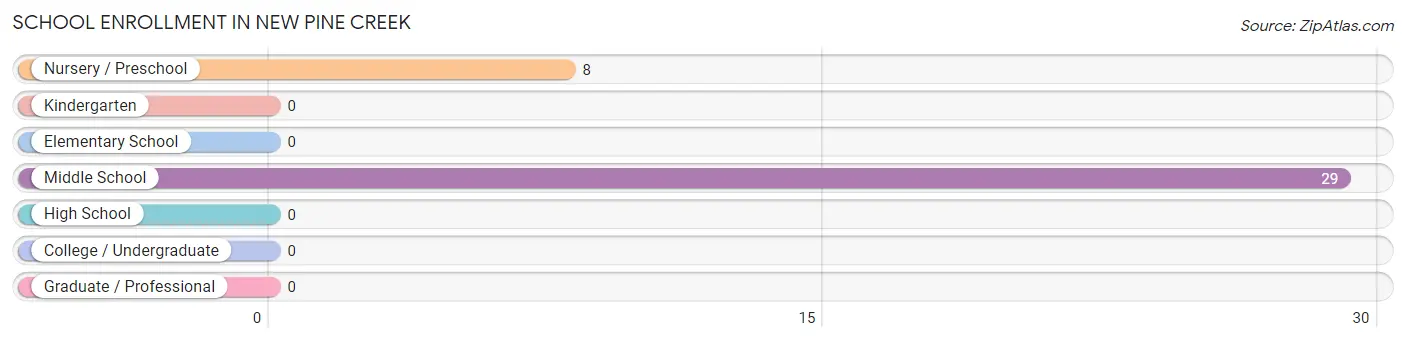
The most common levels of schooling among the 37 students in New Pine Creek are middle school (29 | 78.4%), and nursery / preschool (8 | 21.6%).
School Level
# Students
% Students
Nursery / Preschool
8
21.6%
Kindergarten
0
0.0%
Elementary School
0
0.0%
Middle School
29
78.4%
High School
0
0.0%
College / Undergraduate
0
0.0%
Graduate / Professional
0
0.0%
Total
37
100.0%
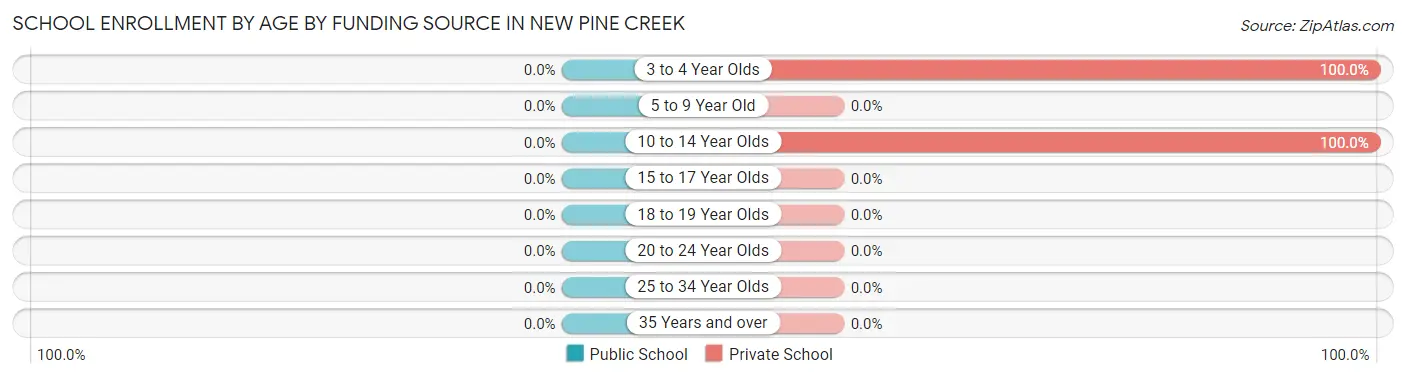
School Enrollment by Age by Funding Source in New Pine Creek
Age Bracket
Public School
Private School
3 to 4 Year Olds
0 (0.0%)
8 (100.0%)
5 to 9 Year Old
0 (0.0%)
0 (0.0%)
10 to 14 Year Olds
0 (0.0%)
29 (100.0%)
15 to 17 Year Olds
0 (0.0%)
0 (0.0%)
18 to 19 Year Olds
0 (0.0%)
0 (0.0%)
20 to 24 Year Olds
0 (0.0%)
0 (0.0%)
25 to 34 Year Olds
0 (0.0%)
0 (0.0%)
35 Years and over
0 (0.0%)
0 (0.0%)
Total
0 (0.0%)
37 (100.0%)
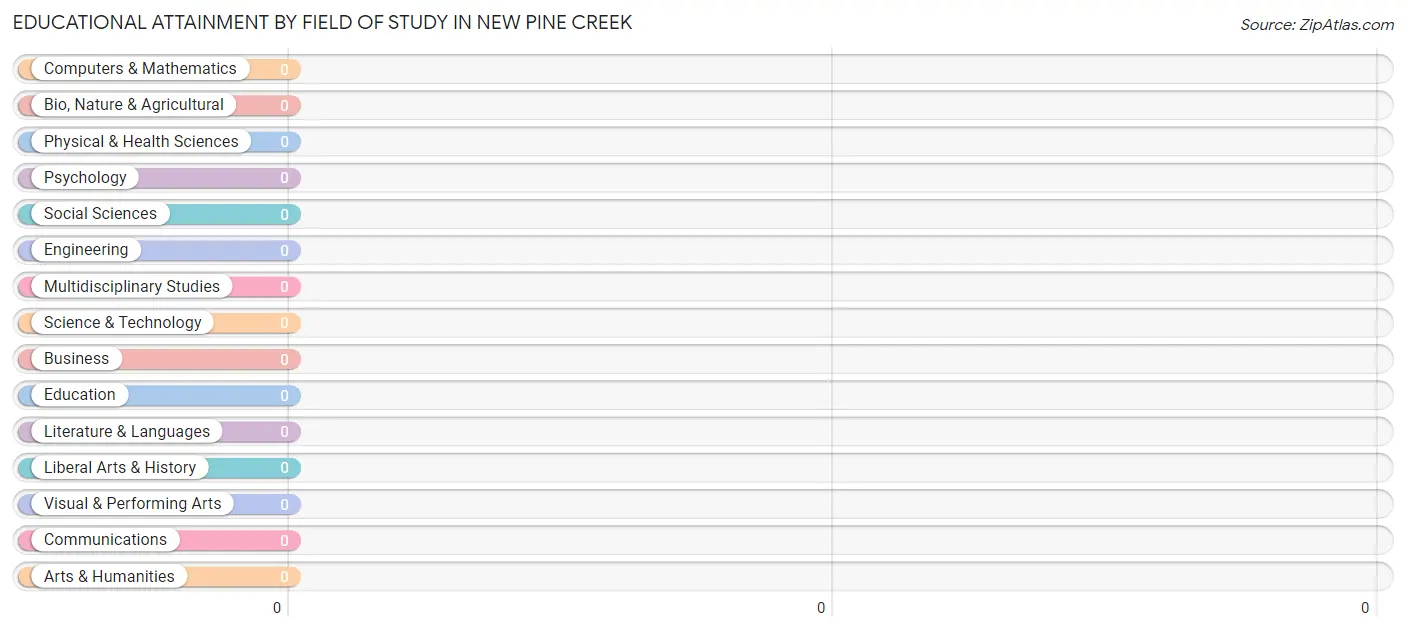
Educational Attainment by Field of Study in New Pine Creek
Field of Study
# Graduates
% Graduates
Computers & Mathematics
0
0.0%
Bio, Nature & Agricultural
0
0.0%
Physical & Health Sciences
0
0.0%
Psychology
0
0.0%
Social Sciences
0
0.0%
Engineering
0
0.0%
Multidisciplinary Studies
0
0.0%
Science & Technology
0
0.0%
Business
0
0.0%
Education
0
0.0%
Literature & Languages
0
0.0%
Liberal Arts & History
0
0.0%
Visual & Performing Arts
0
0.0%
Communications
0
0.0%
Arts & Humanities
0
0.0%
Total
0
0.0%
Transportation & Commute in New Pine Creek
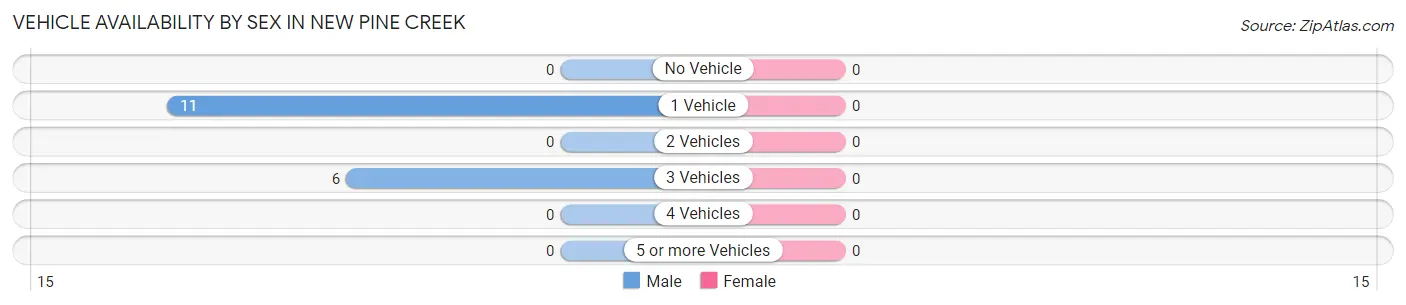
Vehicle Availability by Sex in New Pine Creek
Vehicles Available
Male
Female
No Vehicle
0 (0.0%)
0 (0.0%)
1 Vehicle
11 (64.7%)
0 (0.0%)
2 Vehicles
0 (0.0%)
0 (0.0%)
3 Vehicles
6 (35.3%)
0 (0.0%)
4 Vehicles
0 (0.0%)
0 (0.0%)
5 or more Vehicles
0 (0.0%)
0 (0.0%)
Total
17 (100.0%)
0 (0.0%)
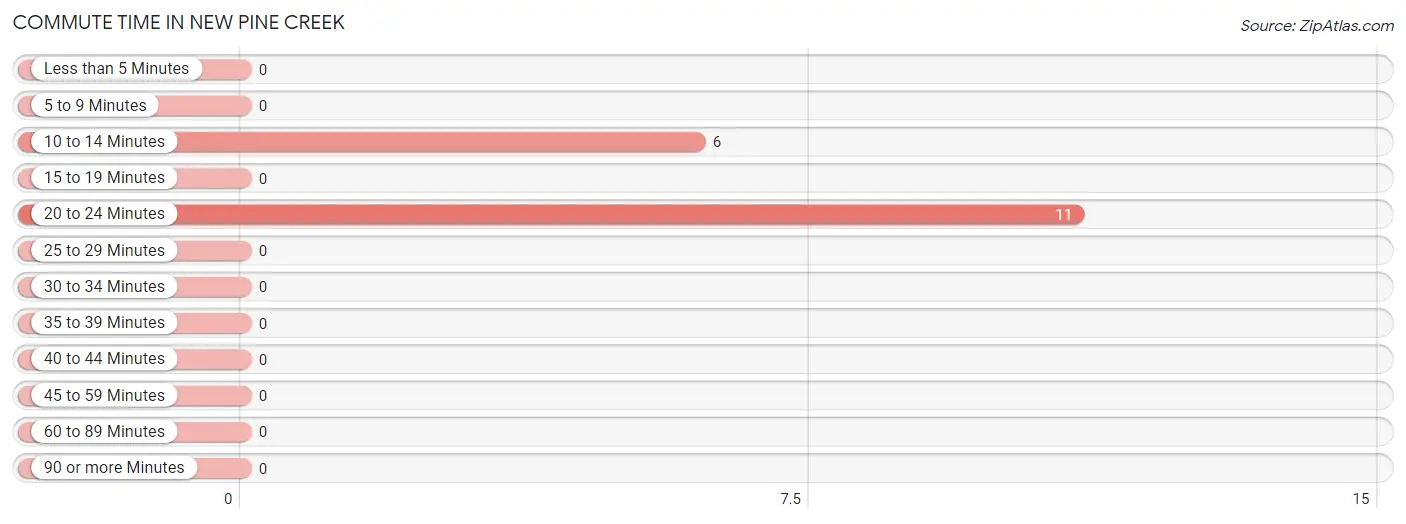
Commute Time in New Pine Creek
The most frequently occuring commute durations in New Pine Creek are 20 to 24 minutes (11 commuters, 64.7%), 10 to 14 minutes (6 commuters, 35.3%), and less than 5 minutes (0 commuters, 0.0%).
Commute Time
# Commuters
% Commuters
Less than 5 Minutes
0
0.0%
5 to 9 Minutes
0
0.0%
10 to 14 Minutes
6
35.3%
15 to 19 Minutes
0
0.0%
20 to 24 Minutes
11
64.7%
25 to 29 Minutes
0
0.0%
30 to 34 Minutes
0
0.0%
35 to 39 Minutes
0
0.0%
40 to 44 Minutes
0
0.0%
45 to 59 Minutes
0
0.0%
60 to 89 Minutes
0
0.0%
90 or more Minutes
0
0.0%
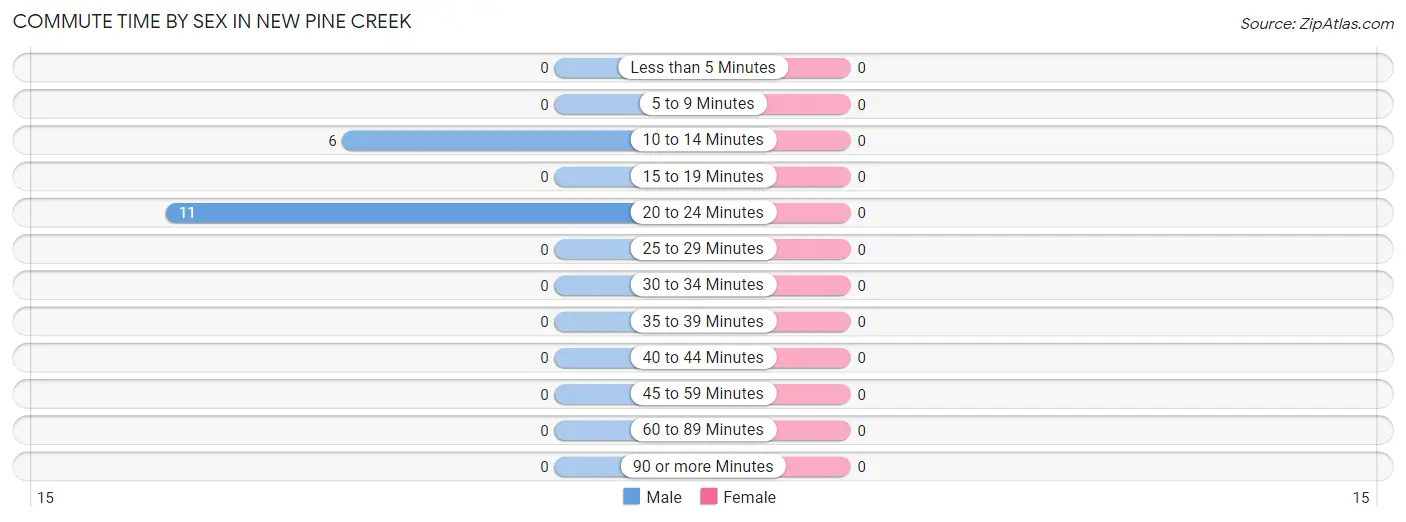
Commute Time by Sex in New Pine Creek
Commute Time
Male
Female
Less than 5 Minutes
0 (0.0%)
0 (0.0%)
5 to 9 Minutes
0 (0.0%)
0 (0.0%)
10 to 14 Minutes
6 (35.3%)
0 (0.0%)
15 to 19 Minutes
0 (0.0%)
0 (0.0%)
20 to 24 Minutes
11 (64.7%)
0 (0.0%)
25 to 29 Minutes
0 (0.0%)
0 (0.0%)
30 to 34 Minutes
0 (0.0%)
0 (0.0%)
35 to 39 Minutes
0 (0.0%)
0 (0.0%)
40 to 44 Minutes
0 (0.0%)
0 (0.0%)
45 to 59 Minutes
0 (0.0%)
0 (0.0%)
60 to 89 Minutes
0 (0.0%)
0 (0.0%)
90 or more Minutes
0 (0.0%)
0 (0.0%)
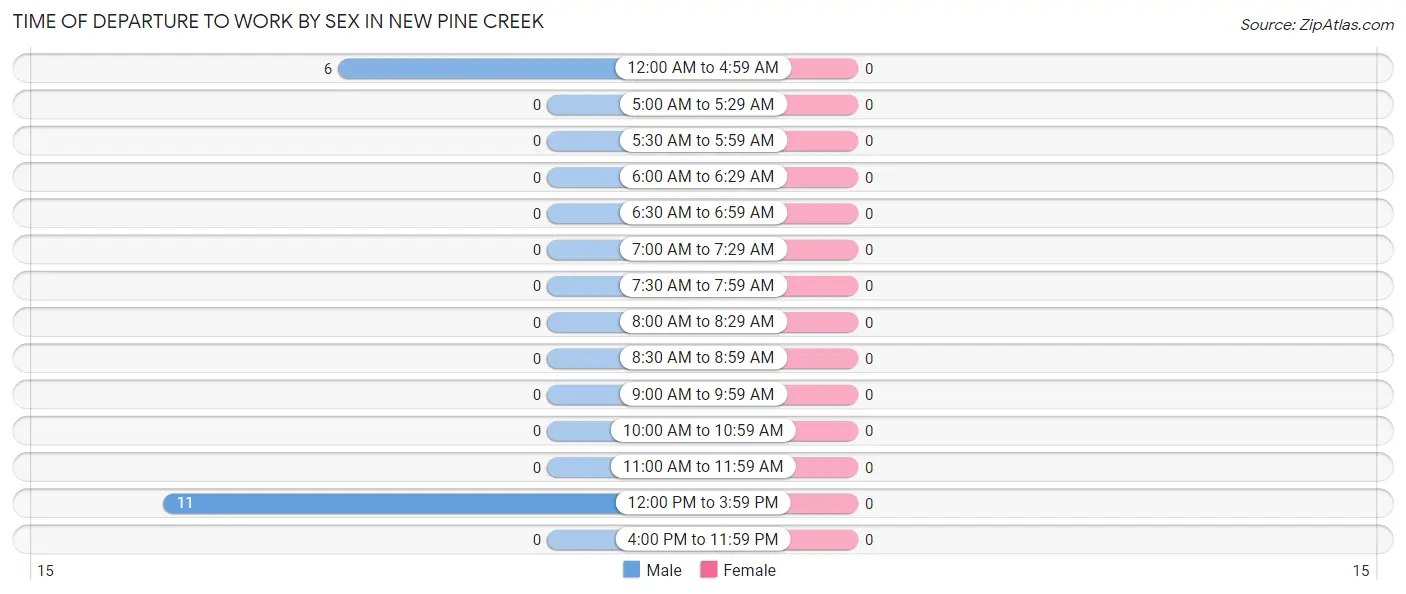
Time of Departure to Work by Sex in New Pine Creek
Time of Departure
Male
Female
12:00 AM to 4:59 AM
6 (35.3%)
0 (0.0%)
5:00 AM to 5:29 AM
0 (0.0%)
0 (0.0%)
5:30 AM to 5:59 AM
0 (0.0%)
0 (0.0%)
6:00 AM to 6:29 AM
0 (0.0%)
0 (0.0%)
6:30 AM to 6:59 AM
0 (0.0%)
0 (0.0%)
7:00 AM to 7:29 AM
0 (0.0%)
0 (0.0%)
7:30 AM to 7:59 AM
0 (0.0%)
0 (0.0%)
8:00 AM to 8:29 AM
0 (0.0%)
0 (0.0%)
8:30 AM to 8:59 AM
0 (0.0%)
0 (0.0%)
9:00 AM to 9:59 AM
0 (0.0%)
0 (0.0%)
10:00 AM to 10:59 AM
0 (0.0%)
0 (0.0%)
11:00 AM to 11:59 AM
0 (0.0%)
0 (0.0%)
12:00 PM to 3:59 PM
11 (64.7%)
0 (0.0%)
4:00 PM to 11:59 PM
0 (0.0%)
0 (0.0%)
Total
17 (100.0%)
0 (0.0%)
Housing Occupancy in New Pine Creek
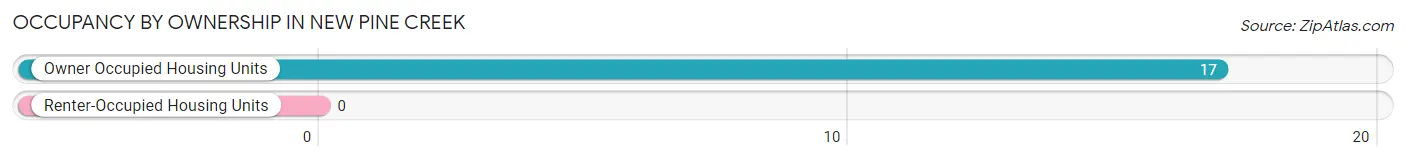
Occupancy by Ownership in New Pine Creek
Of the total 17 dwellings in New Pine Creek, owner-occupied units account for 17 (100.0%), while renter-occupied units make up 0 (0.0%).
Occupancy
# Housing Units
% Housing Units
Owner Occupied Housing Units
17
100.0%
Renter-Occupied Housing Units
0
0.0%
Total Occupied Housing Units
17
100.0%
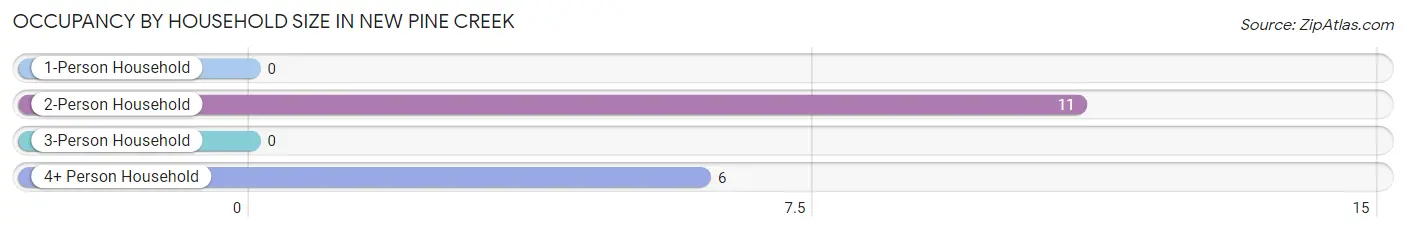
Occupancy by Household Size in New Pine Creek
Household Size
# Housing Units
% Housing Units
1-Person Household
0
0.0%
2-Person Household
11
64.7%
3-Person Household
0
0.0%
4+ Person Household
6
35.3%
Total Housing Units
17
100.0%
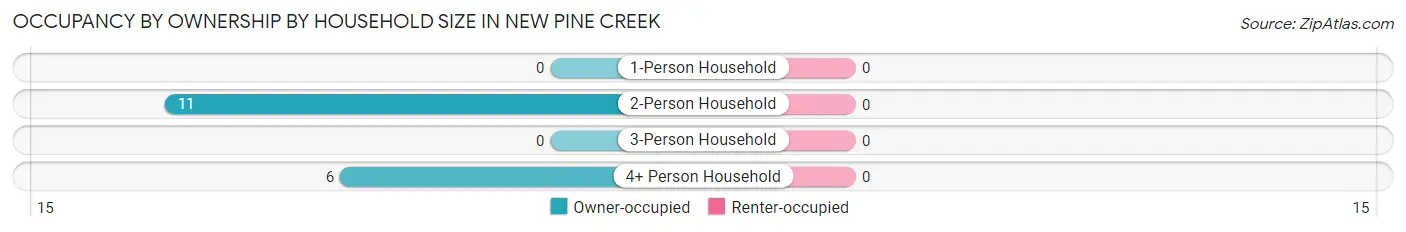
Occupancy by Ownership by Household Size in New Pine Creek
Household Size
Owner-occupied
Renter-occupied
1-Person Household
0 (0.0%)
0 (0.0%)
2-Person Household
11 (100.0%)
0 (0.0%)
3-Person Household
0 (0.0%)
0 (0.0%)
4+ Person Household
6 (100.0%)
0 (0.0%)
Total Housing Units
17 (100.0%)
0 (0.0%)
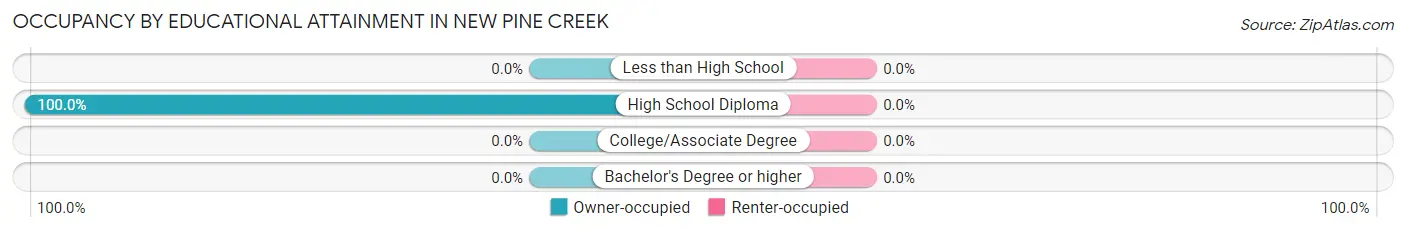
Occupancy by Educational Attainment in New Pine Creek
Household Size
Owner-occupied
Renter-occupied
Less than High School
0 (0.0%)
0 (0.0%)
High School Diploma
17 (100.0%)
0 (0.0%)
College/Associate Degree
0 (0.0%)
0 (0.0%)
Bachelor's Degree or higher
0 (0.0%)
0 (0.0%)
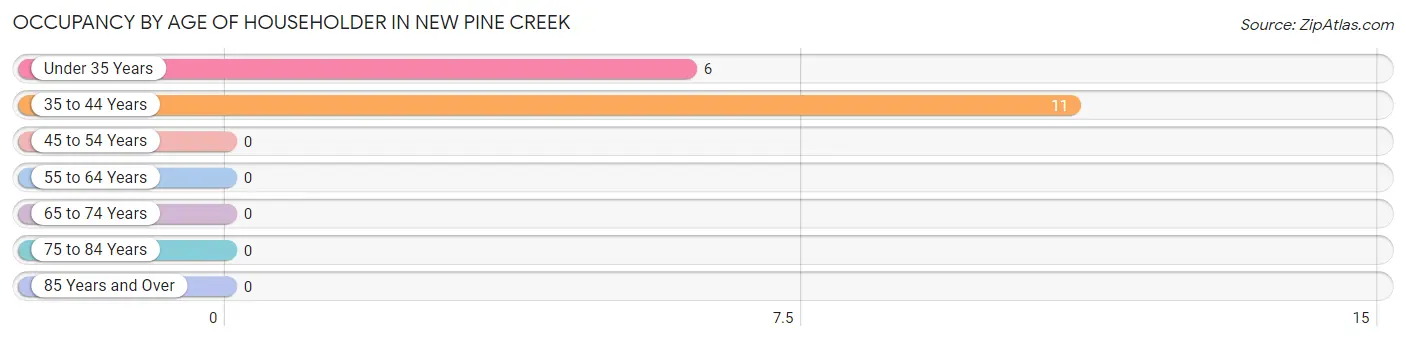
Occupancy by Age of Householder in New Pine Creek
Age Bracket
# Households
% Households
Under 35 Years
6
35.3%
35 to 44 Years
11
64.7%
45 to 54 Years
0
0.0%
55 to 64 Years
0
0.0%
65 to 74 Years
0
0.0%
75 to 84 Years
0
0.0%
85 Years and Over
0
0.0%
Total
17
100.0%
Housing Finances in New Pine Creek
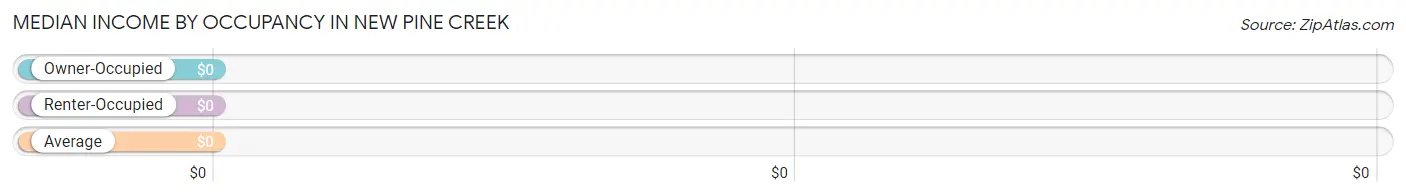
Median Income by Occupancy in New Pine Creek
Occupancy Type
# Households
Median Income
Owner-Occupied
17 (100.0%)
$0
Renter-Occupied
0 (0.0%)
$0
Average
17 (100.0%)
$0
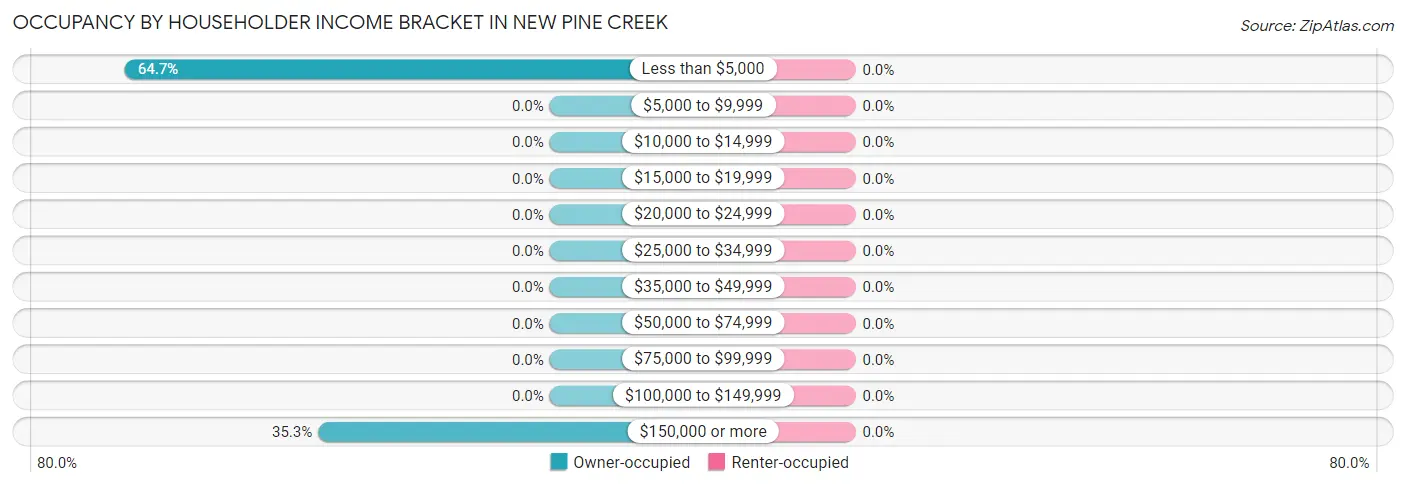
Occupancy by Householder Income Bracket in New Pine Creek
Income Bracket
Owner-occupied
Renter-occupied
Less than $5,000
11 (64.7%)
0 (0.0%)
$5,000 to $9,999
0 (0.0%)
0 (0.0%)
$10,000 to $14,999
0 (0.0%)
0 (0.0%)
$15,000 to $19,999
0 (0.0%)
0 (0.0%)
$20,000 to $24,999
0 (0.0%)
0 (0.0%)
$25,000 to $34,999
0 (0.0%)
0 (0.0%)
$35,000 to $49,999
0 (0.0%)
0 (0.0%)
$50,000 to $74,999
0 (0.0%)
0 (0.0%)
$75,000 to $99,999
0 (0.0%)
0 (0.0%)
$100,000 to $149,999
0 (0.0%)
0 (0.0%)
$150,000 or more
6 (35.3%)
0 (0.0%)
Total
17 (100.0%)
0 (0.0%)
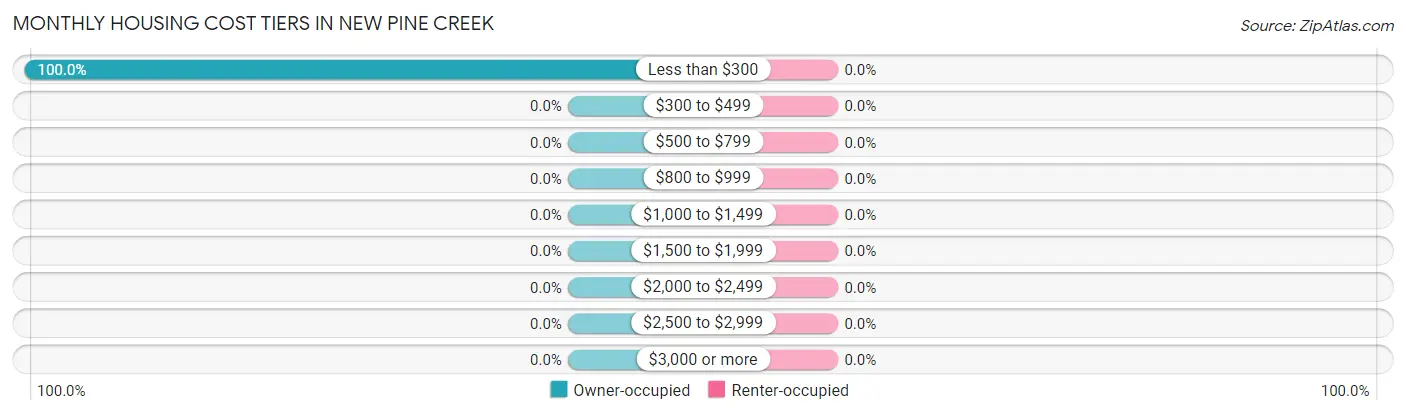
Monthly Housing Cost Tiers in New Pine Creek
Monthly Cost
Owner-occupied
Renter-occupied
Less than $300
17 (100.0%)
0 (0.0%)
$300 to $499
0 (0.0%)
0 (0.0%)
$500 to $799
0 (0.0%)
0 (0.0%)
$800 to $999
0 (0.0%)
0 (0.0%)
$1,000 to $1,499
0 (0.0%)
0 (0.0%)
$1,500 to $1,999
0 (0.0%)
0 (0.0%)
$2,000 to $2,499
0 (0.0%)
0 (0.0%)
$2,500 to $2,999
0 (0.0%)
0 (0.0%)
$3,000 or more
0 (0.0%)
0 (0.0%)
Total
17 (100.0%)
0 (0.0%)
Physical Housing Characteristics in New Pine Creek
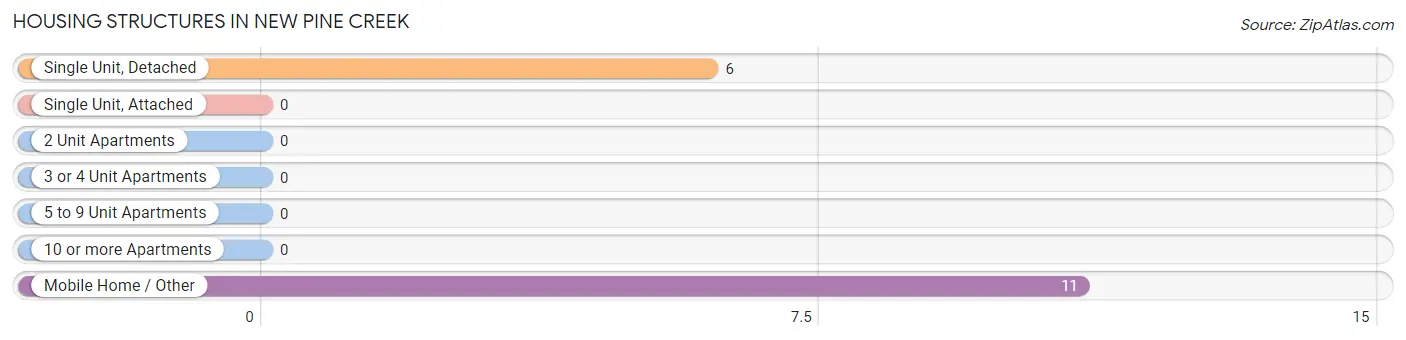
Housing Structures in New Pine Creek
Structure Type
# Housing Units
% Housing Units
Single Unit, Detached
6
35.3%
Single Unit, Attached
0
0.0%
2 Unit Apartments
0
0.0%
3 or 4 Unit Apartments
0
0.0%
5 to 9 Unit Apartments
0
0.0%
10 or more Apartments
0
0.0%
Mobile Home / Other
11
64.7%
Total
17
100.0%
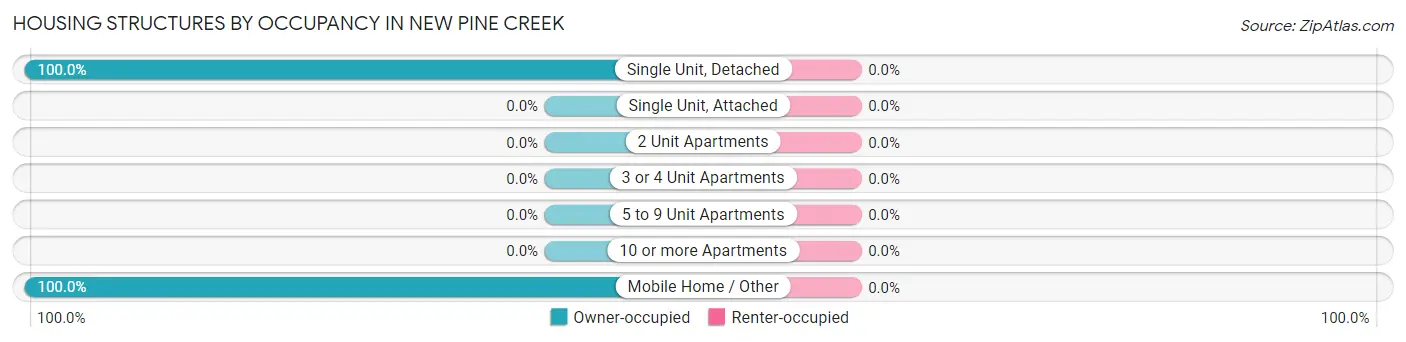
Housing Structures by Occupancy in New Pine Creek
Structure Type
Owner-occupied
Renter-occupied
Single Unit, Detached
6 (100.0%)
0 (0.0%)
Single Unit, Attached
0 (0.0%)
0 (0.0%)
2 Unit Apartments
0 (0.0%)
0 (0.0%)
3 or 4 Unit Apartments
0 (0.0%)
0 (0.0%)
5 to 9 Unit Apartments
0 (0.0%)
0 (0.0%)
10 or more Apartments
0 (0.0%)
0 (0.0%)
Mobile Home / Other
11 (100.0%)
0 (0.0%)
Total
17 (100.0%)
0 (0.0%)
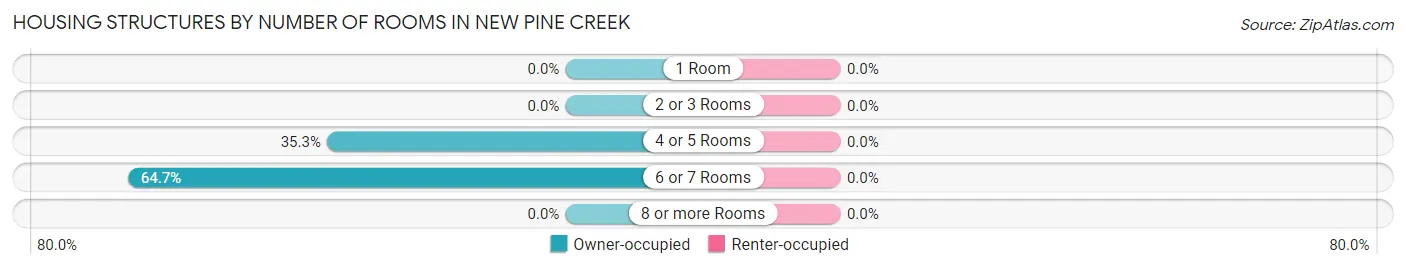
Housing Structures by Number of Rooms in New Pine Creek
Number of Rooms
Owner-occupied
Renter-occupied
1 Room
0 (0.0%)
0 (0.0%)
2 or 3 Rooms
0 (0.0%)
0 (0.0%)
4 or 5 Rooms
6 (35.3%)
0 (0.0%)
6 or 7 Rooms
11 (64.7%)
0 (0.0%)
8 or more Rooms
0 (0.0%)
0 (0.0%)
Total
17 (100.0%)
0 (0.0%)
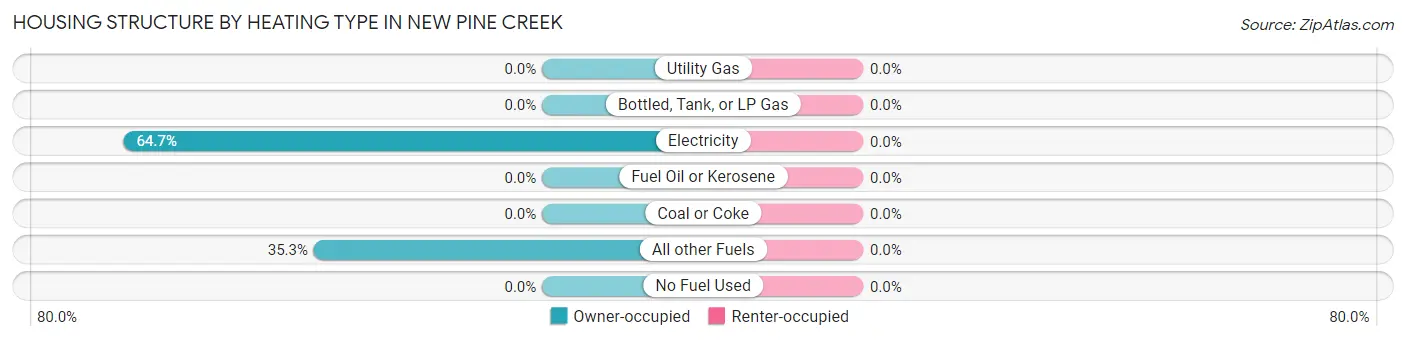
Housing Structure by Heating Type in New Pine Creek
Heating Type
Owner-occupied
Renter-occupied
Utility Gas
0 (0.0%)
0 (0.0%)
Bottled, Tank, or LP Gas
0 (0.0%)
0 (0.0%)
Electricity
11 (64.7%)
0 (0.0%)
Fuel Oil or Kerosene
0 (0.0%)
0 (0.0%)
Coal or Coke
0 (0.0%)
0 (0.0%)
All other Fuels
6 (35.3%)
0 (0.0%)
No Fuel Used
0 (0.0%)
0 (0.0%)
Total
17 (100.0%)
0 (0.0%)
Household Vehicle Usage in New Pine Creek
Vehicles per Household
Owner-occupied
Renter-occupied
No Vehicle
0 (0.0%)
0 (0.0%)
1 Vehicle
11 (64.7%)
0 (0.0%)
2 Vehicles
0 (0.0%)
0 (0.0%)
3 or more Vehicles
6 (35.3%)
0 (0.0%)
Total
17 (100.0%)
0 (0.0%)
Real Estate & Mortgages in New Pine Creek
Real Estate and Mortgage Overview in New Pine Creek
Characteristic
Without Mortgage
With Mortgage
Housing Units
17
0
Median Property Value
-
-
Median Household Income
-
-
Monthly Housing Costs
-
-
Real Estate Taxes
-
-
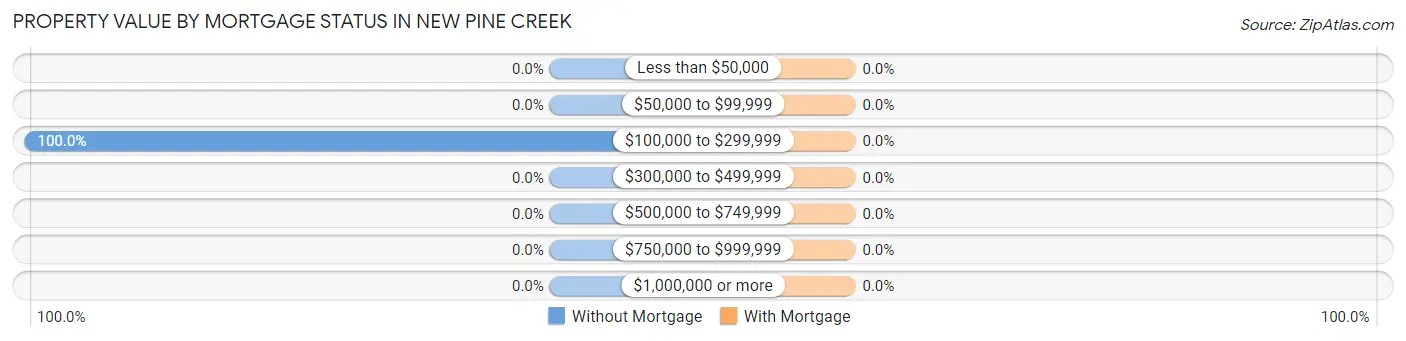
Property Value by Mortgage Status in New Pine Creek
Property Value
Without Mortgage
With Mortgage
Less than $50,000
0 (0.0%)
0 (0.0%)
$50,000 to $99,999
0 (0.0%)
0 (0.0%)
$100,000 to $299,999
17 (100.0%)
0 (0.0%)
$300,000 to $499,999
0 (0.0%)
0 (0.0%)
$500,000 to $749,999
0 (0.0%)
0 (0.0%)
$750,000 to $999,999
0 (0.0%)
0 (0.0%)
$1,000,000 or more
0 (0.0%)
0 (0.0%)
Total
17 (100.0%)
0 (0.0%)
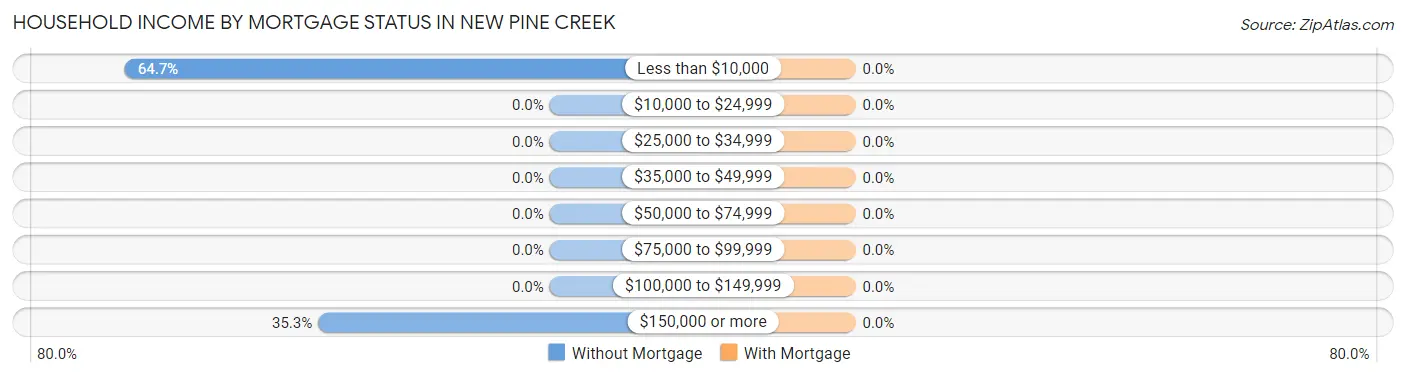
Household Income by Mortgage Status in New Pine Creek
Household Income
Without Mortgage
With Mortgage
Less than $10,000
11 (64.7%)
0 (0.0%)
$10,000 to $24,999
0 (0.0%)
0 (0.0%)
$25,000 to $34,999
0 (0.0%)
0 (0.0%)
$35,000 to $49,999
0 (0.0%)
0 (0.0%)
$50,000 to $74,999
0 (0.0%)
0 (0.0%)
$75,000 to $99,999
0 (0.0%)
0 (0.0%)
$100,000 to $149,999
0 (0.0%)
0 (0.0%)
$150,000 or more
6 (35.3%)
0 (0.0%)
Total
17 (100.0%)
0 (0.0%)
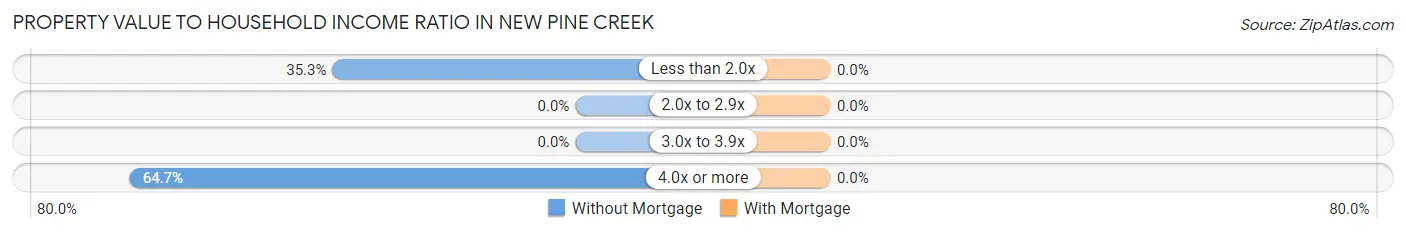
Property Value to Household Income Ratio in New Pine Creek
Value-to-Income Ratio
Without Mortgage
With Mortgage
Less than 2.0x
6 (35.3%)
0 (0.0%)
2.0x to 2.9x
0 (0.0%)
0 (0.0%)
3.0x to 3.9x
0 (0.0%)
0 (0.0%)
4.0x or more
11 (64.7%)
0 (0.0%)
Total
17 (100.0%)
0 (0.0%)
Real Estate Taxes by Mortgage Status in New Pine Creek
Property Taxes
Without Mortgage
With Mortgage
Less than $800
11 (64.7%)
0 (0.0%)
$800 to $1,499
6 (35.3%)
0 (0.0%)
$800 to $1,499
0 (0.0%)
0 (0.0%)
Total
17 (100.0%)
0 (0.0%)
Health & Disability in New Pine Creek
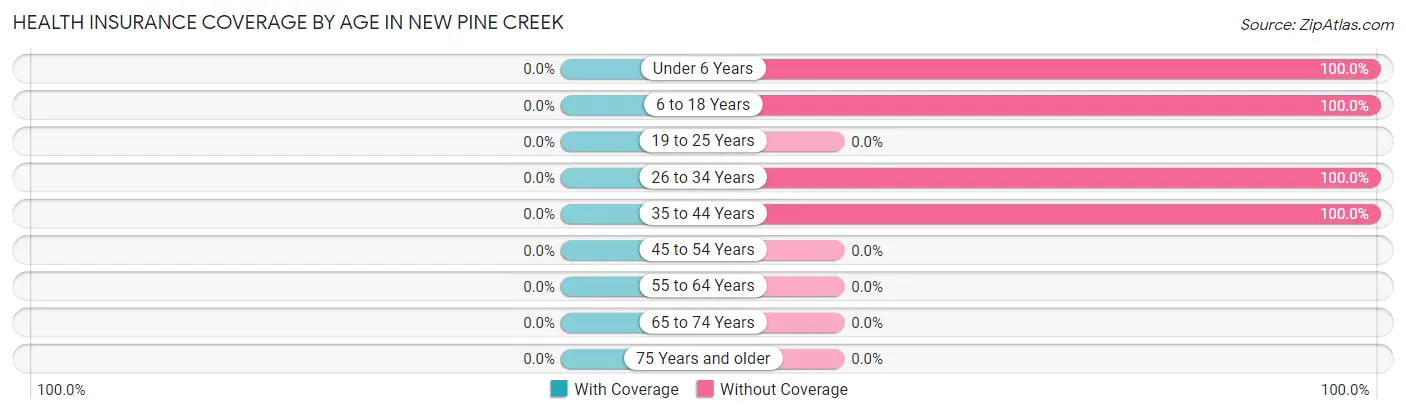
Health Insurance Coverage by Age in New Pine Creek
Age Bracket
With Coverage
Without Coverage
Under 6 Years
0 (0.0%)
8 (100.0%)
6 to 18 Years
0 (0.0%)
29 (100.0%)
19 to 25 Years
0 (0.0%)
0 (0.0%)
26 to 34 Years
0 (0.0%)
15 (100.0%)
35 to 44 Years
0 (0.0%)
27 (100.0%)
45 to 54 Years
0 (0.0%)
0 (0.0%)
55 to 64 Years
0 (0.0%)
0 (0.0%)
65 to 74 Years
0 (0.0%)
0 (0.0%)
75 Years and older
0 (0.0%)
0 (0.0%)
Total
0 (0.0%)
79 (100.0%)
Health Insurance Coverage by Citizenship Status in New Pine Creek
Citizenship Status
With Coverage
Without Coverage
Native Born
0 (0.0%)
8 (100.0%)
Foreign Born, Citizen
0 (0.0%)
29 (100.0%)
Foreign Born, not a Citizen
0 (0.0%)
0 (0.0%)
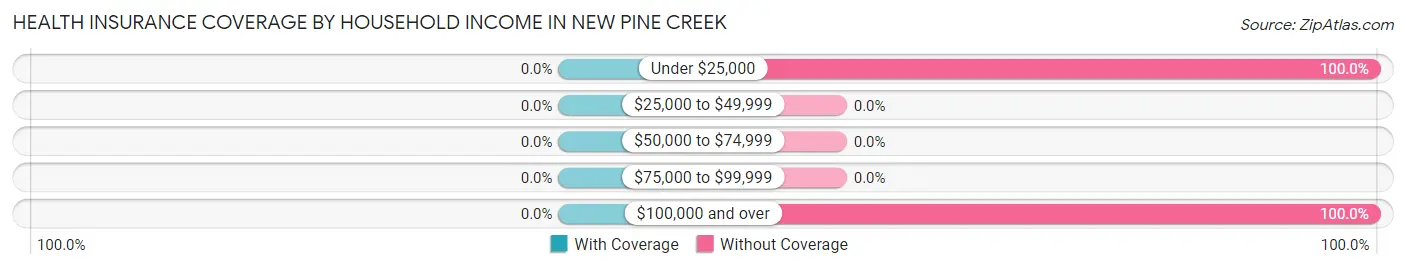
Health Insurance Coverage by Household Income in New Pine Creek
Household Income
With Coverage
Without Coverage
Under $25,000
0 (0.0%)
27 (100.0%)
$25,000 to $49,999
0 (0.0%)
0 (0.0%)
$50,000 to $74,999
0 (0.0%)
0 (0.0%)
$75,000 to $99,999
0 (0.0%)
0 (0.0%)
$100,000 and over
0 (0.0%)
52 (100.0%)
Public vs Private Health Insurance Coverage by Age in New Pine Creek
Age Bracket
Public Insurance
Private Insurance
Under 6
0 (0.0%)
0 (0.0%)
6 to 18 Years
0 (0.0%)
0 (0.0%)
19 to 25 Years
0 (0.0%)
0 (0.0%)
25 to 34 Years
0 (0.0%)
0 (0.0%)
35 to 44 Years
0 (0.0%)
0 (0.0%)
45 to 54 Years
0 (0.0%)
0 (0.0%)
55 to 64 Years
0 (0.0%)
0 (0.0%)
65 to 74 Years
0 (0.0%)
0 (0.0%)
75 Years and over
0 (0.0%)
0 (0.0%)
Total
0 (0.0%)
0 (0.0%)
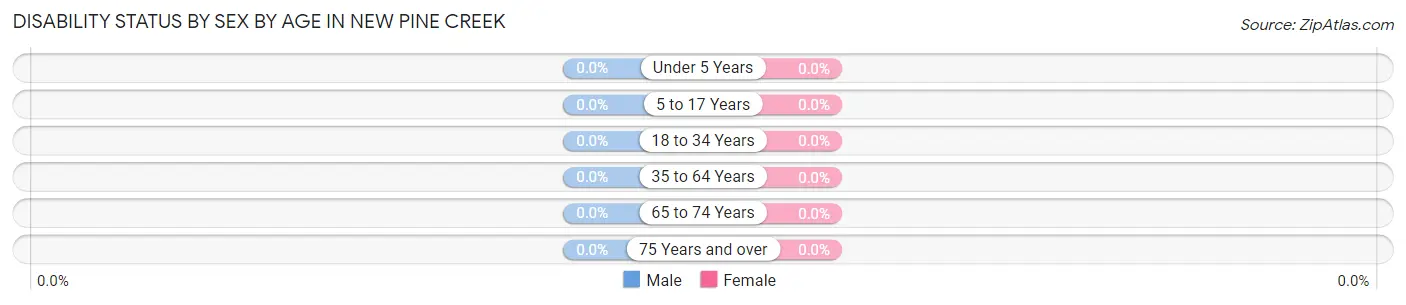
Disability Status by Sex by Age in New Pine Creek
Age Bracket
Male
Female
Under 5 Years
0 (0.0%)
0 (0.0%)
5 to 17 Years
0 (0.0%)
0 (0.0%)
18 to 34 Years
0 (0.0%)
0 (0.0%)
35 to 64 Years
0 (0.0%)
0 (0.0%)
65 to 74 Years
0 (0.0%)
0 (0.0%)
75 Years and over
0 (0.0%)
0 (0.0%)
Disability Class by Sex by Age in New Pine Creek
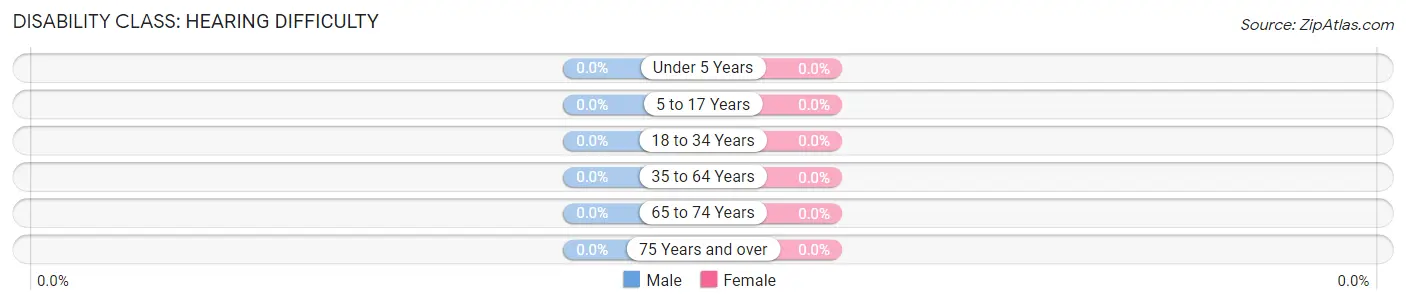
Disability Class: Hearing Difficulty
Age Bracket
Male
Female
Under 5 Years
0 (0.0%)
0 (0.0%)
5 to 17 Years
0 (0.0%)
0 (0.0%)
18 to 34 Years
0 (0.0%)
0 (0.0%)
35 to 64 Years
0 (0.0%)
0 (0.0%)
65 to 74 Years
0 (0.0%)
0 (0.0%)
75 Years and over
0 (0.0%)
0 (0.0%)
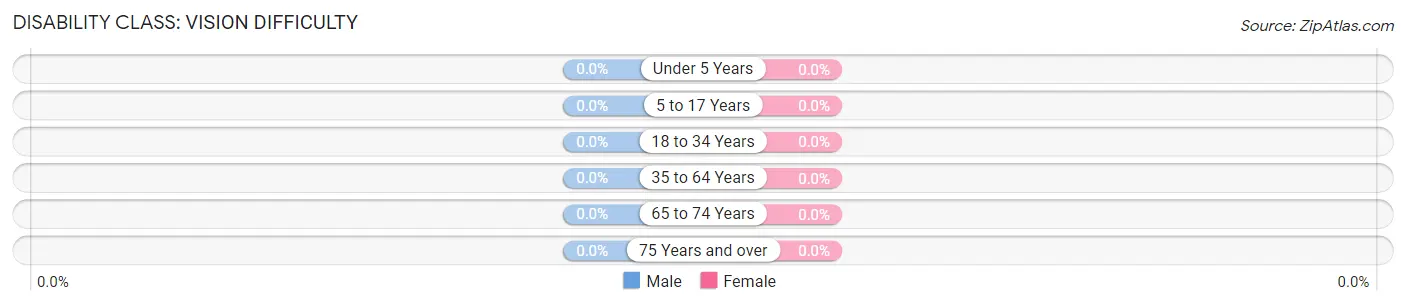
Disability Class: Vision Difficulty
Age Bracket
Male
Female
Under 5 Years
0 (0.0%)
0 (0.0%)
5 to 17 Years
0 (0.0%)
0 (0.0%)
18 to 34 Years
0 (0.0%)
0 (0.0%)
35 to 64 Years
0 (0.0%)
0 (0.0%)
65 to 74 Years
0 (0.0%)
0 (0.0%)
75 Years and over
0 (0.0%)
0 (0.0%)
Disability Class: Cognitive Difficulty
Age Bracket
Male
Female
5 to 17 Years
0 (0.0%)
0 (0.0%)
18 to 34 Years
0 (0.0%)
0 (0.0%)
35 to 64 Years
0 (0.0%)
0 (0.0%)
65 to 74 Years
0 (0.0%)
0 (0.0%)
75 Years and over
0 (0.0%)
0 (0.0%)
Disability Class: Ambulatory Difficulty
Age Bracket
Male
Female
5 to 17 Years
0 (0.0%)
0 (0.0%)
18 to 34 Years
0 (0.0%)
0 (0.0%)
35 to 64 Years
0 (0.0%)
0 (0.0%)
65 to 74 Years
0 (0.0%)
0 (0.0%)
75 Years and over
0 (0.0%)
0 (0.0%)
Disability Class: Self-Care Difficulty
Age Bracket
Male
Female
5 to 17 Years
0 (0.0%)
0 (0.0%)
18 to 34 Years
0 (0.0%)
0 (0.0%)
35 to 64 Years
0 (0.0%)
0 (0.0%)
65 to 74 Years
0 (0.0%)
0 (0.0%)
75 Years and over
0 (0.0%)
0 (0.0%)
Technology Access in New Pine Creek
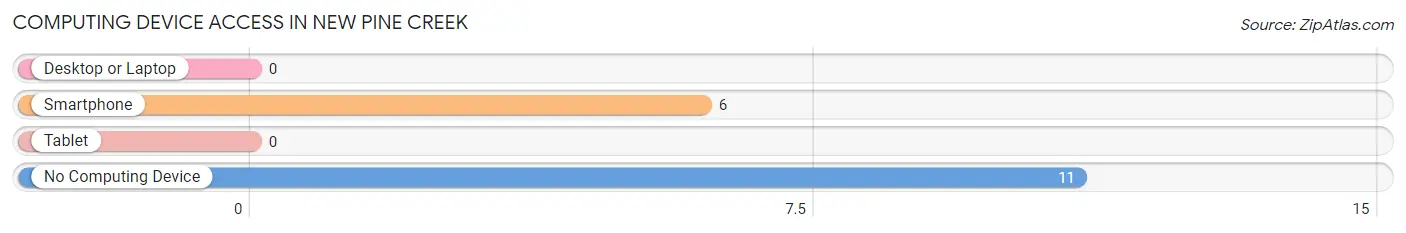
Computing Device Access in New Pine Creek
Device Type
# Households
% Households
Desktop or Laptop
0
0.0%
Smartphone
6
35.3%
Tablet
0
0.0%
No Computing Device
11
64.7%
Total
17
100.0%
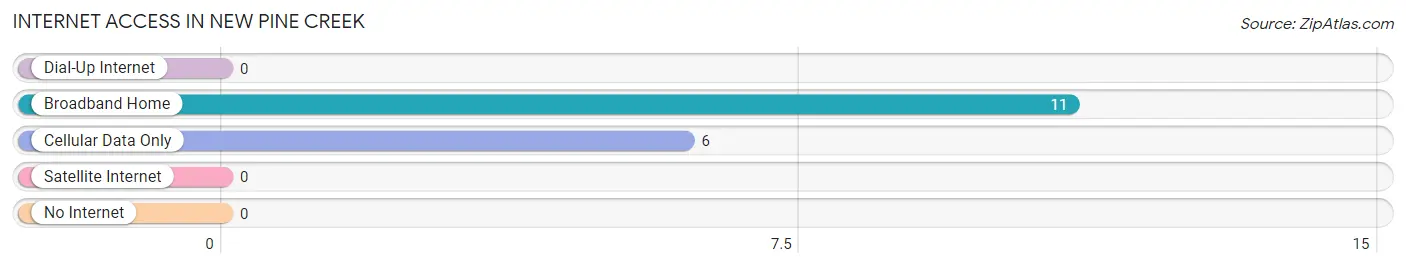
Internet Access in New Pine Creek
Internet Type
# Households
% Households
Dial-Up Internet
0
0.0%
Broadband Home
11
64.7%
Cellular Data Only
6
35.3%
Satellite Internet
0
0.0%
No Internet
0
0.0%
Total
17
100.0%
New Pine Creek Summary
Pine Creek, California is a small unincorporated community located in the Sierra Nevada foothills of El Dorado County. It is situated in the western part of the county, approximately 25 miles east of Placerville and 40 miles northeast of Sacramento. The community is nestled in a picturesque valley surrounded by rolling hills and lush forests.
History
The area that is now Pine Creek was first settled in the mid-1800s by miners and ranchers. The first post office was established in 1858 and the town was officially incorporated in 1864. The town was named after the nearby creek, which was named for the abundance of pine trees in the area.
In the late 1800s, the town was a bustling center of commerce and industry. It was home to several sawmills, a blacksmith shop, a general store, and a hotel. The town also had a school, a church, and a post office.
In the early 1900s, the town began to decline as the mining industry in the area declined. By the 1950s, the town had become a quiet, rural community.
Geography
Pine Creek is located in the Sierra Nevada foothills of El Dorado County. It is situated in the western part of the county, approximately 25 miles east of Placerville and 40 miles northeast of Sacramento. The community is nestled in a picturesque valley surrounded by rolling hills and lush forests.
The town is located at an elevation of 2,400 feet and has a total area of 0.7 square miles. The climate is mild and temperate, with hot summers and cool winters. The average annual temperature is around 60 degrees Fahrenheit.
Economy
The economy of Pine Creek is largely based on tourism and agriculture. The town is home to several wineries, as well as a number of small businesses. The town also has a few restaurants and shops.
The town is also home to a number of small farms and ranches. The area is known for its production of apples, pears, and other fruits and vegetables.
Demographics
As of the 2010 census, the population of Pine Creek was 1,093. The racial makeup of the town was 94.3% White, 0.7% African American, 0.7% Native American, 0.7% Asian, 0.7% Pacific Islander, and 2.7% from other races. The median household income was $45,000 and the median family income was $50,000.
Conclusion
Pine Creek, California is a small unincorporated community located in the Sierra Nevada foothills of El Dorado County. It is situated in the western part of the county, approximately 25 miles east of Placerville and 40 miles northeast of Sacramento. The community is nestled in a picturesque valley surrounded by rolling hills and lush forests. The economy of Pine Creek is largely based on tourism and agriculture, and the town is home to several wineries, as well as a number of small businesses. As of the 2010 census, the population of Pine Creek was 1,093. The town is a quiet, rural community with a rich history and a bright future.
Common Questions
What is Per Capita Income in New Pine Creek?
Per Capita income in New Pine Creek is $12,519.
What is Inequality or Gini Index in New Pine Creek?
Inequality or Gini Index in New Pine Creek is 0.62.
What is the Total Population of New Pine Creek?
Total Population of New Pine Creek is 79.
What is the Total Male Population of New Pine Creek?
Total Male Population of New Pine Creek is 49.
What is the Total Female Population of New Pine Creek?
Total Female Population of New Pine Creek is 30.
What is the Ratio of Males per 100 Females in New Pine Creek?
There are 163.33 Males per 100 Females in New Pine Creek.
What is the Ratio of Females per 100 Males in New Pine Creek?
There are 61.22 Females per 100 Males in New Pine Creek.
What is the Median Population Age in New Pine Creek?
Median Population Age in New Pine Creek is 30.3 Years.
What is the Average Family Size in New Pine Creek
Average Family Size in New Pine Creek is 4.7 People.
What is the Average Household Size in New Pine Creek
Average Household Size in New Pine Creek is 4.7 People.
How Large is the Labor Force in New Pine Creek?
There are 17 People in the Labor Forcein in New Pine Creek.
What is the Percentage of People in the Labor Force in New Pine Creek?
40.5% of People are in the Labor Force in New Pine Creek.
Report Title
Report Link
HTML Copy & Paste Link
Social Media
Copy and paste the folowing code into any webpage where you would like this interactive chart to display